gis in public transportation conference (september 14, 2011)
DESCRIPTION
Census Transportation Planning Products Program Penelope Weinberger CTPP Program Manager - AASHTO. GIS in Public Transportation Conference (September 14, 2011). What is the CTPP Program?. - PowerPoint PPT PresentationTRANSCRIPT
Census Transportation Planning Products Program
Penelope Weinberger CTPP Program Manager - AASHTO
GIS in Public Transportation Conference(September 14, 2011)
1
What is the CTPP Program?
The CTPP is an umbrella program of data products, custom tabulations, training, technical assistance, and research for the transportation community. CTPP uses American Community Survey (ACS) data from U.S. Census Bureau.
WARNING! Decennial Census has no Long Form –
There is No JTW data in Decennial Census!
2
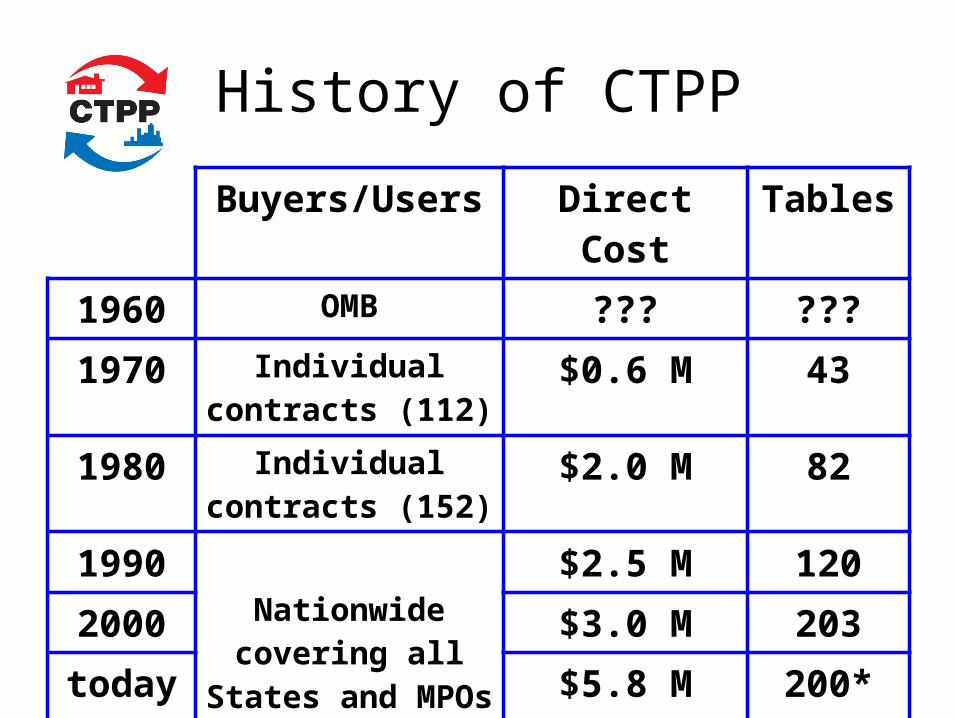
History of CTPP
Buyers/Users Direct Cost Tables
1960 OMB ??? ???1970 Individual
contracts (112)$0.6 M 43
1980 Individual contracts (152)
$2.0 M 82
1990Nationwide
covering all States and MPOs
$2.5 M 1202000 $3.0 M 203today $5.8 M 200*
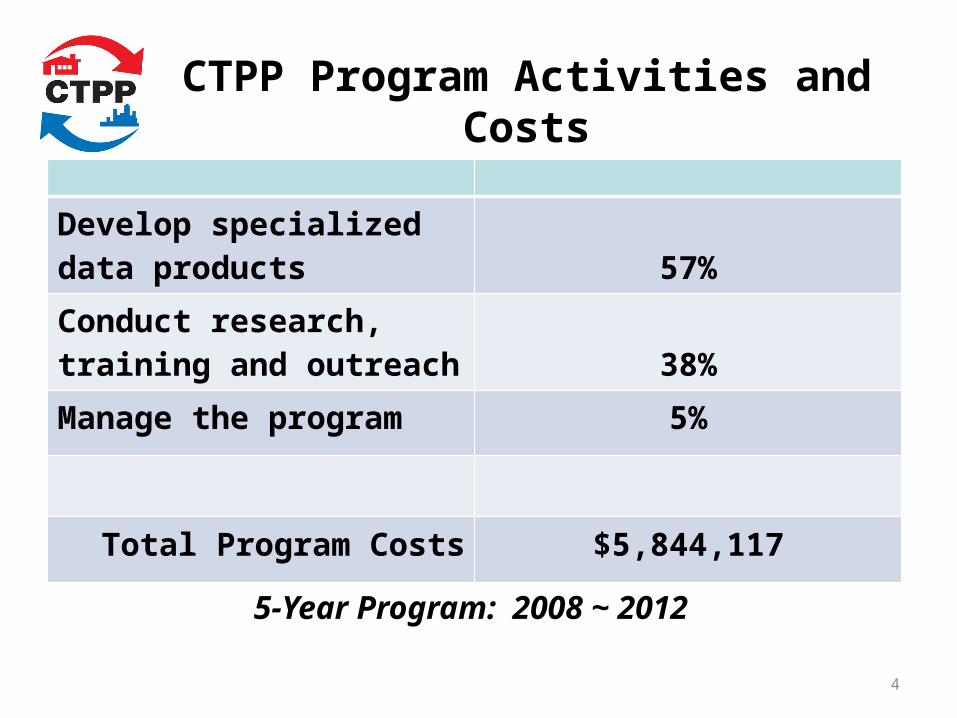
CTPP Program Activities and Costs
Develop specialized data products 57%
Conduct research, training and outreach 38%
Manage the program 5%
Total Program Costs $5,844,117
5-Year Program: 2008 ~ 2012
4
Research
• NCHRP 8-79– Producing Transportation Data Products from the American
Community Survey That Comply with Disclosure Rules
• Using Census Data for Transportation Applications Conference
• Commuting in America• NCHRP 8-36
– Enhancing the American Community Survey Data as a source for Home-to-Work Flows: ACS LEHD Comparisons”–
– Improving Home-to-Work and Employment Data for Transportation Planning
Training and Outreach
• Six Webinars• E-Learning• Site Visits• Conference Workshops and Presentations• Technical Assistance• Software help• CTPP Status Report
Data Products
• Archival Data• Profiles• 3 year tabulations• 5 year tabulations• Census transportation Analysis Zones and
Districts (TAZ/TAD)• Workplace Allocation
Quick Overview of ACS
• Period Estimate, not Point in Time• ~ 1 in 9 sample for 5-year data• Household based• Collected monthly and accumulated• One year
– Data released for areas 65,000 or greater• Three Year
– Data released for areas 20,000 or greater• Five Year
– Data released for All Geographies• Subject to Disclosure Rules, of course
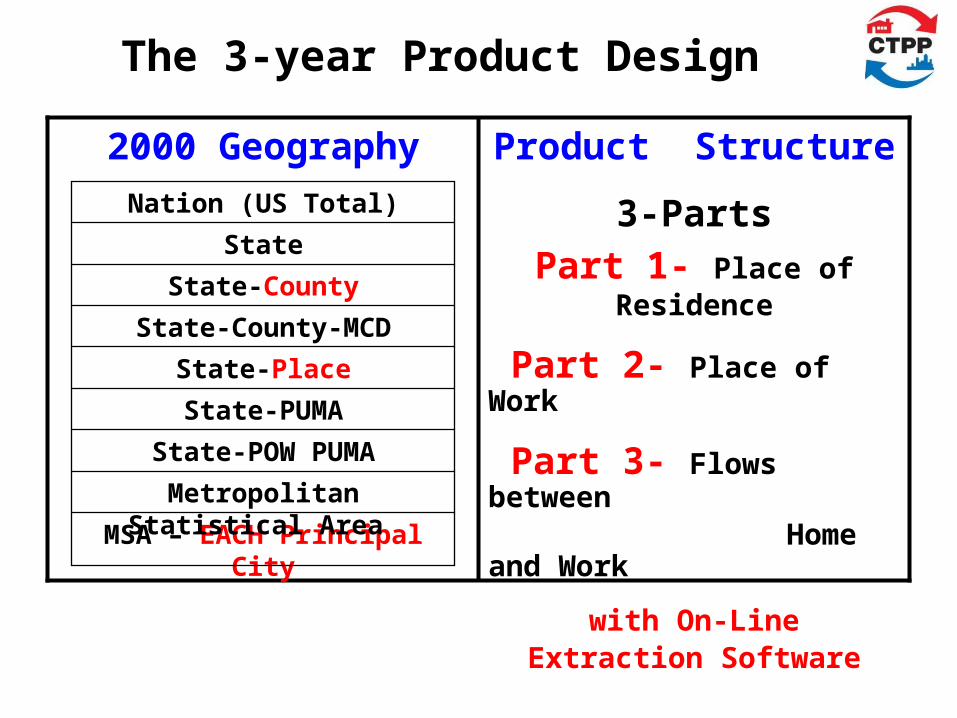
The 3-year Product Design
2000 Geography
MSA – EACH Principal City
Metropolitan Statistical Area
State-POW PUMA
State-PUMA
State-Place
State-County-MCD
State-County
Nation (US Total)
Product Structure
3-Parts
Part 1- Place of Residence
Part 2- Place of Work
Part 3- Flows between Home and Work
with On-Line Extraction Software
State
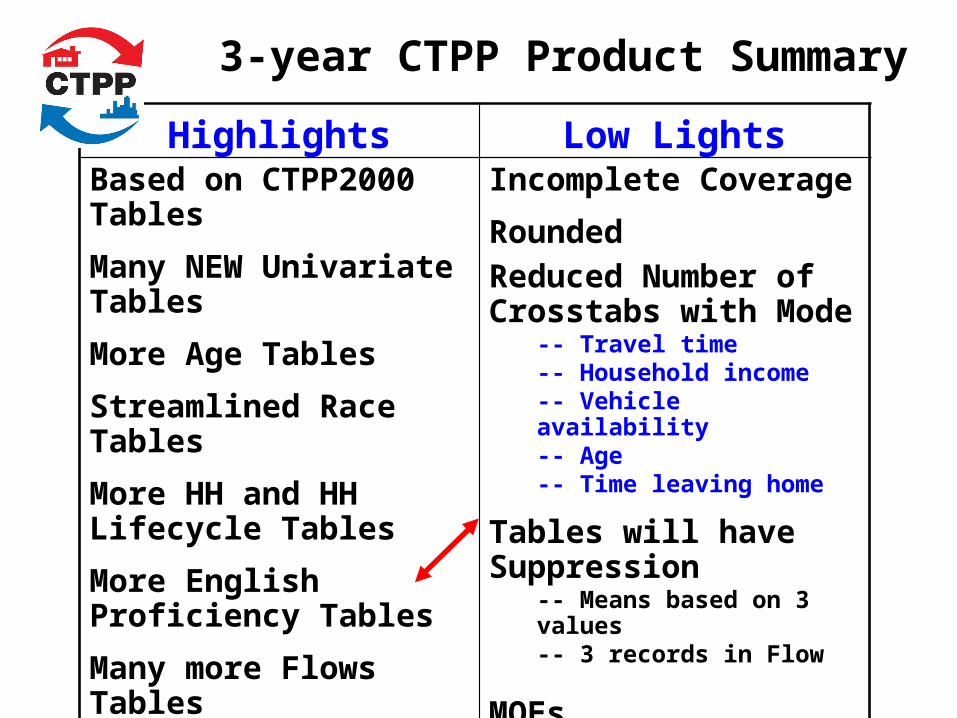
3-year CTPP Product Summary
Highlights Low LightsBased on CTPP2000 TablesMany NEW Univariate TablesMore Age TablesStreamlined Race TablesMore HH and HH Lifecycle TablesMore English Proficiency TablesMany more Flows TablesMOEs
Incomplete CoverageRoundedReduced Number of Crosstabs with Mode
-- Travel time-- Household income-- Vehicle availability-- Age-- Time leaving home
Tables will have Suppression
-- Means based on 3 values -- 3 records in Flow
MOEs
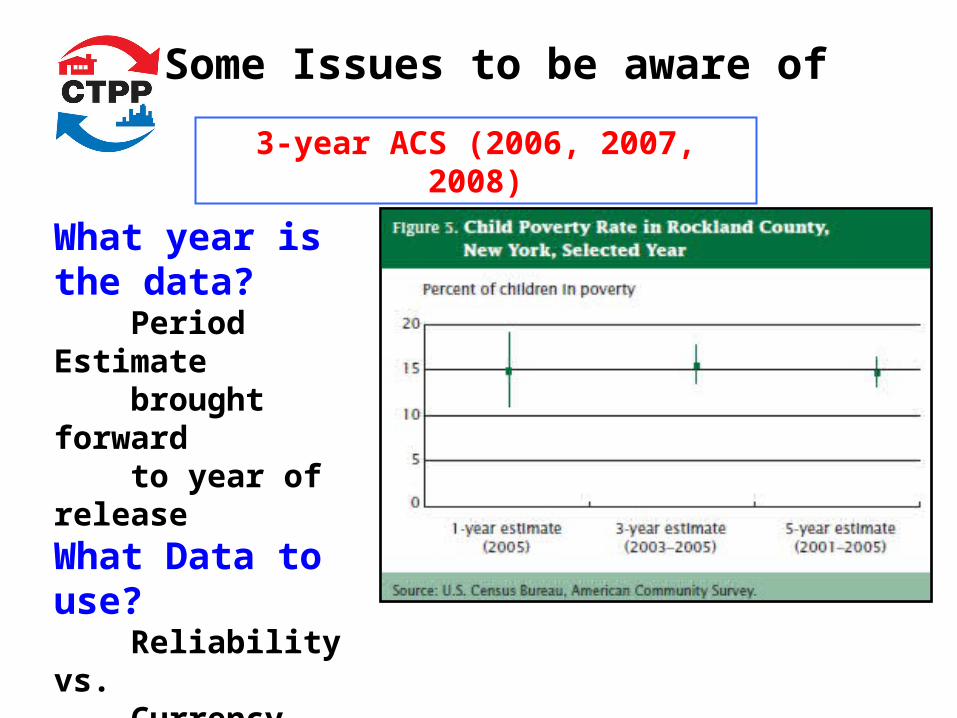
Some Issues to be aware of
What year is the data? Period Estimate brought forward to year of releaseWhat Data to use? Reliability vs. Currency
3-year ACS (2006, 2007, 2008)
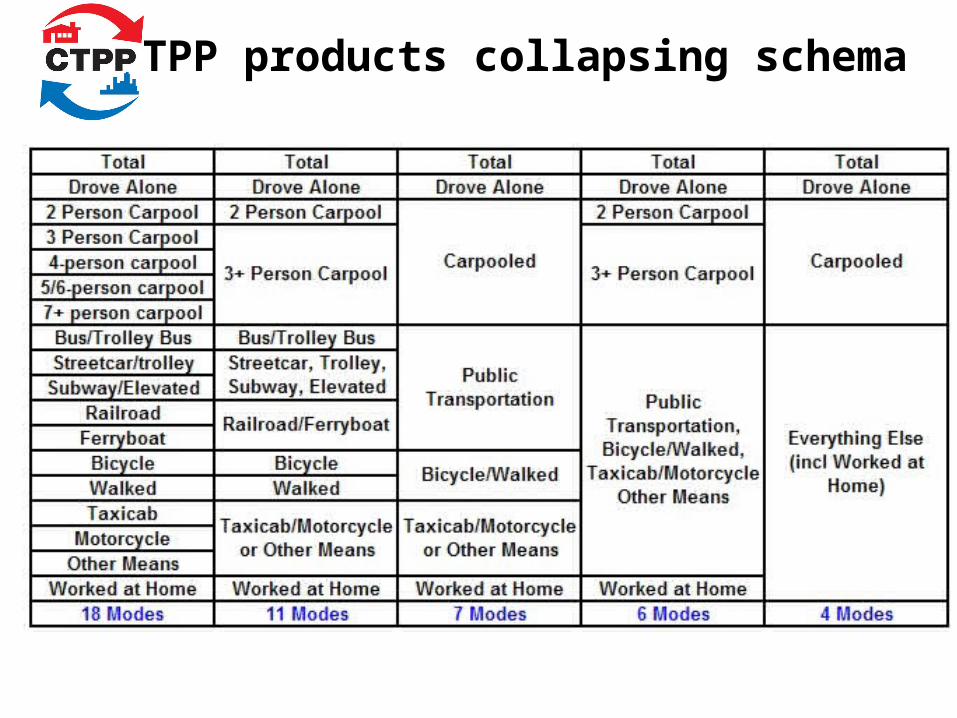
CTPP products collapsing schema
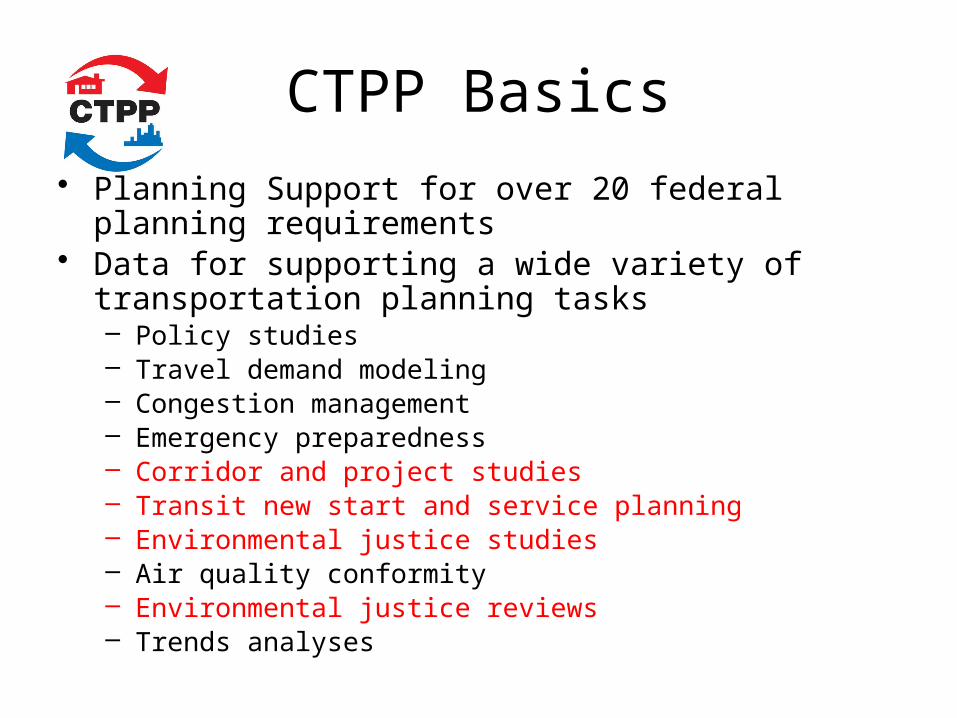
CTPP Basics
• Planning Support for over 20 federal planning requirements
• Data for supporting a wide variety of transportation planning tasks – Policy studies– Travel demand modeling– Congestion management– Emergency preparedness– Corridor and project studies– Transit new start and service planning– Environmental justice studies– Air quality conformity – Environmental justice reviews– Trends analyses
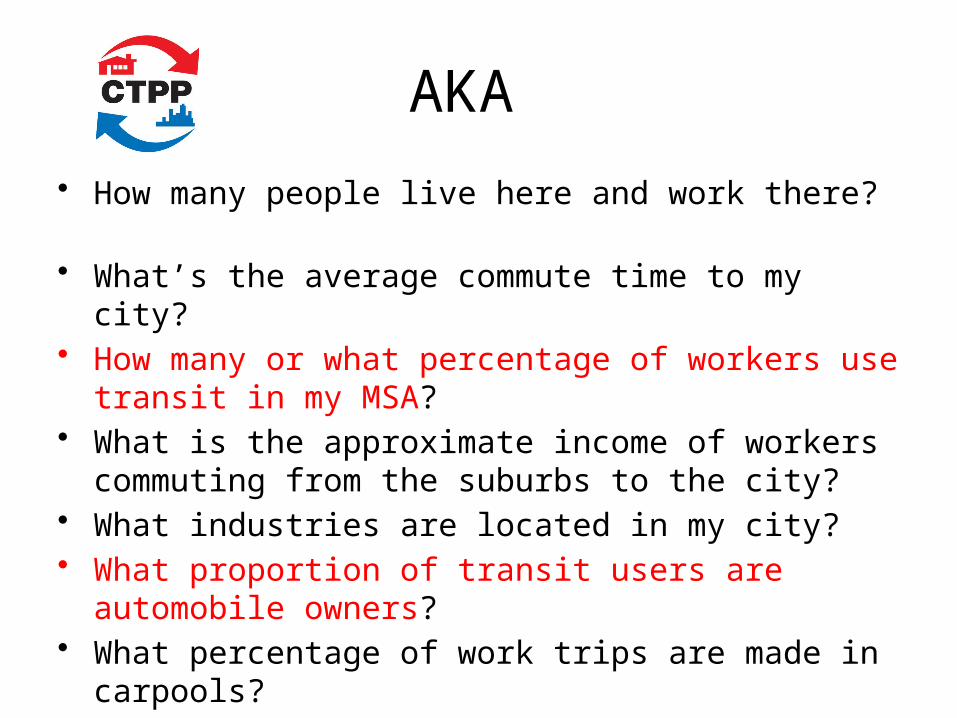
AKA
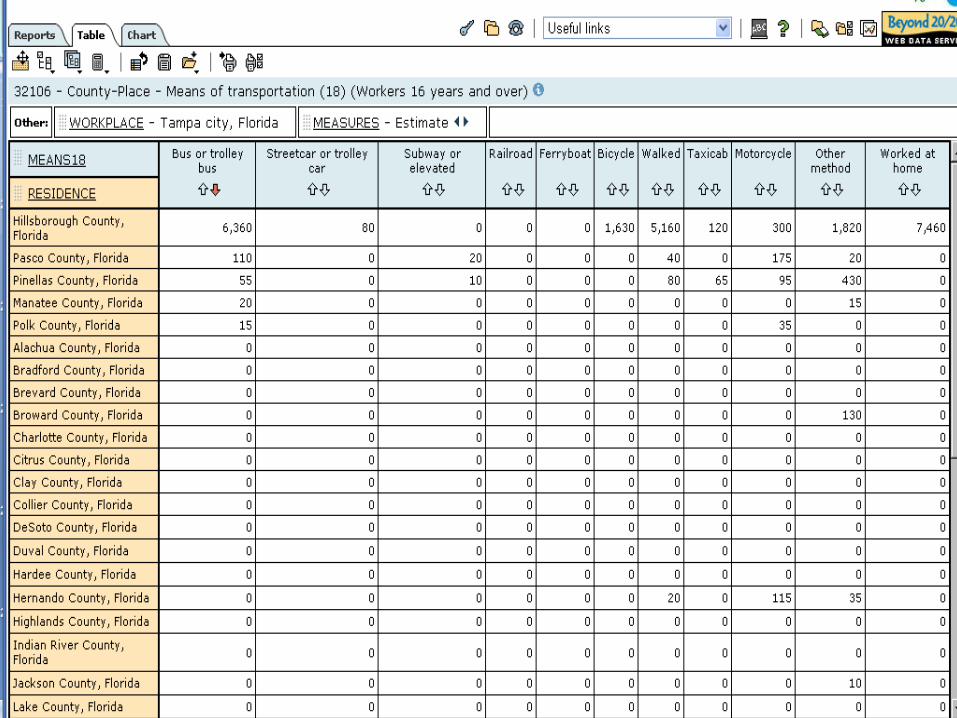
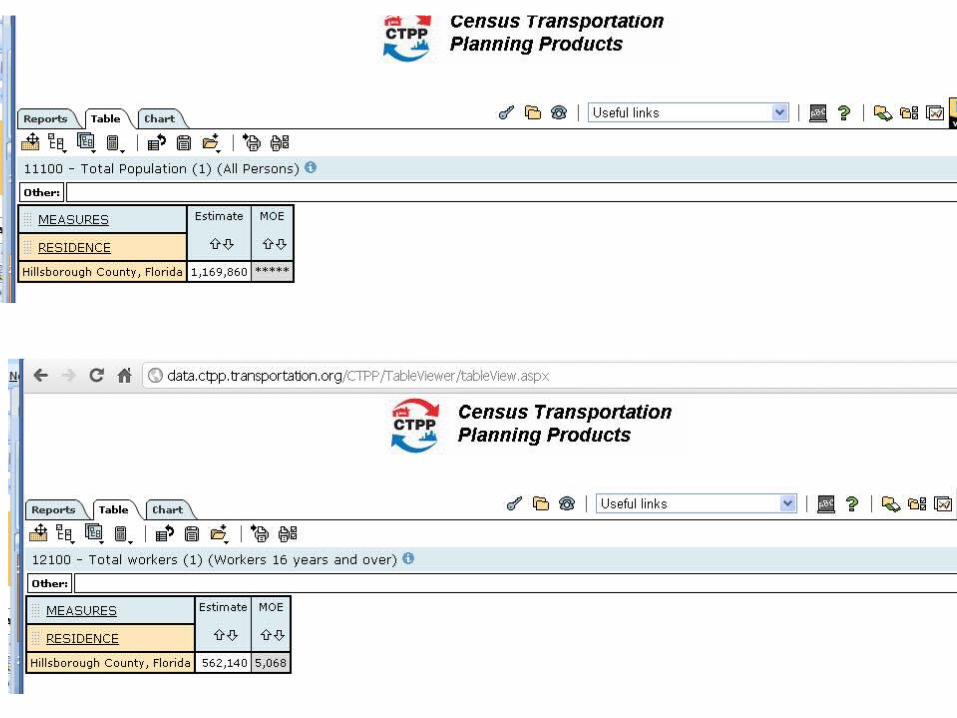
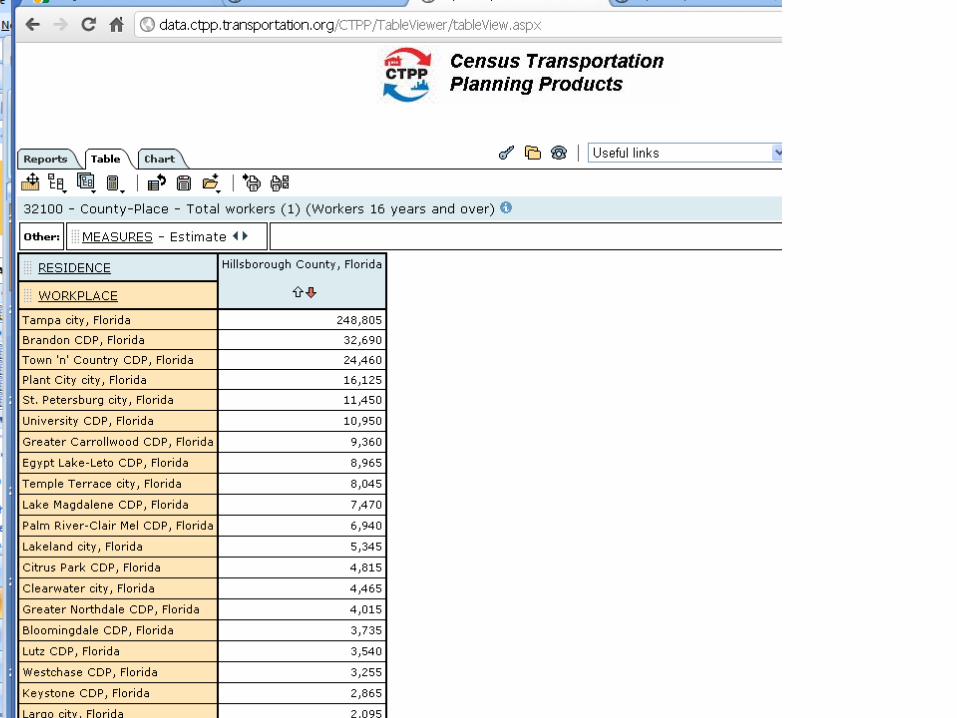
• How many people live here and work there? • What’s the average commute time to my city? • How many or what percentage of workers use transit in
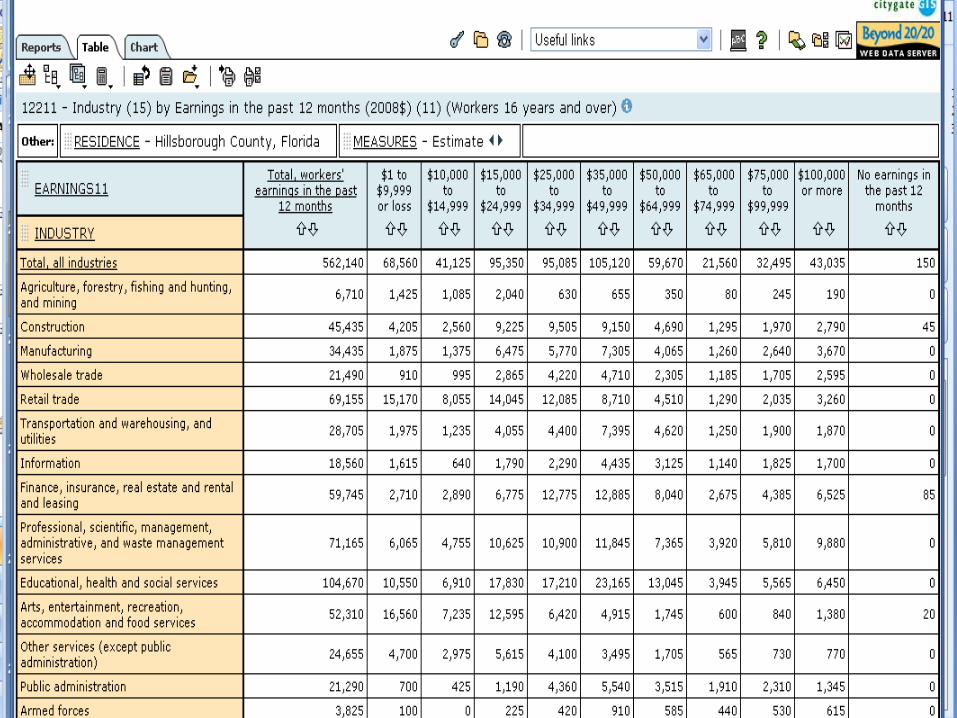
my MSA? • What is the approximate income of workers commuting
from the suburbs to the city? • What industries are located in my city? • What proportion of transit users are automobile owners?• What percentage of work trips are made in carpools?• What proportion of people telecommute?
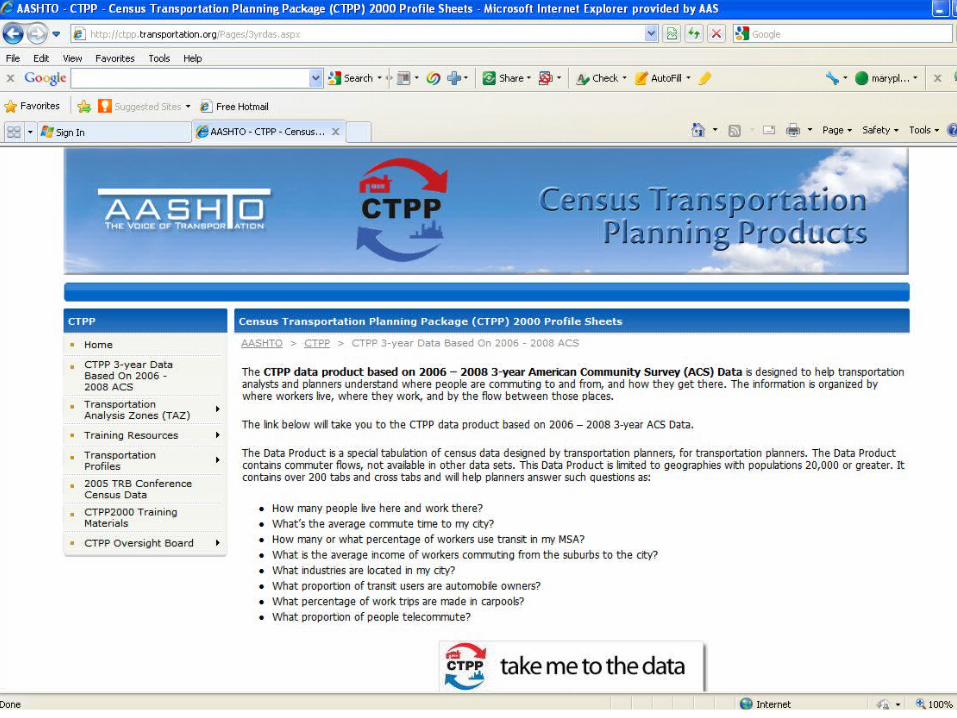
Accessing the 3-year data
• Available on the web– Free to use, but you do need to register– Online help and tutorials
http://ctpp.transportation.org/Pages/3yrdas.aspx
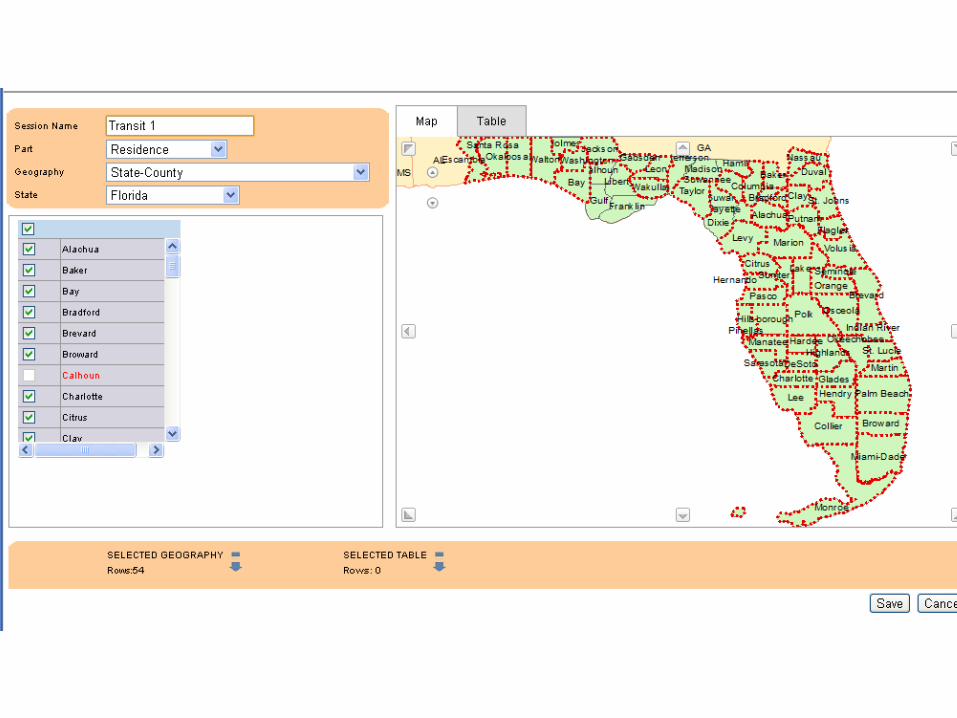
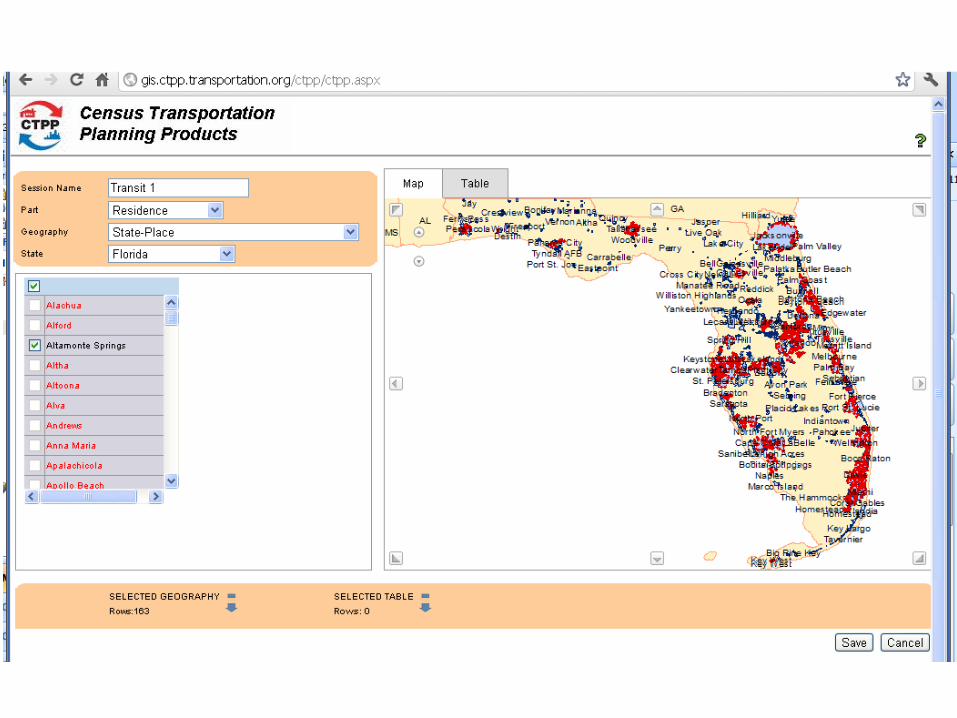
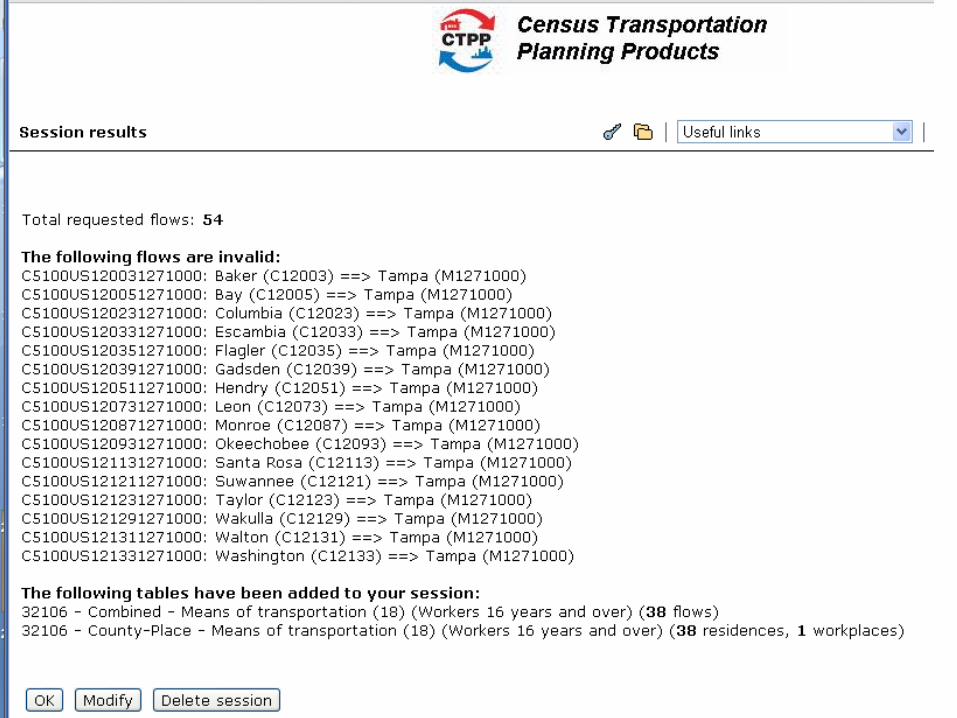
Accessing and viewing the data
• Create sessions, which are groups of tables with a common geography selection– Select geography using a map and/or drill down through the
geographic hierarchy
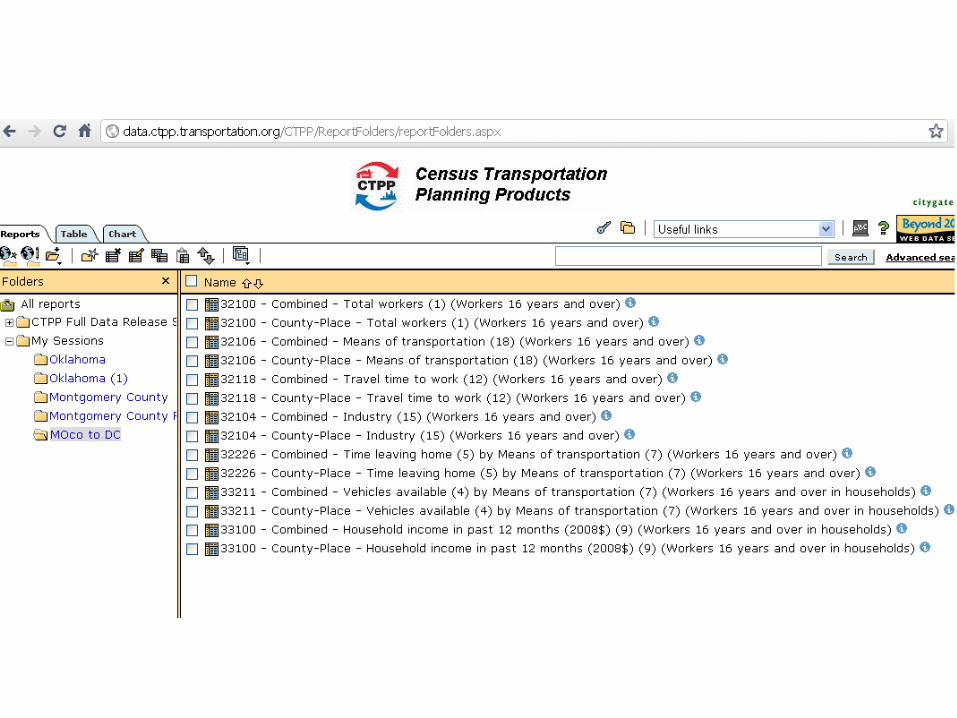
• Search for tables by dimension name or any relevant word– Either within one of the parts or across all parts
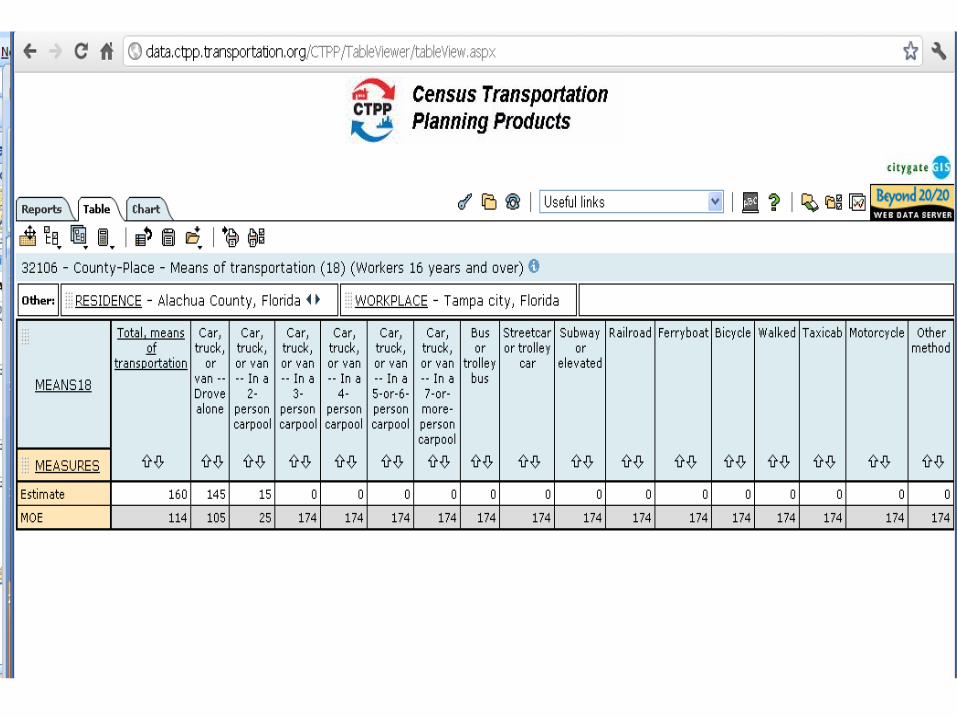
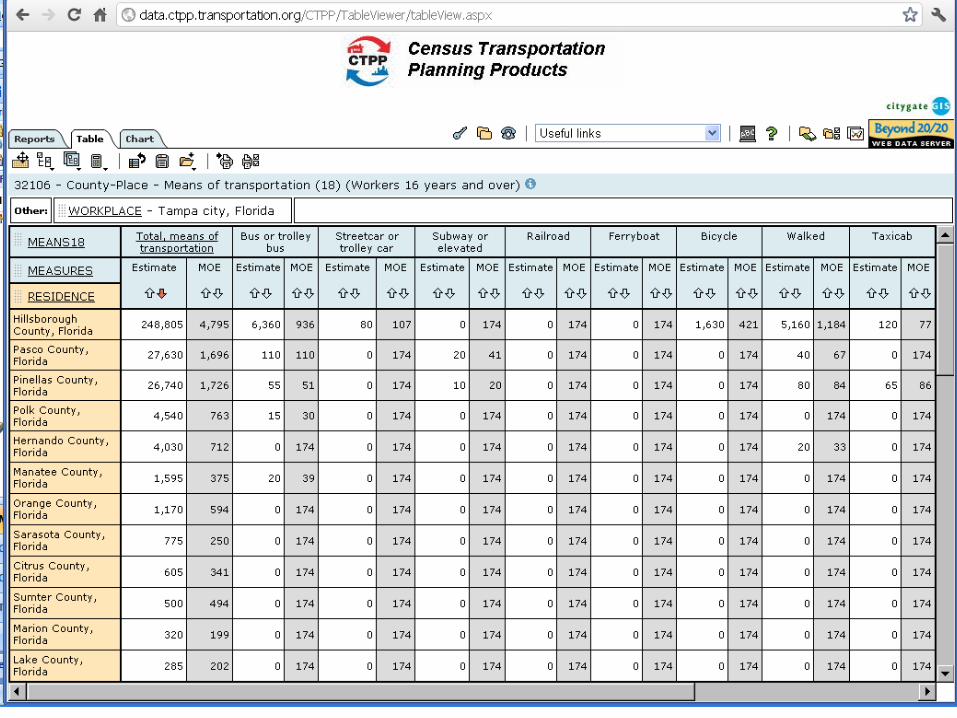
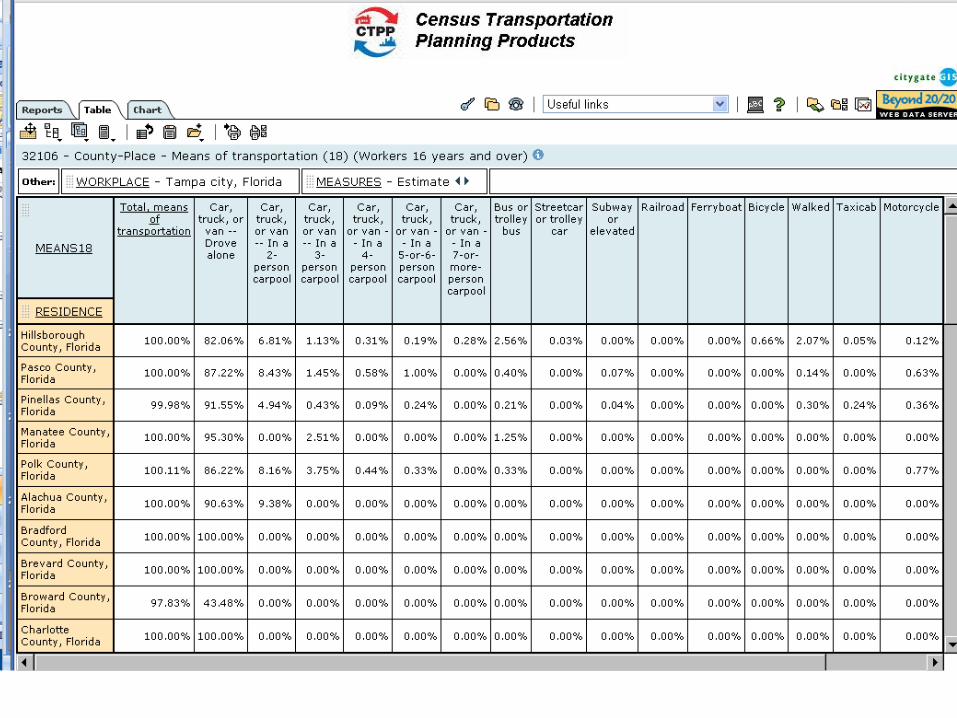
• Open any table, either in your “session” or from the public view.
• Customize your view of the data:– Rearrange and make selections on dimensions– View charts– Aggregate items using standard functions or provide a formula– Save your report for future use– Save your selections and aggregations for use in other tables
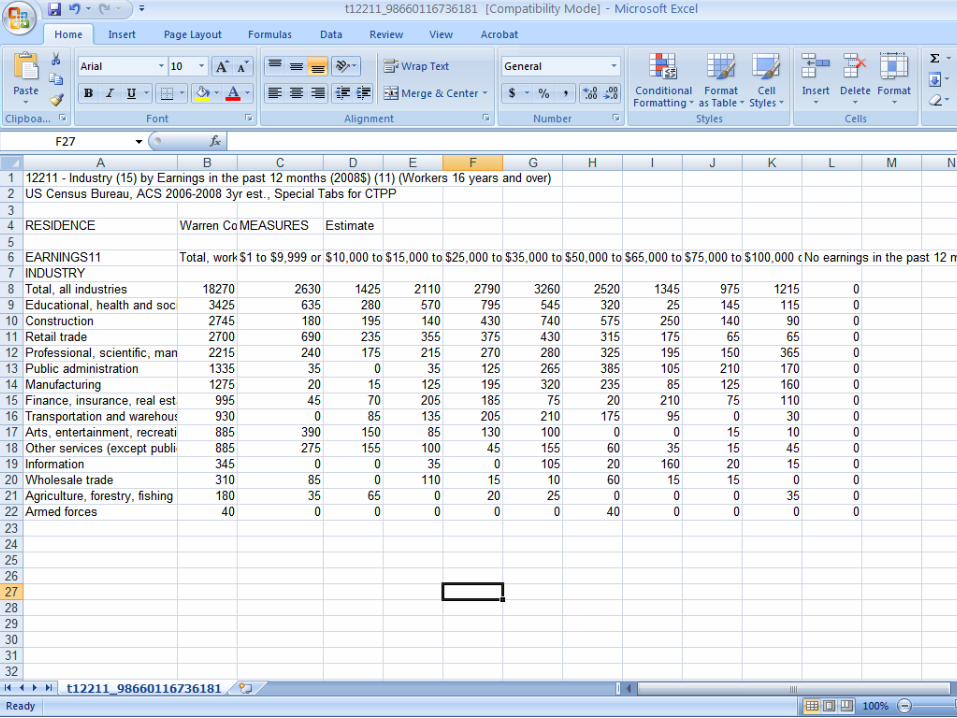
Exporting the Data
• Once you have set up the table you want to see, you can export it:
– Export the data in CSV, XLS or Beyond 20/20 (IVT) format for use in your own analysis tools
– Export SHP files for viewing maps in your own GIS engine
• Entire sessions can be exported in a single operation.
Resources
• CTPP at AASHTO:http://ctpp.transportation.org/Pages/default.aspx
• CTPP at FHWA:
http://www.fhwa.dot.gov/ctpp/• Ed the Fed
http://www.edthefed.com/ • TRB Census Data Subcommittee
http://www.trbcensus.com/