gis solutions for dredging and subsurface...
TRANSCRIPT
12
th Esri India User Conference 2011
GIS solutions for dredging and subsurface mapping
GIS Analyst
Infrastructure house, Shrimali Society, Beside shikhar complex,
Nr Mithakhali
Abstract: A geographic information system with specialized
applications was developed to provide baseline
information for regions including hydrographic,
topographic, subsurface information, shoreline position,
dredging records and other regional utilities, infrastructure,
and land use information. Customized GIS applications
were developed for planning and estimation of cost and
time required for a project. The GIS also incorporated
existing technology with regards to numerical models and
tools. It works as a decision making tool for d
planners.
Dredging planning is based on the behavior
subsurface soil. Borelog survey plays an important role in
dredging planning. Borelog information helps
type of dredger, rock cutters required, depth of cut and so
many other factors. Depth of cut of material is dependent
upon N value or SPT value of soil.
In the port planning, dredging is used for reclaimation of
land. Ground survey and bathymetry survey is important
after certain time interval for sedimentation analysis. GIS is
used as tool for 3 D modeling, spatial database
management , Visualization of temporal data, Production,
Cost and time estimation and for dredging planning.
GIS provides an interface to hydrographic, topographic,
historic dredge material data for a region and as well as
custom application designed to facilitate engineering
analysis. To date, development of Dredging Planning and
Estimation tool has included: input of spatial data for
dredging database management through DPRs(daily
progress reports) , Borelog and bathymetry data from
survey, use of a Arc Info and built-in tools for data
management and better visualization and display, creation
of custom application to extend the utility of Arc GIS for
required goals. This paper will give you an overview of how
one can use GIS in dredging application for data
management, dredging planning production analysis, time
and cost estimation.
Page 1 of 10
GIS solutions for dredging and subsurface mapping
Ms. Swati Singh
GIS Analyst, PMC Projects, Adani Group Infrastructure house, Shrimali Society, Beside shikhar complex,
six roads, Navrangpura, Ahmedabad-380009
A geographic information system with specialized
applications was developed to provide baseline
information for regions including hydrographic,
topographic, subsurface information, shoreline position,
dredging records and other regional utilities, infrastructure,
and land use information. Customized GIS applications
were developed for planning and estimation of cost and
The GIS also incorporated
rds to numerical models and
tools. It works as a decision making tool for dredging
behavior and type of
orelog survey plays an important role in
dredging planning. Borelog information helps to decide the
rock cutters required, depth of cut and so
many other factors. Depth of cut of material is dependent
used for reclaimation of
metry survey is important
after certain time interval for sedimentation analysis. GIS is
, spatial database
management , Visualization of temporal data, Production,
Cost and time estimation and for dredging planning.
ides an interface to hydrographic, topographic,
historic dredge material data for a region and as well as
custom application designed to facilitate engineering
development of Dredging Planning and
patial data for
dredging database management through DPRs(daily
progress reports) , Borelog and bathymetry data from
in tools for data
management and better visualization and display, creation
tend the utility of Arc GIS for
required goals. This paper will give you an overview of how
can use GIS in dredging application for data
management, dredging planning production analysis, time
About the Author:
Ms. Swati Singh,
Masters in Geology & Geoinformatics
E mail ID: [email protected]
Contact No: 09099938583
Masters in Geology & Geoinformatics

12
th Esri India User Conference 2011
Introduction
Dredging is a method of excavation in which the soil is removed from the sea bottom and is transported over water. For dredgi
activity, the subsurface information of ground to be dredged and the selection of the correct equipment play a vital role. Th
selection of appropriate dredger depends upon various factors viz. the type of soil to be dredged, the depth of dredging, the
quantity of dredged material, relocation of the dredged material at the needful place, etc. In accessing the dredging costs,
important that appropriate dredger is used for each type of soil to provide better productivity at optimised cost.
information is used to generate subsurface strata through the interpolation methods using TIN.
visualization of the subsurface which helps in analysing and providing better and detailed idea about the location.
Dredging information and management system (DIMS) provides dredger details, daily work progress, production information and
fuel consumption of every dredger that is working onsite. It works as a decision making tool for dredging planners. On the basis
of past records, they can estimate the cost and time of upcoming future dredging projects at the same location and under same
conditions.
For the development of DIMS, ArcGIS desktop has been used.
analyst, data management tool which are used for DIMS. For production analysis and dredging planning we have customised
tools in ArcGIS application.
Spatial Data Input
Spatial data that are currently included in the DIMS includes
1) Borehole data- Borelog survey records are required as input for the DIMS. The mapping of Borelog requires Borelog
database. A dataset must be interpolated on the basi
surface.
2) Hydrographic and Topographic survey data-
analyse changes in sea before and after dredging. Single beam an
Differential Global Positioning System (DGPS) data is used for topographic and ground level survey.
3) Satellite images- Geo-eye high resolution satellite images are used for mapping. These images are
projected.
4) Dredging Records-Daily dredging reports are collected from site that includes the dredger activity, production report, fuel
consumption and information about location.
5) IHC Reports- IHC Merwede provides solutions for optimum us
standard charts for certain conditions for different type of dredgers like IHC 6518, IHC 6525 and so on.
6) Landuse- With the help of high resolution satellite images and ground survey, land use featu
project the area that should be cut and filled. It also helps in laying path of floating and shore pipeline and so on.
Database Creation, Mapping and Display Using ArcGIS:
This section outlines the use of built in ArcGIS func
used in geo-database creation and data manipulation
Page 2 of 10
Dredging is a method of excavation in which the soil is removed from the sea bottom and is transported over water. For dredgi
activity, the subsurface information of ground to be dredged and the selection of the correct equipment play a vital role. Th
election of appropriate dredger depends upon various factors viz. the type of soil to be dredged, the depth of dredging, the
quantity of dredged material, relocation of the dredged material at the needful place, etc. In accessing the dredging costs,
important that appropriate dredger is used for each type of soil to provide better productivity at optimised cost.
information is used to generate subsurface strata through the interpolation methods using TIN. GIS helps in 2D and 3D
f the subsurface which helps in analysing and providing better and detailed idea about the location.
Dredging information and management system (DIMS) provides dredger details, daily work progress, production information and
dredger that is working onsite. It works as a decision making tool for dredging planners. On the basis
of past records, they can estimate the cost and time of upcoming future dredging projects at the same location and under same
desktop has been used. ArcGIS provides various in-built tools like 3D analyst, tracking
analyst, data management tool which are used for DIMS. For production analysis and dredging planning we have customised
Spatial data that are currently included in the DIMS includes:
Borelog survey records are required as input for the DIMS. The mapping of Borelog requires Borelog
database. A dataset must be interpolated on the basis of borelog information using TIN (triangular irregular network)
Hydrographic and bathymetry data is required at regular time intervals to
analyse changes in sea before and after dredging. Single beam and multi-beam hydrographic instruments are used for it.
Differential Global Positioning System (DGPS) data is used for topographic and ground level survey.
eye high resolution satellite images are used for mapping. These images are geo
Daily dredging reports are collected from site that includes the dredger activity, production report, fuel
consumption and information about location.
IHC Merwede provides solutions for optimum use of dredging equipment against minimum costs. It provides
standard charts for certain conditions for different type of dredgers like IHC 6518, IHC 6525 and so on.
With the help of high resolution satellite images and ground survey, land use features are captured. It helps to
project the area that should be cut and filled. It also helps in laying path of floating and shore pipeline and so on.
Database Creation, Mapping and Display Using ArcGIS:
functionality for subsurface and dredging mapping. ArcGIS and its extension is
database creation and data manipulation.
Dredging is a method of excavation in which the soil is removed from the sea bottom and is transported over water. For dredging
activity, the subsurface information of ground to be dredged and the selection of the correct equipment play a vital role. The
election of appropriate dredger depends upon various factors viz. the type of soil to be dredged, the depth of dredging, the
quantity of dredged material, relocation of the dredged material at the needful place, etc. In accessing the dredging costs, it is
important that appropriate dredger is used for each type of soil to provide better productivity at optimised cost. Borelog
GIS helps in 2D and 3D
f the subsurface which helps in analysing and providing better and detailed idea about the location.
Dredging information and management system (DIMS) provides dredger details, daily work progress, production information and
dredger that is working onsite. It works as a decision making tool for dredging planners. On the basis
of past records, they can estimate the cost and time of upcoming future dredging projects at the same location and under same
built tools like 3D analyst, tracking
analyst, data management tool which are used for DIMS. For production analysis and dredging planning we have customised
Borelog survey records are required as input for the DIMS. The mapping of Borelog requires Borelog
(triangular irregular network)
Hydrographic and bathymetry data is required at regular time intervals to
beam hydrographic instruments are used for it.
geo-referenced and
Daily dredging reports are collected from site that includes the dredger activity, production report, fuel
e of dredging equipment against minimum costs. It provides
standard charts for certain conditions for different type of dredgers like IHC 6518, IHC 6525 and so on.
res are captured. It helps to
project the area that should be cut and filled. It also helps in laying path of floating and shore pipeline and so on.
and its extension is

12
th Esri India User Conference 2011
Subsurface Mapping– Subsurface mapping is based on borelog data and borelog mapping. The borelog mapping is performed in
two steps. The first step is the database creation and second is the display of data in desired form. Thereafter, Borelog data
captured from ground survey and uploaded on geo
understanding, borelog 3Dmapping is done with the help of ArcScene.
Using interpolation method and borelog data, virtual soil surface is generated, which provides a real 3D view of the surface
present beneath the sea and provides valuable underground information. It wo
makers to decide which area to be dredged and thereby helping in optimising the project cost.
Dredging Mapping- Daily progress reports of various dredgers is collected from site on regular basis and it has been updated on
dredging geo-database. ArcGIS tracking analyst extension
planners for planning and calculating cost and time of projects.
Performed Analysis
Based on past 5 year’s experiences and records, an analysis is performed. This analysis helps in evaluating the standard
performance that can be expected from existing dredgers under varying conditions. Various factors which impact the production
level of dredgers on daily basis are incorporated in the software for better and actual approximation of the project cost and time
required henceforth. These factors are stated as follows:
• Material Type- The material type is generally classified on the basis of grain size, type and com
• Discharge Distance- Discharge distance is defined as the distance at which the dredged material is disposed. It includes
floating pipeline and shore pipeline.
• Unhindered dredging- Continuous dredging and pumping is required for hi
• Dredger Movement and depth of cut- Depth of cut and dredger movement have a great impact on the production ate of
dredgers. Depth of cut is defined as the depth of material being dredged at the designated area. With shallow depth of
cut, dredger shifting/movement increases. Thus, production per hour reduces.
• Original Condition of pump and pump parts
Hence a correction factor is incorporated on the basis of time lag
pump parts.
• Bends in pipeline (FPL & SPL)- Bends in FPL depends on the project site conditions. The number of Bends present in the
pipeline is directly proportional to the resistance to the flow of mat
choke the pipeline while passing through the bend and hence greater power and capacity is required to pump to the
discharge end.
• Geodetic Head- Geodetic head is the height of shore pipeline take
• Out of the above mentioned factors, the two that are most important and have a prominent effect on production rate
are material type and discharge distance.
Page 3 of 10
Subsurface mapping is based on borelog data and borelog mapping. The borelog mapping is performed in
steps. The first step is the database creation and second is the display of data in desired form. Thereafter, Borelog data
captured from ground survey and uploaded on geo-database. For better visualisation and to provide a better sense of
orelog 3Dmapping is done with the help of ArcScene.
Using interpolation method and borelog data, virtual soil surface is generated, which provides a real 3D view of the surface
present beneath the sea and provides valuable underground information. It works as an input for DIMS and helps decision
makers to decide which area to be dredged and thereby helping in optimising the project cost.
Daily progress reports of various dredgers is collected from site on regular basis and it has been updated on
extension helps to keep track on records of all the dredgers. It helps dredging
ning and calculating cost and time of projects.
experiences and records, an analysis is performed. This analysis helps in evaluating the standard
performance that can be expected from existing dredgers under varying conditions. Various factors which impact the production
s are incorporated in the software for better and actual approximation of the project cost and time
required henceforth. These factors are stated as follows:
The material type is generally classified on the basis of grain size, type and compactness of the material.
Discharge distance is defined as the distance at which the dredged material is disposed. It includes
Continuous dredging and pumping is required for higher production rate.
Depth of cut and dredger movement have a great impact on the production ate of
dredgers. Depth of cut is defined as the depth of material being dredged at the designated area. With shallow depth of
cut, dredger shifting/movement increases. Thus, production per hour reduces.
Original Condition of pump and pump parts- With aging of pump and pump parts, efficiency of the pump decreases.
Hence a correction factor is incorporated on the basis of time lag that is actually present because of wearing pump and
Bends in FPL depends on the project site conditions. The number of Bends present in the
pipeline is directly proportional to the resistance to the flow of material. Dredged material being a slug material, might
choke the pipeline while passing through the bend and hence greater power and capacity is required to pump to the
Geodetic head is the height of shore pipeline take-off point from water level.
Out of the above mentioned factors, the two that are most important and have a prominent effect on production rate
material type and discharge distance.
Subsurface mapping is based on borelog data and borelog mapping. The borelog mapping is performed in
steps. The first step is the database creation and second is the display of data in desired form. Thereafter, Borelog data
database. For better visualisation and to provide a better sense of
Using interpolation method and borelog data, virtual soil surface is generated, which provides a real 3D view of the surface
rks as an input for DIMS and helps decision
Daily progress reports of various dredgers is collected from site on regular basis and it has been updated on
helps to keep track on records of all the dredgers. It helps dredging
experiences and records, an analysis is performed. This analysis helps in evaluating the standard
performance that can be expected from existing dredgers under varying conditions. Various factors which impact the production
s are incorporated in the software for better and actual approximation of the project cost and time
pactness of the material.
Discharge distance is defined as the distance at which the dredged material is disposed. It includes
Depth of cut and dredger movement have a great impact on the production ate of
dredgers. Depth of cut is defined as the depth of material being dredged at the designated area. With shallow depth of
With aging of pump and pump parts, efficiency of the pump decreases.
that is actually present because of wearing pump and
Bends in FPL depends on the project site conditions. The number of Bends present in the
erial. Dredged material being a slug material, might
choke the pipeline while passing through the bend and hence greater power and capacity is required to pump to the
Out of the above mentioned factors, the two that are most important and have a prominent effect on production rate

12
th Esri India User Conference 2011
Dredge productivity
Dredge productivity can be estimated by following ways:
• By analyzing the capabilities of the dredger on current location and then comparing the performance of the same
dredger on a different site but having the same project conditions.
• By reference to similar projects in the past i.e. on the
• By combining the above mentioned factors
Theoretical Performance
Various tests are being performed by the dredge building companies to analyze the standard performance of dredgers. These
tests are performed under various ideal conditions to know and analyse the workability range of the dredgers. With our 65 series
and 75 series dredgers being IHC built, we have production graph provided by IHC.
Table 1: Ideal Conditions under which dredger graph is pre
Criteria/Parameter
Original condition of Pump & Part
Dredging Depth
Depth of Cut
Continuous dredging time
Pumping Distance
Floating Pipeline Length
No of bends in Pipeline
Geodetic Head
Page 4 of 10
following ways:
the capabilities of the dredger on current location and then comparing the performance of the same
dredger on a different site but having the same project conditions.
By reference to similar projects in the past i.e. on the basis of past records.
By combining the above mentioned factors- Using ‘extend’ references
Various tests are being performed by the dredge building companies to analyze the standard performance of dredgers. These
rmed under various ideal conditions to know and analyse the workability range of the dredgers. With our 65 series
and 75 series dredgers being IHC built, we have production graph provided by IHC.
Table 1: Ideal Conditions under which dredger graph is prepared
Standard
Newly Built dredgers are Tested
-18mCD
1.5 to 2m
4 hours continuous Dredging(without hindrance)
2000m
Not more than 500m
Only 1 bend in FPL, with not less than 45
4m
the capabilities of the dredger on current location and then comparing the performance of the same
Various tests are being performed by the dredge building companies to analyze the standard performance of dredgers. These
rmed under various ideal conditions to know and analyse the workability range of the dredgers. With our 65 series
4 hours continuous Dredging(without hindrance)
Only 1 bend in FPL, with not less than 45
12
th Esri India User Conference 2011
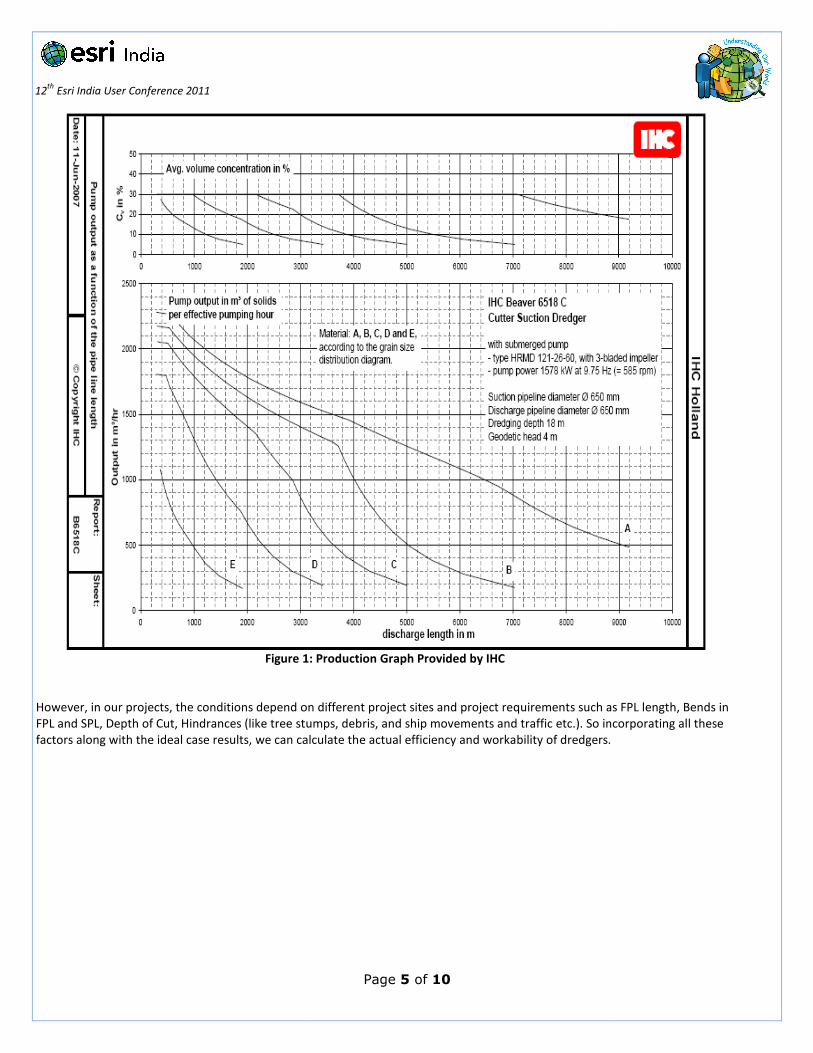
Figure 1: Production Graph Provided by IHC
However, in our projects, the conditions depend on different project sites and project
FPL and SPL, Depth of Cut, Hindrances (like tree stumps, debris, and ship movements and traffic etc.). So incorporating all t
factors along with the ideal case results, we can calculate the actual efficiency an
Page 5 of 10
Figure 1: Production Graph Provided by IHC
However, in our projects, the conditions depend on different project sites and project requirements such as FPL length, Bends in
FPL and SPL, Depth of Cut, Hindrances (like tree stumps, debris, and ship movements and traffic etc.). So incorporating all t
factors along with the ideal case results, we can calculate the actual efficiency and workability of dredgers.
requirements such as FPL length, Bends in
FPL and SPL, Depth of Cut, Hindrances (like tree stumps, debris, and ship movements and traffic etc.). So incorporating all these
d workability of dredgers.

12
th Esri India User Conference 2011
Table 2:A comparison of practical condition at our project sites with ideal conditions
Criteria/Parameter Ideal Conditions
Original condition of Pump and
Part
Dredgers are tested
pumps
Depth of Cut 1.5 to 2m
Continuous Dredging time 4 hr
Pumping Distance 2000m
Floating Pipeline Length Not more than 500m
No. Of Bends in Pipeline (Both FPL
& SPL)
Only 1 bend, with not less than 45
Geodetic Head 4m
Customized tool in ArcGIS for DIMS
GIS acts as a tool in DIMS and it designed to provide quick and fast results /output, under all the
There are two customized tools for DIMS. First being the Productivity Estimation tool. It gives the information about production
rate of a dredger with respect to the change in discharge distance. And second being the Time Estimation
how much time is required to reclaim the target area.
Productivity Estimation tool
For the customization of this tool following parameters are considered:
• Type of Dredger
• Dredger Model
• Rock Density
• Rock type
• N value of rock
• Depth of Cut
• Discharge Length
• Pumping Capacity
• No of bends
• Dredging Time
• Geodetic Head
It requires discharge distance as an input from user. Depending upon the model
Page 6 of 10
Table 2:A comparison of practical condition at our project sites with ideal conditions
Ideal Conditions Practical conditions in our projects
Dredgers are tested with new
pumps
Pump, Pump parts are used till
replacement is required, high wear
& tear
1.5 to 2m Depends on project design.
Desilting, sweeping etc. Activities
need very shallow depth of cut
(max 0.5m)
4 hr continuous dredging Frequent breakdowns, anchor
shifting, traffic, hindrance, site
constraints etc. May not allow long
periods of continuous dredging.
2000m May vary based on priorities of
dredging &reclamation as per
project requirements
Not more than 500m Generally ranges from 400 m to
1000m, based on project
requirements.
Only 1 bend, with not less than 45 Depends on traffic & movements,
site restrictions, Dredging &
reclamation plan, other project
activities (likely jetty construction
etc.)
4m Goes up to 9m
GIS acts as a tool in DIMS and it designed to provide quick and fast results /output, under all the practical conditions.
tools for DIMS. First being the Productivity Estimation tool. It gives the information about production
rate of a dredger with respect to the change in discharge distance. And second being the Time Estimation Tool. It calculates that
how much time is required to reclaim the target area.
For the customization of this tool following parameters are considered:
user. Depending upon the model it calculates the productivity rate of dredger.
Table 2:A comparison of practical condition at our project sites with ideal conditions
Practical conditions in our projects
Pump, Pump parts are used till
replacement is required, high wear
Depends on project design.
Desilting, sweeping etc. Activities
need very shallow depth of cut
Frequent breakdowns, anchor
shifting, traffic, hindrance, site
constraints etc. May not allow long
periods of continuous dredging.
May vary based on priorities of
dredging &reclamation as per
project requirements.
Generally ranges from 400 m to
1000m, based on project
Depends on traffic & movements,
site restrictions, Dredging &
reclamation plan, other project
activities (likely jetty construction
practical conditions.
tools for DIMS. First being the Productivity Estimation tool. It gives the information about production
Tool. It calculates that
it calculates the productivity rate of dredger.

12
th Esri India User Conference 2011
Time Estimation Tool
For evaluating this tool we require two inputs from user. First is the volume required to reclaim the area of interest, the volume
is indeed obtained from the ‘cut fill analysis’ and the second input is the productivity rate of the dredger that is obtained
the above mentioned productivity estimation tool.
Methodology
Currently Mundra Port has dredgers, along with off
goal is to achieve optimum dredging production and operating costs that will meet the project requirements as planned and
desired by the management.
Work Flow
Following steps are involved to get desired output from
• 3D Mapping of borelog data: Borelog data is collected and mapped 3Dimensionally to prepare grounds for performance
of subsurface mapping.
• Subsurface mapping with the help of borelog information and
Figure 2: Showing 3D Mapping of borelogs
Page 7 of 10
s tool we require two inputs from user. First is the volume required to reclaim the area of interest, the volume
is indeed obtained from the ‘cut fill analysis’ and the second input is the productivity rate of the dredger that is obtained
ntioned productivity estimation tool.
dredgers, along with off –shore support resources as well as onshore support resources. The Ultimate
goal is to achieve optimum dredging production and operating costs that will meet the project requirements as planned and
get desired output from ArcGIS:
: Borelog data is collected and mapped 3Dimensionally to prepare grounds for performance
Subsurface mapping with the help of borelog information and ArcGIS functionalities.
Figure 2: Showing 3D Mapping of borelogs,dredginglines and subsurface
s tool we require two inputs from user. First is the volume required to reclaim the area of interest, the volume
is indeed obtained from the ‘cut fill analysis’ and the second input is the productivity rate of the dredger that is obtained from
shore support resources as well as onshore support resources. The Ultimate
goal is to achieve optimum dredging production and operating costs that will meet the project requirements as planned and
: Borelog data is collected and mapped 3Dimensionally to prepare grounds for performance
and subsurface

12
th Esri India User Conference 2011
Figure 3: Showing Borelog Data W
• Dredging Material is used to raise ground level or reclamation purpose. In the project where high ground level is
required, dredging material is used for that.
• For reclamation first we require cut-fill volume of that location. It could be obtained by
Use of Productivity Estimation Tool:
Figure 4: It requires discharge distance from user as inpu
Page 8 of 10
Figure 3: Showing Borelog Data Window on Clicking the desired Borelog
is used to raise ground level or reclamation purpose. In the project where high ground level is
required, dredging material is used for that.
fill volume of that location. It could be obtained by ArcGIS built in tools
t requires discharge distance from user as input. It is a variable parameter. On the click of button it ask
for material density .
layer
is used to raise ground level or reclamation purpose. In the project where high ground level is
built in tools.
n the click of button it ask

12
th Esri India User Conference 2011
Figure 5: The output(productivity rate)
Use of Time Estimation Tool
Figure 6: The output in days i.e. 87
Page 9 of 10
: The output(productivity rate) as shown after computation to be 250 (cu. Meter /hour)
density input from the user.
i.e. 87 days that is being evaluated after providing the fill volume and production
rate
r computation to be 250 (cu. Meter /hour) after providing
fill volume and production

12
th Esri India User Conference 2011
Conclusion
It can be concluded that after preparing the database, doing cut fill analysis, choosing the pipe length for dredged material (b
onshore and off shore),dredger type and entering the density of dredged material i.e. 2200 kg/m3 here, we get the production
rate to be 250 cubic meter/hour. From this production rate we obtained the fill volume to be 313411 cubic meter and further
time estimation tool gives the value to be 87days.
This data is useful for dredger planners in computing the dredger efficiency, accuracy output and to schedule accordingly the
location of dredger at different sites after getting to know the amount of time that could be spent by a single dredge
particular location.
References
• Nil Guler, "Evaluation of port development projects by the benefit cost analysis" ,December2003.
• Report on "Understanding dredging production and cost"
• Greg Farnham "Comparative cost analysis and considerations of s
• Teresa M. Adams "GIS based Subsurface data management", November2008.
• James D. McCarthy,Phil A. Graniero ,"A GIS
system",december2006.
Page 10 of 10
can be concluded that after preparing the database, doing cut fill analysis, choosing the pipe length for dredged material (b
and entering the density of dredged material i.e. 2200 kg/m3 here, we get the production
From this production rate we obtained the fill volume to be 313411 cubic meter and further
days.
This data is useful for dredger planners in computing the dredger efficiency, accuracy output and to schedule accordingly the
location of dredger at different sites after getting to know the amount of time that could be spent by a single dredge
Nil Guler, "Evaluation of port development projects by the benefit cost analysis" ,December2003.
Report on "Understanding dredging production and cost"
Greg Farnham "Comparative cost analysis and considerations of sediment dredging", Febuary2010.
GIS based Subsurface data management", November2008.
,"A GIS-based borehole data management and 3D visualization
can be concluded that after preparing the database, doing cut fill analysis, choosing the pipe length for dredged material (both
and entering the density of dredged material i.e. 2200 kg/m3 here, we get the production
From this production rate we obtained the fill volume to be 313411 cubic meter and further
This data is useful for dredger planners in computing the dredger efficiency, accuracy output and to schedule accordingly the
location of dredger at different sites after getting to know the amount of time that could be spent by a single dredger at a
Nil Guler, "Evaluation of port development projects by the benefit cost analysis" ,December2003.
ediment dredging", Febuary2010.
based borehole data management and 3D visualization