gis solutions for environmental management -...
TRANSCRIPT
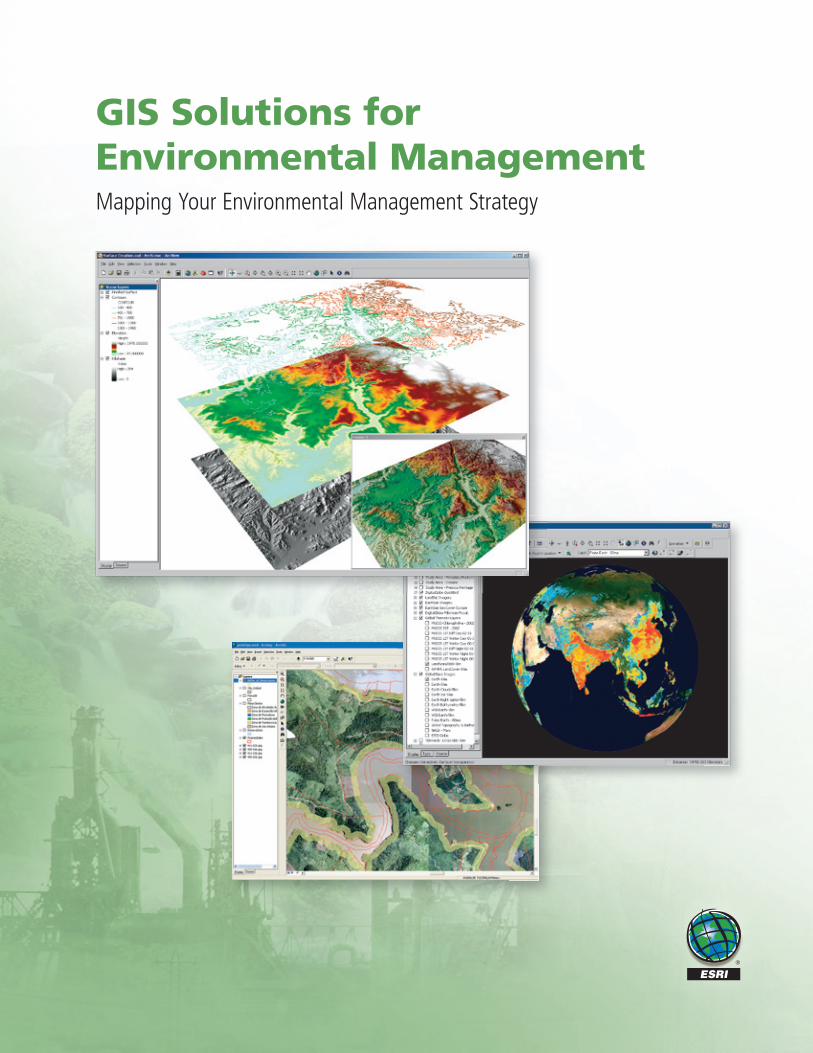
GIS Solutions forEnvironmental ManagementMapping Your Environmental Management Strategy

www.esri.com/environment
GIS Solutions for Environmental Management
Responsible and successful environmental management is neces-sary for protecting and restoring the natural environment. The interdependency of the earth’s ecosystems and the human impact on the environment present complex challenges to governments and businesses as well as scientists and environmentalists in every discipline.
Geographic information system (GIS) technology is used to support and deliver information to environmental managers and the public. GIS allows the combination and analysis of multiple layers of location-based data including environmental measurements. The environmental applica-tion areas of GIS are varied in terms of potential users, environmental spheres, and the specifi c environmental issue being investigated.
ESRI’s GIS environmental management solutions enable organizations to
• Ensure accurate reporting with improved data collection.
• Improve decision making.
• Increase productivity with streamlined work processes.
• Provide better data analysis and presentation options.
• Model dynamic environmental phenomena.
• Create predictive scenarios for environmental impact studies.
• Automate regulatory compliance processes.
• Disseminate maps and share map data across the Internet.
What Is GIS?
GIS is a powerful software technology that allows a virtually unlimited amount of information to be linked to a geo-graphic location. Coupled with a digital map, GIS allows a user to see locations, events, features, and environmental changes with unprecedented clarity, showing layer upon layer of information such as environmental trends, soil stability, pesticide use, migration corridors, hazardous waste generators, dust source points, lake remediation efforts, and at-risk water wells. Effective environmental practice considers the whole spectrum of the environment. ArcGIS® technology offers a wide variety of analytical tools to meet the needs of many people, helping them make better deci-sions about the environment.
—Land and air quality
—Vegetation and land-use type
—Population density
—Jurisdiction boundaries
—Urban development
—Land features
—Hydrographic data
www.esri.com/environment
Enterprise GIS for Environmental Management
People in the environmental management community use GIS to organize existing information and communicate that information throughout their organizations. GIS can be used as a strategic tool to automate processes, transform environmental manage-ment operations by garnering new knowledge, and support deci-sions that make a profound difference on our environment.
GIS is considered enterprise if, by design, it is part of the overall information technology architecture of the organization. ArcGIS can be integrated with most standard corporate systems such as work management, customer service, and reporting systems. Both GIS functionality and data accessing ability can be embed-ded directly into other agency applications. GIS workflow appli-cations simplify and automate procedures within environmental management operations, resulting in improved efficiency and significant time savings.
ESRI software developers and business partners work together to bring the environmental management community benefit and value from GIS. This value comes from
• Database-sharing architecture that supports decision making and daily work tasks
• Interoperable system solutions for integrated workflow and data access
• Internet mapping solutions that support interagency collabora-tion projects
• Quality control processes that ensure accurate, high-quality data
• Worker-friendly designs that increase agency-wide access and application
• Scalability that supports and adapts to growing and evolving IT demand
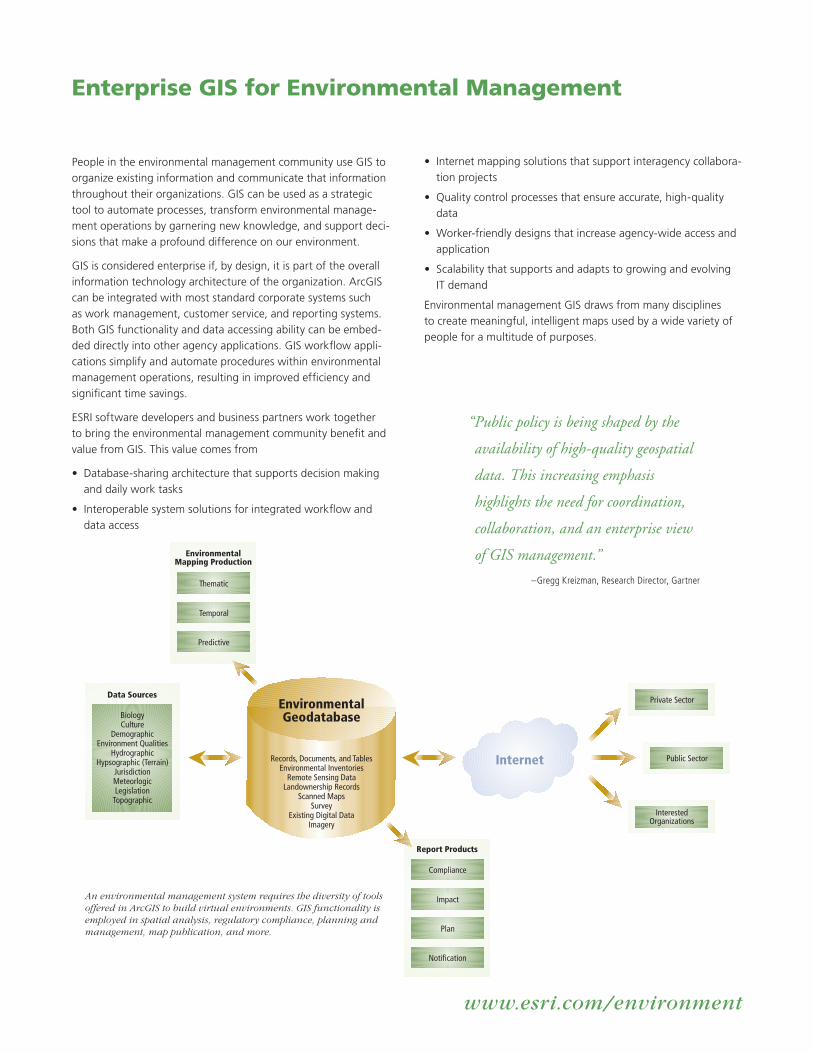
Environmental management GIS draws from many disciplines to create meaningful, intelligent maps used by a wide variety of people for a multitude of purposes.
Thematic
Temporal
Predictive
EnvironmentalMapping Production
Plan
Notification
Compliance
Impact
Report Products
Internet
Private Sector
Public Sector
InterestedOrganizations
EnvironmentalGeodatabase
Records, Documents, and TablesEnvironmental Inventories
Remote Sensing DataLandownership Records
Scanned MapsSurvey
Existing Digital DataImagery
BiologyCulture
DemographicEnvironment Qualities
HydrographicHypsographic (Terrain)
JurisdictionMeteorlogicLegislation
Topographic
Data Sources
“Public policy is being shaped by the
availability of high-quality geospatial
data. This increasing emphasis
highlights the need for coordination,
collaboration, and an enterprise view
of GIS management.”
–Gregg Kreizman, Research Director, Gartner
An environmental management system requires the diversity of tools offered in ArcGIS to build virtual environments. GIS functionality is employed in spatial analysis, regulatory compliance, planning and management, map publication, and more.
www.esri.com/environment
The New York Power Authority (NYPA) GIS-based inte-grated vegetation management (IVM) program maintains approximately 16,000 acres of right-of-way (ROW) land. The program’s principal aim is to provide the safe and reliable transmission of electric power in an economic and environmentally sensitive manner.
The enterprise-wide GIS ROW application, designed for NYPA by the URS Corporation, is linked to land management, environmen-tal, equipment maintenance, and engineering data to assist manag-ers in evaluating current vegetation conditions and prioritizing necessary maintenance. By accessing multiple geographic datasets, vegetation maintenance techniques can be selected after consider-ing various factors including delineated wetlands, landowner rights and agreements, site access, environmental regulatory compliance, security, and dangerous tree-trimming sites. The application also has a function that supports the treatment plan review process to assess management impact on the vegetation growing in the ROW.
The program incorporates a mixture of cultural, physical, biologi-cal, and chemical management practices to control targeted, higher-growing tree species. It also works to enhance the presence of more desirable lower-growth vegetation. A regular inventory and documentation of maintenance activities allow for analysis, evaluation, and continuous improvement in the overall ROW management program.
The implementation of the ROW application now means that the process of vegetation management, from scheduling treatments
to evaluating management effectiveness, is a smoother process. Field inventories are annually conducted for the rights-of-way scheduled for treatment the following year. NYPA’s forestry staff members review these inventories and their suggested treatment recommendations, accepting or modifying them as they deem necessary.
Once the actual fi eldwork begins, the treatment plan and related data are downloaded to fi eld computers for use by NYPA inspec-tors. These inspectors track the actual treatment in the fi eld and then upload the data to the central server for future use. When a ROW fi eld visit is repeated, NYPA uses the as-treated data to analyze how well the previous treatment cycle worked.
John Wingfi eld, GIS/survey manager, reports, “On the fi rst line where we had a repeated cycle, we saw a 60 percent noncom-patible vegetation reduction. Presumably, on the next cycle we will see another signifi cant reduction. Eventually, because of our IVM program, we will be using only a fraction of the herbicides and manual effort we had used in the fi rst cycle. We have already saved a signifi cant amount of money in the fi rst cycle; ultimately, we will have saved money and had an ecologically positive result.”
To learn more about the New York Power Authority’s GIS ROW application, contact Lana Khitrik of the URS Corporation at [email protected] or Dave Frazier of the URS Corpora-tion at [email protected].
Environmental GIS in the Private SectorVegetation Management Solution Case Study—New York Power Authority
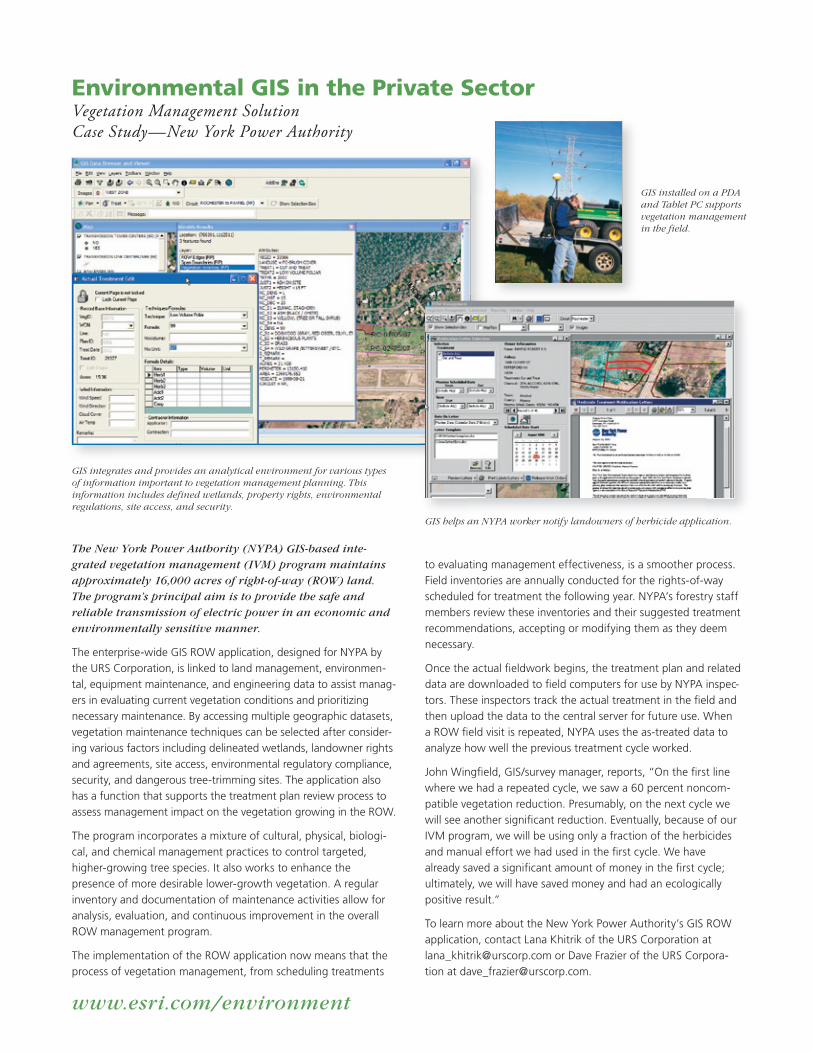
GIS integrates and provides an analytical environment for various types of information important to vegetation management planning. This information includes defined wetlands, property rights, environmental regulations, site access, and security.
GIS installed on a PDA and Tablet PC supports vegetation management in the field.
GIS helps an NYPA worker notify landowners of herbicide application.
www.esri.com/environment
GIS in the Field
Combining GIS with mobile technologies, such as GPS and automated vehicle location systems, provides environmen-tal agencies with mobile solutions that save time, focus resources, and capture accurate data.
ESRI’s Field-Based Solutions
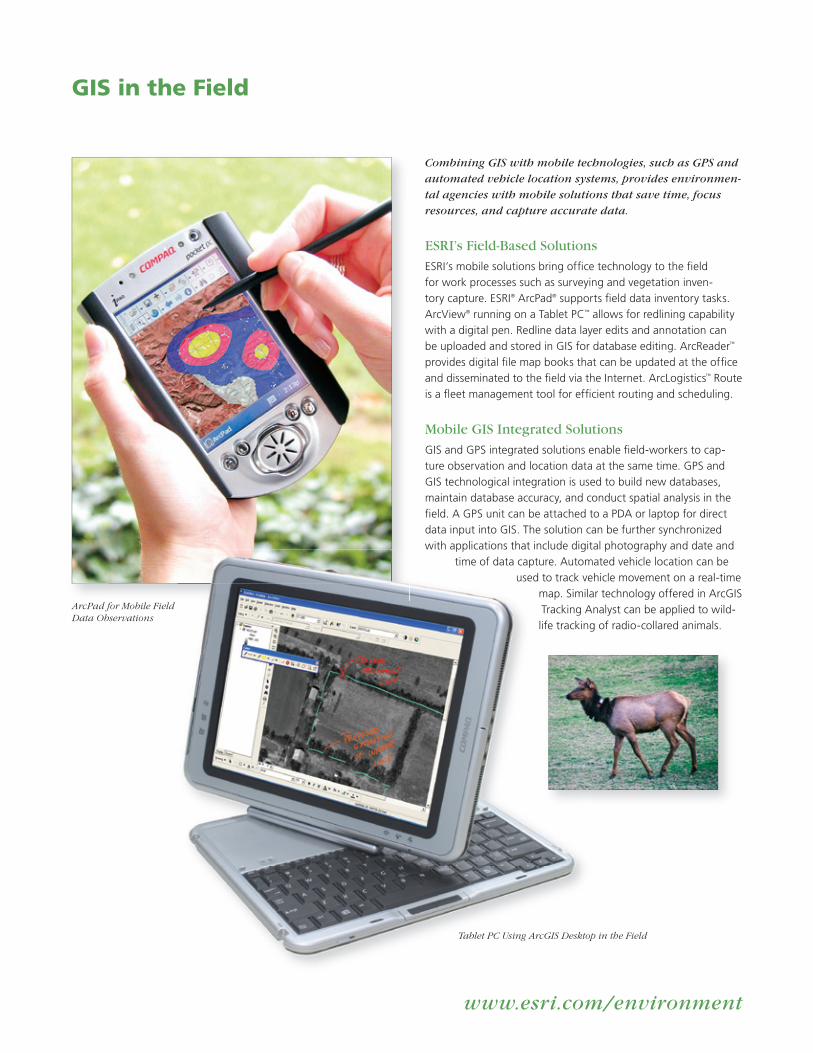
ESRI’s mobile solutions bring offi ce technology to the fi eld for work processes such as surveying and vegetation inven-tory capture. ESRI® ArcPad® supports fi eld data inventory tasks. ArcView® running on a Tablet PC™ allows for redlining capability with a digital pen. Redline data layer edits and annotation can be uploaded and stored in GIS for database editing. ArcReader™ provides digital fi le map books that can be updated at the offi ce and disseminated to the fi eld via the Internet. ArcLogistics™ Route is a fl eet management tool for effi cient routing and scheduling.
Mobile GIS Integrated Solutions
GIS and GPS integrated solutions enable fi eld-workers to cap-ture observation and location data at the same time. GPS and GIS technological integration is used to build new databases, maintain database accuracy, and conduct spatial analysis in the fi eld. A GPS unit can be attached to a PDA or laptop for direct data input into GIS. The solution can be further synchronized with applications that include digital photography and date and
time of data capture. Automated vehicle location can be used to track vehicle movement on a real-time
map. Similar technology offered in ArcGIS Tracking Analyst can be applied to wild-life tracking of radio-collared animals.
Tablet PC Using ArcGIS Desktop in the Field
ArcPad for Mobile Field Data Observations
www.esri.com/environment
Geospatial portals are the GIS component ofe-government. GIS-enabled Web portals integrate geospatial databases from different groups, making multiple databases accessible from one site. The LouisianaMAP is a GIS portal launched by the Louisiana I-Team Geospatial Information Initiative. The Louisiana Department of Environmental Quality (LDEQ) adds an environmental component to the LouisianaMAP portal (www.louisianamap.gov).
LDEQ has had a department-wide GIS in place since 1994. The GIS Center provides support to all GIS users within LDEQ and constructs maps as requested by LDEQ personnel. The center also maintains and develops GIS datasets for agency mapping requirements.
At the LouisianaMAP portal, the public can create maps, go to relevant Web site links, and read about LDEQ projects. For example, the Toxic Release Inventory, an environmental indicator, is the result of data submitted by manufacturing facilities in state reporting releases. LDEQ publishes online emission trends maps that spatially show reported air emissions data.
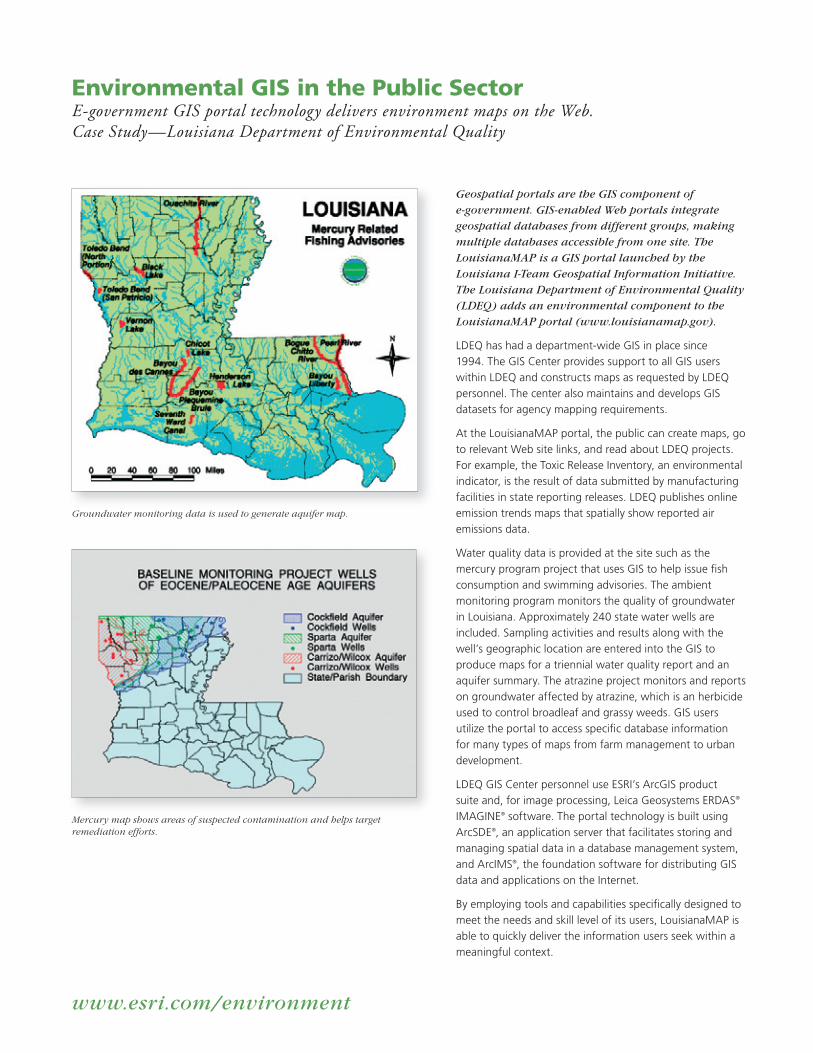
Water quality data is provided at the site such as the mercury program project that uses GIS to help issue fi sh consumption and swimming advisories. The ambient monitoring program monitors the quality of groundwater in Louisiana. Approximately 240 state water wells are included. Sampling activities and results along with the well’s geographic location are entered into the GIS to produce maps for a triennial water quality report and an aquifer summary. The atrazine project monitors and reports on groundwater affected by atrazine, which is an herbicide used to control broadleaf and grassy weeds. GIS users utilize the portal to access specifi c database information for many types of maps from farm management to urban development.
LDEQ GIS Center personnel use ESRI’s ArcGIS product suite and, for image processing, Leica Geosystems ERDAS® IMAGINE® software. The portal technology is built using ArcSDE®, an application server that facilitates storing and managing spatial data in a database management system, and ArcIMS®, the foundation software for distributing GIS data and applications on the Internet.
By employing tools and capabilities specifi cally designed to meet the needs and skill level of its users, LouisianaMAP is able to quickly deliver the information users seek within a meaningful context.
Environmental GIS in the Public SectorE-government GIS portal technology delivers environment maps on the Web.Case Study—Louisiana Department of Environmental Quality
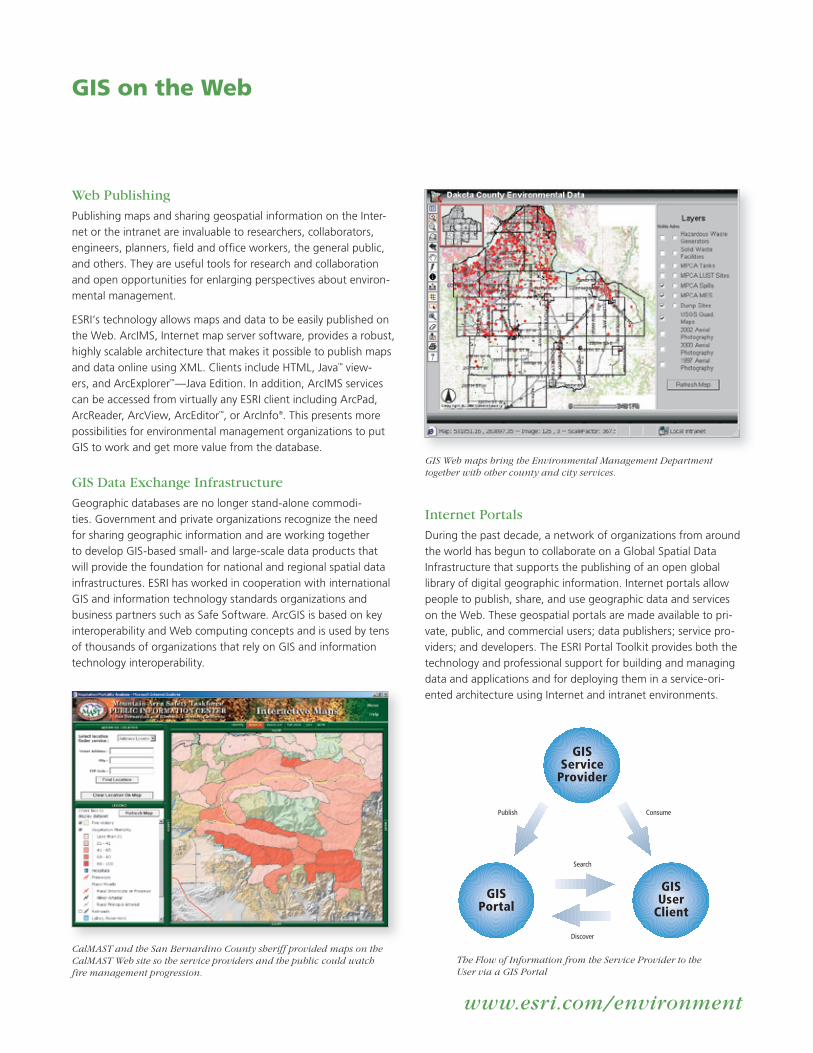
Mercury map shows areas of suspected contamination and helps target remediation efforts.
Groundwater monitoring data is used to generate aquifer map.
www.esri.com/environment
GIS on the Web
Web Publishing
Publishing maps and sharing geospatial information on the Inter-net or the intranet are invaluable to researchers, collaborators, engineers, planners, fi eld and offi ce workers, the general public, and others. They are useful tools for research and collaboration and open opportunities for enlarging perspectives about environ-mental management.
ESRI’s technology allows maps and data to be easily published on the Web. ArcIMS, Internet map server software, provides a robust, highly scalable architecture that makes it possible to publish maps and data online using XML. Clients include HTML, Java™ view-ers, and ArcExplorer™—Java Edition. In addition, ArcIMS services can be accessed from virtually any ESRI client including ArcPad, ArcReader, ArcView, ArcEditor™, or ArcInfo®. This presents more possibilities for environmental management organizations to put GIS to work and get more value from the database.
GIS Data Exchange Infrastructure
Geographic databases are no longer stand-alone commodi-ties. Government and private organizations recognize the need for sharing geographic information and are working together to develop GIS-based small- and large-scale data products that will provide the foundation for national and regional spatial data infrastructures. ESRI has worked in cooperation with international GIS and information technology standards organizations and business partners such as Safe Software. ArcGIS is based on key interoperability and Web computing concepts and is used by tens of thousands of organizations that rely on GIS and information technology interoperability.
Internet Portals
During the past decade, a network of organizations from around the world has begun to collaborate on a Global Spatial Data Infrastructure that supports the publishing of an open global library of digital geographic information. Internet portals allow people to publish, share, and use geographic data and services on the Web. These geospatial portals are made available to pri-vate, public, and commercial users; data publishers; service pro-viders; and developers. The ESRI Portal Toolkit provides both the technology and professional support for building and managing data and applications and for deploying them in a service-ori-ented architecture using Internet and intranet environments.
GISService
Provider
GISUser
ClientGIS
Portal
Publish Consume
Search
Discover
The Flow of Information from the Service Provider to the User via a GIS Portal
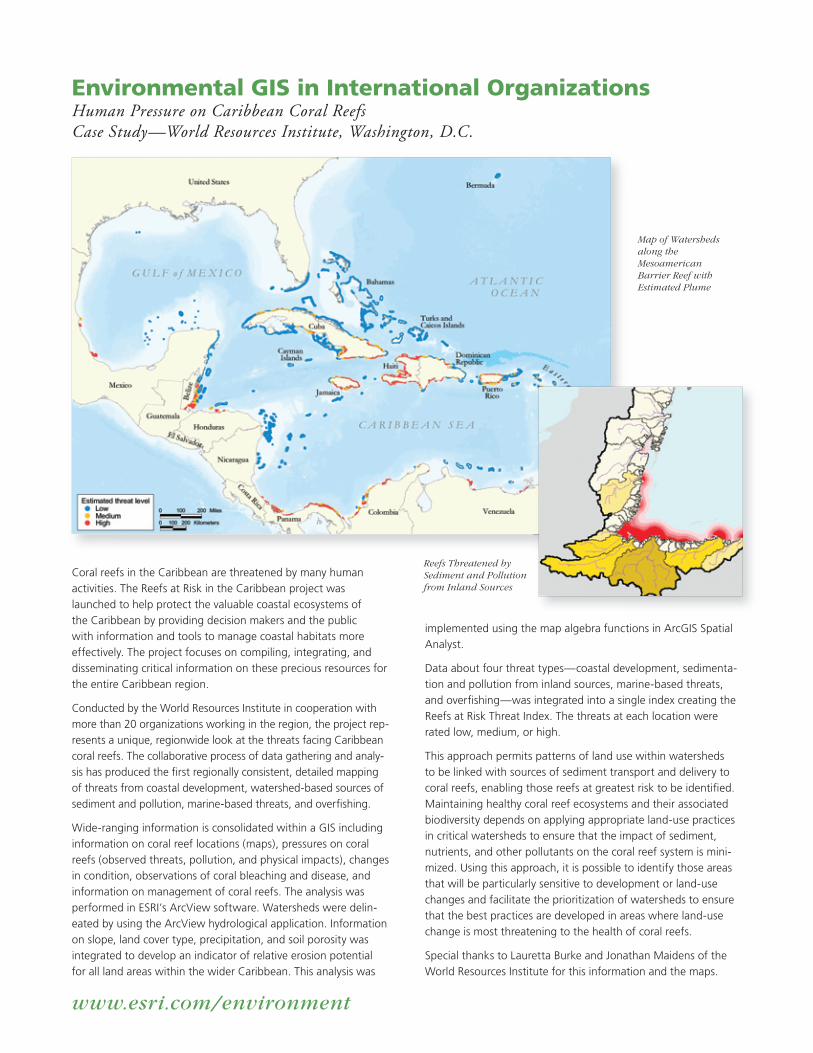
GIS Web maps bring the Environmental Management Department together with other county and city services.
CalMAST and the San Bernardino County sheriff provided maps on the CalMAST Web site so the service providers and the public could watch fire management progression.
www.esri.com/environment
Coral reefs in the Caribbean are threatened by many human activities. The Reefs at Risk in the Caribbean project was launched to help protect the valuable coastal ecosystems of the Caribbean by providing decision makers and the public with information and tools to manage coastal habitats more effectively. The project focuses on compiling, integrating, and disseminating critical information on these precious resources for the entire Caribbean region.
Conducted by the World Resources Institute in cooperation with more than 20 organizations working in the region, the project rep-resents a unique, regionwide look at the threats facing Caribbean coral reefs. The collaborative process of data gathering and analy-sis has produced the fi rst regionally consistent, detailed mapping of threats from coastal development, watershed-based sources of sediment and pollution, marine-based threats, and overfi shing.
Wide-ranging information is consolidated within a GIS including information on coral reef locations (maps), pressures on coral reefs (observed threats, pollution, and physical impacts), changes in condition, observations of coral bleaching and disease, and information on management of coral reefs. The analysis was performed in ESRI’s ArcView software. Watersheds were delin-eated by using the ArcView hydrological application. Information on slope, land cover type, precipitation, and soil porosity was integrated to develop an indicator of relative erosion potential for all land areas within the wider Caribbean. This analysis was
implemented using the map algebra functions in ArcGIS Spatial Analyst.
Data about four threat types—coastal development, sedimenta-tion and pollution from inland sources, marine-based threats, and overfi shing—was integrated into a single index creating the Reefs at Risk Threat Index. The threats at each location were rated low, medium, or high.
This approach permits patterns of land use within watersheds to be linked with sources of sediment transport and delivery to coral reefs, enabling those reefs at greatest risk to be identifi ed. Maintaining healthy coral reef ecosystems and their associated biodiversity depends on applying appropriate land-use practices in critical watersheds to ensure that the impact of sediment, nutrients, and other pollutants on the coral reef system is mini-mized. Using this approach, it is possible to identify those areas that will be particularly sensitive to development or land-use changes and facilitate the prioritization of watersheds to ensure that the best practices are developed in areas where land-use change is most threatening to the health of coral reefs.
Special thanks to Lauretta Burke and Jonathan Maidens of the World Resources Institute for this information and the maps.
Environmental GIS in International OrganizationsHuman Pressure on Caribbean Coral Reefs Case Study—World Resources Institute, Washington, D.C.
Map of Watersheds along the Mesoamerican Barrier Reef with Estimated Plume
Reefs Threatened by Sediment and Pollution from Inland Sources

www.esri.com/environment
GIS for Environmental Data Management and Analysis
On a scientifi c level, GIS for environmental analysis is used to explore the spatial relationships, patterns, and processes of geographic, biological, and physical phe-nomena. The two primary methods of geospatial analysis include quantitative mapping and thematic mapping. A quantitative map shows how much of something is in a selected area. It is a spatial representation of numeric values such as temperatures, population density, eleva-tion, pollution levels, and so forth. A thematic map dem-onstrates a specifi c feature or concept such as judicial boundaries, soil types, or fl ood zones. The combinations of data for environmental geospatial analysis are endless.
Spatial analysis employs the data-mining technology of a geographic database, or geodatabase. With it, you can document different layers of separate information sets and use spatial analytic tools to mine datasets across a diverse range of disciplines. The geodatabase provides the common data access and management framework for ArcGIS. It defi nes the types of data that can be used in ArcGIS—features, rasters, addresses, attributes, net-works, topologies, survey measurements, and relation-ships—and controls how they are represented, accessed, stored, managed, and processed. The ArcGIS geodata-base offers useful features such as
• Quality assurance and control of new data can be assessed and transaction histories recorded and pre-sented sequentially.
• Data can be modeled to allow those responsible for data management and collection to have control over its quality.
• Data can be versioned to allow multiple users to carry out simultaneous updates with long transactions.
• A variety of data formats can be fi led and processed for spatial visualization.
Geospatial analysis offers insight about the environment and reveals management options. GIS incorporates powerful tools to model the rela-tionships among geographic data for geospatial analysis. Here are some examples of tools and applications useful for advanced geospatial analysis of environmental geographic data.
Surface Interpolation: Visiting every location in a study to mea-sure the height, magnitude, or concentration of a phenomenon is usually diffi cult or expensive. Surface interpolation functions create a continuous surface from sample locations and make predictions from sample measurements to create continu-ous surface representation. Use ArcGIS Spatial Analyst tools to choose the best interpretation method for your specifi c data. Each inter-polation method produces predictions using different calculation methods from inverse distance weighted to kriging.
Temporal Analysis: Observing environmental change over time indicates trends and patterns. ArcGIS Tracking Analyst provides tools for display and analysis of time series data. It is useful for playing back historical data, inte-grating temporal data within the GIS, and charting and analyzing change in historical or real-time data.
Three-Dimensional Analysis: GIS constructs three-dimen-sional composites that can be interactively visualized. Informa-tion such as lithologic, geologic structure, and water-level data is represented in three-dimensional space by creating spatially con-tinuous surfaces or grids using industry-accepted algorithms to interpolate between data points. This makes it possible to interpret three-dimensional data in two-dimensional space.
ArcGIS Spatial Analyst creates raster surface for aspect and slope.
The ArcGIS Data Interoperability extension allows ArcGIS users to read more than 70 data formats.
ArcGIS Tracking Analyst tracks time-related geographic events such as this hurricane.
ArcGIS 3D Analyst is used to visualize 3D flyover data of a fire perimeter. This data was provided courtesy of CalMAST, USGS, and DigitalGlobe.
www.esri.com/environment
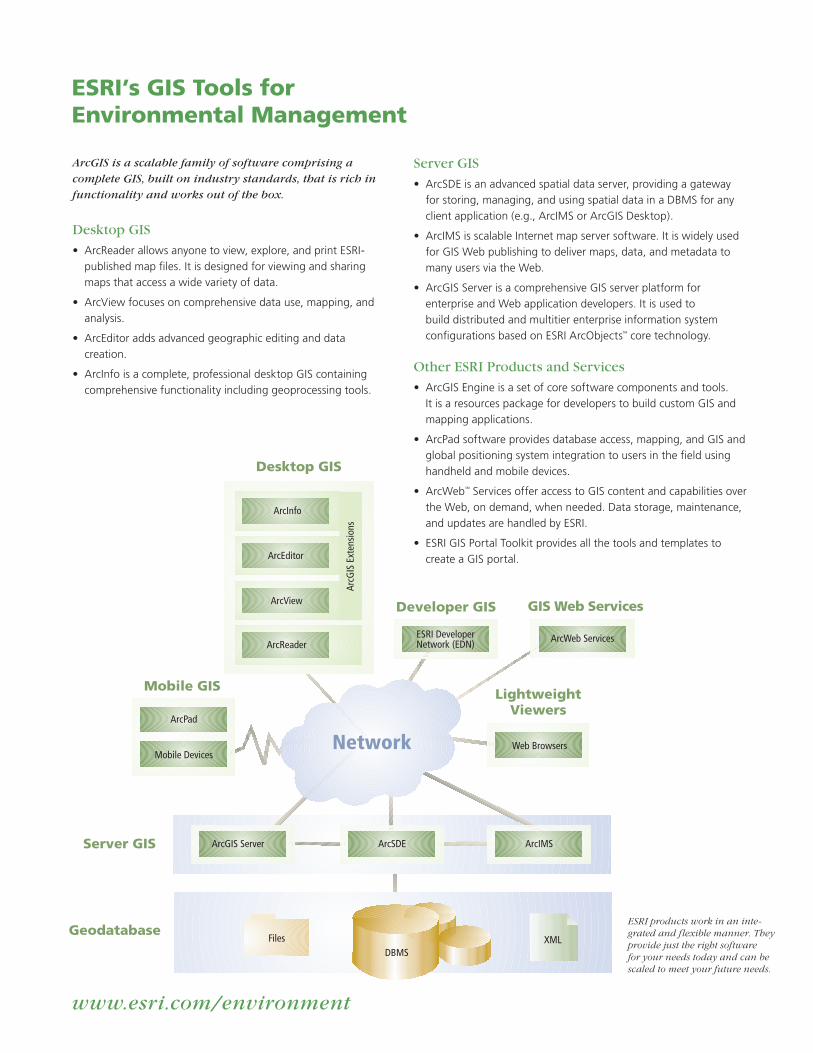
ESRI’s GIS Tools forEnvironmental Management
ArcGIS is a scalable family of software comprising a complete GIS, built on industry standards, that is rich in functionality and works out of the box.
Desktop GIS
• ArcReader allows anyone to view, explore, and print ESRI-published map files. It is designed for viewing and sharing maps that access a wide variety of data.
• ArcView focuses on comprehensive data use, mapping, and analysis.
• ArcEditor adds advanced geographic editing and data creation.
• ArcInfo is a complete, professional desktop GIS containing comprehensive functionality including geoprocessing tools.
LightweightViewers
Server GIS
Mobile GIS
ArcPad
Mobile DevicesWeb BrowsersNetwork
Desktop GIS
ArcInfo
ArcEditor
ArcView
ArcReader
ArcG
IS E
xten
sion
s
ArcSDEArcGIS Server ArcIMS
ESRI DeveloperNetwork (EDN)
Developer GIS
DBMSXMLFiles
Geodatabase
ArcWeb Services
GIS Web Services
ESRI products work in an inte-grated and flexible manner. They provide just the right software for your needs today and can be scaled to meet your future needs.
Server GIS
• ArcSDE is an advanced spatial data server, providing a gateway for storing, managing, and using spatial data in a DBMS for any client application (e.g., ArcIMS or ArcGIS Desktop).
• ArcIMS is scalable Internet map server software. It is widely used for GIS Web publishing to deliver maps, data, and metadata to many users via the Web.
• ArcGIS Server is a comprehensive GIS server platform for enterprise and Web application developers. It is used to build distributed and multitier enterprise information system configurations based on ESRI ArcObjects™ core technology.
Other ESRI Products and Services
• ArcGIS Engine is a set of core software components and tools. It is a resources package for developers to build custom GIS and mapping applications.
• ArcPad software provides database access, mapping, and GIS and global positioning system integration to users in the field using handheld and mobile devices.
• ArcWebSM Services offer access to GIS content and capabilities over the Web, on demand, when needed. Data storage, maintenance, and updates are handled by ESRI.
• ESRI GIS Portal Toolkit provides all the tools and templates to create a GIS portal.

www.esri.com/environment
ESRI’s GIS Solutions and Services forEnvironmental Management
Extensions
These optional software extensions dramatically expand the capabilities of ArcGIS for environmental management.
ArcGIS 3D Analyst™
Three-dimensional visualization, topographic analysis, and surface creation
ArcGIS Data Interoperability
Uses any standard GIS data within the ArcGIS Desktop environment, regardless of the format
ArcGIS Geostatistical Analyst
Statistical tools for data exploration, modeling, and advanced surface generation and valuation analysis
ArcGIS Network Analyst
Creates and manages network datasets
ArcGIS Publisher
Converts ArcGIS map documents to published map fi les—useful for dis-tributing maps read with ArcReader
ArcGIS Spatial Analyst
Advanced spatial analysis using raster and vector data
ArcGIS Tracking Analyst
Time-related visualization of existing temporal data—includes past and future time windows
ArcScan™ for ArcGIS
Raster vectorization and simple raster editing
ESRI for the Environmental GIS User Community
ESRI supports the environmental GIS software user community with edu-cational services, professional services, and business partner solutions that help people implement and manage a successful GIS. Learn a wide range of tips and tricks for customizing environmental applications from the Online Support Center, the Developer Support Group, discussion forums, and ArcUser Online.
To learn more about GIS for environmental management, join the user group, or sign up for the Environmental Observer GIS newsletter, visit ESRI’s Environmental Management Web site at www.esri.com/environment.
ArcGIS Geostatistical Analyst—Statistical Tools for Data and Advanced Surface Creation
ArcGIS Spatial Analyst—Advanced Spatial Analysis Using Raster and Vector Data to Model the Influence of Location-Specific Data on Value
ArcGIS 3D Analyst—Three-Dimensional Data Visualization and Topographic Analysis
Australia www.esriaustralia.com.au
Belgium/Luxembourg www.esribelux.com
Bulgaria www.esribulgaria.com
Canada www.esricanada.com
China (Beijing) www.esrichina-bj.cn
China (Hong Kong) www.esrichina-hk.com
Finland www.esri-finland.com
France www.esrifrance.fr
Germany/Switzerland www.esri-germany.de
www.esri-suisse.ch
Hungary www.esrihu.hu
India www.esriindia.com
Indonesia/Malaysia 62-21-527-1023 603-7874-9930
Italy www.esriitalia.it
Japan www.esrij.com
Korea www.esrikr.co.kr
Netherlands www.esrinl.com
Poland www.esripolska.com.pl
Portugal www.esri-portugal.pt
Romania www.esriro.ro
Singapore www.esrisa.com
Spain www.esri-es.com
Sweden www.esri-sweden.com
Thailand www.esrith.com
United Kingdom www.esriuk.com
Venezuela www.esriven.com
No. GS-35F-5086H
Printed in USA98694XXX11M09/05tk
Copyright © 2005 ESRI. All rights reserved. ESRI, the ESRI globe logo, ArcGIS, ArcWeb, ArcLogistics, ArcPad, ArcScene, ArcView, ArcReader, ArcIMS, ArcExplorer, ArcEditor, ArcInfo, ArcGlobe, ArcMap, ArcSDE, ArcObjects, 3D Analyst, ArcScan, ArcUser, @esri.com, and www.esri.com are trademarks, registered trademarks, or service marks of ESRI in the United States, the European Community, or certain other jurisdictions. Other companies and products mentioned herein are trademarks or registered trademarks of their respective trademark owners.
Place ESRI business partner or distributor address here.
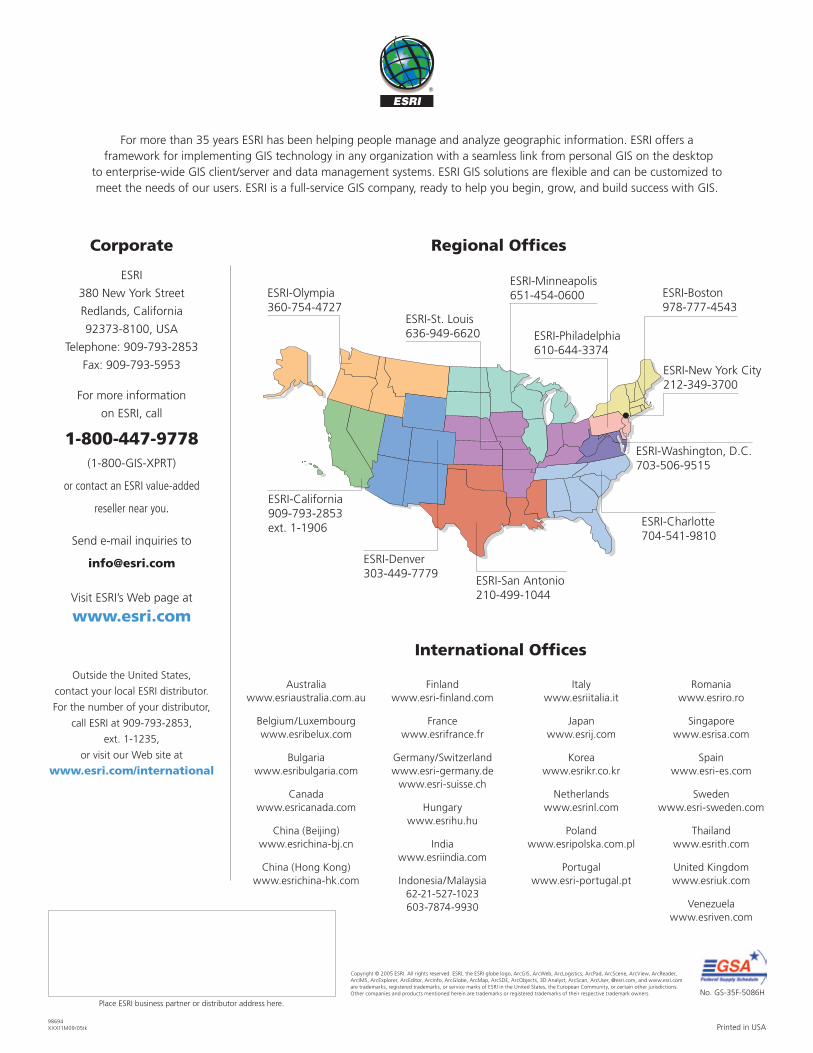
For more than 35 years ESRI has been helping people manage and analyze geographic information. ESRI offers a framework for implementing GIS technology in any organization with a seamless link from personal GIS on the desktop
to enterprise-wide GIS client/server and data management systems. ESRI GIS solutions are flexible and can be customized to meet the needs of our users. ESRI is a full-service GIS company, ready to help you begin, grow, and build success with GIS.
International Offices
ESRI
380 New York Street
Redlands, California
92373-8100, USA
Telephone: 909-793-2853
Fax: 909-793-5953
For more information
on ESRI, call
1-800-447-9778(1-800-GIS-XPRT)
or contact an ESRI value-added
reseller near you.
Send e-mail inquiries to
Visit ESRI’s Web page at
www.esri.com
Corporate
Outside the United States,
contact your local ESRI distributor.
For the number of your distributor,
call ESRI at 909-793-2853,
ext. 1-1235,
or visit our Web site at www.esri.com/international
Regional Offices
ESRI-Minneapolis 651-454-0600ESRI-Olympia
360-754-4727ESRI-Boston 978-777-4543
ESRI-California 909-793-2853 ext. 1-1906
ESRI-Denver 303-449-7779
ESRI-San Antonio 210-499-1044
ESRI-Charlotte 704-541-9810
ESRI-Washington, D.C. 703-506-9515
ESRI-St. Louis 636-949-6620 ESRI-Philadelphia
610-644-3374
ESRI-New York City 212-349-3700