giving birth in canada - cihi · 1 figure about this report ix this report is the second in a...
TRANSCRIPT

A Regional Profile
Giving Birth in Canada

Contents of this publication may be reproduced in whole or in part provided the intended use is for non-commercial purposes and full acknowledgement is given to the Canadian Institute for Health Information.
Canadian Institute for Health Information377 Dalhousie StreetSuite 200Ottawa, OntarioK1N 9N8
Telephone: (613) 241-7860Fax: (613) 241-8120www.cihi.ca
ISBN 1-55392-465-7
© 2004 Canadian Institute for Health Information
Cette publication est aussi disponible en français sous le titre :Donner naissance au Canada : Un profil régional, ISBN 1-55392-466-5

Giving Birth in Canada Today
A Regional Profile
Giving Birth in Canada

Table of ContentsAbout the Canadian Institute for Health Information . . . . . . . . . . . . . . . . . . . vAcknowledgements . . . . . . . . . . . . . . . . . . . . . . . . . . . . . . . . . . . . . . . . . . . . . vii About This Report . . . . . . . . . . . . . . . . . . . . . . . . . . . . . . . . . . . . . . . . . . . . . . ix
Birthing Practices: A Look Backwards . . . . . . . . . . . . . . . . . . . . . . . . . . . 1
Giving Birth in Canada Today . . . . . . . . . . . . . . . . . . . . . . . . . . . . . . . . . 3When Mothers Need Help . . . . . . . . . . . . . . . . . . . . . . . . . . . . . . . . . . . . . . . . 5
A Kick-Start to Labour . . . . . . . . . . . . . . . . . . . . . . . . . . . . . . . . . . . . . . . . . . 5The Pain of Labour . . . . . . . . . . . . . . . . . . . . . . . . . . . . . . . . . . . . . . . . . . . . . 6
Epidural: The Popular Choice . . . . . . . . . . . . . . . . . . . . . . . . . . . . . . . . . . . . . . 7When Nature Needs Help . . . . . . . . . . . . . . . . . . . . . . . . . . . . . . . . . . . . . . . . . 9
Pulling Instead of Pushing . . . . . . . . . . . . . . . . . . . . . . . . . . . . . . . . . . . . . . . 9Who Does What? . . . . . . . . . . . . . . . . . . . . . . . . . . . . . . . . . . . . . . . . . . . . . 13To Episiotomy or Not? . . . . . . . . . . . . . . . . . . . . . . . . . . . . . . . . . . . . . . . . . 14
When Nature Needs Even More Help—Caesarean Births in Canada . . . . . . . . . . . . . . . . . . . . . . . . . . . . . . . . . . . . . 15It’s My First . . . . . . . . . . . . . . . . . . . . . . . . . . . . . . . . . . . . . . . . . . . . . . . . . 15After a Caesarean Section . . . . . . . . . . . . . . . . . . . . . . . . . . . . . . . . . . . . . 18Why a Caesarean Section? . . . . . . . . . . . . . . . . . . . . . . . . . . . . . . . . . . . . . . 18What’s the Right Number? . . . . . . . . . . . . . . . . . . . . . . . . . . . . . . . . . . . . . . 19
When Baby Arrives . . . . . . . . . . . . . . . . . . . . . . . . . . . . . . . . . . . . . . . . 21Too Early, Too Small . . . . . . . . . . . . . . . . . . . . . . . . . . . . . . . . . . . . . . . . . . . . 22When Newborns Need Intensive Care . . . . . . . . . . . . . . . . . . . . . . . . . . . . . . 24Hospital Stays After Birth . . . . . . . . . . . . . . . . . . . . . . . . . . . . . . . . . . . . . . . . 25
Looking Back, Looking Ahead . . . . . . . . . . . . . . . . . . . . . . . . . . . . . . . . 28
What We Know . . . . . . . . . . . . . . . . . . . . . . . . . . . . . . . . . . . . . . . . . . . . . . . . 31What We Don’t Know . . . . . . . . . . . . . . . . . . . . . . . . . . . . . . . . . . . . . . . . . . . 31What’s Happening . . . . . . . . . . . . . . . . . . . . . . . . . . . . . . . . . . . . . . . . . . . . . . 31Appendix A: Fast Facts . . . . . . . . . . . . . . . . . . . . . . . . . . . . . . . . . . . . . . . . . . 33Appendix B: Technical Notes . . . . . . . . . . . . . . . . . . . . . . . . . . . . . . . . . . . . . 43For More Information . . . . . . . . . . . . . . . . . . . . . . . . . . . . . . . . . . . . . . . . . . . 59


Since 1994, the Canadian Institute for Health Information (CIHI), a pan-Canadian, independent, not-for-profit organization, has been working to improve the health of the health system and the health of Canadians by providing reliable and timely health information. The Institute’s mandate, as established by Canada’s health ministers, is to develop and maintain a common approach for health information in this country. To this end, CIHI provides information to advance Canada’s health policies, improve the health of the population, strengthen our health system and assist leaders in the health sector to make informed decisions.
As of August 1, 2004, the following individuals are on CIHI’s Board of Directors:
About the Canadian Institute for Health Information
v
• Mr. Graham W. S. Scott, Q.C.,(Chair), Managing Partner, McMillan Binch LLP
• Mr. Rick Roger (Vice-Chair), ChiefExecutive Officer, Vancouver IslandHealth Authority
• Dr. Penny Ballem, Deputy Minister, British Columbia Ministry of Health Services
• Dr. Peter Barrett, Physician andFaculty, University of SaskatchewanMedical School
• Dr. Laurent Boisvert, Director, Clinical-Administrative Affairs,Association des hôpitaux du Québec
• Ms. Roberta Ellis, Vice-President,Prevention Division, Workers’Compensation Board of British Columbia
• Mr. Kevin Empey, Vice PresidentFinance and Corporate Services,University Health Network
• Dr. Ivan Fellegi, Chief Statistician of Canada, Statistics Canada
• Mr. Ian Green, Deputy Minister of Health, Health Canada
• Mr. Phil Hassen, Deputy Minister,Ontario Ministry of Health and Long-Term Care
• Ms. Nora Kelly, Deputy Minister, New Brunswick Ministry of Health and Wellness
• Ms. Alice Kennedy, Vice-President,Resident Care, St. John’s NursingHome Board, Newfoundland and Labrador
• Mr. David Levine (Observer),President and Director General, Régierégionale de la santé et des servicessociaux de Montréal-Centre
• Dr. Cameron Mustard, President,Institute for Work & Health
• Dr. Brian Postl, Chief ExecutiveOfficer, Winnipeg Regional Health Authority
• Ms. Sheila Weatherill, Chief ExecutiveOfficer, Capital Health Authority,Edmonton, Alberta
• Ms. Glenda Yeates (Ex-officio),President and Chief Executive Officer, CIHI


AcknowledgementsThe Canadian Institute for Health Information (CIHI) would like to acknowledge and thank themany individuals and organizations that have contributed to the development of the report.
Particularly, we would like to express our appreciation to the members of the Expert Group, whoprovided invaluable advice throughout the process. Members included:
It should be noted that the analyses and conclusions in this report do not necessarily reflectthose of the individual members of the Expert Group or their affiliated organizations.
The editorial committee for this report included: Kira Leeb, Jennifer Zelmer, Jeanie Lacroix,and Jack Bingham. Other core members of the team included Raghda AlAtia, Akerke Baibergenova,Lynne Duncan, Patricia Finlay, Cheryl Gula, Sharon Gushue, Thi Ho, Luciano Ieraci, Tina LeMay, Geneviève Martin, Mary Neill, Jennifer Phillips, Karin Schoeberle, and Benjamin Taylor.
This report could not have been completed without the generous support and assistance of many others at CIHI who compiled data; undertook research; worked on the print and Web design, translation and distribution; undertook the development and implementation of the communication plan; and provided ongoing support to the core team. Special thanks are also extended to CIHI staff and their families for providing the baby pictures used in this report.
CIHI would also like to thank the individuals in health regions and provinces and territorieswho participated in the validation process for the regional health indicators.
vii
• Dr. Elizabeth Whynot (Chair),President, British Columbia’s Women’s Hospital & Health Centre
• Mr. Jack Bingham (Ex-officio member), Director, Health Reports and Analysis, CIHI
• Dr. Beverley Chalmers, InternationalHealth Consultant, Centre forResearch in Women’s Health,Sunnybrook and Women’s CollegeHealth Science Centre, University of Toronto
• Dr. Jan Christalaw, British Columbia’sWomen’s Hospital & Health Centre
• Dr. K. S. Joseph, Associate ProfessorDepartments of Obstetrics andGynaecology and Pediatrics, Dalhousie University
• Dr. Terry P. Klassen, Professor andChair, Department of Pediatrics,University of Alberta Hospital
• Dr. Michael S. Kramer, ScientificDirector, Institute of HumanDevelopment, Child and Youth Health, CIHR
• Dr. Vyta Senikas, Executive VicePresident, Society of Obstetricians and Gynaecologists of Canada
• Dr. Carolyn Lane, Family Physician,The Low Risk Maternity Clinic,Calgary, Alberta
• Dr. Kyong-Soon Lee, Neonatologist,McMaster University
• Dr. Hajnal Molnar-Szakács, Chief,Maternal and Infant Health Section,Health Surveillance and EpidemiologyDivision, Population and Public HealthBranch, Health Canada
• Ms. Marianne Stewart, SeniorOperating Officer, Primary CareDivision, Capital Health


1
FIGU
RE
About This Report
ix
This report is the second in a series of four special reports prepared by the CanadianInstitute for Health Information (CIHI) on the health and health care of Canada’smothers and infants. The first report, Giving Birth in Canada: Providers of Maternity and Infant Care, focused on trends in birthing and maternity care and looked at thechanging scope of practice for maternal and infant care providers. It was released inspring 2004 and can be ordered or downloaded from CIHI’s Web site (www.cihi.ca).
This second report, Giving Birth in Canada: A Regional Profile, profiles selected health service indicators for Canada’s mothers and infants. These indicators include new data presented at the regional level for regions with populations of 75,000 or more or at the provincial/territorial level. Additional regional health indicators are availablethrough the health indicators e-publication on CIHI’s Web site.
The remaining reports in this series include:• Giving Birth in Canada: The Costs—Expenditures on maternal and infant care.• Giving Birth in Canada: A Profile of Canada’s Mothers—What we know and
don’t know about the changing demographics of mothers in Canada and about theirexperiences in the health care system.
Each of these special reports presents a fact-based compilation of current research, historical trends, and new data and findings. Their aim is to assist care providers anddecision makers in planning health services for maternity and infant care. They alsocomplement CIHI’s ongoing reporting process and the initiatives of partners such asthe Canadian Perinatal Surveillance System (see below).
2000–2001
Hospital MorbidityDatabase†
Canadian Perinatal Health Report**
Med-Écho***
2001 or 2001–2002
Hospital MorbidityDatabase†
Discharge AbstractDatabase†
National Family Physician Workforce Survey‡
2002
Canadian Vital Statistics—Birth and Stillbirth Databases*
Sources: † Collected by CIHI.‡ Collected by the College of Family Physicians of Canada.* Collected by Statistics Canada.** Compiled by Health Canada.*** Banque de données sur les hospitalisations du système Med-Écho,
Ministère de la Santé et des Services sociaux (Med-Écho hospitalization database, Quebec Ministry of Health and Social Services).
Where the Data Come FromThe figure below shows pan-Canadian health data from CIHI, Health Canada, and theCollege of Family Physicians of Canada that are used in this report.

Giv
ing
Birt
h in
Can
ada:
A R
egio
nal P
rofil
e
x
This report includes a Fast Facts section to provide an expanded range of comparative datafrom across the country. Whenever the icon appears in the margin beside the text, it indicates that related data can be found at the back of this report (see Appendix A).
Canadian Perinatal Health Report 2003 The Canadian Perinatal Surveillance System (CPSS) is part of Health Canada’s initiative to strengthen national health surveillance capacity. The CPSS monitors and reports on perinatal health determinants and outcomesthrough an ongoing cycle of data collection and acquisition,expert analysis and interpretation, and communication.
Recently, the CPSS released its Canadian Perinatal HealthReport 2003, which includes information on 27 perinatal
health indicators on determinants and outcomes of maternal, fetal, and infant health. Statistics for each indicator consist mainly of temporal trends at the national level and provincial/territorial comparisons for the most recent year for which data are available. It can be downloaded free of charge from the following link: www.hc-sc.gc.ca/pphb-dgspsp/publicat/cphr-rspc03.
FF

Highlights of This Report
General Overview• In Canada, pregnancy and childbirth accounted for 14% of all hospitalizations
in 2001–2002, second only to circulatory diseases. Each year, approximately 330,000 babies are born; about 99% of deliveries take place in hospitals.
• Approximately one quarter of births in Canada in 2001–2002 occurred without sur-gical intervention (use of instruments, induction, or epidural/general anaesthetic).
Indicator HighlightsThe report focuses on five indicators describing the birthing process. In each case,there were substantial variations in practice across the country, with rates in someregions at least double the rates in other areas. Examples include:• Epidurals were used in nearly half (45.4%) of all vaginal births in Canada in
2001–2002. Their use varied across the country from 3.9% to 74.6%. A number of factors may explain these variations, including patient and caregiver preferences and the availability of anaesthesiology services.
• Although the overall rate of assisted vaginal delivery in Canada was relatively stablebetween 1991–1992 and 2000–2001, the methods used have changed over time.The proportion of vaginal deliveries assisted by vacuum extraction increased by56%, whereas the use of forceps decreased by 45% during the same time period.Other countries, such as England, the United States (U.S.), New Zealand, andAustralia, have seen similar trends.
• Primary caesarean section rates varied more than three-fold across health regionsfrom 7.6% to 25.5% of births. Similarly, among the provinces, rates varied from12.4% in Manitoba to 21.0% in Prince Edward Island.
• The proportion of newborns admitted to neonatal intensive care units (NICUs) inCanada rose from 12.6% in 1994–1995 to 14.4% in 2001–2002. These babies spenta median of two days in the NICU. About 1% did not survive until discharge. Low-and very-low-birth-weight babies tended to stay longer in NICUs and were morelikely to die during their stay.
xi


The birth of any child can be life changing, but royal births oftenchange history. Prince Leopold George Duncan, Queen Victoria’s seventh child, had little chance of gaining the throne, but his mother’s
use of chloroform to relieve the pain ofchildbirth ensured hisplace in the history of obstetrics.1
The introduction ofanaesthesia is just one of the many ways thatchildbirth has changedover time. Long beforehospitals became focalpoints of care, mothers gave birth at home withsupport from midwives, relatives, and/or friends.Knowledge about child-birth, and the uses ofherbs and preparationsrelated to the birthingprocess, was passed from person to person.European midwives, for example, sometimesused opium to helpwomen with pain during a difficult labour.2
Birthing Practices: A Look Backwards
0
5
10
15
20
25
30
1960
1962
1964
1966
1968
1970
1972
1974
1976
1978
1980
1982
1984
1986
1988
1990
1992
1994
1996
1998
2000
Rate
per
1,0
00 B
irths
Perinatal Mortality Neonatal Mortality
Improved SurvivalThe risk of death during or immediately after childbir th is much lower than it used to be for both mothers and their babies. The figure below shows changes in perinatal mortality (death of a child under one week of age or a stillbir th at 28 or more weeks’ gestation) and neonatalmortality (death of a child 0 to 27 days of age) rates in Canada over time.
Notes: Perinatal mortality is expressed as a rate per 1,000 total births. Neonatal mortality is expressed as a rate per 1,000 live births. Neonatal mortality rate is estimated for 1975 and 1976.
Sources: OECD Health Data 1975–1976,Selected Infant Mortality and Related Statistics, Canada,
1921–1990, (82–549 Occasional) Statistics CanadaBirths, 1991 (84–210) Statistics CanadaBirths and Deaths, 1993 (84–210) Statistics CanadaBirths and Deaths, 1996 (84F0210XPB) Statistics CanadaMortality—Summary List of Causes, 1992,1995 (84–209)
Statistics CanadaMortality—Summary List of Causes, 1996–1998
(84F0209XPB) Statistics CanadaDeaths, 1998–1999 (84F0211XPB) Statistics CanadaCanadian Vital Statistics, Birth, Death and Stillbirth Databases,Statistics Canada
2
FIGU
RE
Surgery was historically a high-risk option performed, when necessary, by “barber-surgeons.”3 A French family of barber-surgeons also invented obstetric forceps in the mid-1600s. A closely guarded secret for generations, the family used forceps to perform the first assisted vaginal deliveries.4
Between the 18th and 20th centuries, birthingpractices continued to evolve. General anaesthesiawas introduced in the mid-1850s with the use ofether and later chloroform as a tool for reducingpain.5 At first, the use of anaesthesia met withresistance, but by 1914–1915, staff at the OttawaMaternity Hospital reportedly gave 75% ofmothers either chloroform or ether during labour to control pain.6
Outcomes for mothers and babies also improved significantly over this period, partlybecause of advances in obstetrical care.7 Experts suggest that some of the gains canalso be attributed to improved nutrition and other factors.8
Giv
ing
Birt
h in
Can
ada:
A R
egio
nal P
rofil
e
2
Pain management in childbirth is now commonplace, as are caesareansections and assisted vaginal births. Many other innovations have alsobecome an integral part of the birthing process. For example, evenbefore birth, many parents seek technological help to conceive. Moretake advantage of advanced fetal monitoring, amniocentesis, and ultra-sound for pre-birth screening. By 2002, 99% of babies in Canada wereborn in hospitals.9 After birth, highly sophisticated care for very sicknewborns is also now available.
In this report, for the firsttime, we present a set of indicators describing currentmaternal and infant care atregional, provincial/territorial, and national levels. We high-light, for example, regionalvariations in epidural use, aswell as in assisted deliverieswith forceps or with vacuumextraction. We also comparecaesarean section rates acrossCanada, focusing on mothershaving caesarean sections for the first time. Finally, welook at variations in how often babies are admitted to neonatal intensive care units and how often newbornsare re-hospitalized after birth.
For each indicator, we presenta profile of the topic and current Canadian data. These data highlight strikingvariations in how often different tools and techniquesare used. There are at leasttwo-fold variations between
the regions with the highest and lowest rates for most of these indicators. In a fewcases, rates in some regions are more than ten times those in others.
Giving Birth in Canada Today
Assisted Reproductive Technologies
The 1993 Royal Commission on ReproductiveTechnologies estimated that 1 in 14 Canadiancouples experience infertility (as measured after a two-year period).10 These couples havemany more options now than in the past.
“The use of assisted reproductive technology (ART)has increased dramatically since the first in vitro fertilization in 1981.”11 In the U.S., for example,40,687 infants were born as a result of ART cycles carried out in 2001.12 That represents a total of 29,344 live-birth deliveries,reflecting the technology’s association with multiple births.13
In Canada, ART data and statistics are not readily available, although Health Canadabelieves that our trend of multiple births relatedto ART is similar to that of the U.S.14 According to the Canadian Fertility and Andrology Society,which collects data from 21 of the 22 in vitro fertilization centres in Canada, 1,237 infants were born in Canada as a result of in vitro fertilization treatment in 2001 (about 0.4% of live births for that year).15, 16

Giv
ing
Birt
h in
Can
ada:
A R
egio
nal P
rofil
e
4
In no case do we know what the “right” number is. Clearly, interventions are benefi-cial, even life-saving, for some mothers and their babies. In other cases, they are contra-indicated. For each indicator, therefore, we present a flavour of what expertssay about what might explain variations in use. We encourage interested readers topursue the references provided for more information.
What Is an Indicator?
Health indicators are single summary measures, most often expressed in quantitative terms, which represent key dimensions of health status, the healthcare system, or related factors. Like a warning light on the dashboard of a car,they suggest areas for further investigation, rather than definitively confirming that a problem exists. (For specific technical notes on the methodologies used in the calculation of the indicators included in this report, see Appendix B.)
Maintaining and enhancing the quality of incoming data is essential to CIHI’smandate to produce high-quality health information. In addition, CIHI undertookthe following steps to develop the maternal infant health indicators that appear inthe report:
• Starting With the Evidence and the Data: We started with a list of evidence-based indicators derived from administrative data identified by the CanadianPerinatal Health Surveillance Group at Health Canada. For each indicator, weconducted a feasibility study to see whether the indicator could be reported atregional, provincial/territorial, and/or national levels using Canadian data. Thisstep involved a literature review; clinical definition review; and identification ofpotential issues related to sample size, coding, data quality, and reporting.
• Talking to the Experts: Working with our expert panel, we reviewed the maternaland infant health indicators and updated some definitions to make them morerelevant to this report.
• Extracting and Verifying the Data: Based on the agreed specifications, at least two analysts independently extracted indicator results from our databases.Where possible, these results were checked for face validity against externalsources (e.g. research studies or international data). Outliers and other anomalieswere investigated, either by using CIHI data or by contacting relevant healthcare facilities. Throughout this and other stages of the process, coding, database, and indicators specialists reviewed the indicators in order to ensure high quality.
• External Verification: Preliminary results and technical specifications were sent to health regions, ministries of health, and their partners for verification.Where questions arose, we worked together to resolve them.
• Catching the Gremlins: Indicator results appearing in this or other publicationswere checked by at least two staff members to ensure that no transcription orother errors occurred in the production process.
And those are just the highlights! It can be a long process, but it is an importantone to ensure that we make the best possible data available to decision-makers.Nevertheless, indicator results are best viewed as screening tests that may pro-duce false positives and false negatives. They can be helpful in triggering moredetailed investigations into specific aspects of care and identifying best practicesacross the country.

When Mothers Need HelpFrom the initiation of contractions, to managing labour pain and delivering a baby,women may need help along the way. This help can come in many forms. It could be simply the support of a “labour coach,” or it could include the use of methods tostart the birthing process or to help the mother deliver the baby. In this section, we consider how often two procedures—labour induction and epidural analgesia—are used across Canada.
A Kick-Start to LabourAt around nine months, labour typically begins spontaneously by ever-increasing num-bers of contractions of the uterus and eventually the breaking of waters. When labourdoesn’t begin spontaneously, clinicians may recommend artificially starting the process by inducing labour. Induction may be necessary, for example, when babies are overdue ortoo large, if the mother or the fetus have medical issues, or when the mother’s waterbreaks too early.17 Labour can be induced using drugs (medical induction) or specialtools to artificially break the water (surgical induction).18, 19
Like many other obstetrical interventions, the rate of labour induction has increasedsteadily over the last 10 to 15 years.20 Between 1991–1992 and 2000–2001, medicalinduction increased to approximately one in five births. Surgical induction was lesscommon (8% of vaginal births).21 These rates vary provincially/territorially.
A number of possibleexplanations for risinginduction rates have beensuggested, including: • higher use of obstetrical
interventions over thelast 20 years;20
• greater proportion of post-term preg-nancies;22 and
• increasing rates of elective inductions,23
used, for example, to plan the date and location of birth for mothers in remote areas.24
5
Giving
Birth in C
anada Tod
ay
0 5 10 15 20 25 30
Y.T.
N.L.
P.E.I.
N.S.
Sask.
B.C.
Induction Rate (Inductions per 100 Vaginal Births)
Inducing LabourIn 2001–2002, six jurisdictions started using a new, moreprecise coding system for diagnoses and procedures thatall of Canada is starting to adopt. This system allows calculation of how often labour was induced, medically or surgically. Among these jurisdictions, two Maritimeprovinces, Nova Scotia and Prince Edward Island, had the highest induction rates.
3
FIGU
RE
Source: Discharge Abstract Database, CIHI

Giv
ing
Birt
h in
Can
ada:
A R
egio
nal P
rofil
e
6
Medically indicated induction of labour may result in a lower risk of death for overduebabies22 and increases the likelihood of delivery for slow or non-progressing births.17
However, there is some controversy around inductions done for non-medical reasons.For example, research suggests that, compared to women who are not induced, womenwho are induced have a higher risk of having caesarean section births25, 26 and of having painful uterine contractions or uterine ruptures.27
The Pain of Labour“It is we who are having the baby; and we will have chloroform!” (Queen Victoria, 1853).28
From the beginning, the use of medication to help manage labour pain has been controversial. Today, the World Health Organization recommends alternatives to medication, such as ambulation, changing positions, massage, relaxation, breathing,and acupuncture.29 Studies suggest that the presence of continuous one-on-one supportmay also help women minimize their reliance on pain medication. The benefits oflabour support—the assistance of a professional (nurse, midwife, or doula) or non-professional caregiver (family member or friend) who offers advice, information, comfort measures, and emotional support to women in labour—was the subject of a systematic review of 15 studies involving 12,791 women from 11 countries.Researchers found that uninterrupted labour support from a professional or non-professional caregiver was associated with significant reductions in caesarean section delivery, assisted delivery, and use of pain medication.30
Nevertheless, advances in obstetric anaesthesia have made medicated pain relief apopular option. A recent systematic review of 11 studies found that epidural use doesnot increase the rate of caesarean delivery, although it may lengthen the first and second stages of labour and increase the rate of assisted delivery, fetal malposition, and oxytocin use to speed up labour.31 As well, epidural use may be associated with drug side effects in both mothers and babies.32, 33

7
Giving
Birth in C
anada Tod
ay
Epidural: The Popular ChoiceEpidural analgesia is reported to be the most effective method of medicated pain relief, and its use has become widespread over the last 20 years.33
In Canada, epidurals were used in nearly half (45.4%) of all vaginal deliveries in2001–2002. In the U.S., a national survey of women’s childbearing experiences found that they were used in about 59% of vaginal deliveries.34 England, on the otherhand, has a lower rate: 12% of unassisted vaginal deliveries.35 Some experts suggestthat this may reflect the reliance in the United Kingdom (UK) on midwives as the primary caregivers for women giving birth.36
The frequency of epidural use varies within countries, as well as between them. In 2001–2002,epidural rates varied widely acrossCanada, ranging from a low of 4.0% of all vaginal deliveries in the Northwest Territories to a high of 60.2% in Quebec. Amonghealth regions with a population of 75,000 or more, the range in rates was even greater: from 3.9% in Zone 2 (Kentville area) of Nova Scotia to 74.6% in Region 2 (St. John Region) of New Brunswick.
What’s in a Name?
The “epidural” is the space in the lowerspine between the spinal cord and thedura. A small flexible tube (epiduralcatheter) is inserted into this area and fixed to the back. This allows analgesicmedication to flow into the epidural spaceand provide pain relief throughout thelower half of the body.
A traditional epidural block involves theuse of a local anaesthetic alone (such asbupivacaine). In the past, high concentra-tions of the drug prevented mothers fromfeeling the need or having the ability topush.37, 38 Today, however, refined tech-niques such as low-dose epidural, spinalepidural, and combined spinal-epiduralanalgesia reduce this problem. Somenewer techniques also give women theoption to walk around during labour or to control their own drug dosage.39
FF

A number of factorsexplain regional variationin rates, many of whichare not well understood.Some physicians, forexample, may be morelikely to recommend using an epidural thanothers.40 As well, womenwho are giving birth forthe first time, are at a later stage in life, or are Caucasian may bemore likely to request an epidural.41
In addition, the availability of staff and resources may play a role. Because epidural servicerequires the skills of an anaesthesiologist (or anaesthetist), as well as resuscitationequipment and drugs, not all rural or small community hospitals offer the service.42, 43
This may help to explain why in eastern and southeastern Ontario in 2003 epiduralswere used in 23.6% of vaginal births in small community hospitals, but teaching andlarge community hospitals had rates of 65.0% and 58.7% respectively.42 These hospi-tals are more likely to have anaesthesiologists available “in house” or on call 24 hoursa day.44, 45
Giv
ing
Birt
h in
Can
ada:
A R
egio
nal P
rofil
e
8
How Epidural Rates Were Calculated
Strict definitions were used to define eligible cases for epidural use. Furtherdetails are provided in the technical notes found in Appendix B at the end of thisreport. Rates and confidence intervals are for regions with at least 75,000 people.
• These data are from CIHI’s Hospital Morbidity Database.• The results are based on where patients live, not where they are treated.• The 95% confidence intervals for epidural rates (whether vaginal or all delivery
types) tend to be wider (i.e. the rate estimate is less precise) for regions thatuse this procedure less frequently in a given year and also in smaller regions.For example, the epidural rate for vaginal delivery in Toronto is estimated
to be accurate within± 0.64% 19 times out of 20. The rate in theEastern Region ofNewfoundland andLabrador is estimatedto be accurate within± 3.9% 19 times out of 20.
0
10
20
30
40
50
60
70
B.C.
Alta
.
Sask
.
Ont.
Que.
N.B.
N.S.
P.E.
I.
N.L.
Y.T.
N.W
.T.
Nun.
Cana
da
Epid
ural
Rate
(per
100
Vag
inal
Deliv
eries
)
4
FIGU
RE
Notes: The province of Manitoba, Calgary health region (Alberta), Chinook regional health authority (Alberta), and Palliser regional health authority (Alberta)were excluded due to underreporting. Nunavut birth counts may differ from the territory’s published data due to the incomplete capture of some births occurringamong Nunavut women in CIHI’s Discharge Abstract Database.Source: Hospital Morbidity Database, CIHI
Variation of Epidural UseThe use of epidurals in labour varied across the countryfrom a low of 4% of vaginal deliveries in the NorthwestTerritories and Nunavut to a high of 60% in Quebec in2001–2002. Among the provinces, Prince Edward Islandhad the lowest rate of epidural use (17%).

When Nature Needs HelpOnce labour has begun and decisions about pain management have been made,birthing the baby becomes the focus. In some cases, this means monitoring the baby and supporting the mother as she naturally enters the final stages of labour and delivery. In other cases, however, decisions may need to be made about how to assist the birthing process. This section highlights information on selected methods used to assist vaginal deliveries. The following section includes a profile of caesarean section births.
Pulling Instead of PushingShrouded in secrecy when first invented in the 1600s, forceps and other forms of assisted delivery are now widely used around the world. The failure of labour to progress, fetal compromise, and maternal congestive heart failure or cerebral vascular malformations are some of the reasons that may lead clinicians to consider using forceps or vacuum extraction to help deliver babies vaginally.46, 47
9
Giving
Birth in C
anada Tod
ay
5FI
GURE
A
A
B
B
Notes: The province of Manitoba, Calgary health region (Alberta),Chinook regional health authority (Alberta), and Palliser regional health authority (Alberta) were excluded due to underreporting.Nunavut birth counts may differ from the territory’s published data due to the incomplete capture of some births occurring among Nunavutwomen in CIHI’s Discharge Abstract Database.Source: Hospital Morbidity Database, CIHI
Epidural Rates in 2001–2002 (per 100 Vaginal Deliveries)
Data Suppressed Above Canadian AverageBelow Canadian Average Same as Canadian Average
Epidural Use in CanadaThe map below shows the variation in epidural rates among health regions with a population of 75,000or more. Most regions had rates that were significantly different than the Canadian average (45.4%).

In 2000–2001, forceps and/or vacuum extraction was used in 16% of vaginal deliveries,down slightly from 17% in 1991–1992.21 While the overall rate of assisted deliverieshas been relatively stable over the last decade, the methods of choice have changed.Forceps-assisted deliveries are on the decline. They accounted for 11% of vaginaldeliveries in the early 1990s, but only 6% in 2000–2001. Vacuum extraction rates have risen over the same period, from 7% to 11% of vaginal births. Similar trends have also been noted in the U.S.,20 Australia,58 New Zealand,59 and England.35
Experts suggest that this shift may reflect changes in clinical guidelines, particularly for mid-forceps deliveries,60–63 as well as concern about medico-legal issues.64, 65
Giv
ing
Birt
h in
Can
ada:
A R
egio
nal P
rofil
e
10
Tools of the Trade
Forceps are smooth metal instruments, similar in shape to long narrow spoons.Applied to the baby’s head, they are used to extract the baby using tractionand/or rotation. Several types of forceps have been developed (e.g. Kielland,Simpson, Tucker-McLane) since Chamberlen’s invention of the forceps in the1600s.46 With vacuum extraction, a plastic or metal cup is attached to the baby’shead. Suction is then used to guide the baby out of the birth canal.
Neither procedure is risk-free.48–53 For over two hundred years, there has been debate about the indications and safety of forceps, particularly mid-forceps for the management of problems in the second stage of labour.54
Likewise, in the late 1990s, the U.S. Food and Drug Administration and HealthCanada issued warnings about the potential for rare but life-threatening complications (e.g. subgaleal hemorrhage) possibly associated with vacuum-assisted deliveries.55, 56
Nevertheless, used appropriately, these instruments can help to ensure a successful outcome for mothers and their babies.54 Groups such as the Society of Obstetricians and Gynaecologists of Canada have weighed the evidence about when assisted delivery should—and should not—be used. Their latest guidelines47 suggest that the indications for vacuum extraction are generally similar to those for forceps deliveries. Other factors that have been suggested as playing a role in instrument choice include tradition and training of physicians,57 as well as the mother’s health profile (e.g. presence of pregnancy-induced hypertension).52

11
Giving
Birth in C
anada Tod
ay
While the national trend is clear, there are substantial variationsin practice across the country. Rates for assisteddelivery (using eitherinstrument) varied morethan eleven-fold—from2.5% of vaginal deliveriesfor women from Nunavutto 28.2% for residents of the Eastern Region of Newfoundland and Labrador.
Understanding Assisted Delivery Rates
These calculations are adapted from methods developed for the CanadianPerinatal Surveillance System.21 Further details are provided in the technical notes located at the end of this report (see Appendix B). • Assisted delivery data are from CIHI’s Hospital Morbidity Database
for 2000–2001.• Hospital patients whose vaginal delivery was assisted by means of forceps,
vacuum extractor, or both were included. Deliveries in which an abortive or caesarean procedure was provided were excluded.
• Rates and confidence intervals are reported for regions with at least 75,000 people.
• The results are based on where patients live, not where they are treated.• The overall assisted delivery rate for each health region may not equal
the sum of the ratio for use of forceps and vacuum extraction as some patientshave both procedures.
• The 95% confidence intervals for assisted delivery (whether overall or individualinstrument) tend to be wider (i.e. the rate estimate is less precise) for regionsthat perform less assisted deliveries in a given year or in health regions that are smaller in population. For example, Waterloo Region–Wellington–Dufferin
District Health Council’soverall assisted deliveryrate is estimated to beaccurate within ± 0.93%19 times out of 20. Therate in Zone 5 (CapeBreton) of Nova Scotia isestimated to be accuratewithin ± 2.3% 19 timesout of 20.
02468
101214161820
1991
–199
2
1992
–199
3
1993
–199
4
1994
–199
5
1995
–199
6
1996
–199
7
1997
–199
8
1998
–199
9
1999
–200
0
2000
–200
1
Rate
(pe
r 100
Hos
pita
l Vag
inal
Del
iver
ies)
Overall Assisted Deliveries Forceps Vacuum Extraction
National Trends in Assisted DeliveryThe graph below shows the rates of use of forceps, vacuum extraction, and overall assisted deliveries (bothtechniques combined) in Canada between 1991–1992 and2000–2001. Although the overall rate of assisted deliverywas relatively stable during this period, forceps-assisteddeliveries decreased by 45%, while vacuum extractionincreased by 56%.
6
FIGU
RE
Source: Health Canada, Canadian Perinatal Health Report 2003 (Ottawa: Minister of Public Works and Government Services Canada, 2003).
FF

Giv
ing
Birt
h in
Can
ada:
A R
egio
nal P
rofil
e
120 5 10 15 20 25 30 35
Rate (per 100 Vaginal Deliveries)
Health and Community Services Eastern Region (N.L.)Richmond (B.C.)
Essex–Kent and Lambton DHC (Ont.)Calgary Health Region (Alta.)
Region 3 (N.B.)Région du Bas-Saint-Laurent (Que.)
Région de Québec (Que.)East Central Health (Alta.)
Vancouver (B.C.)Northern Shores DHC (Ont.)
Saskatoon Regional Health Authority (Sask.)Zone 4 (N.S.)
Région de la Mauricie et Centre-du-Québec (Que.)Région de Laval (Que.)
Capital Health (Alta.)Health and Community Services St. John’s Region (N.L.)
Fraser South (B.C.)Région de la Chaudière–Appalaches (Que.)
Toronto DHC (Ont.)Région du Saguenay–Lac-Saint-Jean (Que.)
Région de l’Estrie (Que.)Halton–Peel DHC (Ont.)
Région des Laurentides (Que.)Aspen Regional Health Authority (Alta.)
Champlain DHC (Ont.)Fraser East (B.C.)
Health and Community Services Western Region (N.L.)Waterloo Region–Wellington–Dufferin DHC (Ont.)
Région de l’Outaouais (Que.)Fraser North (B.C.)
Simcoe York DHC (Ont.)North Shore/Coast Garibaldi (B.C.)
Southeastern Ontario (Ont.)Regina Qu’Appelle Regional Health Authority (Sask.)
Niagara DHC (Ont.)Région de la Montérégie (Que.)
Région de la Gaspésie-Îles-de-la-Madeleine (Que.)Thames Valley DHC (Ont.)
Zone 1 (N.S.)Health and Community Services Central Region (N.L.)
Région de la Côte-Nord (Que.)Zone 5 (N.S.)
Région de l’Abitibi–Témiscamingue (Que.)Durham–Haliburton–Kawartha and Pine Ridge DHC (Ont.)
Region 1 (N.B.)Chinook Regional Health Authority (Alta.)
Yukon TerritoryPrince Albert Parkland Regional Health Authority (Sask.)
Northwestern Ontario DHC (Ont.)North West (B.C.)
Region 2 (N.B.)Région de Montréal-Centre (Que.)
Hamilton DHC (Ont.)Zone 2 (N.S.)
Central Vancouver Island (B.C.)Zone 6 (N.S.)
Palliser Health Region (Alta.)North Vancouver Island (B.C.)
Thompson/Cariboo (B.C.)Region 6 (N.B.)
Région de Lanaudière (Que.)East Kootenay (B.C.)
Okanagan (B.C.)Algoma–Cochrane–Manitoulin and Sudbury DHC (Ont.)
Winnipeg Regional Health Authority (Man.)Peace Country Health (Alta.)
Kootenay–Boundary (B.C.)South Vancouver Island (B.C.)
Grand River DHC (Ont.)P.E.I.
Grey Bruce Huron Perth DHC (Ont.)Northwest Territories
Zone 3 (N.S.)Central Regional Health Authority (Man.)
Interlake Regional Health Authority (Man.)Nunavut
David Thompson Regional Health Authority (Alta.)Northern Interior (B.C.)
Assisted Deliveries in CanadaThe figure below shows rates of assisted delivery (forceps and vacuum extraction combined) acrossCanada’s health regions with a population of 75,000 or more in 2000–2001. The rates (shown by thedots) are estimated to be accurate to within the range shown by the horizontal bars 19 times out of20. The solid line shows the national average (16.2 per 100 vaginal deliveries). Most regions weresignificantly different than the Canadian average. Regional rates varied more than eleven-fold—from2.5 per 100 vaginal deliveries in Nunavut to 28.2 in Newfoundland and Labrador’s Eastern Region.
7FI
GURE
Note: Nunavut birth counts may differ from the territory’s published data due to the incompletecapture of some births occurring among Nunavutwomen in CIHI’s Discharge Abstract Database.Source: Hospital Morbidity Database, CIHI

13
Both types of assisted delivery were used across all health regions, but the extent to which each was used varied. Forceps-assisted delivery rates, for example, rangedfrom 1% to 16%, whereas vacuum-extraction rates ranged from 1% to 21%. When we compared the use of one tool over the other we found that, in general, healthregions that had a high use of forceps tended to have a lower use of vacuum extraction, and vice versa.
The reasons for variationsin assisted deliveries are notentirely clear. We do know, however, that performingassisted deliveries requireshighly skilled health pro-fessionals,47 as well as theavailability of certain typesof equipment and otherresources.66 These andother factors, such asphysician preference,67
changes in the medico-legal environment,68, 69
and recent research findings,49, 51, 52 may drivesome of the regional variations in use.
Who Does What?Most physicians who deliver babies have per-formed both forceps- andvacuum-assisted vaginaldeliveries. According tothe 2001 National FamilyPhysician WorkforceSurvey by the College of
Family Physicians of Canada (known as the Janus Project), almost 18% of family physi-cians provided intrapartum care (i.e. delivered babies). Among those who did so:†
• 94% reported that they used vacuum extraction as part of their obstetrical practice; • 50% reported using forceps (i.e. mid-forceps/rotations or low forceps); • half (50%) of those whose practice served small-town, rural, or remote/isolated
communities said that they used multiple types of assisted delivery, compared with40% of those who served inner-city, urban, and suburban communities; and
• about two-thirds (67%) of family physicians who used forceps were aged 45 or older.
Giving
Birth in C
anada Tod
ay
FF
0
5
10
15
20
25
Régi
on d
u Ba
s-Sa
int-L
aure
nt (Q
ue.)
Sask
atoo
n Re
gion
al He
alth
Auth
ority
(Sas
k.)Ré
gion
du
Sagu
enay
–La
c-Sa
int-J
ean
(Que
.)
East
Cen
tral H
ealth
(Alta
.)
Régi
on d
e la M
auric
ie et
Ce
ntre
-du-
Québ
ec (Q
ue.)
Zone
6 (N
.S.)
Wat
erlo
o Re
gion
–Well
ingt
on–D
uffe
rinDH
C (O
nt.)
Zone
2 (N
.S.)
Esse
x Ke
nt a
nd La
mbt
on D
HC (O
nt.)
Tham
es V
alley
DHC
(Ont
.)
Cana
da
Rate
(per
100
Vag
inal
Deliv
eries
)
Forceps Vacuum
Forceps Use Versus Vacuum ExtractionEven within provinces, there are substantial variations in how often forceps and vacuum extraction are used. The graph below shows 10 large health regions with the greatest differences in rates of use between the twoprocedures. The national rates of forceps and vacuumextraction are 6% and 11%, respectively.
8
FIGU
RE
Source: Hospital Morbidity Database, CIHI
† Multiple answers were permitted, therefore, percentages do not add to 100 percent.
Giv
ing
Birt
h in
Can
ada:
A R
egio
nal P
rofil
e
14
Similar data are not available for obstetricians, but a 1996 survey of obstetrical residency programs in Canada and the U.S.70 found that nearly all programs taught assisted deliveries. Three in five programs, however, had assisted delivery rates of 10% or less. In addition, 36% of the programs said that they no longer taught midpelvic-assisted deliveries. The belief that caesarean deliveries were safer alternativesand litigation concerns were the explanations cited most often for this decision.Changes in teaching practices of residency programs have led some to speculate about whether assisted vaginal birthing skills will be a thing of the past for those practicing obstetrical care.71, 72
A more recent survey65 of Canadian obstetrics/gynaecology residents found that almost all who graduated in 2000 intended to use both techniques (97% for vacuumextraction and 93% for forceps). Those surveyed did, however, express concern aboutusing these tools, including: • not feeling skillfully prepared (48%); • concern about maternal/neonatal complications (48%);• worry about the medical-legal implications (44%); and• concern about maintaining their skills (28%).
To Episiotomy or Not? Episiotomies, first described around the 1740s, are incisions made to enlarge the vaginal opening in the late stages of labour.73 They were initially proposed as a means of preventing the painful and sometimes chronic complications associated with vaginal tearing. These problems were thought to include pain, sexual problems,and incontinence.46, 74 Although it may seem odd to prevent tearing by making a cut, it was thought that a smooth, controlled incision was less painful and easier to repairthan an uncontrolled tear.
Until the 1970s, most women having their first delivery had episiotomies.46, 73 However, the tide has turned over the last 20 years. Studies have shown that episiotomies do not meaningfully protect mothers from severe tears, pain, pelvic muscle injury, or sexual problems—and may actually make some of these problems worse.74, 77–80
Did you Know?
According to CIHI data, about 1 in 20 womenwho had a vaginal birth between 1999–2000and 2001–2002 experienced a third- orfourth-degree tear associated with the birth.To avoid tears, many pregnant women arenow encouraged to massage their perineum(the skin between the vagina and the anus)in the weeks leading up to birth to enable itto stretch farther during birth.75 In addition,slow delivery of the head is encouraged.76

Over this period, episiotomy rates in Canada have decreased.According to the Canadian Perinatal Health Report 2003,recently published by Health Canada,21
episiotomies were performed in about half of all vaginal births (49.1%) in 1991–1992. By 2000–2001, the procedure was performed in less than a quarter of all births (23.8%). Rates have also fallen in other countries, such as the U.S.20, 81
When Nature Needs Even More Help—Caesarean Births in CanadaToday, more than one in five births in Canada are delivered by caesarean section—a rate that has steadily increased since the mid-1990s. More women are having caesarean sections for the first time (primary caesarean section), and fewer women are delivering vaginally following previous caesarean section births.82
It’s My First . . .Relatively few expectantmothers (10.5% in2001–2002) have had a caesarean section before.Among those without a history of caesarean sections in Canada in2001–2002, just over 16% had a caesarean section delivery, up from 14% in 1998–1999.Canada’s current primarycaesarean section rate iscomparable with that ofother countries. The U.S.,England and Wales, andNorthern Ireland, forexample, all report rates of 16 to 17%.82, 83
Giving
Birth in C
anada Tod
ay
15
0 5 10 15 20
Y.T.
N.L.
P.E.I.
N.S.
Sask.
B.C.
Episiotomy Rate (per 100 Vaginal Deliveries)
Episiotomy Rates in Selected JurisdictionsEpisiotomy rates varied widely across the country, as the graph below shows.
9
FIGU
RE
Note: To maximize comparability, the graph includes only those jurisdictions that reported using the ICD-10-CA/CCI coding standards in 2001–2002.Source: Discharge Abstract Database, CIHI
0
5
10
15
20
25
1979
–198
019
80–1
981
1981
–198
219
82–1
983
1983
–198
419
84–1
985
1985
–198
619
86–1
987
1987
–198
819
88–1
989
1989
–199
019
90–1
991
1991
–199
219
92–1
993
1993
–199
419
94–1
995
1995
–199
619
96–1
997
1997
–199
819
98–1
999
1999
–200
020
00–2
001
2001
–200
2Caes
area
n Se
ctio
n Ra
te (p
er 1
00 D
elive
ries)
Caesarean Rates in Canada: An All-Time HighThe figure below shows how the rate of caesarean sections increased in Canada between 1979–1980 and 2001–2002. It reached an all-time high of 22.5% of in-hospital deliveries in 2001–2002.
10
FIGU
RE
Sources: Statistics Canada (1979–1980 to 1993–1994); Hospital MorbidityDatabase, CIHI (1994–1995 to 2001–2002).

Among large health regions in Canada, 2001–2002 primary caesarean section ratesvaried more than three-fold—from 7.6 in Nunavut to 25.5 in Region 6 (Bathurst area)of New Brunswick. Similarly, among the provinces, rates varied from 12.4 in Manitoba to21.0 in Prince Edward Island.
Variations in maternal characteristics, obstetrical practices, and other factors at theregional level may contribute to these differences. For example, older maternal age,parity, pre-pregnancy weight, and weight gain during pregnancy have all been shownto be associated with primary caesarean deliveries.61 Likewise, concerns about perinealdamage from vaginal delivery, fetal presentation and number (e.g. breech and multiplebirths), and how often technologies such as electronic fetal monitoring and labourinduction are used (as well as how clinicians respond to them) have been shown toinfluence the decision to perform a caesarean section.84–86
UnderstandingPrimary Caesarean Rates
The primary caesareansection rate was definedas deliveries by caesareansection as a percentageof all deliveries towomen who have not had a caesareandelivery previously.Rates and confidenceintervals are provided for regions with at least75,000 people. Theserates are unadjusted for factors that may beassociated with primarycaesareans, such as the mother’s age andhow many children
she has had previously (parity).61 Further details are provided in the technicalnotes found at the end of this report.
• These data are from CIHI’s Hospital Morbidity Database for the year 2001–2002.• The results are based on where patients live, not where they were treated.• Primary caesarean section rates include only women who have not had a
caesarean section before. The total number of deliveries (denominator)excludes patients where an abortive procedure was provided.
• The 95% confidence intervals for primary caesarean section rates tend to bewider (i.e. the rate estimate is less precise) for smaller regions. For example,Toronto’s rate is estimated to be accurate within ± 0.5%, 19 times out of 20. The rate in Zone 2 (Kentville area) of Nova Scotia is estimated to be accuratewithin ± 2.7%, 19 times out of 20.
Giv
ing
Birt
h in
Can
ada:
A R
egio
nal P
rofil
e
16
0
2
4
6
8
10
12
14
16
18
Prim
ary
Caes
area
n Se
ctio
n Ra
te
(per
100
Hos
pita
l Del
iver
ies
Amon
g W
omen
With
out a
His
tory
of C
aesa
rean
)
1998–1999 1999–2000 2000–2001 2001–2002
Primary Caesarean Section Rate on the RiseIn Canada in 2001–2002, just over 16% (16.5%) of babies born to mothers without a history of caesareansection were delivered by primary caesarean section, up almost three percentage points from 1998–1999.Canada’s rate is similar to that in England and Wales(16.7%), Northern Ireland (17%), and the U.S. (16.9%).
11
FIGU
RE
Source: Hospital Morbidity Database, CIHI
FF
Giving
Birth in C
anada Tod
ay
17
12FI
GURE
A
A
B
B
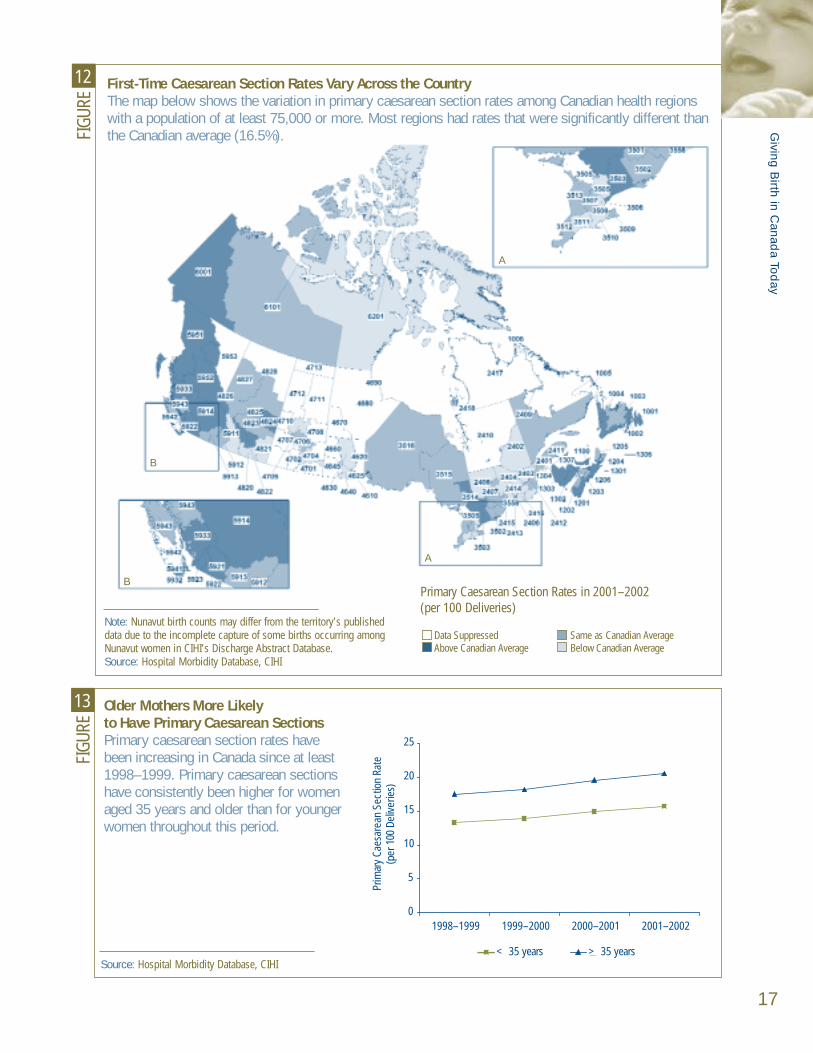
First-Time Caesarean Section Rates Vary Across the CountryThe map below shows the variation in primary caesarean section rates among Canadian health regionswith a population of at least 75,000 or more. Most regions had rates that were significantly different thanthe Canadian average (16.5%).
Primary Caesarean Section Rates in 2001–2002 (per 100 Deliveries)
Data Suppressed Same as Canadian AverageAbove Canadian Average Below Canadian Average
0
5
10
15
20
25
1998–1999 1999–2000 2000–2001 2001–2002
Prim
ary
Caes
area
n Se
ctio
n Ra
te
(per
100
Del
iverie
s)
< 35 years > 35 years
Older Mothers More Likely to Have Primary Caesarean SectionsPrimary caesarean section rates have been increasing in Canada since at least1998–1999. Primary caesarean sectionshave consistently been higher for womenaged 35 years and older than for youngerwomen throughout this period.
13
FIGU
RE
Source: Hospital Morbidity Database, CIHI
Note: Nunavut birth counts may differ from the territory’s publisheddata due to the incomplete capture of some births occurring amongNunavut women in CIHI’s Discharge Abstract Database.Source: Hospital Morbidity Database, CIHI
After a Caesarean Section . . .About 10% of women who give birth per year in Canada have had a previous caesarean section. These women face the choice between a repeat caesarean section and a vaginal birth, known as a VBAC (vaginal birth after caesarean). Here too, there is a debate about which type of birth is best in particular situations.87
The Society of Obstetricians and Gynaecologists of Canada note that most women,even a large proportion of those who have previously had caesarean sections, can safely deliver vaginally. In fact, they suggest that successful vaginal births after caesarean sections typically carry lower health risks for mothers and requireshorter hospital stays than having an optional surgical delivery.87
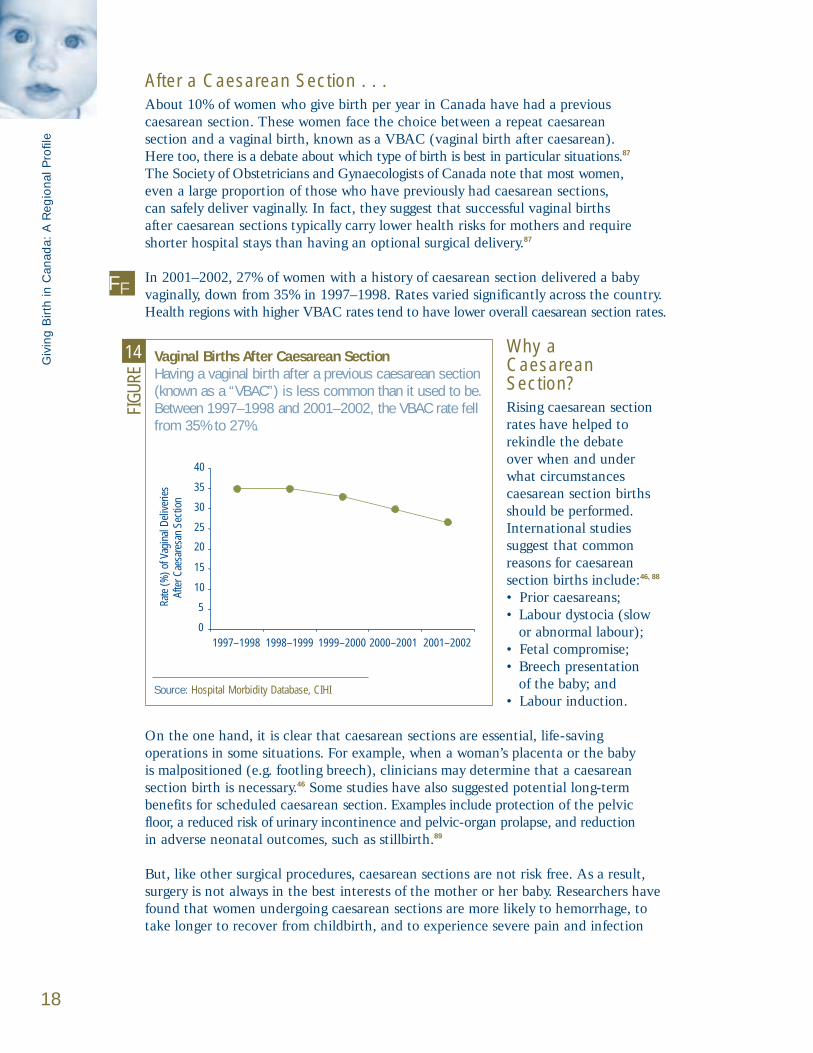
In 2001–2002, 27% of women with a history of caesarean section delivered a baby vaginally, down from 35% in 1997–1998. Rates varied significantly across the country.Health regions with higher VBAC rates tend to have lower overall caesarean section rates.
Why a Caesarean Section?Rising caesarean sectionrates have helped to rekindle the debate over when and under what circumstances caesarean section birthsshould be performed.International studies suggest that common reasons for caesarean section births include:46, 88
• Prior caesareans; • Labour dystocia (slow
or abnormal labour);• Fetal compromise;• Breech presentation
of the baby; and• Labour induction.
On the one hand, it is clear that caesarean sections are essential, life-saving operations in some situations. For example, when a woman’s placenta or the baby is malpositioned (e.g. footling breech), clinicians may determine that a caesarean section birth is necessary.46 Some studies have also suggested potential long-term benefits for scheduled caesarean section. Examples include protection of the pelvic floor, a reduced risk of urinary incontinence and pelvic-organ prolapse, and reduction in adverse neonatal outcomes, such as stillbirth.89
But, like other surgical procedures, caesarean sections are not risk free. As a result,surgery is not always in the best interests of the mother or her baby. Researchers havefound that women undergoing caesarean sections are more likely to hemorrhage, totake longer to recover from childbirth, and to experience severe pain and infection
Giv
ing
Birt
h in
Can
ada:
A R
egio
nal P
rofil
e
18
0
5
10
15
25
20
30
35
40
Rate
(%) o
f Vag
inal
Del
iver
ies
Afte
r Cae
sare
san
Sect
ion
1997–1998 1998–1999 1999–2000 2000–2001 2001–2002
Vaginal Births After Caesarean SectionHaving a vaginal bir th after a previous caesarean section(known as a “VBAC”) is less common than it used to be.Between 1997–1998 and 2001–2002, the VBAC rate fellfrom 35% to 27%.
14
FIGU
RE
Source: Hospital Morbidity Database, CIHI
FF

than women who deliver vaginally.88, 90, 91 In the long term, studies have shown thatwomen who have had a caesarean delivery are at increased risk for certain reproduc-tive problems (e.g. ectopic pregnancies), serious problems pertaining to the placenta (e.g. placenta accreta, placenta previa), or uterine rupture.89
Babies born by caesarean section may also be at increased risk. For example, respiratory problems following birth88, 89 and difficulties initiating breastfeeding92, 93
have been highlighted as concerns for infants born by caesarean section.
What’s the Right Number?Not without controversy, the World Health Organization (WHO) has recommended that caesarean sections, including both primary and repeat surgery, should occur in no more than 5 to 15% of all births.29 Some experts suggest that rates that are less than 5% may indicate inadequate availability and/or access to emergency obstetric care, whereas rates above 15% may suggest overuse of the procedure for non-emergency reasons.100
Internationally, however, many countries exceed this rate.101 For example, Brazil, Hong Kong, and Chile all have caesarean section rates of more than 25%.101 Othercountries have rates just under or just over the WHO target (for example 13.5% inthe Netherlands and 17.6% in Denmark).102 Within Canada, there is a similar range. Some regions have rates below 15%, but others have rates that are more than doublethis level.
Giving
Birth in C
anada Tod
ay
19
Birthing a Breech Baby
How best to deliver the 3 to 4% of babies who are in a breech position (bottomfirst) at term has been debated for many years.94 Although some suggest thatavoiding the problem by turning the baby before birth (external cephalic version,or ECV) is preferable, it remains unclear when this maneuver should be per-formed and how effective it is.95–97
In 1997, 121 hospitals in 26 countries participated in a landmark study conductedby researchers at the University of Toronto. The study, the Term Breech Trial,included women with a single baby at term in breech position.94 Intended to lastfive years, the study was stopped two years early after researchers discoveredthat the babies of women who had a planned caesarean section were significantlyless likely to die or experience poor outcomes.94 Likewise, when researchers com-bined the results of this study with two others in a meta-analysis, they found thatthe risk of perinatal or neonatal death was reduced for planned caesarean sec-tions (relative risk 0.29), but maternal morbidity was higher (relative risk 1.3).98
In direct response to the Term Breech Trial, the Society of Obstetricians andGynaecologists of Canada recommended that all term breech singletons bedelivered by planned caesarean section.17 These findings have left many practi-tioners concerned that competency in vaginal breech birth may become a skill of the past.99
FF

In addition to clinical and demographic factors, birthing practices may be linked to theprevailing philosophy of maternity care. For example, research suggests that people liv-ing in countries with low caesarean section rates may be more likely to consider birthas a normal physiological process and maintain low intervention rates in general.103
Other cultural factors that have been found to contribute to differences in caesarean section rates include:• How health care is delivered (e.g. caesarean section rates are often higher in private
hospitals than in public hospitals);104
• Concern for malpractice litigation;60
• Socioeconomic and demographic factors;105
• Social prestige;106
• Fear of pain during vaginal delivery;107 and• A belief in astrological fortunes and favourable dates.108, 109
Giv
ing
Birt
h in
Can
ada:
A R
egio
nal P
rofil
e
20
Caesareans on Demand—A Growing Trend?
Commentators worldwide have speculated that one of the reasons for rising caesarean section rates is the so-called “too posh to push” phenomenon wherewomen, particularly wealthier women, request surgery even though they do nothave recognized medical indications.110 A few high-profile cases and statisticsshowing higher caesarean section rates in private hospitals in Australia, Brazil, and other countries have fueled the debate.104, 111 Researchers in the UK, however,have recently rejected this argument. They found that women in the lowestincome group were less likely to have elective caesarean sections, but there was no significant difference between women in the four other income quintiles.112
Given the potential risks associated with caesarean sections for non-medical indications, requests may raise clinical and ethical dilemmas for health care professionals. In March 2004, the Society forObstetricians and Gynaecologists of Canada (SOGC) issued a statement against providing caesarean sections on demand.113 They argue that a decision to perform surgery should be based on medical indications.

To adapt to life outside their mother’s womb, most babiesrequire little more than a clear airway and adequate warmthimmediately after birth.114 To make sure, newborns typicallyundergo a series of screening tests and assessments.
These procedures help to determine howquickly babies will go home from hospitaland whether they need additional care.Twenty years ago, the average length ofstay was about five days.120 Since then,there has been a trend towards shorterhospital stays for maternal/newborn care.21
Many possible reasons have been cited to explain this trend, including requestsfrom mothers to be discharged early andeconomic factors.121–123
When Baby Arrives
Baby’s First Check-Up
Within the first few minutes to days of life, a number of screening tests and assessmentsare conducted. For example, at one and five minutes after birth,care providers typically assess a newborn’s condition using theApgar test.46 Developed in 1952,the test assesses a baby’s heart rate, respiratory effort, muscle tone, reflex irritability (response to stimuli), and skin colour.115
Shortly after birth, newborns are weighed and measured.116
Typically, they also receive a vitamin K injection to protectagainst bleeding disorders and an antibiotic ointment to protect against eye infection and blindness.114
Between days two and six, thenewborn’s heel is pricked to obtain a small amount of blood,which is used to screen for twocongenital conditions.117, 118
Phenylketonuria (PKU), an enzyme deficiency, affects approximately one in 12,000 livebirths.118, 119 Congenital hypothy-roidism, a hormone deficiencyaffecting normal development, is found in approximately one in 3,500 live births.117

Too Early, Too SmallWhile most newborns are healthy, prematurebabies are at higher risk of immediate and longer-term health problemsbecause growth and development in the lastweeks of pregnancy is critical to an infant’shealth. Researchersestimate that preterm birth (before 37 completedweeks) contributes to 60 to 80% of deathsamong infants withoutcongenital anomalies inindustrialized countries.124
Short-term complicationsassociated with pretermdelivery may include respiratory distress syn-drome or intraventricularhemorrhage.124 Prematuredelivery has also beenassociated with cerebralpalsy and other lifelong health complications.124, 125
The rate of prematurebirth is on the rise, both in Canada and elsewhere.Health Canada estimatesthat 7.6% of babies wereborn prematurely in 2000,up from 6.6% in 1991.21
International comparisonsshow similar increases. Forexample, the preterm birthrate in the U.S. was 12.1%in 2002, compared to10.6% in 1990.82 Someexperts suggest that mostof the increase in pretermbirth has been due to a greater number of interventions such as pre-term induction andcaesarean deliveries at 34 to 36 weeks’ gestation.126
Giv
ing
Birt
h in
Can
ada:
A R
egio
nal P
rofil
e
22
0
1
2
3
4
5
6
B.C.
Alta
.
Sask
.
Man
.
Ont.
Que.
N.B.
N.S.
P.E.
I.
N.L.
Y.T.
N.W
.T.
Nun.
Cana
da
Aver
age
Leng
th o
f Stay
(Day
s)
Vaginal Deliveries Without InstrumentsVaginal Deliveries With InstrumentsCaesarean Section Deliveries
Maternal Length of Stay by Type of DeliveryMothers tend to stay longer in the hospital after a caesareansection than a vaginal delivery. In Canada in 2000–2001, the average length of stay after a vaginal delivery with orwithout the use of instruments (e.g. forceps or vacuumextractor) was 2.8 and 2.4 days respectively, compared to 4.6 days after a caesarean section. Alberta had the lowest average length of stay for all three types of deliveries,while Newfoundland and Labrador had the highest.
15
FIGU
RE
012345678
1991
–199
2
1992
–199
3
1993
–199
4
1994
–199
5
1995
–199
6
1996
–199
7
1997
–199
8
1998
–199
9
1999
–200
0
2000
–200
1Pret
erm
Birt
hs (p
er 1
00 L
ive
Birth
s)
16
FIGU
RE
Early Babies More CommonOver a 10-year period, the preterm birth rate in Canadaincreased from 6.6 per hundred live births in 1991–1992 to 7.6 in 2000–2001. Among the provinces and territories,preterm birth rates ranged from 5.8% in Prince Edward Island to 10.4% in Nunavut in 2000–2001. The graph below shows rates of preterm bir th (bir ths before 37 weeks’ gestation) in Canada.
Notes: 1) Data from Ontario are excluded because of data quality concerns. 2) Live births with unknown gestational age are also excluded.Source: Health Canada, Canadian Perinatal Health Report 2003 (Ottawa: Minister of Public Works and Government Services Canada, 2003).
Note: Nunavut birth counts may differ from the territory’s published data due to the incomplete capture of some births occurring among Nunavut women in CIHI’sDischarge Abstract Database.Source: Hospital Morbidity Database, CIHI

Common reasons for these interventions include maternal and fetal conditions such as hypertension and fetal compromise.
Preventing preterm births remains challenging.128 A variety of factors, too broad todescribe in detail in this report, have been linked to preterm birth. Examples include:• Previous preterm delivery;129–131
• Multiple pregnancy21, 126 (twins, triplets, and higher order multiple births are often delivered early, but singleton births continue to account for over 80% of preterm births.21);
• Maternal demographic characteristics, including age;82, 130, 132 socioeconomic status;130
and behavioural risk factors, such as cigarette smoking128, 133 and alcohol consump-tion;134 and
• Reproductive tract infections, such as bacterial vaginosis and sexually transmitted diseases.132
Some experts suggest that new technologies,such as early ultrasounddating of gestational age,screening tests for high-risk medical conditions,preterm induction, andpreterm caesarean deliverywithout labour, may alsoencourage or enable earlierdelivery of babies.126, 134
Yet intervening when a baby is preterm remains a difficult choice, involving balancing early risks (e.g. fetalmorbidity or mortality) and benefits with future consequences, such as the potentialfor longer-term morbidity and mortality.126
Weighing In
Premature babies are often smaller than average. Most babiesborn in Canada (92% in 2001) weigh between2,500 and 4,499 g atbirth, or five-and-a-halfto almost ten pounds.Low birth weight (lessthan 2,500 g) may resultfrom preterm birth orrestricted intrauterinegrowth and may beassociated with perinatalillness, neonatal death,and long-term complica-tions.127 About 6% ofbabies were in this category in 2001.
When B
aby A
rrives
23
0
1
2
3
4
5
6
1997 1998 1999 2000 2001
Perc
ent o
f live
birt
hs
17
FIGU
RE
Trends in Low Birth WeightThe figure below shows the Canadian trend in low-bir th-weight babies.
Note: Live births with a birth weight less than 2,500 g, expressed as a percentage of all live births with known birth weight.Source: Canadian Vital Statistics Birth Database, Statistics Canada
Did You Know?
Trends in low birth weight and preterm birth may be affected by changes in birth registration. In particular, it has been suggested that births ofinfants near the borderline of viability (for example,those below 22 weeks’ gestational age and/or near or below 500 g) are more likely to be recorded now than in the past.128, 135

When Newborns Need Intensive Care Newborns who need more monitoring or care than regular maternity wards can provide may be admitted to neonatal intensive care units (NICUs). Neonatologists,nurses, and other highly trained specialists who form the neonatal health care teamprovide care for these fragile babies.136
The likelihood of admission to a NICU has risen slightly over the past decade inCanada. In 2001–2002, CIHI data show that 14.4% of newborns spent time in aNICU, up from 12.6% in 1994–1995. The number of admissions per year rose by about 1,500 over this period.
Admission rates were highest for low-birth-weight babies. Almost two-thirds (62%) of babies weighing 1,500 to 2,499 g at birth were admitted to a NICU in 2001–2002. Rates were even higher for the smallest babies: 82% of those weighing less than 1,500 g spent time in a NICU. These findings parallel those from a study of 17 tertiary-
level NICUs in Canada,which found that mostbabies (53%) weighed less than 2,500 g uponadmission and that nearlytwo-thirds (65%) wereadmitted at less than 38 weeks’ gestation.137
Twenty percent of terminfants treated in theNICU (infants born at 37 or more weeks’ gesta-tion) were admitted forcongenital anomalies.
Low-birth-weight babies also spent more days in the NICU. In 2001–2002 the medianlength of stay in a NICU was two days. However, very-low-birth-weight andlow-birth-weight (1,500 g to 2,500 g) babies spent a median of 23 days and 7 days respectively in thistype of unit.
Giv
ing
Birt
h in
Can
ada:
A R
egio
nal P
rofil
e
24
0102030405060708090
1994
–199
5
1995
–199
6
1996
–199
7
1997
–199
8
1998
–199
9
1999
–200
0
2000
–200
1
2001
–200
2NICU
Adm
issio
n Ra
te (p
er 1
00 N
ewbo
rns)
Less than 1,500 g 1,500 g to 2,499 g2,500 g or more Overall
How Often Are Babies Admitted to the NICU?Newborns are now more likely to be admitted to neonatal intensive care units (NICUs) than in the past. The admission rate increased slightly from 12.6% of newborns in 1994–1995 to 14.4% in 2001–2002.Newborns admitted to this type of care tended to havelower bir th weights than other babies.
18
FIGU
RE
Note: Manitoba, Quebec, and the territories were excluded from the analysisbecause comparable data were not available.Source: Discharge Abstract Database, CIHI

Hospital Stays After BirthJaundice, feeding problems, sepsis, and dehydration were just a few of the health problemsthat caused almost four in 100 babies to be admitted to hospital within 28 days of theirbirth in 2000–2001. Emergency department visits are even more common. About one
in 10 Ontario newbornsvisited an ED within 28days of birth in 2002–2003.The most common reasonsfor ED visits were jaundice and feeding problems.
As with other types of care, there are significantregional variations in post-natal hospital admissionrates across the country.For example, the rate was just over 1% of livebirths in the Région de Québec but over 8% in East Kootenay, British Columbia.
Improved Survival Chances
Advances in knowledge and technology mean that premature babies who wouldhave died during or soon after birth just a few decades ago may now survive,although some may have long-term health problems.138
At 5.2 per 1,000 live births in 2001, Canada has achieved one of the lowest infant mortality rates in the world.139 Today, nearly all (99%) newborns admitted to a Canadian NICU survive until discharge, including even the smallest babies.In 2001–2002, 89% of very-low-birth-weight babies survived until discharge.
A recent study suggests, however, that the survival of babies in NICUs variesbetween hospitals. In a study of 19,265 newborns admitted to 17 tertiary-levelNICUs in Canada, researchers found that the mean risk-adjusted mortality rate was 4%, but there were three-fold differences between institutions. The most common conditions associated with death were preterm births, outborn status (infants not born at the admitting hospital), and congenital anomalies.140
When B
aby A
rrives
25
Other47%
Dehydration2%
Inadequate Weight Gain
1%
Sepsis4%
Feeding Problems
6%
Jaundice39%
Why Are Babies Admitted to Hospital?Most babies go home shortly after bir th, but some need further care. The chart below shows why babies were admitted to hospital within 28 days of bir th in Canada in 2000–2001. The leading reason was jaundice (39%).
19
FIGU
RE
Notes: 1) Postnatal hospital admissions include any newborn admitted to anacute care hospital within 28 days after birth. Newborns who were transferred to another institution; newborns with an initial length of hospital stay greater than 20 days; newborns with a birth weight of less than 1,000 g; or newborns who were discharged on the same day of birth or were admitted for day surgery were excluded. 2) Manitoba and Quebec were excluded from the analysisbecause comparable data were not available. 3) “Other” reasons include a variety of conditions such as convulsions, respiratory conditions, fever,esophagitis, etc. 4) Percentages may not add to 100% due to rounding.Source: Discharge Abstract Database, CIHI
FF

Giv
ing
Birt
h in
Can
ada:
A R
egio
nal P
rofil
e
26
Postnatal Hospital Admissions per 100 Live Births
0 2 4 6 8 10 12
East Kootenay (B.C.)Nunavut
Northwest TerritoriesEast Central Health (Alta.)
Aspen Regional Health Authority (Alta.)Région du Saguenay–Lac-Saint-Jean (Que.)
Peace Country Health (Alta.)Kootenay/Boundary (B.C.)
Northwestern Ontario DHC (Ont.)Regina Qu’Appelle Regional Health Authority (Sask.)
David Thompson Regional Health Authority (Alta.)Région de l’Estrie (Que.)
Région 6 (N.B.)Région de la Côte-Nord (Que.)
Yukon TerritoryOkanagan (B.C.)
Calgary Health Region (Alta.)North West (B.C.)
Central Vancouver Island (B.C.)Région 1 (N.B.)
Capital Health (Alta.)Région de la Mauricie et Centre-du-Québec (Que.)
Région de l’Abitibi-Témiscamingue (Que.)Région du Bas-Saint-Laurent (Que.)
Prince Albert Parkland Regional Health Authority (Sask.)Chinook Regional Health Authority (Alta.)
Essex–Kent and Lambton DHC (Ont.)Région de Lanaudière (Que.)
Niagara DHC (Ont.)Palliser Health Region (Alta.)
Halton-Peel DHC (Ont.)Région des Laurentides (Que.)
Zone 1 (N.S.)Région de la Gaspésie–Îles-de-la-Madeleine (Que.)
Région de la Chaudière-Appalaches (Que.)Health and Community Services Western Region (N.L.)
Grand River DHC (Ont.)Grey Bruce Huron Perth DHC (Ont.)
Fraser North (B.C.)North Vancouver Island (B.C.)
Vancouver (B.C.)Southeastern Ontario (Ont.)
Thompson/Cariboo (B.C.)North Shore/Coast Garibaldi (B.C.)
Simcoe York DHC (Ont.)Durham–Haliburton–Kawartha and Pine Ridge DHC (Ont.)
Région 3 (N.B.)Fraser East (B.C.)
Health and Community Services Eastern Region (N.L.)Toronto DHC (Ont.)
Northern Interior (B.C.)Région de Laval (Que.)
Health and Community Services Central Region (N.L.)Richmond (B.C.)
Waterloo Region–Wellington–Dufferin DHC (Ont.)Prince Edward Island
Northern Shores DHC (Ont.)Région de la Montérégie (Que.)
Algoma–Cochrane–Manitoulin and Sudbury DHC (Ont.)Fraser South (B.C.)
Health and Community Services St. John’s Region (N.L.)Région 2 (N.B.)
Hamilton DHC (Ont.)Zone 2 (N.S.)
South Vancouver Island (B.C.)Saskatoon Regional Health Authority (Sask.)
Zone 6 (N.S.)Région de l’Outaouais (Que.)
Champlain DHC (Ont.)Zone 5 (N.S.)
Thames Valley DHC (Ont.)Région de Montréal-Centre (Que.)
Zone 4 (N.S.)Zone 3 (N.S.)
Région de Québec (Que.)
Hospital Admissions After BirthFor every 100 live bir ths in Canada, almost four babies were admitted to hospital within 28 days of bir th in 2000–2001 (as shown by the solid line). The graph below compares postnatal admissionrates among health regions with a population of at least 75,000. Results (shown by the dots) are estimated to be accurate to within the range shown by the horizontal bars, 19 times out of 20.
20
FIGU
RE
Notes: Postnatal hospital admissions include anynewborn admitted to an acute care hospital within28 days after birth. Newborns who were transferredto another institution; newborns with an initial lengthof hospital stay greater than 20 days; newborns witha birth weight of less than 1,000 g; or newbornswho were discharged on the same day of birth or were admitted for day surgery were excluded. Data include only jurisdictions that submit compre-hensively to the database; therefore, data fromManitoba was excluded from the analysis. Nunavutbirth counts may differ from the territory’s publisheddata due to the incomplete capture of some births occurring among Nunavut women in CIHI’sDischarge Abstract Database.Source: Discharge Abstract Database, CIHI;Ministère de la Santé et des Services sociauxQuébec, Banque de données sur les hospitalisationsdu système Med-Écho.

Possible explanations for these differences in admission rates include:
• How long mothers and babies typically stay in hospital: Implications of today’s shorter lengths of stay after childbirth have received considerable attention.123, 141–147 While there is some evidence to suggest that length of stay and neonatal hospital admissions are related,145–148 other studies,149, 150 including a systematic review,151 suggest there is insufficient evidence to link early postpartum discharge and outcomes such as re-hospitalizations.
• Quality of care before and after discharge: Babies who have health problemsthat are not detected during their original hospital stay or that are related to carethey did (or did not) receive may be more likely to need further care.152
• Patterns of practice and services available after discharge: Integration betweenhospital and community health services once new mothers leave hospital has alsobeen a topic of study.142, 143 Some communities have designed follow-up protocols and programs that respond to health needs, such as challenges in breastfeeding, in the community rather than in hospital. For example, almost 90% of new mothers who had delivered a baby vaginally without complications in Montréal in 1999reported receiving a telephone call from a community health centre worker within two weeks of discharge from hospital, although only 9% were contacted within 24 hours following discharge.143 Most felt that the information they received duringthe call or home visit was consistent with what they were told in hospital prior todischarge, but 16% disagreed.
• Other factors: According to The Ontario Mother and Infant Survey (TOMIS),153
how mothers rate their infant’s health, how much help they anticipate at home following discharge, their concerns about infant care behaviour, and whether newborns are seen by health professionals for a physical check-up after their initialdischarge from hospital may also be associated with postnatal hospital admission.
• Underlying health status: Differences in the health status of babies at birth mayalso explain why they return to hospital.21, 154
To the extent that these and other factors differ across the country, they may contribute to variations in regional rates of postnatal hospital admission.
When B
aby A
rrives
27
Calculating Postnatal Hospital Admissions
Calculations for postnatal hospital admission rates are adapted from methodsdeveloped by the Canadian Perinatal Surveillance System.21 Rates and confidence intervals are provided for health regions with at least 75,000 people.Further details are provided in the technical notes found at the end of this report. • Indicator results are based on data from CIHI’s Discharge Abstract Database
for 2000–2001.• The results are based on where patients live, not where they are treated.• Postnatal hospital admissions include any admission to an acute care hospital
within 28 days after birth. Newborns transferred to another institution after birth;having a length of hospital stay greater than 20 days; having a birth weight of less than 1,000 g or a missing weight value; discharged on the day of birth;and having day surgery admissions were excluded.
• The 95% confidence intervals for postnatal hospital admissions tend to be wider (the rate estimate is less precise) for smaller regions. For example, the rate for Calgary Health Region in Alberta is estimated to be accurate within ± 0.38%, 19 times out of 20. The rate in St. John’s Newfoundland andLabrador is estimated to be accurate within ± 0.75%, 19 times out of 20.


Childbirth is a central event in cultures around the world. Historically, it was surrounded by a rich and diverse collection of superstitions, customs, and traditions. Some of those traditions reflect practicalefforts to aid delivery of the baby and alleviate the mother’s pain and discomfort. Comparatively recent developments in medicine,
technology, and public health have laid the foundation forthe major evolution inbirthing practices thatwe have witnessed in the past century.
This report documents thecurrent state of maternaland infant health careacross Canada. The vastmajority of today’s babies(99%) are born in hospi-tals. About a fifth aredelivered via caesareansection, a higher level than ever before. Yet this overall rate masks significant variations fromregion to region across thecountry. Likewise, there are important differencesin how often pain manage-ment, episiotomies, forceps,vacuum extraction, andother interventions areused in childbirth. In addition, relationshipsappear to exist between
rates of use for certain procedures and delivery methods. For example, where forcepsuse is low, vacuum extraction tends to be high, and vice versa. Similarly, one reasonfor higher rates of caesarean births may be fewer vaginal births after caesarean sections.
Looking Back, Looking Ahead
21
FIGU
RE
Regional Variations There are wide variations in obstetrical care across the country. The chart below shows Canadian rates for eight indicators of care, as well as the range in rates between the regions with a population of 75,000people or more that have the lowest and highest rates.For details on each of these indicators, see the relevantsection in the report.
Notes:* Among vaginal deliveries only§ Excludes Chinook, Palliser, and Calgary regions‡ Excludes Manitoba† Excludes Central Vancouver Island¥ Among live-born infants greater than 1,000 g admitted within 28 days of birthSource: Compiled by CIHI.
Canada Lowest Highest(%) (%) (%)
Epidurals*§ ‡(2001–2002) 45.4 3.9 74.6
Assisted Delivery* 16.2 2.5 28.2(2000–2001)
Forceps* (2000–2001) 6.1 0.9 15.6
Vacuum Extraction* 10.6 1.0 21.0(2000–2001)
Caesarean Section† 22.5 9.2 31.5(2001–2002)
Primary† (2001–2002) 16.5 7.6 25.5
Repeat† (2001–2002) 73.2 39.3 93.0
Postnatal Hospital 3.5 1.4 8.4Admissions¥ ‡ (2000–2001)

These variations are likely due to a complex set of factors, not all of which are well understood. Examplesinclude patient demographics (e.g. age at time of giving birth), maternal and infant health and other characteristics, clinician preferences and training, and the availability of specialized resources.We hope that by providing data onmaternal and infant care for healthregions across the country, we will spark interest in understanding local rate variations and the extent to whichthese and many other factors may drive regional variations in the use of interventions.
Giv
ing
Birt
h in
Can
ada:
A R
egio
nal P
rofil
e
30
Watch for More
So far, the “Giving Birth in Canada”series of reports has looked at theproviders of maternal and infant care(first report in the series) and at howmaternal and infant care varies acrossthe country (this report). The nextstep is considering how much it coststo provide health care for mothersand their babies. Check our Web site(www.cihi.ca) for news of this report.
31
What We Know• The rate of perinatal and neonatal mortality in Canada.• The extent to which labour induction, epidurals, assisted vaginal deliveries, and caesarean
sections are performed in Canada at the provincial/territorial and/or regional level.• The rate at which women have first caesarean section births.• The trend in preterm birth rates over the past decade.• The national rate of admissions and mortality among neonatal intensive care units (NICUs).• Regional rates of postnatal hospital admissions within the first 28 days of life and the
major causes of admissions.
What We Don’t Know• To what extent are assisted reproductive technologies (ART) used across Canada? How
many live births in Canada were the result of ART? What proportion of those births were multiple births?
• What are the principal causes of variation in birthing practices (e.g. use of forceps/vacuumextraction, epidurals, induction, and caesarean section) across regions? What contribution do factors such as physician preferences and training, patient preferences, and best-practiceguidelines make to these rates?
• How many caesarean sections are planned and how many are done on an emergency basis? What is the impact of patient demand on caesarean section rates?
• What is the “right” rate at which these birthing practices should be performed? When does a lower rate suggest better care or poorer access to services? When does a higher rate suggest overuse or better access to care?
• Have shorter lengths of stay for mothers following birth caused an increase in the rates at which infants experience adverse events (e.g. dehydration and jaundice) after birth? (Or are these events now quantifiable but not increasing?)
What’s Happening• ICD-10-CA/CCI coding standards, soon to be adopted across Canada, will provide more
detailed information about where, why, and how labour induction is performed across Canada.• The Ontario Hospital Association has been validating The Maternity Patient Experience
Survey, which is designed to capture the mother’s experiences before, during, and after delivery.The information derived from the survey will provide a more in-depth picture of maternity care in both free-standing and general hospitals across Canada. The preliminary report of thematernity pilot will be available by mid-September 2004.
• Currently, the Maternal Infant and Reproductive Health Research Unit at the University ofToronto is coordinating a multicentre randomized controlled trial comparing early externalcephalic version (ECV) (34 to 36 weeks’ gestation) with delayed ECV (≥ 37 weeks’ gestation) to see whether beginning ECV at earlier gestational age will decrease the rate of caesarean section births without any increase in the rate of preterm birth or serious fetal complications.
• The Society of Obstetricians and Gynaecologists of Canada met in June 2004 to develop a position paper concerning on-demand caesarean sections.
• In July 2004, the Society of Obstetricians and Gynaecologists of Canada released updated guidelines on vaginal birth after caesarean section.
• In a study currently underway, Canadian Neonatal Network researchers are examining how differences in clinical practices among Canadian NICUs affect outcomes of sick newborn infants, as well as how the resources needed to provide this care may affect quality of care.


33
AFF
Appendix A
Fast Facts—List of Data Tables and Figures1 Epidural Rate for All Deliveries and Vaginal Deliveries by Health Region,
Canada, 2001–20022 Assisted Delivery Rate (Overall) by Health Region, Canada, 2000–20013 Assisted Delivery Rate (Forceps) by Health Region, Canada, 2000–20014 Assisted Delivery Rate (Vacuum Extraction) by Health Region, Canada, 2000–20015 Caesarean Section Rate by Health Region, Canada, 2001–20026 Primary and Repeat Caesarean Section Rate by Health Region, Canada, 2001–20027 Primary Caesarean Section Rate by Age Group (< 35 Years, ≥ 35 Years) by Health
Region, Canada, 2001–20028 Vaginal Birth After Caesarean (VBAC) Section Rate by Health Region,
Canada, 2001–20029 Postnatal Hospital Admissions by Health Region, Canada, 2000–2001
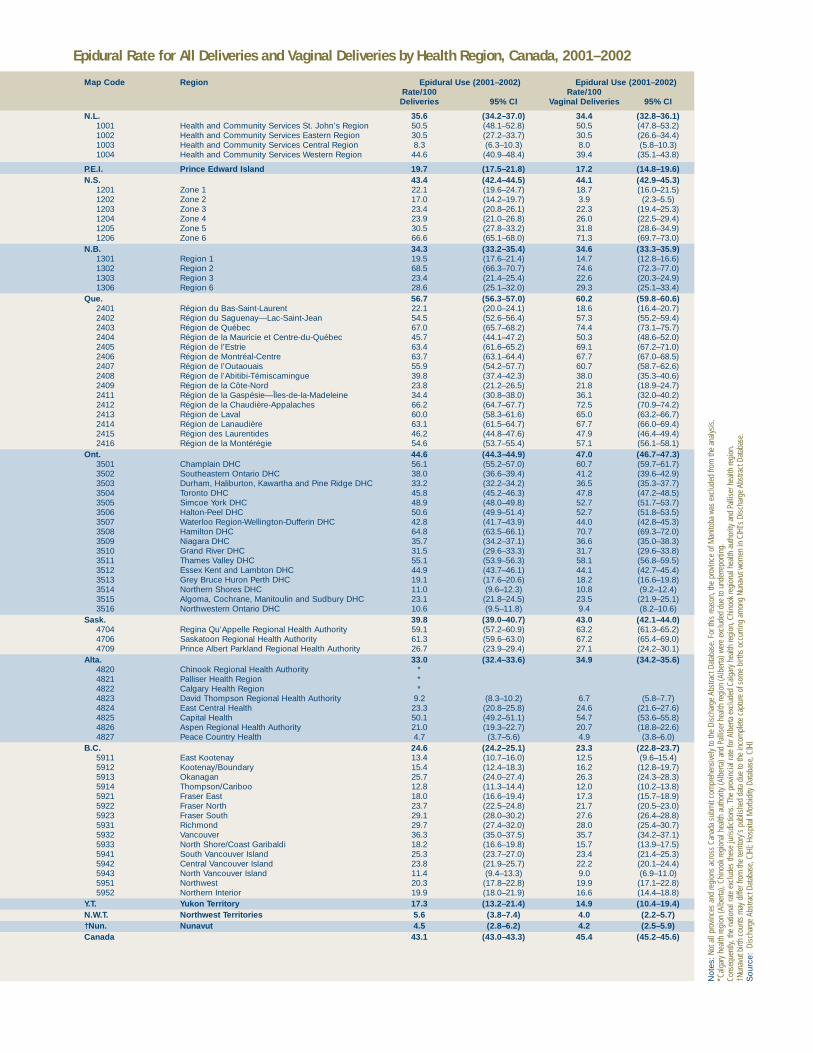
Epidural Rate for All Deliveries and Vaginal Deliveries by Health Region, Canada, 2001–2002
Map Code Region Epidural Use (2001–2002) Epidural Use (2001–2002)Rate/100 Rate/100 Deliveries 95% CI Vaginal Deliveries 95% CI
N.L. 35.6 (34.2–37.0) 34.4 (32.8–36.1)1001 Health and Community Services St. John’s Region 50.5 (48.1–52.8) 50.5 (47.8–53.2)1002 Health and Community Services Eastern Region 30.5 (27.2–33.7) 30.5 (26.6–34.4)1003 Health and Community Services Central Region 8.3 (6.3–10.3) 8.0 (5.8–10.3)1004 Health and Community Services Western Region 44.6 (40.9–48.4) 39.4 (35.1–43.8)
P.E.I. Prince Edward Island 19.7 (17.5–21.8) 17.2 (14.8–19.6)N.S. 43.4 (42.4–44.5) 44.1 (42.9–45.3)
1201 Zone 1 22.1 (19.6–24.7) 18.7 (16.0–21.5)1202 Zone 2 17.0 (14.2–19.7) 3.9 (2.3–5.5)1203 Zone 3 23.4 (20.8–26.1) 22.3 (19.4–25.3)1204 Zone 4 23.9 (21.0–26.8) 26.0 (22.5–29.4)1205 Zone 5 30.5 (27.8–33.2) 31.8 (28.6–34.9)1206 Zone 6 66.6 (65.1–68.0) 71.3 (69.7–73.0)
N.B. 34.3 (33.2–35.4) 34.6 (33.3–35.9)1301 Region 1 19.5 (17.6–21.4) 14.7 (12.8–16.6)1302 Region 2 68.5 (66.3–70.7) 74.6 (72.3–77.0)1303 Region 3 23.4 (21.4–25.4) 22.6 (20.3–24.9)1306 Region 6 28.6 (25.1–32.0) 29.3 (25.1–33.4)
Que. 56.7 (56.3–57.0) 60.2 (59.8–60.6)2401 Région du Bas-Saint-Laurent 22.1 (20.0–24.1) 18.6 (16.4–20.7)2402 Région du Saguenay—Lac-Saint-Jean 54.5 (52.6–56.4) 57.3 (55.2–59.4)2403 Région de Québec 67.0 (65.7–68.2) 74.4 (73.1–75.7)2404 Région de la Mauricie et Centre-du-Québec 45.7 (44.1–47.2) 50.3 (48.6–52.0)2405 Région de l’Estrie 63.4 (61.6–65.2) 69.1 (67.2–71.0)2406 Région de Montréal-Centre 63.7 (63.1–64.4) 67.7 (67.0–68.5)2407 Région de l’Outaouais 55.9 (54.2–57.7) 60.7 (58.7–62.6)2408 Région de l’Abitibi-Témiscamingue 39.8 (37.4–42.3) 38.0 (35.3–40.6)2409 Région de la Côte-Nord 23.8 (21.2–26.5) 21.8 (18.9–24.7)2411 Région de la Gaspésie—Îles-de-la-Madeleine 34.4 (30.8–38.0) 36.1 (32.0–40.2)2412 Région de la Chaudière-Appalaches 66.2 (64.7–67.7) 72.5 (70.9–74.2)2413 Région de Laval 60.0 (58.3–61.6) 65.0 (63.2–66.7)2414 Région de Lanaudière 63.1 (61.5–64.7) 67.7 (66.0–69.4)2415 Région des Laurentides 46.2 (44.8–47.6) 47.9 (46.4–49.4)2416 Région de la Montérégie 54.6 (53.7–55.4) 57.1 (56.1–58.1)
Ont. 44.6 (44.3–44.9) 47.0 (46.7–47.3)3501 Champlain DHC 56.1 (55.2–57.0) 60.7 (59.7–61.7)3502 Southeastern Ontario DHC 38.0 (36.6–39.4) 41.2 (39.6–42.9)3503 Durham, Haliburton, Kawartha and Pine Ridge DHC 33.2 (32.2–34.2) 36.5 (35.3–37.7)3504 Toronto DHC 45.8 (45.2–46.3) 47.8 (47.2–48.5)3505 Simcoe York DHC 48.9 (48.0–49.8) 52.7 (51.7–53.7)3506 Halton-Peel DHC 50.6 (49.9–51.4) 52.7 (51.8–53.5)3507 Waterloo Region-Wellington-Dufferin DHC 42.8 (41.7–43.9) 44.0 (42.8–45.3)3508 Hamilton DHC 64.8 (63.5–66.1) 70.7 (69.3–72.0)3509 Niagara DHC 35.7 (34.2–37.1) 36.6 (35.0–38.3)3510 Grand River DHC 31.5 (29.6–33.3) 31.7 (29.6–33.8)3511 Thames Valley DHC 55.1 (53.9–56.3) 58.1 (56.8–59.5)3512 Essex Kent and Lambton DHC 44.9 (43.7–46.1) 44.1 (42.7–45.4)3513 Grey Bruce Huron Perth DHC 19.1 (17.6–20.6) 18.2 (16.6–19.8)3514 Northern Shores DHC 11.0 (9.6–12.3) 10.8 (9.2–12.4)3515 Algoma, Cochrane, Manitoulin and Sudbury DHC 23.1 (21.8–24.5) 23.5 (21.9–25.1)3516 Northwestern Ontario DHC 10.6 (9.5–11.8) 9.4 (8.2–10.6)
Sask. 39.8 (39.0–40.7) 43.0 (42.1–44.0)4704 Regina Qu’Appelle Regional Health Authority 59.1 (57.2–60.9) 63.2 (61.3–65.2)4706 Saskatoon Regional Health Authority 61.3 (59.6–63.0) 67.2 (65.4–69.0)4709 Prince Albert Parkland Regional Health Authority 26.7 (23.9–29.4) 27.1 (24.2–30.1)
Alta. 33.0 (32.4–33.6) 34.9 (34.2–35.6)4820 Chinook Regional Health Authority *4821 Palliser Health Region *4822 Calgary Health Region *4823 David Thompson Regional Health Authority 9.2 (8.3–10.2) 6.7 (5.8–7.7)4824 East Central Health 23.3 (20.8–25.8) 24.6 (21.6–27.6)4825 Capital Health 50.1 (49.2–51.1) 54.7 (53.6–55.8)4826 Aspen Regional Health Authority 21.0 (19.3–22.7) 20.7 (18.8–22.6)4827 Peace Country Health 4.7 (3.7–5.6) 4.9 (3.8–6.0)
B.C. 24.6 (24.2–25.1) 23.3 (22.8–23.7)5911 East Kootenay 13.4 (10.7–16.0) 12.5 (9.6–15.4)5912 Kootenay/Boundary 15.4 (12.4–18.3) 16.2 (12.8–19.7)5913 Okanagan 25.7 (24.0–27.4) 26.3 (24.3–28.3)5914 Thompson/Cariboo 12.8 (11.3–14.4) 12.0 (10.2–13.8)5921 Fraser East 18.0 (16.6–19.4) 17.3 (15.7–18.9)5922 Fraser North 23.7 (22.5–24.8) 21.7 (20.5–23.0)5923 Fraser South 29.1 (28.0–30.2) 27.6 (26.4–28.8)5931 Richmond 29.7 (27.4–32.0) 28.0 (25.4–30.7)5932 Vancouver 36.3 (35.0–37.5) 35.7 (34.2–37.1)5933 North Shore/Coast Garibaldi 18.2 (16.6–19.8) 15.7 (13.9–17.5)5941 South Vancouver Island 25.3 (23.7–27.0) 23.4 (21.4–25.3)5942 Central Vancouver Island 23.8 (21.9–25.7) 22.2 (20.1–24.4)5943 North Vancouver Island 11.4 (9.4–13.3) 9.0 (6.9–11.0)5951 Northwest 20.3 (17.8–22.8) 19.9 (17.1–22.8)5952 Northern Interior 19.9 (18.0–21.9) 16.6 (14.4–18.8)
Y.T. Yukon Territory 17.3 (13.2–21.4) 14.9 (10.4–19.4)N.W.T. Northwest Territories 5.6 (3.8–7.4) 4.0 (2.2–5.7)†Nun. Nunavut 4.5 (2.8–6.2) 4.2 (2.5–5.9)Canada 43.1 (43.0–43.3) 45.4 (45.2–45.6)
Not
es:N
ot a
ll pr
ovin
ces
and
regi
ons
acro
ss C
anad
a su
bmit
com
preh
ensi
vely
to th
e Di
scha
rge
Abst
ract
Dat
abas
e. F
or th
is re
ason
, the
pro
vinc
e of
Man
itoba
was
exc
lude
d fro
m th
e an
alys
is.
*Cal
gary
hea
lth re
gion
(Alb
erta
), Ch
inoo
k re
gion
al h
ealth
aut
horit
y (A
lber
ta) a
nd P
allis
er h
ealth
regi
on (A
lber
ta) w
ere
excl
uded
due
to u
nder
repo
rting
. Co
nseq
uent
ly, th
e na
tiona
l rat
e ex
clud
es th
ese
juris
dict
ions
. The
pro
vinci
al ra
te fo
r Alb
erta
exc
lude
d Ca
lgar
y he
alth
regi
on, C
hino
ok re
gion
al h
ealth
aut
horit
y an
d Pa
llise
r hea
lth re
gion
. †N
unav
ut b
irth
coun
ts m
ay d
iffer
from
the
terri
tory
’s p
ublis
hed
data
due
to th
e in
com
plet
e ca
ptur
e of
som
e bi
rths
occu
rring
am
ong
Nuna
vut w
omen
in C
IHI’s
Dis
char
ge A
bstra
ct D
atab
ase.
Sou
rce:
Disc
harg
e Ab
stra
ct D
atab
ase,
CIH
I; Ho
spita
l Mor
bidi
ty D
atab
ase,
CIH
I
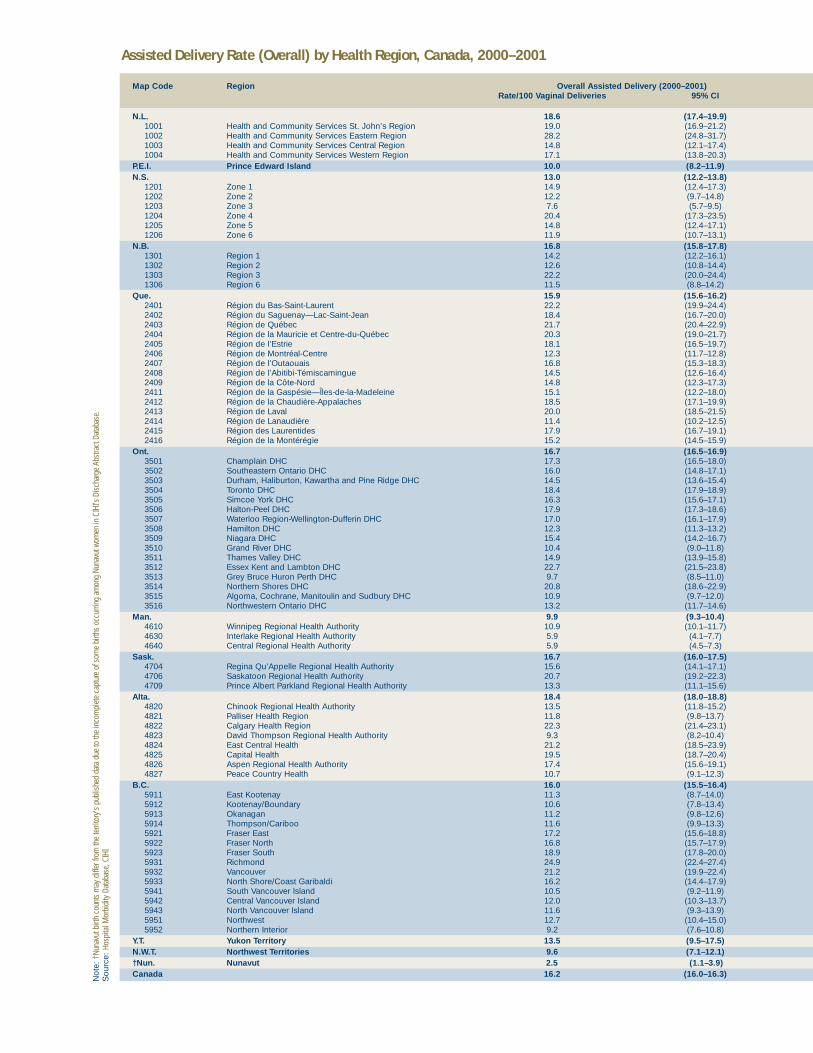
Assisted Delivery Rate (Overall) by Health Region, Canada, 2000–2001
Map Code Region Overall Assisted Delivery (2000–2001)Rate/100 Vaginal Deliveries 95% CI
N.L. 18.6 (17.4–19.9)1001 Health and Community Services St. John’s Region 19.0 (16.9–21.2)1002 Health and Community Services Eastern Region 28.2 (24.8–31.7)1003 Health and Community Services Central Region 14.8 (12.1–17.4)1004 Health and Community Services Western Region 17.1 (13.8–20.3)
P.E.I. Prince Edward Island 10.0 (8.2–11.9)N.S. 13.0 (12.2–13.8)
1201 Zone 1 14.9 (12.4–17.3)1202 Zone 2 12.2 (9.7–14.8)1203 Zone 3 7.6 (5.7–9.5)1204 Zone 4 20.4 (17.3–23.5)1205 Zone 5 14.8 (12.4–17.1)1206 Zone 6 11.9 (10.7–13.1)
N.B. 16.8 (15.8–17.8)1301 Region 1 14.2 (12.2–16.1)1302 Region 2 12.6 (10.8–14.4)1303 Region 3 22.2 (20.0–24.4)1306 Region 6 11.5 (8.8–14.2)
Que. 15.9 (15.6–16.2)2401 Région du Bas-Saint-Laurent 22.2 (19.9–24.4)2402 Région du Saguenay—Lac-Saint-Jean 18.4 (16.7–20.0)2403 Région de Québec 21.7 (20.4–22.9)2404 Région de la Mauricie et Centre-du-Québec 20.3 (19.0–21.7)2405 Région de l’Estrie 18.1 (16.5–19.7)2406 Région de Montréal-Centre 12.3 (11.7–12.8)2407 Région de l’Outaouais 16.8 (15.3–18.3)2408 Région de l’Abitibi-Témiscamingue 14.5 (12.6–16.4)2409 Région de la Côte-Nord 14.8 (12.3–17.3)2411 Région de la Gaspésie—Îles-de-la-Madeleine 15.1 (12.2–18.0)2412 Région de la Chaudière-Appalaches 18.5 (17.1–19.9)2413 Région de Laval 20.0 (18.5–21.5)2414 Région de Lanaudière 11.4 (10.2–12.5)2415 Région des Laurentides 17.9 (16.7–19.1)2416 Région de la Montérégie 15.2 (14.5–15.9)
Ont. 16.7 (16.5–16.9)3501 Champlain DHC 17.3 (16.5–18.0)3502 Southeastern Ontario DHC 16.0 (14.8–17.1)3503 Durham, Haliburton, Kawartha and Pine Ridge DHC 14.5 (13.6–15.4)3504 Toronto DHC 18.4 (17.9–18.9)3505 Simcoe York DHC 16.3 (15.6–17.1)3506 Halton-Peel DHC 17.9 (17.3–18.6)3507 Waterloo Region-Wellington-Dufferin DHC 17.0 (16.1–17.9)3508 Hamilton DHC 12.3 (11.3–13.2)3509 Niagara DHC 15.4 (14.2–16.7)3510 Grand River DHC 10.4 (9.0–11.8)3511 Thames Valley DHC 14.9 (13.9–15.8)3512 Essex Kent and Lambton DHC 22.7 (21.5–23.8)3513 Grey Bruce Huron Perth DHC 9.7 (8.5–11.0)3514 Northern Shores DHC 20.8 (18.6–22.9)3515 Algoma, Cochrane, Manitoulin and Sudbury DHC 10.9 (9.7–12.0)3516 Northwestern Ontario DHC 13.2 (11.7–14.6)
Man. 9.9 (9.3–10.4)4610 Winnipeg Regional Health Authority 10.9 (10.1–11.7)4630 Interlake Regional Health Authority 5.9 (4.1–7.7)4640 Central Regional Health Authority 5.9 (4.5–7.3)
Sask. 16.7 (16.0–17.5)4704 Regina Qu’Appelle Regional Health Authority 15.6 (14.1–17.1)4706 Saskatoon Regional Health Authority 20.7 (19.2–22.3)4709 Prince Albert Parkland Regional Health Authority 13.3 (11.1–15.6)
Alta. 18.4 (18.0–18.8)4820 Chinook Regional Health Authority 13.5 (11.8–15.2)4821 Palliser Health Region 11.8 (9.8–13.7)4822 Calgary Health Region 22.3 (21.4–23.1)4823 David Thompson Regional Health Authority 9.3 (8.2–10.4)4824 East Central Health 21.2 (18.5–23.9)4825 Capital Health 19.5 (18.7–20.4)4826 Aspen Regional Health Authority 17.4 (15.6–19.1)4827 Peace Country Health 10.7 (9.1–12.3)
B.C. 16.0 (15.5–16.4)5911 East Kootenay 11.3 (8.7–14.0)5912 Kootenay/Boundary 10.6 (7.8–13.4)5913 Okanagan 11.2 (9.8–12.6)5914 Thompson/Cariboo 11.6 (9.9–13.3)5921 Fraser East 17.2 (15.6–18.8)5922 Fraser North 16.8 (15.7–17.9)5923 Fraser South 18.9 (17.8–20.0)5931 Richmond 24.9 (22.4–27.4)5932 Vancouver 21.2 (19.9–22.4)5933 North Shore/Coast Garibaldi 16.2 (14.4–17.9)5941 South Vancouver Island 10.5 (9.2–11.9)5942 Central Vancouver Island 12.0 (10.3–13.7)5943 North Vancouver Island 11.6 (9.3–13.9)5951 Northwest 12.7 (10.4–15.0)5952 Northern Interior 9.2 (7.6–10.8)
Y.T. Yukon Territory 13.5 (9.5–17.5)N.W.T. Northwest Territories 9.6 (7.1–12.1)†Nun. Nunavut 2.5 (1.1–3.9)Canada 16.2 (16.0–16.3)N
ote:
†Nun
avut
birt
h co
unts
may
diff
er fr
om th
e te
rrito
ry’s
pub
lishe
d da
ta d
ue to
the
inco
mpl
ete
capt
ure
of s
ome
birth
s oc
curri
ng a
mon
g Nu
navu
t wom
en in
CIH
I’s D
isch
arge
Abs
tract
Dat
abas
e.S
ourc
e: H
ospi
tal M
orbi
dity
Dat
abas
e, C
IHI

Assisted Delivery Rate (Forceps) by Health Region, Canada, 2000–2001
Map Code Region Forceps-Assisted Delivery (2000–2001)Rate/100 Vaginal Deliveries 95% CI
N.L. 8.8 (7.8–9.7)1001 Health and Community Services St. John’s Region 8.7 (7.2–10.3)1002 Health and Community Services Eastern Region 11.7 (9.3–14.2)1003 Health and Community Services Central Region 9.4 (7.2–11.6)1004 Health and Community Services Western Region 8.1 (5.8–10.5)
P.E.I. Prince Edward Island 6.1 (4.7–7.6)N.S. 7.4 (6.8–8.1)
1201 Zone 1 9.8 (7.8–11.9)1202 Zone 2 10.3 (8.0–12.7)1203 Zone 3 4.4 (2.9–5.8)1204 Zone 4 3.9 (2.4–5.3)1205 Zone 5 3.8 (2.5–5.0)1206 Zone 6 8.9 (7.9–9.9)
N.B. 7.3 (6.6–8.0)1301 Region 1 2.7 (1.8–3.6)1302 Region 2 8.0 (6.6–9.5)1303 Region 3 13.2 (11.4–15.0)1306 Region 6 5.1 (3.2–6.9)
Que. 5.0 (4.8–5.1)2401 Région du Bas-Saint-Laurent 3.6 (2.6–4.6)2402 Région du Saguenay—Lac-Saint-Jean 3.0 (2.2–3.7)2403 Région de Québec 4.6 (4.0–5.2)2404 Région de la Mauricie et Centre-du-Québec 4.0 (3.4–4.7)2405 Région de l’Estrie 10.6 (9.3–11.8)2406 Région de Montréal-Centre 6.5 (6.1–6.9)2407 Région de l’Outaouais 4.6 (3.8–5.5)2408 Région de l’Abitibi-Témiscamingue 6.0 (4.7–7.3)2409 Région de la Côte-Nord 3.6 (2.3–4.9)2411 Région de la Gaspésie—Îles-de-la-Madeleine 3.0 (1.6–4.4)2412 Région de la Chaudière-Appalaches 2.9 (2.3–3.6)2413 Région de Laval 4.5 (3.7–5.3)2414 Région de Lanaudière 3.7 (3.0–4.4)2415 Région des Laurentides 3.5 (2.9–4.1)2416 Région de la Montérégie 4.4 (4.0–4.8)
Ont. 6.6 (6.4–6.7)3501 Champlain DHC 3.8 (3.4–4.2)3502 Southeastern Ontario DHC 4.3 (3.6–5.0)3503 Durham, Haliburton, Kawartha and Pine Ridge DHC 4.8 (4.3–5.4)3504 Toronto DHC 6.2 (5.9–6.5)3505 Simcoe York DHC 5.4 (5.0–5.9)3506 Halton-Peel DHC 5.2 (4.8–5.5)3507 Waterloo Region-Wellington-Dufferin DHC 12.8 (11.9–13.6)3508 Hamilton DHC 3.1 (2.6–3.6)3509 Niagara DHC 4.5 (3.8–5.3)3510 Grand River DHC 3.1 (2.3–3.9)3511 Thames Valley DHC 13.9 (13.0–14.8)3512 Essex Kent and Lambton DHC 15.6 (14.6–16.6)3513 Grey Bruce Huron Perth DHC 6.2 (5.1–7.2)3514 Northern Shores DHC 5.6 (4.4–6.8)3515 Algoma, Cochrane, Manitoulin and Sudbury DHC 3.0 (2.4–3.6)3516 Northwestern Ontario DHC 6.2 (5.2–7.3)
Man. 4.9 (4.5–5.3)4610 Winnipeg Regional Health Authority 5.7 (5.1–6.3)4630 Interlake Regional Health Authority 2.7 (1.5–3.9)4640 Central Regional Health Authority 1.5 (0.8–2.2)
Sask. 4.2 (3.8–4.6)4704 Regina Qu’Appelle Regional Health Authority 6.9 (5.9–8.0)4706 Saskatoon Regional Health Authority 4.3 (3.5–5.0)4709 Prince Albert Parkland Regional Health Authority 2.2 (1.2–3.2)
Alta. 6.3 (6.0–6.6)4820 Chinook Regional Health Authority 3.0 (2.2–3.9)4821 Palliser Health Region 1.5 (0.8–2.3)4822 Calgary Health Region 7.0 (6.5–7.5)4823 David Thompson Regional Health Authority 4.7 (4.0–5.5)4824 East Central Health 4.0 (2.7–5.3)4825 Capital Health 8.5 (7.9–9.1)4826 Aspen Regional Health Authority 5.1 (4.1–6.1)4827 Peace Country Health 1.1 (0.6–1.7)
B.C. 6.5 (6.2–6.7)5911 East Kootenay 0.9 (0.1–1.7)5912 Kootenay/Boundary 3.0 (1.5–4.6)5913 Okanagan 4.8 (3.9–5.8)5914 Thompson/Cariboo 4.0 (3.0–5.1)5921 Fraser East 8.5 (7.3–9.7)5922 Fraser North 7.0 (6.3–7.8)5923 Fraser South 5.7 (5.0–6.3)5931 Richmond 8.1 (6.5–9.7)5932 Vancouver 11.4 (10.5–12.4)5933 North Shore/Coast Garibaldi 5.3 (4.3–6.3)5941 South Vancouver Island 5.9 (4.8–6.9)5942 Central Vancouver Island 6.5 (5.3–7.8)5943 North Vancouver Island 3.7 (2.3–5.0)5951 Northwest 0.9 (0.2–1.5)5952 Northern Interior 3.4 (2.4–4.4)
Y.T. Yukon Territory *N.W.T. Northwest Territories 2.1 (0.9–3.3)†Nun. Nunavut *Canada 6.1 (6.0–6.1)
Not
e: Y
ukon
Terri
tory
and
Nun
avut
dat
a we
re e
xclu
ded
due
to s
mal
l num
bers
.†N
unav
ut b
irth
coun
ts m
ay d
iffer
from
the
terri
tory
’s p
ublis
hed
data
due
to th
e in
com
plet
e ca
ptur
e of
som
e bi
rths
occu
rring
am
ong
Nuna
vut w
omen
in C
IHI’s
Dis
char
ge A
bstra
ct D
atab
ase.
Sou
rce:
Hos
pita
l Mor
bidi
ty D
atab
ase,
CIH
I

Assisted Delivery Rate (Vacuum Extraction) by Health Region, Canada, 2000–2001
Map Code Region Vacuum-Assisted Delivery (2000–2001)Rate/100 Vaginal Deliveries 95% CI
N.L. 10.0 (9.1–11.0)1001 Health and Community Services St. John’s Region 10.5 (9.0–12.2)1002 Health and Community Services Eastern Region 16.8 (13.9–19.7)1003 Health and Community Services Central Region 5.6 (3.8–7.3)1004 Health and Community Services Western Region 8.9 (6.5–11.4)
P.E.I. Prince Edward Island 4.8 (3.5–6.1)N.S. 5.7 (5.1–6.2)
1201 Zone 1 5.3 (3.8–6.8)1202 Zone 2 2.2 (1.1–3.3)1203 Zone 3 3.4 (2.1–4.6)1204 Zone 4 16.7 (13.8–19.5)1205 Zone 5 11.1 (9.0–13.2)1206 Zone 6 3.1 (2.5–3.7)
N.B. 10.0 (9.2–10.8)1301 Region 1 11.9 (10.1–13.7)1302 Region 2 4.7 (3.5–5.8)1303 Region 3 9.4 (7.9–11.0)1306 Region 6 7.5 (5.3–9.8)
Que. 11.5 (11.2–11.8)2401 Région du Bas-Saint-Laurent 21.0 (18.8–23.2)2402 Région du Saguenay—Lac-Saint-Jean 16.5 (14.9–18.2)2403 Région de Québec 17.5 (16.3–18.6)2404 Région de la Mauricie et Centre-du-Québec 17.2 (16.0–18.5)2405 Région de l’Estrie 7.6 (6.6–8.7)2406 Région de Montréal-Centre 6.1 (5.7–6.4)2407 Région de l’Outaouais 13.0 (11.6–14.3)2408 Région de l’Abitibi-Témiscamingue 8.9 (7.3–10.4)2409 Région de la Côte-Nord 12.3 (10.0–14.7)2411 Région de la Gaspésie—Îles-de-la-Madeleine 12.1 (9.4–14.8)2412 Région de la Chaudière-Appalaches 15.8 (14.5–17.1)2413 Région de Laval 16.5 (15.1–17.9)2414 Région de Lanaudière 8.2 (7.2–9.2)2415 Région des Laurentides 15.4 (14.3–16.5)2416 Région de la Montérégie 11.1 (10.5–11.8)
Ont. 10.5 (10.4–10.7)3501 Champlain DHC 14.4 (13.7–15.2)3502 Southeastern Ontario DHC 12.1 (11.1–13.2)3503 Durham, Haliburton, Kawartha and Pine Ridge DHC 9.9 (9.1–10.7)3504 Toronto DHC 12.6 (12.2–13.1)3505 Simcoe York DHC 11.4 (10.7–12.0)3506 Halton-Peel DHC 13.4 (12.8–14.0)3507 Waterloo Region-Wellington-Dufferin DHC 4.8 (4.3–5.3)3508 Hamilton DHC 9.5 (8.6–10.3)3509 Niagara DHC 11.5 (10.4–12.7)3510 Grand River DHC 7.6 (6.4–8.8)3511 Thames Valley DHC 1.0 (0.8–1.3)3512 Essex Kent and Lambton DHC 7.3 (6.6–8.0)3513 Grey Bruce Huron Perth DHC 3.8 (2.9–4.6)3514 Northern Shores DHC 15.4 (13.6–17.3)3515 Algoma, Cochrane, Manitoulin and Sudbury DHC 8.3 (7.2–9.3)3516 Northwestern Ontario DHC 7.2 (6.1–8.3)
Man. 5.6 (5.1–6.0)4610 Winnipeg Regional Health Authority 5.8 (5.2–6.4)4630 Interlake Regional Health Authority 3.9 (2.4–5.3)4640 Central Regional Health Authority 4.6 (3.4–5.9)
Sask. 13.3 (12.7–14.0)4704 Regina Qu’Appelle Regional Health Authority 9.0 (7.8–10.2)4706 Saskatoon Regional Health Authority 18.5 (17.0–20.0)4709 Prince Albert Parkland Regional Health Authority 11.8 (9.7–14.0)
Alta. 12.8 (12.4–13.2)4820 Chinook Regional Health Authority 10.7 (9.1–12.2)4821 Palliser Health Region 10.3 (8.5–12.2)4822 Calgary Health Region 15.5 (14.8–16.2)4823 David Thompson Regional Health Authority 5.0 (4.2–5.8)4824 East Central Health 17.5 (15.0–20.0)4825 Capital Health 12.6 (11.9–13.3)4826 Aspen Regional Health Authority 13.7 (12.1–15.3)4827 Peace Country Health 9.8 (8.3–11.4)
B.C. 10.0 (9.6–10.3)5911 East Kootenay 10.4 (7.9–13.0)5912 Kootenay/Boundary 8.7 (6.1–11.3)5913 Okanagan 7.1 (6.0–8.2)5914 Thompson/Cariboo 8.4 (7.0–9.9)5921 Fraser East 9.9 (8.6–11.2)5922 Fraser North 10.0 (9.1–10.9)5923 Fraser South 13.4 (12.5–14.4)5931 Richmond 17.1 (14.9–19.3)5932 Vancouver 10.2 (9.3–11.1)5933 North Shore/Coast Garibaldi 11.4 (9.9–12.9)5941 South Vancouver Island 4.8 (3.8–5.7)5942 Central Vancouver Island 6.4 (5.1–7.6)5943 North Vancouver Island 8.5 (6.5–10.5)5951 Northwest 12.0 (9.7–14.2)5952 Northern Interior 6.6 (5.2–8.0)
Y.T. Yukon Territory 12.4 (8.6–16.3)N.W.T. Northwest Territories 7.7 (5.4–10.0)†Nun. Nunavut 1.9 (0.7–3.1)Canada 10.6 (10.5–10.8)
Not
e: †
Nuna
vut b
irth
coun
ts m
ay d
iffer
from
the
terri
tory
’s p
ublis
hed
data
due
to th
e in
com
plet
e ca
ptur
e of
som
e bi
rths
occu
rring
am
ong
Nuna
vut w
omen
in C
IHI’s
Dis
char
ge A
bstra
ct D
atab
ase.
Sou
rce:
Hos
pita
l Mor
bidi
ty D
atab
ase,
CIH
I

Caesarean Section Rate by Health Region, Canada, 2001–2002
Map Code Region Caesarean Section (2001–2002)% 95% CI
N.L. 26.6 (25.3–27.9)1001 Health and Community Services St. John’s Region 26.2 (24.2–28.3)1002 Health and Community Services Eastern Region 31.5 (28.2–34.8)1003 Health and Community Services Central Region 24.8 (21.8–27.9)1004 Health and Community Services Western Region 26.6 (23.2–29.9)
P.E.I. Prince Edward Island 27.9 (25.5–30.3)N.S. 25.3 (24.4–26.2)
1201 Zone 1 25.3 (22.6–27.9)1202 Zone 2 20.8 (17.9–23.8)1203 Zone 3 24.9 (22.2–27.5)1204 Zone 4 28.1 (25.1–31.1)1205 Zone 5 24.1 (21.6–26.6)1206 Zone 6 26.1 (24.7–27.4)
N.B. 26.6 (25.6–27.6)1301 Region 1 25.1 (23.1–27.2)1302 Region 2 25.1 (23.1–27.1)1303 Region 3 27.2 (25.1–29.3)1306 Region 6 29.8 (26.3–33.2)
Que. 19.5 (19.2–19.8)2401 Région du Bas-Saint-Laurent 19.8 (17.8–21.7)2402 Région du Saguenay—Lac-Saint-Jean 16.8 (15.3–18.2)2403 Région de Québec 19.7 (18.6–20.7)2404 Région de la Mauricie et Centre-du-Québec 19.5 (18.2–20.7)2405 Région de l’Estrie 15.0 (13.7–16.3)2406 Région de Montréal-Centre 21.0 (20.4–21.6)2407 Région de l’Outaouais 20.6 (19.1–22.0)2408 Région de l’Abitibi-Témiscamingue 17.2 (15.3–19.1)2409 Région de la Côte-Nord 20.4 (17.9–22.9)2411 Région de la Gaspésie—Îles-de-la-Madeleine 22.5 (19.4–25.6)2412 Région de la Chaudière-Appalaches 22.1 (20.7–23.4)2413 Région de Laval 20.3 (19.0–21.6)2414 Région de Lanaudière 19.1 (17.8–20.4)2415 Région des Laurentides 16.9 (15.9–18.0)2416 Région de la Montérégie 19.1 (18.4–19.7)
Ont. 22.9 (22.7–23.1)3501 Champlain DHC 22.5 (21.7–23.2)3502 Southeastern Ontario DHC 24.2 (23.0–25.4)3503 Durham, Haliburton, Kawartha and Pine Ridge DHC 25.8 (24.8–26.7)3504 Toronto DHC 24.0 (23.5–24.5)3505 Simcoe York DHC 23.0 (22.3–23.7)3506 Halton-Peel DHC 22.5 (21.9–23.1)3507 Waterloo Region-Wellington-Dufferin DHC 21.7 (20.8–22.6)3508 Hamilton DHC 21.6 (20.5–22.7)3509 Niagara DHC 22.8 (21.5–24.0)3510 Grand River DHC 19.2 (17.6–20.8)3511 Thames Valley DHC 18.9 (18.0–19.9)3512 Essex Kent and Lambton DHC 22.4 (21.4–23.4)3513 Grey Bruce Huron Perth DHC 20.1 (18.6–21.6)3514 Northern Shores DHC 28.7 (26.7–30.7)3515 Algoma, Cochrane, Manitoulin and Sudbury DHC 24.0 (22.6–25.3)3516 Northwestern Ontario DHC 21.9 (20.3–23.4)
Man. 18.2 (17.6–18.9)4610 Winnipeg Regional Health Authority 18.3 (17.4–19.2)4630 Interlake Regional Health Authority 17.1 (14.6–19.6)4640 Central Regional Health Authority 20.2 (18.0–22.3)
Sask. 18.4 (17.7–19.1)4704 Regina Qu’Appelle Regional Health Authority 15.2 (13.9–16.6)4706 Saskatoon Regional Health Authority 20.2 (18.9–21.6)4709 Prince Albert Parkland Regional Health Authority 14.2 (12.1–16.4)
Alta. 22.5 (22.1–23.0)4820 Chinook Regional Health Authority 20.9 (19.1–22.8)4821 Palliser Health Region 18.5 (16.3–20.7)4822 Calgary Health Region 23.6 (22.8–24.3)4823 David Thompson Regional Health Authority 22.9 (21.5–24.2)4824 East Central Health 27.6 (24.9–30.2)4825 Capital Health 21.9 (21.1–22.7)4826 Aspen Regional Health Authority 20.8 (19.1–22.4)4827 Peace Country Health 22.1 (20.3–24.0)
B.C. 27.1 (26.7–27.6)5911 East Kootenay 18.9 (15.8–22.0)5912 Kootenay/Boundary 24.7 (21.2–28.3)5913 Okanagan 24.3 (22.7–26.0)5914 Thompson/Cariboo 30.4 (28.3–32.5)5921 Fraser East 24.8 (23.2–26.4)5922 Fraser North 27.5 (26.3–28.6)5923 Fraser South 27.4 (26.4–28.5)5931 Richmond 30.5 (28.2–32.8)5932 Vancouver 27.4 (26.3–28.6)5933 North Shore/Coast Garibaldi 27.9 (26.0–29.8)5941 South Vancouver Island 29.4 (27.7–31.2)5942 Central Vancouver Island 27.2 (25.2–29.1)5943 North Vancouver Island 25.4 (22.7–28.1)5951 Northwest 25.8 (23.1–28.6)5952 Northern Interior 28.6 (26.4–30.9)
Y.T. Yukon Territory 25.9 (21.2–30.7)N.W.T. Northwest Territories 23.3 (20.0–26.6)†Nun. Nunavut 9.2 (6.8–11.5)Canada 22.5 (22.3–22.6)
Not
es: S
tillb
irths
wer
e ex
clud
ed fr
om th
e de
nom
inat
or.
†Nun
avut
birt
h co
unts
may
diff
er fr
om th
e te
rrito
ry’s
pub
lishe
d da
ta d
ue to
the
inco
mpl
ete
capt
ure
of s
ome
birt
hs o
ccur
ring
amon
g N
unav
ut w
omen
in C
IHI’s
Dis
char
ge A
bstr
act D
atab
ase.
Sou
rce:
Hos
pita
l Mor
bidi
ty D
atab
ase,
CIH
I

Primary and Repeat Caesarean Section Rate by Health Region, Canada, 2001–2002Map Code Region Primary Caesarean Section (2001–2002) Repeat Caesarean Section (2001–2002)
Rate/100 Rate/100 Hospital Deliveries 95% CI Hospital Deliveries 95% CI
N.L. 19.4 (18.2–20.7) 87.5 (84.5–90.5)1001 Health and Community Services St. John’s Region 18.7 (16.7–20.6) 85.6 (80.8–90.5)1002 Health and Community Services Eastern Region 23.7 (20.5–26.9) 86.5 (79.6–93.3)1003 Health and Community Services Central Region 16.2 (13.4–19.0) 93.0 (87.6–98.4)1004 Health and Community Services Western Region 20.9 (17.7–24.1) 87.7 (79.2–96.2)
P.E.I. Prince Edward Island 21.0 (18.7–23.4) 75.4 (68.9–82.0)N.S. 18.9 (18.0–19.8) 76.0 (73.3–78.7)
1201 Zone 1 19.3 (16.8–21.9) 77.1 (69.1–85.2)1202 Zone 2 14.8 (12.1–17.6) 75.0 (65.0–85.0)1203 Zone 3 17.5 (15.0–20.0) 77.6 (70.3–84.9)1204 Zone 4 20.1 (17.3–23.0) 90.3 (84.3–96.3)1205 Zone 5 18.2 (15.8–20.7) 67.9 (60.0–75.9)1206 Zone 6 19.8 (18.5–21.1) 74.7 (70.7–78.7)
N.B. 19.4 (18.4–20.4) 85.7 (83.2–88.2)1301 Region 1 18.6 (16.7–20.6) 87.7 (82.6–92.7)1302 Region 2 18.9 (16.9–20.8) 74.7 (68.6–80.9)1303 Region 3 18.5 (16.6–20.5) 90.0 (85.9–94.1)1306 Region 6 25.5 (22.1–29.0) 80.4 (69.5–91.3)
Que. 14.6 (14.3–14.9) 69.4 (68.2–70.5)2401 Région du Bas-Saint-Laurent 15.5 (13.7–17.4) 73.1 (65.1–81.1)2402 Région du Saguenay—Lac-Saint-Jean 12.0 (10.7–13.3) 63.0 (56.8–69.2)2403 Région de Québec 14.8 (13.8–15.8) 70.8 (66.7–74.9)2404 Région de la Mauricie et Centre-du-Québec 14.3 (13.2–15.4) 80.2 (75.8–84.6)2405 Région de l’Estrie 12.5 (11.2–13.8) 52.3 (44.9–59.8)2406 Région de Montréal-Centre 15.4 (14.9–16.0) 70.7 (68.7–72.8)2407 Région de l’Outaouais 15.8 (14.5–17.2) 72.6 (67.2–78.0)2408 Région de l’Abitibi-Témiscamingue 14.5 (12.6–16.3) 50.0 (41.0–59.0)2409 Région de la Côte-Nord 15.8 (13.5–18.2) 72.5 (62.7–82.3)2411 Région de la Gaspésie—Îles-de-la-Madeleine 17.3 (14.3–20.3) 70.1 (59.2–81.1)2412 Région de la Chaudière-Appalaches 16.6 (15.3–17.8) 73.6 (69.1–78.2)2413 Région de Laval 14.1 (12.9–15.4) 78.2 (73.8–82.6)2414 Région de Lanaudière 14.9 (13.7–16.2) 60.7 (55.4–66.0)2415 Région des Laurentides 12.7 (11.7–13.7) 69.3 (64.6–74.0)2416 Région de la Montérégie 14.1 (13.5–14.7) 67.4 (64.8–70.1)
Ont. 16.5 (16.3–16.7) 75.1 (74.4–75.8)3501 Champlain DHC 16.6 (15.9–17.4) 73.8 (71.3–76.3)3502 Southeastern Ontario DHC 17.5 (16.4–18.7) 79.0 (75.5–82.5)3503 Durham, Haliburton, Kawartha and Pine Ridge DHC 18.2 (17.4–19.1) 77.6 (75.1–80.1)3504 Toronto DHC 17.8 (17.4–18.3) 76.6 (75.2–78.1)3505 Simcoe York DHC 15.8 (15.1–16.4) 79.4 (77.3–81.4)3506 Halton-Peel DHC 15.6 (15.1–16.2) 77.3 (75.5–79.1)3507 Waterloo Region-Wellington-Dufferin DHC 15.8 (14.9–16.6) 70.6 (67.6–73.6)3508 Hamilton DHC 15.3 (14.3–16.3) 71.4 (67.8–75.0)3509 Niagara DHC 15.8 (14.6–17.0) 80.0 (76.3–83.8)3510 Grand River DHC 13.5 (12.1–14.9) 67.5 (61.7–73.2)3511 Thames Valley DHC 14.2 (13.3–15.1) 61.9 (58.2–65.6)3512 Essex Kent and Lambton DHC 17.0 (16.1–17.9) 66.9 (63.5–70.3)3513 Grey Bruce Huron Perth DHC 15.4 (14.0–16.9) 70.4 (64.5–76.3)3514 Northern Shores DHC 19.5 (17.6–21.4) 84.9 (80.7–89.2)3515 Algoma, Cochrane, Manitoulin and Sudbury DHC 17.2 (15.9–18.5) 85.3 (81.7–88.9)3516 Northwestern Ontario DHC 15.3 (13.9–16.8) 65.6 (60.7–70.6)
Man. 12.4 (11.8–13.0) 67.7 (65.3–70.1)4610 Winnipeg Regional Health Authority 12.7 (11.9–13.6) 67.3 (63.9–70.7)4630 Interlake Regional Health Authority 11.4 (9.2–13.6) 66.7 (56.9–76.4)4640 Central Regional Health Authority 13.1 (11.1–15.0) 69.5 (62.5–76.6)
Sask. 13.1 (12.4–13.7) 64.2 (61.6–66.9)4704 Regina Qu’Appelle Regional Health Authority 10.2 (9.0–11.4) 66.4 (60.4–72.4)4706 Saskatoon Regional Health Authority 15.7 (14.4–17.0) 59.8 (54.6–65.0)4709 Prince Albert Parkland Regional Health Authority 11.4 (9.3–13.5) 42.4 (32.3–52.5)
Alta. 16.6 (16.2–17.0) 69.8 (68.4–71.2)4820 Chinook Regional Health Authority 14.5 (12.8–16.2) 67.9 (61.7–74.0)4821 Palliser Health Region 12.5 (10.5–14.5) 70.5 (62.4–78.6)4822 Calgary Health Region 18.0 (17.3–18.7) 68.4 (66.0–70.8)4823 David Thompson Regional Health Authority 16.5 (15.2–17.8) 72.8 (68.5–77.2)4824 East Central Health 19.4 (16.9–21.9) 78.4 (71.9–84.9)4825 Capital Health 16.2 (15.5–17.0) 68.0 (65.4–70.7)4826 Aspen Regional Health Authority 15.1 (13.6–16.6) 67.7 (61.9–73.5)4827 Peace Country Health 14.8 (13.2–16.5) 82.6 (77.4–87.8)
B.C. 20.8 (20.4–21.3) 76.1 (74.8–77.3)5911 East Kootenay 13.2 (10.4–16.0) 68.8 (57.4–80.1)5912 Kootenay/Boundary 17.0 (13.7–20.3) 80.9 (71.5–90.2)5913 Okanagan 17.7 (16.1–19.3) 72.5 (67.5–77.5)5914 Thompson/Cariboo 22.1 (20.1–24.2) 77.5 (72.5–82.5)5921 Fraser East 18.2 (16.7–19.7) 72.6 (67.8–77.3)5922 Fraser North 21.3 (20.2–22.5) 79.8 (76.5–83.0)5923 Fraser South 21.1 (20.0–22.1) 75.0 (72.0–78.0)5931 Richmond 24.6 (22.3–26.9) 72.6 (66.3–79.0)5932 Vancouver 22.2 (21.0–23.3) 75.0 (71.4–78.6)5933 North Shore/Coast Garibaldi 21.1 (19.2–22.9) 83.7 (79.0–88.4)5941 South Vancouver Island 23.1 (21.3–24.8) 74.1 (69.3–78.8)5942 Central Vancouver Island *5943 North Vancouver Island 18.4 (15.8–20.9) 78.3 (70.7–85.8)5951 Northwest 20.0 (17.3–22.6) 76.2 (68.0–84.3)5952 Northern Interior 22.3 (20.2–24.5) 80.3 (74.4–86.3)
Y.T. Yukon Territory 21.9 (17.2–26.6) 66.7 (48.9–84.4)N.W.T. Northwest Territories 16.4 (13.4–19.5) 80.3 (70.7–89.9)†Nun. Nunavut 7.6 (5.4–9.9) 39.3 (21.2–57.4)Canada 16.5 (16.3–16.6) 73.2 (72.8–73.7)N
otes
: *C
entr
al V
anco
uver
Isla
nd (
Vanc
ouve
r) w
as e
xclu
ded
from
this
ana
lysi
s du
e to
und
erre
port
ing
of u
terin
e sc
ar.
†Nun
avut
birt
h co
unts
may
diff
er fr
om th
e te
rrito
ry’s
pub
lishe
d da
ta d
ue to
the
inco
mpl
ete
capt
ure
of s
ome
birt
hs
occu
rrin
g am
ong
Nun
avut
wom
en in
CIH
I’s D
isch
arge
Abs
trac
t Dat
abas
e.S
ourc
e: H
ospi
tal M
orbi
dity
Dat
abas
e, C
IHI

Primary Caesarean Section Rate by Age Group (< 35 years, > 35 years) by Health Region, Canada, 2001–2002
Map Code Region Primary Caesarean (2001–2002): Primary Caesarean (2001–2002): Women < 35 years Women ≥≥ 35 years Rate/100 Deliveries 95% CI Rate/100 Deliveries 95% CI
N.L. 18.9 (17.6–20.1) 24.3 (20.2–28.4)1001 Health and Community Services St. John’s Region 18.1 (16.0–20.1) 22.3 (16.9–27.7)1002 Health and Community Services Eastern Region 22.1 (18.8–25.3) 39.7 (27.6–51.8)1003 Health and Community Services Central Region 16.7 (13.7–19.6) 11.7 (3.5–19.8)1004 Health and Community Services Western Region 20.4 (17.1–23.7) 26.7 (13.7–39.6)
P.E.I. Prince Edward Island 20.1 (17.6–22.6) 28.5 (20.5–36.4)N.S. 18.3 (17.4–19.3) 22.7 (20.1–25.4)
1201 Zone 1 18.5 (15.8–21.1) 27.9 (18.4–37.4)1202 Zone 2 14.3 (11.5–17.2) 18.8 (9.6–28.1)1203 Zone 3 17.1 (14.5–19.7) 20.9 (12.5–29.2)1204 Zone 4 19.9 (16.9–22.9) 22.4 (13.0–31.7)1205 Zone 5 16.9 (14.4–19.4) 27.4 (19.6–35.3)1206 Zone 6 19.6 (18.1–21.0) 21.4 (17.9–24.9)
N.B. 19.3 (18.3–20.3) 20.6 (17.4–23.8)1301 Region 1 19.0 (16.9–21.1) 15.6 (10.2–21.0)1302 Region 2 18.7 (16.6–20.7) 20.5 (14.2–26.8)1303 Region 3 18.5 (16.5–20.6) 18.6 (12.5–24.7)1306 Region 6 24.5 (21.0–28.1) 37.5 (23.8–51.2)
Que. 14.2 (13.9–14.5) 17.4 (16.6–18.2)2401 Région du Bas-Saint-Laurent 15.1 (13.2–17.0) 19.8 (13.0–26.7)2402 Région du Saguenay—Lac-Saint-Jean 11.8 (10.4–13.2) 14.9 (9.5–20.3)2403 Région de Québec 14.6 (13.6–15.7) 16.1 (13.3–19.0)2404 Région de la Mauricie et Centre-du-Québec 14.1 (12.9–15.2) 16.9 (12.8–20.9)2405 Région de l’Estrie 12.0 (10.7–13.3) 18.1 (13.0–23.2)2406 Région de Montréal-Centre 14.7 (14.1–15.3) 18.8 (17.4–20.2)2407 Région de l’Outaouais 15.6 (14.2–17.0) 17.2 (13.4–21.0)2408 Région de l’Abitibi-Témiscamingue 14.0 (12.2–15.9) 20.4 (12.4–28.4)2409 Région de la Côte-Nord 15.9 (13.4–18.4) 15.3 (7.6–22.9)2411 Région de la Gaspésie—Îles-de-la-Madeleine 17.3 (14.1–20.4) 17.6 (8.9–26.2)2412 Région de la Chaudière-Appalaches 16.6 (15.3–17.9) 16.4 (12.2–20.5)2413 Région de Laval 13.5 (12.2–14.8) 17.8 (14.4–21.1)2414 Région de Lanaudière 14.5 (13.3–15.8) 18.3 (14.2–22.5)2415 Région des Laurentides 12.5 (11.5–13.5) 14.0 (10.9–17.1)2416 Région de la Montérégie 13.9 (13.2–14.5) 15.8 (13.9–17.7)
Ont. 15.7 (15.5–16.0) 20.3 (19.7–20.8)3501 Champlain DHC 15.6 (14.9–16.4) 20.9 (19.1–22.7)3502 Southeastern Ontario DHC 17.1 (15.8–18.3) 20.6 (17.2–24.0)3503 Durham, Haliburton, Kawartha and Pine Ridge DHC 17.6 (16.7–18.6) 21.5 (19.1–23.8)3504 Toronto DHC 16.4 (16.0–16.9) 22.7 (21.7–23.8)3505 Simcoe York DHC 15.5 (14.8–16.3) 16.7 (15.2–18.2)3506 Halton-Peel DHC 15.0 (14.4–15.6) 18.5 (17.1–19.8)3507 Waterloo Region-Wellington-Dufferin DHC 15.5 (14.6–16.4) 17.7 (15.3–20.1)3508 Hamilton DHC 14.6 (13.5–15.7) 18.9 (16.1–21.7)3509 Niagara DHC 15.4 (14.1–16.7) 17.8 (14.6–21.0)3510 Grand River DHC 13.2 (11.7–14.7) 16.0 (11.5–20.4)3511 Thames Valley DHC 13.6 (12.7–14.6) 17.6 (15.0–20.2)3512 Essex Kent and Lambton DHC 16.2 (15.2–17.2) 23.5 (20.3–26.6)3513 Grey Bruce Huron Perth DHC 14.9 (13.4–16.4) 19.9 (15.2–24.6)3514 Northern Shores DHC 17.9 (16.0–19.9) 31.0 (24.5–37.4)3515 Algoma, Cochrane, Manitoulin and Sudbury DHC 16.5 (15.2–17.8) 23.9 (19.2–28.7)3516 Northwestern Ontario DHC 15.0 (13.5–16.5) 18.1 (13.4–22.8)
Man. 11.7 (11.1–12.3) 18.0 (16.0–20.0)4610 Winnipeg Regional Health Authority 11.6 (10.8–12.4) 19.7 (17.1–22.3)4630 Interlake Regional Health Authority 10.5 (8.2–12.8) 18.3 (10.4–26.1)4640 Central Regional Health Authority 13.1 (11.1–15.2) 12.8 (6.6–19.1)
Sask. 12.6 (11.9–13.2) 17.9 (15.5–20.2)4704 Regina Qu’Appelle Regional Health Authority 9.6 (8.4–10.8) 15.2 (11.1–19.4)4706 Saskatoon Regional Health Authority 15.2 (13.8–16.5) 20.0 (15.7–24.3)4709 Prince Albert Parkland Regional Health Authority 11.3 (9.2–13.5) 12.5 (4.4–20.6)
Alta. 15.9 (15.5–16.3) 21.4 (20.2–22.7)4820 Chinook Regional Health Authority 13.7 (11.9–15.5) 21.6 (15.3–27.9)4821 Palliser Health Region 12.5 (10.5–14.6) 12.2 (5.5–19.0)4822 Calgary Health Region 17.0 (16.3–17.8) 23.0 (21.1–24.9)4823 David Thompson Regional Health Authority 16.0 (14.7–17.4) 21.3 (16.6–26.1)4824 East Central Health 19.6 (16.9–22.3) 17.8 (10.5–25.0)4825 Capital Health 15.4 (14.6–16.2) 21.5 (19.3–23.7)4826 Aspen Regional Health Authority 15.0 (13.4–16.6) 16.2 (10.8–21.6)4827 Peace Country Health 14.3 (12.6–16.1) 20.9 (13.9–28.0)
B.C. 19.8 (19.3–20.2) 25.5 (24.4–26.6)5911 East Kootenay 12.6 (9.6–15.5) 17.6 (8.9–26.2)5912 Kootenay/Boundary 16.5 (13.0–20.0) 20.0 (10.9–29.1)5913 Okanagan 16.8 (15.1–18.5) 23.2 (18.6–27.7)5914 Thompson/Cariboo 21.5 (19.3–23.6) 26.9 (20.7–33.1)5921 Fraser East 17.9 (16.3–19.5) 21.0 (16.3–25.7)5922 Fraser North 20.0 (18.8–21.3) 26.0 (23.4–28.7)5923 Fraser South 20.3 (19.2–21.4) 25.3 (22.6–28.0)5931 Richmond 22.9 (20.3–25.5) 29.7 (24.9–34.6)5932 Vancouver 20.7 (19.4–22.0) 26.3 (24.0–28.7)5933 North Shore/Coast Garibaldi 19.8 (17.7–21.9) 24.2 (20.7–27.8)5941 South Vancouver Island 21.7 (19.8–23.6) 28.8 (24.5–33.0)5942 Central Vancouver Island *5943 North Vancouver Island 17.1 (14.4–19.8) 26.0 (18.3–33.8)5951 Northwest 19.9 (17.1–22.6) 20.6 (12.7–28.4)5952 Northern Interior 22.0 (19.7–24.2) 25.9 (18.7–33.1)
Y.T. Yukon Territory 17.7 (12.9–22.4) 43.8 (29.7–57.8)N.W.T. Northwest Territories 15.5 (12.3–18.7) 22.9 (13.0–32.7)†Nun. Nunavut 7.6 (5.3–9.9) **Canada 15.7 (15.6–15.9) 20.6 (20.2–21.0)
Not
es: C
entr
al V
anco
uver
Isla
nd (
Vanc
ouve
r) w
as e
xclu
ded
from
this
ana
lysi
s du
e to
und
erre
port
ing
of u
tert
ine
scar
.†N
unav
ut b
irth
coun
ts m
ay d
iffer
from
the
terr
itory
’s p
ublis
hed
data
due
to th
e in
com
plet
e ca
ptur
e of
som
e bi
rths
oc
curr
ing
amon
g N
unav
ut w
omen
in C
IHI’s
Dis
char
ge A
bstr
act D
atab
ase.
Dat
a fo
r w
omen
ove
r 35
sup
pres
sed
due
to s
mal
l num
bers
.S
ourc
e: H
ospi
tal M
orbi
dity
Dat
abas
e, C
IHI
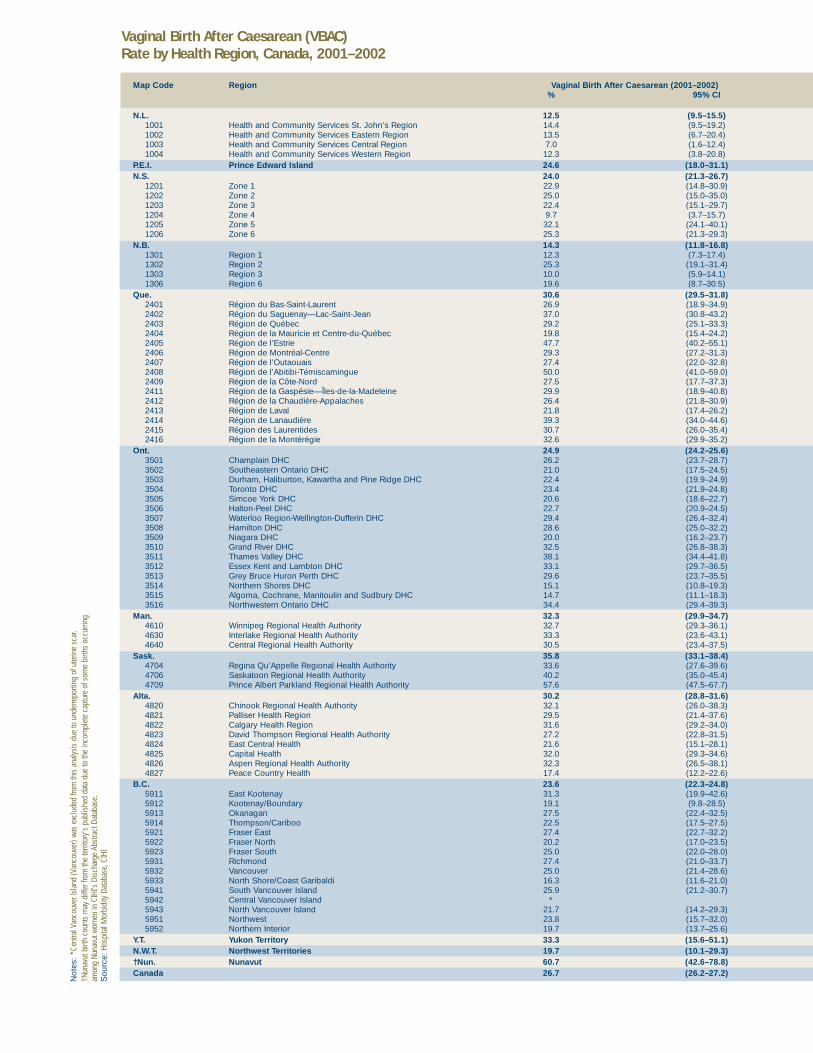
Vaginal Birth After Caesarean (VBAC) Rate by Health Region, Canada, 2001–2002
Not
es: *
Cent
ral V
anco
uver
Isla
nd (V
anco
uver
) was
exc
lude
d fro
m th
is a
naly
sis
due
to u
nder
repo
rting
of u
terin
e sc
ar.
†Nun
avut
birt
h co
unts
may
diff
er fr
om th
e te
rrito
ry’s
pub
lishe
d da
ta d
ue to
the
inco
mpl
ete
capt
ure
of s
ome
birth
s oc
curri
ngam
ong
Nuna
vut w
omen
in C
IHI’s
Dis
char
ge A
bstra
ct D
atab
ase.
Sou
rce:
Hosp
ital M
orbi
dity
Dat
abas
e, C
IHI
Map Code Region Vaginal Birth After Caesarean (2001–2002)% 95% CI
N.L. 12.5 (9.5–15.5)1001 Health and Community Services St. John’s Region 14.4 (9.5–19.2)1002 Health and Community Services Eastern Region 13.5 (6.7–20.4)1003 Health and Community Services Central Region 7.0 (1.6–12.4)1004 Health and Community Services Western Region 12.3 (3.8–20.8)
P.E.I. Prince Edward Island 24.6 (18.0–31.1)N.S. 24.0 (21.3–26.7)
1201 Zone 1 22.9 (14.8–30.9)1202 Zone 2 25.0 (15.0–35.0)1203 Zone 3 22.4 (15.1–29.7)1204 Zone 4 9.7 (3.7–15.7)1205 Zone 5 32.1 (24.1–40.1)1206 Zone 6 25.3 (21.3–29.3)
N.B. 14.3 (11.8–16.8)1301 Region 1 12.3 (7.3–17.4)1302 Region 2 25.3 (19.1–31.4)1303 Region 3 10.0 (5.9–14.1)1306 Region 6 19.6 (8.7–30.5)
Que. 30.6 (29.5–31.8)2401 Région du Bas-Saint-Laurent 26.9 (18.9–34.9)2402 Région du Saguenay—Lac-Saint-Jean 37.0 (30.8–43.2)2403 Région de Québec 29.2 (25.1–33.3)2404 Région de la Mauricie et Centre-du-Québec 19.8 (15.4–24.2)2405 Région de l’Estrie 47.7 (40.2–55.1)2406 Région de Montréal-Centre 29.3 (27.2–31.3)2407 Région de l’Outaouais 27.4 (22.0–32.8)2408 Région de l’Abitibi-Témiscamingue 50.0 (41.0–59.0)2409 Région de la Côte-Nord 27.5 (17.7–37.3)2411 Région de la Gaspésie—Îles-de-la-Madeleine 29.9 (18.9–40.8)2412 Région de la Chaudière-Appalaches 26.4 (21.8–30.9)2413 Région de Laval 21.8 (17.4–26.2)2414 Région de Lanaudière 39.3 (34.0–44.6)2415 Région des Laurentides 30.7 (26.0–35.4)2416 Région de la Montérégie 32.6 (29.9–35.2)
Ont. 24.9 (24.2–25.6)3501 Champlain DHC 26.2 (23.7–28.7)3502 Southeastern Ontario DHC 21.0 (17.5–24.5)3503 Durham, Haliburton, Kawartha and Pine Ridge DHC 22.4 (19.9–24.9)3504 Toronto DHC 23.4 (21.9–24.8)3505 Simcoe York DHC 20.6 (18.6–22.7)3506 Halton-Peel DHC 22.7 (20.9–24.5)3507 Waterloo Region-Wellington-Dufferin DHC 29.4 (26.4–32.4)3508 Hamilton DHC 28.6 (25.0–32.2)3509 Niagara DHC 20.0 (16.2–23.7)3510 Grand River DHC 32.5 (26.8–38.3)3511 Thames Valley DHC 38.1 (34.4–41.8)3512 Essex Kent and Lambton DHC 33.1 (29.7–36.5)3513 Grey Bruce Huron Perth DHC 29.6 (23.7–35.5)3514 Northern Shores DHC 15.1 (10.8–19.3)3515 Algoma, Cochrane, Manitoulin and Sudbury DHC 14.7 (11.1–18.3)3516 Northwestern Ontario DHC 34.4 (29.4–39.3)
Man. 32.3 (29.9–34.7)4610 Winnipeg Regional Health Authority 32.7 (29.3–36.1)4630 Interlake Regional Health Authority 33.3 (23.6–43.1)4640 Central Regional Health Authority 30.5 (23.4–37.5)
Sask. 35.8 (33.1–38.4)4704 Regina Qu’Appelle Regional Health Authority 33.6 (27.6–39.6)4706 Saskatoon Regional Health Authority 40.2 (35.0–45.4)4709 Prince Albert Parkland Regional Health Authority 57.6 (47.5–67.7)
Alta. 30.2 (28.8–31.6)4820 Chinook Regional Health Authority 32.1 (26.0–38.3)4821 Palliser Health Region 29.5 (21.4–37.6)4822 Calgary Health Region 31.6 (29.2–34.0)4823 David Thompson Regional Health Authority 27.2 (22.8–31.5)4824 East Central Health 21.6 (15.1–28.1)4825 Capital Health 32.0 (29.3–34.6)4826 Aspen Regional Health Authority 32.3 (26.5–38.1)4827 Peace Country Health 17.4 (12.2–22.6)
B.C. 23.6 (22.3–24.8)5911 East Kootenay 31.3 (19.9–42.6)5912 Kootenay/Boundary 19.1 (9.8–28.5)5913 Okanagan 27.5 (22.4–32.5)5914 Thompson/Cariboo 22.5 (17.5–27.5)5921 Fraser East 27.4 (22.7–32.2)5922 Fraser North 20.2 (17.0–23.5)5923 Fraser South 25.0 (22.0–28.0)5931 Richmond 27.4 (21.0–33.7)5932 Vancouver 25.0 (21.4–28.6)5933 North Shore/Coast Garibaldi 16.3 (11.6–21.0)5941 South Vancouver Island 25.9 (21.2–30.7)5942 Central Vancouver Island *5943 North Vancouver Island 21.7 (14.2–29.3)5951 Northwest 23.8 (15.7–32.0)5952 Northern Interior 19.7 (13.7–25.6)
Y.T. Yukon Territory 33.3 (15.6–51.1)N.W.T. Northwest Territories 19.7 (10.1–29.3)†Nun. Nunavut 60.7 (42.6–78.8)Canada 26.7 (26.2–27.2)
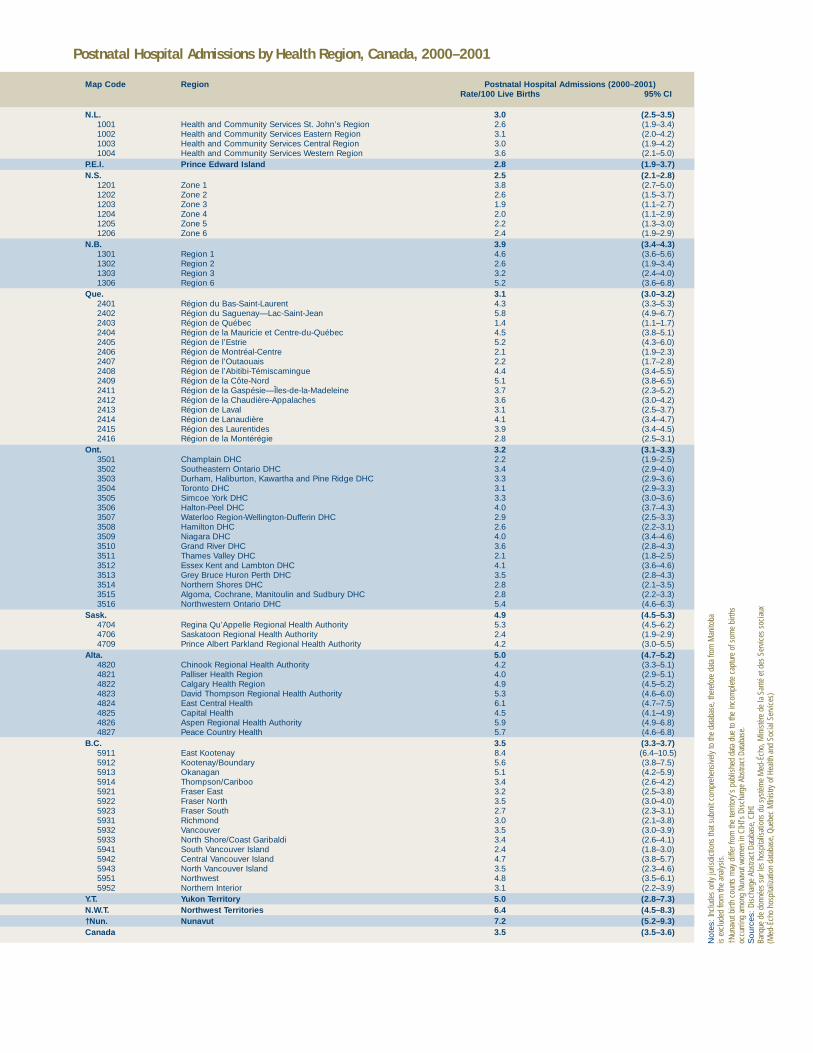
Postnatal Hospital Admissions by Health Region, Canada, 2000–2001
Map Code Region Postnatal Hospital Admissions (2000–2001)Rate/100 Live Births 95% CI
N.L. 3.0 (2.5–3.5)1001 Health and Community Services St. John’s Region 2.6 (1.9–3.4)1002 Health and Community Services Eastern Region 3.1 (2.0–4.2)1003 Health and Community Services Central Region 3.0 (1.9–4.2)1004 Health and Community Services Western Region 3.6 (2.1–5.0)
P.E.I. Prince Edward Island 2.8 (1.9–3.7)N.S. 2.5 (2.1–2.8)
1201 Zone 1 3.8 (2.7–5.0)1202 Zone 2 2.6 (1.5–3.7)1203 Zone 3 1.9 (1.1–2.7)1204 Zone 4 2.0 (1.1–2.9)1205 Zone 5 2.2 (1.3–3.0)1206 Zone 6 2.4 (1.9–2.9)
N.B. 3.9 (3.4–4.3)1301 Region 1 4.6 (3.6–5.6)1302 Region 2 2.6 (1.9–3.4)1303 Region 3 3.2 (2.4–4.0)1306 Region 6 5.2 (3.6–6.8)
Que. 3.1 (3.0–3.2)2401 Région du Bas-Saint-Laurent 4.3 (3.3–5.3)2402 Région du Saguenay—Lac-Saint-Jean 5.8 (4.9–6.7)2403 Région de Québec 1.4 (1.1–1.7)2404 Région de la Mauricie et Centre-du-Québec 4.5 (3.8–5.1)2405 Région de l’Estrie 5.2 (4.3–6.0)2406 Région de Montréal-Centre 2.1 (1.9–2.3)2407 Région de l’Outaouais 2.2 (1.7–2.8)2408 Région de l’Abitibi-Témiscamingue 4.4 (3.4–5.5)2409 Région de la Côte-Nord 5.1 (3.8–6.5)2411 Région de la Gaspésie—Îles-de-la-Madeleine 3.7 (2.3–5.2)2412 Région de la Chaudière-Appalaches 3.6 (3.0–4.2)2413 Région de Laval 3.1 (2.5–3.7)2414 Région de Lanaudière 4.1 (3.4–4.7)2415 Région des Laurentides 3.9 (3.4–4.5)2416 Région de la Montérégie 2.8 (2.5–3.1)
Ont. 3.2 (3.1–3.3)3501 Champlain DHC 2.2 (1.9–2.5)3502 Southeastern Ontario DHC 3.4 (2.9–4.0)3503 Durham, Haliburton, Kawartha and Pine Ridge DHC 3.3 (2.9–3.6)3504 Toronto DHC 3.1 (2.9–3.3)3505 Simcoe York DHC 3.3 (3.0–3.6)3506 Halton-Peel DHC 4.0 (3.7–4.3)3507 Waterloo Region-Wellington-Dufferin DHC 2.9 (2.5–3.3)3508 Hamilton DHC 2.6 (2.2–3.1)3509 Niagara DHC 4.0 (3.4–4.6)3510 Grand River DHC 3.6 (2.8–4.3)3511 Thames Valley DHC 2.1 (1.8–2.5)3512 Essex Kent and Lambton DHC 4.1 (3.6–4.6)3513 Grey Bruce Huron Perth DHC 3.5 (2.8–4.3)3514 Northern Shores DHC 2.8 (2.1–3.5)3515 Algoma, Cochrane, Manitoulin and Sudbury DHC 2.8 (2.2–3.3)3516 Northwestern Ontario DHC 5.4 (4.6–6.3)
Sask. 4.9 (4.5–5.3)4704 Regina Qu’Appelle Regional Health Authority 5.3 (4.5–6.2)4706 Saskatoon Regional Health Authority 2.4 (1.9–2.9)4709 Prince Albert Parkland Regional Health Authority 4.2 (3.0–5.5)
Alta. 5.0 (4.7–5.2)4820 Chinook Regional Health Authority 4.2 (3.3–5.1)4821 Palliser Health Region 4.0 (2.9–5.1)4822 Calgary Health Region 4.9 (4.5–5.2)4823 David Thompson Regional Health Authority 5.3 (4.6–6.0)4824 East Central Health 6.1 (4.7–7.5)4825 Capital Health 4.5 (4.1–4.9)4826 Aspen Regional Health Authority 5.9 (4.9–6.8)4827 Peace Country Health 5.7 (4.6–6.8)
B.C. 3.5 (3.3–3.7)5911 East Kootenay 8.4 (6.4–10.5)5912 Kootenay/Boundary 5.6 (3.8–7.5)5913 Okanagan 5.1 (4.2–5.9)5914 Thompson/Cariboo 3.4 (2.6–4.2)5921 Fraser East 3.2 (2.5–3.8)5922 Fraser North 3.5 (3.0–4.0)5923 Fraser South 2.7 (2.3–3.1)5931 Richmond 3.0 (2.1–3.8)5932 Vancouver 3.5 (3.0–3.9)5933 North Shore/Coast Garibaldi 3.4 (2.6–4.1)5941 South Vancouver Island 2.4 (1.8–3.0)5942 Central Vancouver Island 4.7 (3.8–5.7)5943 North Vancouver Island 3.5 (2.3–4.6)5951 Northwest 4.8 (3.5–6.1)5952 Northern Interior 3.1 (2.2–3.9)
Y.T. Yukon Territory 5.0 (2.8–7.3)N.W.T. Northwest Territories 6.4 (4.5–8.3)†Nun. Nunavut 7.2 (5.2–9.3)Canada 3.5 (3.5–3.6)
Not
es: I
nclu
des
only
juris
dict
ions
that
sub
mit
com
preh
ensi
vely
to th
e da
taba
se, t
here
fore
dat
a fro
m M
anito
ba
is e
xclu
ded
from
the
anal
ysis
.†N
unav
ut b
irth
coun
ts m
ay d
iffer
from
the
terri
tory
’s p
ublis
hed
data
due
to th
e in
com
plet
e ca
ptur
e of
som
e bi
rths
occu
rring
am
ong
Nuna
vut w
omen
in C
IHI’s
Dis
char
ge A
bstra
ct D
atab
ase.
Sou
rces
: Dis
char
ge A
bstra
ct D
atab
ase,
CIH
IBa
nque
de
donn
ées
sur l
es h
ospi
talis
atio
ns d
u sy
stèm
e M
ed-É
cho,
Min
istè
re d
e la
San
té e
t des
Ser
vice
s so
ciau
x(M
ed-É
cho
hosp
italiz
atio
n da
taba
se, Q
uebe
c M
Inis
try o
f Hea
lth a
nd S
ocia
l Ser
vice
s)
43
B
43
Appendix B
Technical Notes for Maternal and Infant Health Care Indicators1 General Notes2 Rate of Epidural Anaesthesia for Vaginal Deliveries3 Rate of Epidural Anaesthesia for All Deliveries4 Assisted Deliveries (Overall)5 Assisted Deliveries (Forceps)6 Assisted Deliveries (Vacuum Extraction)7 Rate of Primary Caesarean Deliveries8 Postnatal Hospital Admissions

44
1BGeneral NotesThe methodology used for these indicators was designed to maximize inter-regional, inter-provincial, and inter-territorial comparability. For this reason, and because the indicators are based on the latest updates available at the time of publication, there may be differences with definitions and data sources used in other reports.
Health regions are defined by provincial governments as the areas of responsibility for regional health boards (that is, legislated) or as regions of interest to health careauthorities. In order to provide for more stable rate estimation, as well as less suppression due to privacy and confidentiality issues, only data from regions with a population of at least 75,000 are reported. Boundaries are those that were in effect as of June 2003.
Data are based on a patient’s region of residence, which may not be the same as the region of hospitalization.
Hospitalizations include discharges and deaths for inpatients in acute care hospitals for the reference period. Same day surgery (outpatient) cases and patients admitted to non–acute care hospitals (e.g. chronic care, psychiatric, or rehabilitation facilities) are generally not included in the totals.
ICD-10-CA and the Canadian Classification of Health Interventions (CCI) systems of coding diagnoses and procedures came into effect April 1, 2001, and were adoptedby Newfoundland (now Newfoundland and Labrador), Prince Edward Island, NovaScotia, parts of Saskatchewan, British Columbia and the Yukon Territory. Ontario, the remainder of Saskatchewan, Alberta, the Northwest Territories and Nunavutimplemented ICD-10/CCI on April 1, 2002. Most of the indicators are based on data up to and including March 31, 2002.
Indicator cases that were originally coded in ICD-10 or CCI were extracted on the relevant codes and not the ICD-9 or CCP translations.
• Nunavut birth counts may differfrom the territory’s published datadue to the incomplete capture of some births occurring amongNunavut women in CIHI’sDischarge Abstract Database.
• Methods for selected indicators(assisted delivery, primary caesa-rean section and postnatal hospi-tal admissions) were chosen to be as consistent as possible withthose used by Health Canada’sCanadian Perinatal Health Report 2003.
Giv
ing
Birt
h in
Can
ada:
A R
egio
nal P
rofil
e
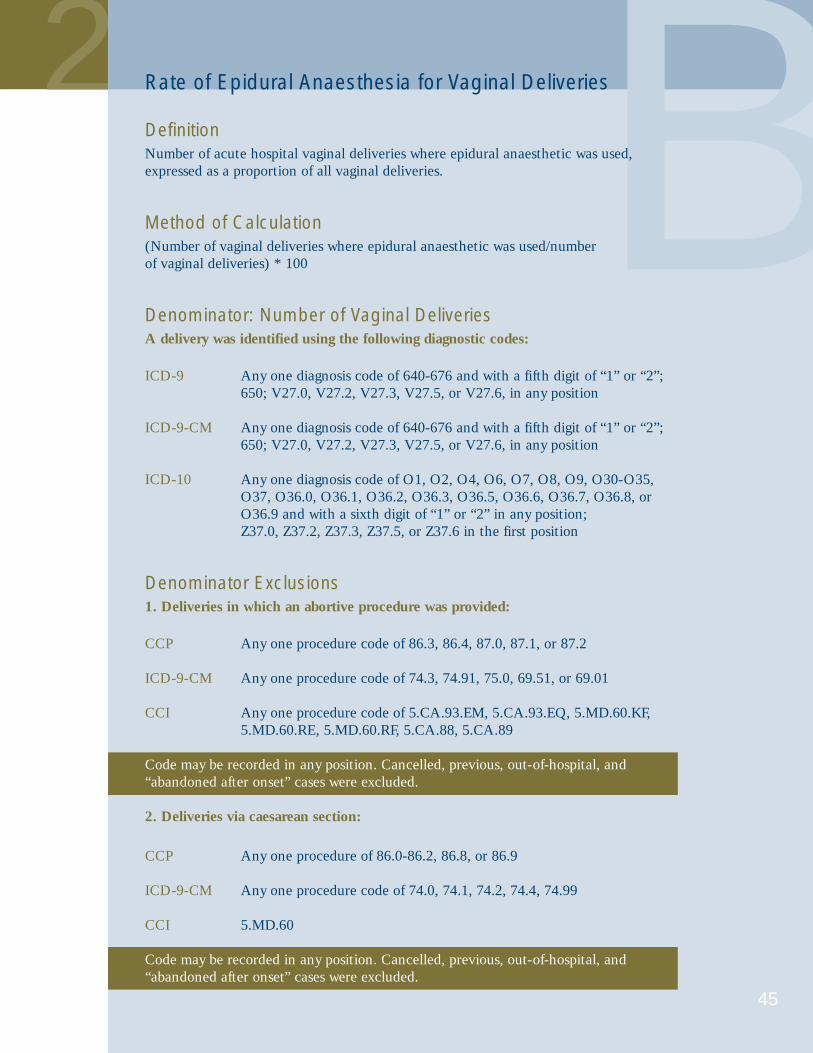
2
45
BRate of Epidural Anaesthesia for Vaginal Deliveries
DefinitionNumber of acute hospital vaginal deliveries where epidural anaesthetic was used,expressed as a proportion of all vaginal deliveries.
Method of Calculation(Number of vaginal deliveries where epidural anaesthetic was used/number of vaginal deliveries) * 100
Denominator: Number of Vaginal DeliveriesA delivery was identified using the following diagnostic codes:
ICD-9 Any one diagnosis code of 640-676 and with a fifth digit of “1” or “2”; 650; V27.0, V27.2, V27.3, V27.5, or V27.6, in any position
ICD-9-CM Any one diagnosis code of 640-676 and with a fifth digit of “1” or “2”; 650; V27.0, V27.2, V27.3, V27.5, or V27.6, in any position
ICD-10 Any one diagnosis code of O1, O2, O4, O6, O7, O8, O9, O30-O35,O37, O36.0, O36.1, O36.2, O36.3, O36.5, O36.6, O36.7, O36.8, orO36.9 and with a sixth digit of “1” or “2” in any position;Z37.0, Z37.2, Z37.3, Z37.5, or Z37.6 in the first position
Denominator Exclusions1. Deliveries in which an abortive procedure was provided:
CCP Any one procedure code of 86.3, 86.4, 87.0, 87.1, or 87.2
ICD-9-CM Any one procedure code of 74.3, 74.91, 75.0, 69.51, or 69.01
CCI Any one procedure code of 5.CA.93.EM, 5.CA.93.EQ, 5.MD.60.KF,5.MD.60.RE, 5.MD.60.RF, 5.CA.88, 5.CA.89
Code may be recorded in any position. Cancelled, previous, out-of-hospital, and“abandoned after onset” cases were excluded.
2. Deliveries via caesarean section:
CCP Any one procedure of 86.0-86.2, 86.8, or 86.9
ICD-9-CM Any one procedure code of 74.0, 74.1, 74.2, 74.4, 74.99
CCI 5.MD.60
Code may be recorded in any position. Cancelled, previous, out-of-hospital, and“abandoned after onset” cases were excluded.

B
46
Giv
ing
Birt
h in
Can
ada:
A R
egio
nal P
rofil
e
Numerator: Number of Vaginal Deliveries Where Epidural Anaesthetic Was UsedSince this number is a subset of the denominator, the same exclusion criteria used inthe calculation of the denominator were applied. Either of the following codes wasused to identify cases of epidural anaesthesia:
Anaesthetic technique codeAnaesthetic technique code equal to “3” or procedure code of
CCP 16.91ICD-9-CM 03.91CCI 5.LD.20.HA-P1
Data SourcesDischarge Abstract Database, CIHIHospital Morbidity Database, CIHI
AvailabilityApril 1, 2001 to March 31, 2002
ComprehensivenessNot all provinces and regions across Canada submit comprehensively to the DischargeAbstract Database. For this reason, the province of Manitoba was excluded from theanalysis. Three Alberta health regions: Chinook (4820), Calgary (4822) and Palliser(4821) were excluded from the analysis due to underreporting of epidural anaestheticuse. Consequently, the national rate and the provincial rate for Alberta exclude thosejurisdictions.
References1 Truman C, Jin Y. (2002). Use of epidural analgesia for labor and delivery in Alberta.
CRRM; 7(4):265–70.2 Truman C, Jin Y, Johnson D. (2002).Use of Epidural Analgesia for Labour and
Delivery in Alberta. Technical Report. Alberta Centre for Health Services Utilization Research, September.
3 Perinatal Partnership Program of Eastern and Southeastern Ontario. (2003). PPPESO Annual Perinatal Statistical Report 2002, May.
4 Rourke JTB. (1998). Trends in small hospital obstetric services in Ontario. Can FamPhysician; 44:2117–2124.
5 Oyston J. (1995). Obstetrical anaesthesia in Ontario. Can J Anaesth; 42(12):1117–1125.6 Alberta Reproductive Health: Pregnancy Outcomes. Alberta Health and Wellness 2001.
www.asac.ab.ca/Pubs/reproductiveHealthStudy2001.pdf.7 Canadian Anesthesiologists’ Society. www.cas.ca/public/anesthesia_and_you/
default.asp?load=anesthesia - 6.

47
3 BRate of Epidural Anaesthesia for All Deliveries
DefinitionNumber of acute hospital deliveries where epidural anaesthetic was used, expressed as a proportion of all deliveries
Method of Calculation(Number of deliveries where epidural anaesthetic was used/number of all deliveries) * 100
Denominator: Number of All DeliveriesA delivery was identified using the following diagnostic codes:
ICD-9 Any one diagnosis code of 640-676 and with a fifth digit of “1” or “2”; 650; V27.0, V27.2, V27.3, V27.5, or V27.6, in any position
ICD-9-CM Any one diagnosis code of 640-676 and with a fifth digit of “1” or “2”;650; V27.0, V27.2, V27.3, V27.5, or V27.6, in any position
ICD-10 Any one diagnosis code of O1, O2, O4, O6, O7, O8, O9, O30-O35,O37, O36.0, O36.1, O36.2, O36.3, O36.5, O36.6, O36.7, O36.8, orO36.9 and with a sixth digit of “1” or “2” in any position; Z37.0, Z37.2, Z37.3, Z37.5, or Z37.6 in the first position
Denominator ExclusionsDeliveries in which an abortive procedure was provided:
CCP Any one procedure code of 86.3, 86.4, 87.0, 87.1, or 87.2
ICD-9-CM Any one procedure code of 74.3, 74.91, 75.0, 69.51, or 69.01
CCI Any one procedure code of 5.CA.93.EM, 5.CA.93.EQ, 5.MD.60.KF,5.MD.60.RE, 5.MD.60.RF, 5.CA.88, 5.CA.89
Code may be recorded in any position. Cancelled, previous, out-of-hospital, and“abandoned after onset” cases were excluded.

B
48
Giv
ing
Birt
h in
Can
ada:
A R
egio
nal P
rofil
e
Numerator: Number of Deliveries Where Epidural Anaesthetic Was UsedSince this number is a subset of the denominator, the same exclusion criteria used inthe calculation of the denominator were applied. Either of the following codes wasused to identify cases of epidural anaesthesia:
Anaesthetic technique codeAnaesthetic technique code equal to “3” or procedure code of
CCP 16.91ICD-9-CM 03.91CCI 5.LD.20.HA-P1
Data SourcesDischarge Abstract Database, CIHIHospital Morbidity Database, CIHI
AvailabilityApril 1, 2001 to March 31, 2002
ComprehensivenessNot all provinces and regions across Canada submit comprehensively to the DischargeAbstract Database. For this reason, the province of Manitoba was excluded from theanalysis. Three Alberta health regions: Chinook (4820), Calgary (4822) and Palliser(4821) were excluded from the analysis due to underreporting of epidural anaestheticuse. Consequently, the national rate and the provincial rate for Alberta exclude thosejurisdictions.
References1 Truman C, Jin Y. (2002). Use of epidural analgesia for labor and delivery in Alberta.
CRRM; 7(4):265–70.2 Truman C, Jin Y, Johnson D. (2002).Use of Epidural Analgesia for Labour and
Delivery in Alberta. Technical Report. Alberta Centre for Health Services Utilization Research, September.
3 Perinatal Partnership Program of Eastern and Southeastern Ontario. (2003). PPPESO Annual Perinatal Statistical Report 2002, May.
4 Rourke JTB. (1998). Trends in small hospital obstetric services in Ontario. Can FamPhysician; 44:2117–2124.
5 Oyston J. (1995). Obstetrical anaesthesia in Ontario. Can J Anaesth; 42(12):1117–1125.6 Alberta Reproductive Health: Pregnancy Outcomes. Alberta Health and Wellness 2001.
www.asac.ab.ca/Pubs/reproductiveHealthStudy2001.pdf.7 Canadian Anesthesiologists’ Society. www.cas.ca/public/anesthesia_and_you/
default.asp?load=anesthesia - 6.
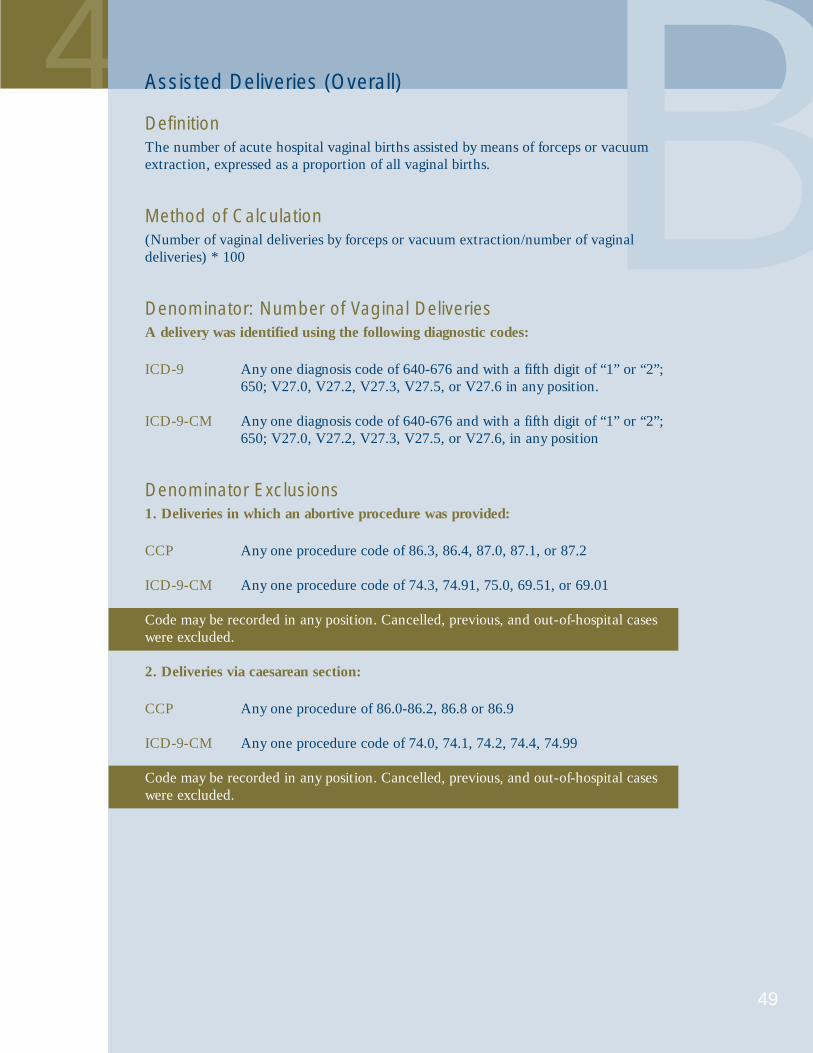
49
4 BAssisted Deliveries (Overall)
DefinitionThe number of acute hospital vaginal births assisted by means of forceps or vacuumextraction, expressed as a proportion of all vaginal births.
Method of Calculation(Number of vaginal deliveries by forceps or vacuum extraction/number of vaginaldeliveries) * 100
Denominator: Number of Vaginal DeliveriesA delivery was identified using the following diagnostic codes:
ICD-9 Any one diagnosis code of 640-676 and with a fifth digit of “1” or “2”;650; V27.0, V27.2, V27.3, V27.5, or V27.6 in any position.
ICD-9-CM Any one diagnosis code of 640-676 and with a fifth digit of “1” or “2”;650; V27.0, V27.2, V27.3, V27.5, or V27.6, in any position
Denominator Exclusions1. Deliveries in which an abortive procedure was provided:
CCP Any one procedure code of 86.3, 86.4, 87.0, 87.1, or 87.2
ICD-9-CM Any one procedure code of 74.3, 74.91, 75.0, 69.51, or 69.01
Code may be recorded in any position. Cancelled, previous, and out-of-hospital caseswere excluded.
2. Deliveries via caesarean section:
CCP Any one procedure of 86.0-86.2, 86.8 or 86.9
ICD-9-CM Any one procedure code of 74.0, 74.1, 74.2, 74.4, 74.99
Code may be recorded in any position. Cancelled, previous, and out-of-hospital caseswere excluded.
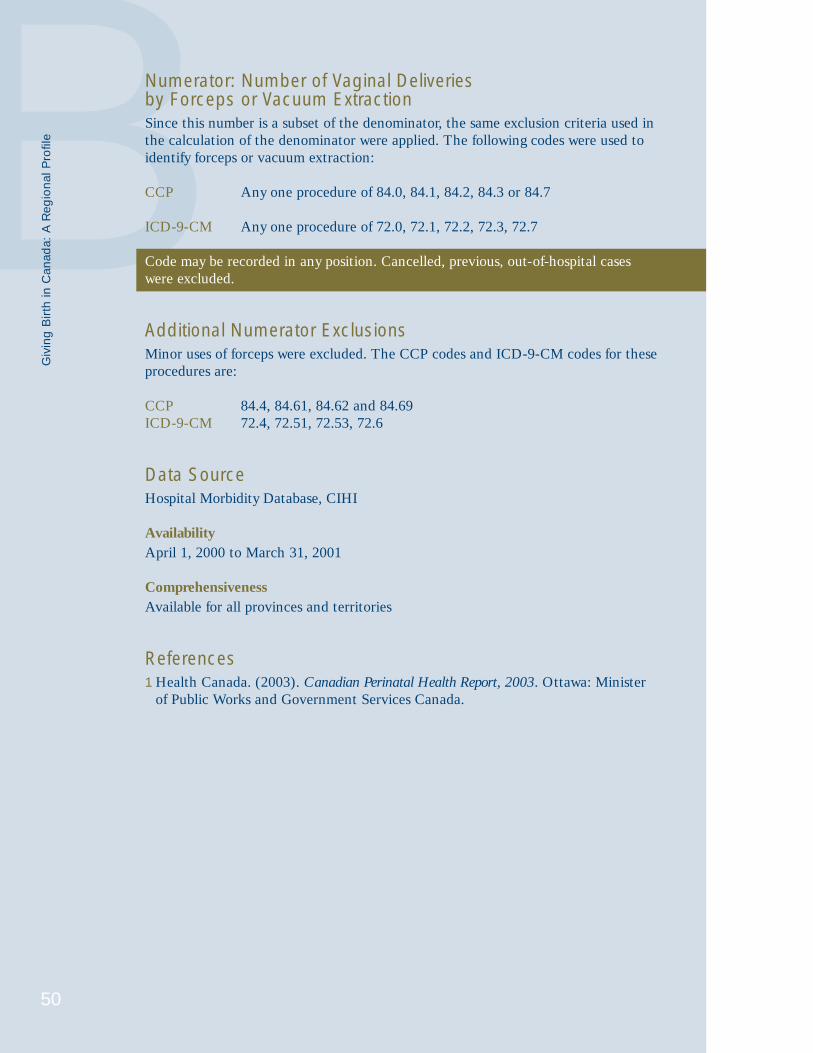
B
50
Giv
ing
Birt
h in
Can
ada:
A R
egio
nal P
rofil
e
Numerator: Number of Vaginal Deliveries by Forceps or Vacuum ExtractionSince this number is a subset of the denominator, the same exclusion criteria used inthe calculation of the denominator were applied. The following codes were used toidentify forceps or vacuum extraction:
CCP Any one procedure of 84.0, 84.1, 84.2, 84.3 or 84.7
ICD-9-CM Any one procedure of 72.0, 72.1, 72.2, 72.3, 72.7
Code may be recorded in any position. Cancelled, previous, out-of-hospital cases were excluded.
Additional Numerator ExclusionsMinor uses of forceps were excluded. The CCP codes and ICD-9-CM codes for theseprocedures are:
CCP 84.4, 84.61, 84.62 and 84.69ICD-9-CM 72.4, 72.51, 72.53, 72.6
Data SourceHospital Morbidity Database, CIHI
AvailabilityApril 1, 2000 to March 31, 2001
ComprehensivenessAvailable for all provinces and territories
References1 Health Canada. (2003). Canadian Perinatal Health Report, 2003. Ottawa: Minister
of Public Works and Government Services Canada.

51
5 BAssisted Deliveries (Forceps)
DefinitionThe number of acute hospital vaginal births assisted by means of forceps, expressed asa proportion of all vaginal births.
Method of Calculation(Number of vaginal deliveries by forceps/number of vaginal deliveries) * 100
Denominator: Number of Vaginal DeliveriesA delivery was identified using the following diagnostic codes:
ICD-9 Any one diagnosis code of 640-676 and with a fifth digit of “1” or “2”;650; V27.0, V27.2, V27.3, V27.5, or V27.6 in any position.
ICD-9-CM Any one diagnosis code of 640-676 and with a fifth digit of “1” or “2”;650; V27.0, V27.2, V27.3, V27.5, or V27.6, in any position
Denominator Exclusions1. Deliveries in which an abortive procedure was provided:
CCP Any one procedure code of 86.3, 86.4, 87.0, 87.1, or 87.2
ICD-9-CM Any one procedure code of 74.3, 74.91, 75.0, 69.51, or 69.01
Code may be recorded in any position. Cancelled, previous, and out-of-hospitalcases were excluded.
2. Deliveries via caesarean section:
CCP Any one procedure of 86.0-86.2, 86.8 or 86.9
ICD-9-CM Any one procedure code of 74.0, 74.1, 74.2, 74.4, 74.99
Code may be recorded in any position. Cancelled, previous, and out-of-hospital caseswere excluded.
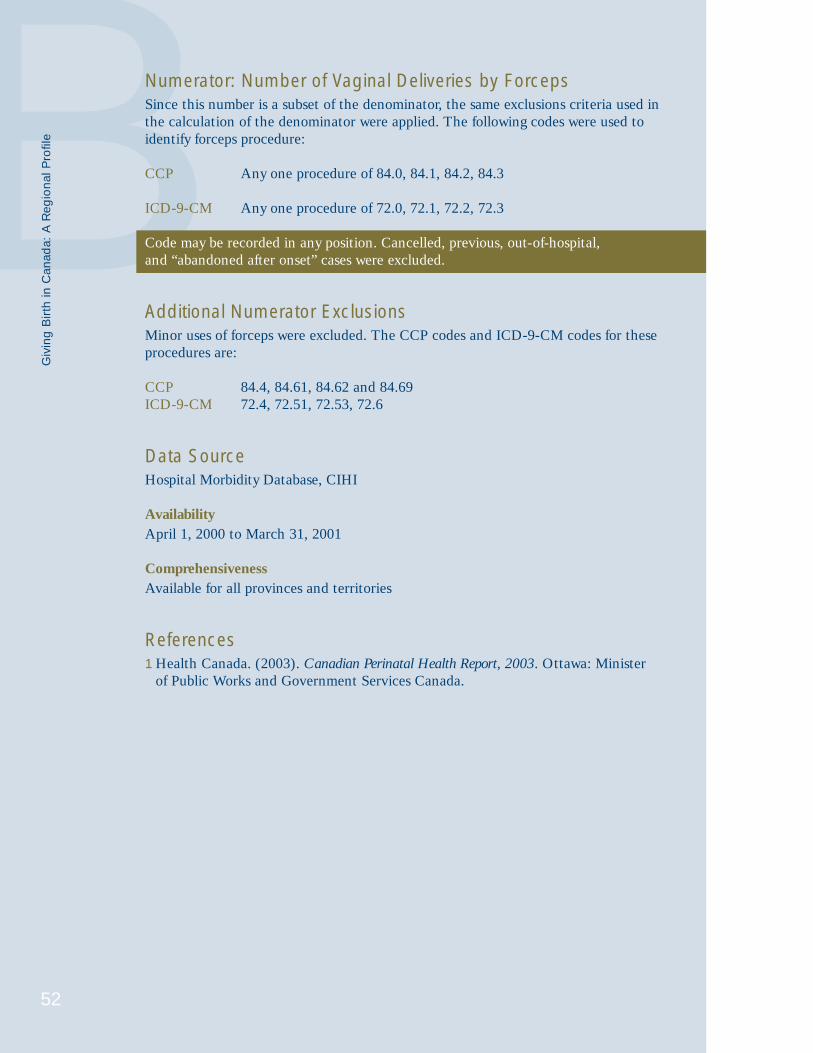
B
52
Giv
ing
Birt
h in
Can
ada:
A R
egio
nal P
rofil
e
Numerator: Number of Vaginal Deliveries by ForcepsSince this number is a subset of the denominator, the same exclusions criteria used inthe calculation of the denominator were applied. The following codes were used toidentify forceps procedure:
CCP Any one procedure of 84.0, 84.1, 84.2, 84.3
ICD-9-CM Any one procedure of 72.0, 72.1, 72.2, 72.3
Code may be recorded in any position. Cancelled, previous, out-of-hospital, and “abandoned after onset” cases were excluded.
Additional Numerator ExclusionsMinor uses of forceps were excluded. The CCP codes and ICD-9-CM codes for theseprocedures are:
CCP 84.4, 84.61, 84.62 and 84.69ICD-9-CM 72.4, 72.51, 72.53, 72.6
Data SourceHospital Morbidity Database, CIHI
AvailabilityApril 1, 2000 to March 31, 2001
ComprehensivenessAvailable for all provinces and territories
References1 Health Canada. (2003). Canadian Perinatal Health Report, 2003. Ottawa: Minister
of Public Works and Government Services Canada.

6
53
BAssisted Deliveries (Vacuum Extraction)
DefinitionThe number of acute hospital vaginal births by vacuum, extraction expressed as a proportion of all vaginal births.
Method of Calculation(Number of deliveries by vacuum extraction/number of vaginal deliveries) * 100
Denominator: Number of Vaginal DeliveriesA delivery was identified using the following diagnostic codes:
ICD-9 Any one diagnosis code of 640-676 and with a fifth digit of “1” or “2”;650; V27.0, V27.2, V27.3, V27.5, or V27.6 in any position.
ICD-9-CM Any one diagnosis code of 640-676 and with a fifth digit of “1” or “2”;650; V27.0, V27.2, V27.3, V27.5, or V27.6, in any position
Denominator Exclusions1. Deliveries in which an abortive procedure was provided:
CCP Any one procedure code of 86.3, 86.4, 87.0, 87.1, or 87.2
ICD-9-CM Any one procedure code of 74.3, 74.91, 75.0, 69.51, or 69.01
Code may be recorded in any position. Cancelled, previous, and out-of-hospital caseswere excluded.
2. Deliveries via caesarean section:
CCP Any one procedure of 86.0-86.2, 86.8 or 86.9
ICD-9-CM Any one procedure code of 74.0, 74.1, 74.2, 74.4, 74.99
Code may be recorded in any position. Cancelled, previous, and out-of-hospital caseswere excluded.

B
54
Giv
ing
Birt
h in
Can
ada:
A R
egio
nal P
rofil
e
Numerator: Number of Vaginal Deliveries by Vacuum ExtractionSince this number is a subset of the denominator, the same exclusions criteria used inthe calculation of the denominator were applied. The following codes were used toidentify vacuum extraction:
CCP 84.7ICD-9-CM 72.7
Code may be recorded in any position. Cancelled, previous, and out-of-hospital caseswere excluded.
Data SourceHospital Morbidity Database, CIHI
AvailabilityApril 1, 2000 to March 31, 2001
ComprehensivenessAvailable for all provinces and territories
References1 Health Canada. (2003). Canadian Perinatal Health Report, 2003. Ottawa: Minister
of Public Works and Government Services Canada.

7
55
BRate of Primary Caesarean Deliveries
DefinitionProportion of women delivering babies in acute care hospitals by caesarean sectionamong women who have not previously had a caesarean delivery.
Method of Calculation(Number of caesarean sections among women who have not previously had a caesarean delivery/number of deliveries excluding women who have previously had a caesarean delivery) * 100
Denominator: Deliveries Among Women Who Have Not Previously Had a Caesarean DeliveryA delivery was identified using the following diagnostic codes:
ICD-9 Any one diagnosis code of 640-676 and with a fifth digit of “1” or “2”;650; V27.0, V27.2, V27.3, V27.5, or V27.6, in any position
ICD-10 Any one diagnosis code of O1, O2, O4, O6, O7, O8, O9, O30-O35,O37, O36.0, O36.1, O36.2, O36.3, O36.5, O36.6, O36.7, O36.8, orO36.9 and with a sixth digit of “1” or “2” in any position;Z37.0, Z37.2, Z37.3, Z37.5, or Z37.6 in any position
Denominator Exclusions1. Deliveries in which an abortive procedure was provided:
CCP Any one procedure code of 86.3, 86.4, 87.0, 87.1, or 87.2
CCI Any one procedure code of 5.CA.93.EM, 5.CA.93.EQ, 5.MD.60.KF,5.MD.60.RE, 5.MD.60.RF, 5.CA.88, 5.CA.89
Code may be recorded in any position. Cancelled, previous, out-of-hospital, and“abandoned after onset” cases were excluded.
2. Women with a history of uterine scar:
ICD-9 Diagnosis code 6542 in any position
ICD-10 Any one diagnosis code of O34201, O75701 in any position

B
56
Giv
ing
Birt
h in
Can
ada:
A R
egio
nal P
rofil
e
Numerator: Primary Caesarean SectionsSince the numerator is a subset of the denominator, the same exclusion criteria used inthe calculation of the denominator were applied. The following codes were used toidentify caesarean section:
CCP Any one procedure of 86.0-86.2, 86.8, or 86.9
CCI 5.MD.60
Code may be recorded in any position. Cancelled, previous, out-of-hospital, and“abandoned after onset” cases were excluded.
Standards/BenchmarksGuidelines defining the appropriate indications for caesarean section are available.
Data SourceHospital Morbidity Database, CIHI
AvailabilityApril 1, 2001 to March 31, 2002
ComprehensivenessCentral Vancouver Island (health region 5942) was excluded from the analysis due tounderreporting of uterine scar within the region, and (primary caesarean section ratescould not be reliably calculated). Consequently, the national rate and the provincialrate for British Columbia were calculated excluding this region.
References1 Health Canada. (2003). Canadian Perinatal Health Report, 2003. Ottawa: Minister
of Public Works and Government Services Canada.

57
8 BPostnatal Hospital Admissions
DefinitionNumber of infants who were readmitted to an acute care hospital within 28 days of birth, per 100 live births.
Method of Calculation(Number of infants who were readmitted to an acute care hospital within 28 days of birth/number of acute care hospital live births) * 100.
Denominator: Live BirthsThe number of hospital live births was identified using CIHI’s abstract entry flag for newborns coded as “N.”
Denominator ExclusionsNewborns with a birth weight of less than 1,000 g or a missing weight value were excluded.
Numerator: Postnatal Hospital AdmissionsAny admission to an acute care hospital within 28 days after birth.
Numerator ExclusionsNewborns who were transferred to another institution after birth; newborns with initial length of hospital stay greater than 20 days; newborns with a birth weight of less than 1,000 g or a missing weight value; newborns discharged on the same day of birth; and day surgery admissions.
Data SourcesDischarge Abstract Database, CIHIBanque de donneés sur les hospitalisations du système Med-Écho, Ministère de laSanté et des Services sociaux (Québec)
AvailabilityApril 1, 2000 to March 31, 2001
ComprehensivenessIncludes only jurisdictions that submit comprehensively to the database, therefore datafrom Manitoba are excluded from the analysis.
B
58
Giv
ing
Birt
h in
Can
ada:
A R
egio
nal P
rofil
e
References1 Braveman P, Egerter S, Pearl M, Marchi K, Miller C. (1995). Problems associated
with early discharge of newborn infants. Early discharge of newborns and mothers: A critical review of the literature. Pediatrics, 96, 716–726.
2 Liu LL, Clemens CJ, Shay DK, Davis RL, Novack AH. (1997). The safety of new-born early discharge. The Washington State experience. Journal of the AmericanMedical Association, 278, 293–298.
3 Britton JR, Britton HL, Beebe SA. (1994). Early discharge of the term newborn: A continued dilemma. Pediatrics, 94, 291–295.
4 Lee KS, Perlman M, Ballantyne M, Elliott I, To T. (1995). Association between duration of neonatal hospital stay and readmission rate. Journal of Pediatrics, 127, 758–766.
6 Lee KS, Perlman M. (1996). The impact of early obstetric discharge on newbornhealth care. Current Opinion in Pediatrics, 8, 96–101.
7 Canadian Paediatric Society, Society of Obstetricians and Gynaecologists of Canada. (1996). Facilitating discharge home following a normal term birth.Paediatrics & Child Health, 1, 165–168.
8 Health Canada. (2003). Canadian Perinatal Health Report, 2003. Ottawa: Minister of Public Works and Government Services Canada.

59
For More Information1 University of California, Los Angeles School of Public Health Department
of Epidemiology. (2001). Anesthesia and Queen Victoria. www.ph.ucla.edu/epi/snow/victoria.html.
2 McCool WF, Simeone SA. (2002). Birth in the United States: An overview of trends past and present. The Nursing Clinics of North America, 37, 735–746.
3 Tew M. (1990). Safer Childbirth? A Critical History of Maternity Care.London, UK: Chapman and Hall.
4 Carr I. (2004). Dying to Have a Baby—The History of Childbirth: ObstetricForceps. University of Manitoba Department of Obstetrics, Gynecology andReproductive Sciences. www.umanitoba.ca/outreach/manitoba_womens_health/hist1a.htm.
5 The Association of Anaesthetists of Great Britain & Ireland. (2004). The History of Anaesthesia. www.aagbi.org/pub_history.html.
6 Mitchinson W. (2002). Giving Birth in Canada, 1900–1950. Toronto:University of Toronto Press.
7 Enkin MW. (2004). Birthing Practices. In The Canadian Encyclopedia.www.thecanadianencyclopedia.com/PrinterFriendly.cfm?Params=A1ARTA0000780.
8 Meckel RA. (1990). Save the Babies: American Public Health Reform and thePrevention of Infant Mortality, 1850–1929. Baltimore, Maryland: The JohnsHopkins University Press.
9 Statistics Canada. (2004). Live Births and Fetal Deaths, by Place of Birth,Canada, Provinces and Territories, Annual. http://cansim2.statcan.ca/cgi-win/CNSMCGI.EXE.
10 Royal Commission on New Reproductive Technologies. (1993). ProceedWith Care: Final Report on the Royal Commission on New ReproductiveTechnologies. Ottawa: Canada Communication Group.
11 Fountain L, Krulewitch CJ. (2002). Trends in assisted reproductive technology. Journal of Midwifery & Women’s Health, 47(5), 384–385.
12 Centers for Disease Control and Prevention. (2003). 2001 AssistedReproductive Technology Success Rates: National Summary and Fertility Clinic Reports. www.cdc.gov/reproductivehealth/art.htm.
13 Reynolds MA, Schieve LA, Martin JA, Jeng G, Macaluso M. (2003). Trends in multiple births conceived using assisted reproductive technology,United States, 1997–2000. Pediatrics, 111(5), 1159–1162.
14 Health Canada. (2004). Multiple Births and the Proposed Act on AssistedHuman Reproduction. www.hc-sc.gc.ca/english/protection/reproduction/multiple_births.htm.
15 Accreditation Committee of the Canadian Fertility and Andrology Society.(2003). Human Assisted Reproduction Live Birth Rates for Canada. www.cfas.ca/english/news/news8.asp.
16 Statistics Canada. (2001). Births, 2001. (84F0210XPB).
Giv
ing
Birt
h in
Can
ada:
A R
egio
nal P
rofil
e
60
17 Society of Obstetricians and Gynaecologists of Canada. (2001). SOGCStatement on Vaginal Breech. www.rcp.gov.bc.ca/Guidelines/Statements/SOGCvaginalbreechstatement.pdf.
18 Adair CD. (2000). Nonpharmacologic approaches to cervical priming andlabor induction. Clinical Obstetrics and Gynecology, 43(3), 447–454.
19 Tenore JL. (2003). Methods for cervical ripening and induction of labor.American Family Physician, 67(10), 2123–2138.
20 Kozak LJ, Dawson Weeks J. (2002). U.S. trends in obstetric procedures,1990–2000. Birth, 29(3), 157–161.
21 Bartholomew S, Crain J, Dzakpasu S, Kohut R, Liu S, Rusen ID, Wen SW.(2003). Canadian Perinatal Health Report, 2003. Ottawa: Minister of PublicWorks and Government Services Canada. www.hc-sc.gc.ca/pphb-dgspsp/publicat/cphr-rspc03/pdf/cphr-rspc03_e.pdf.
22 Sue-A-Quan AK, Hannah ME, Cohen MM, Foster GA, Liston RM.(1999). Effect of labour induction on rates of stillbirth and cesarean section in post-term pregnancies. Canadian Medical Association Journal,160(8), 1145–1149.
23 Zhang J, Yancey MK, Henderson CE. (2002). U.S. national trends in labor induction, 1989–1998. The Journal of Reproductive Medicine, 47(2), 120–124.
24 Rayburn WF, Zhang J. (2002). Rising rates of labor induction: Present concerns and future strategies. Obstetrics and Gynecology, 100(1), 164–167.
25 Maslow AS, Sweeny AL. (2000). Elective induction of labor as a risk factor for cesarean delivery among low-risk women at term. Obstetrics and Gynecology, 95(6), 917–922.
26 Yeast JD, Jones A, Poskin M. (1999). Induction of labor and the relationshipto cesarean delivery: A review of 7001 consecutive inductions. AmericanJournal of Obstetrics and Gynecology, 180(3), 628–633.
27 Miles AM, Monga M, Waller K, Dande D, Pschirrer ER. (2000). Risk factors for symptomatic uterine rupture during a trial of labor: The 1990s.American Journal of Perinatology, 17(7), 385–389.
28 Manbit Technologies. (2004). Effects on the Baby. www.manbit.com/obstetspain/n2o11.htm.
29 Chalmers B, Mangiaterra V, Porter R. (2001). WHO principles of perinatalcare: The essential antenatal, perinatal, and postpartum care course. Birth,28(3), 202–207.
30 Hodnett ED, Gates S, Hofmeyr GJ, Sakala C. (2004). Continuous supportfor women during labour. (Cochrane Database Systematic Review). In TheCochrane Library, Issue 2, 2004. Chichester: UK, John Wiley & Sons, Ltd.
31 Howell CJ. (2004). Epidural versus non-epidural for pain relief in labour.(Cochrane Database Systematic Review). In The Cochrane Library, Issue 2,2004. Chichester, UK, John Wiley & Sons, Ltd.
32 Leighton BL, Halpern SH. (2002). The effects of epidural analgesia onlabor, maternal, and neonatal outcomes: A systematic review. AmericanJournal of Obstetrics and Gynecology, 186(5), S69–S77.

61
33 Lieberman E, O’Donoghue C. (2002). Unintended effects of epidural analgesia during labor: A systematic review. American Journal of Obstetricsand Gynecology, 186(5), S31–S68.
34 Declercq ER, Sakala C, Corry MP, Applebaum S, Risher P. (2002).Listening to Mothers: Report of the First National U.S. Survey of Women’sChildbearing Experiences. www.maternitywise.org/pdfs/LtMreport.pdf.
35 Government Statistical Service. (2004). NHS Maternity Statistics, England: 2002–03. www.publications.doh.gov.uk/public/sb0410.pdf.
36 Kitzinger S. (2004). Sheila Kitzinger’s letter from Europe: What’s happening to midwives in Europe? Birth, 31(1), 68–70.
37 Comparative Obstetric Mobile Epidural Trial (COMET) Study Group.(2001). Effect of low-dose mobile versus traditional epidural techniques onmode of delivery: A randomized controlled trial. The Lancet, 358, 19–23.
38 Birnbach DJ. (2000). Obstetric anesthesiology in the new millennium.Anesthesia and Analgesia, 90, 1241–1243.
39 D’Angelo R. (2003). New techniques for labor analgesia: PCEA and CSE.Clinical Obstetrics and Gynecology, 46(3), 623–631.
40 Klein MC, Grzybowski S, Harris S, Liston R, Spence A, Le G,Brummendorf D, Kim S, Kaczorowski J. (2001). Epidural analgesia use as a marker for physician approach to birth: Implications for maternal and newborn outcomes. Birth, 28(4), 243–248.
41 Hueston WJ, McClaflin RR, Mansfield CJ, Rudy M. (1994). Factors associated with the use of intrapartum epidural analgesia. Obstetrics and Gynecology, 84, 579–582.
42 Perinatal Partnership Program of Eastern and Southeastern Ontario.(2004). PPPESO Annual Perinatal Statistical Report 2003. www.pppeso.on.ca/english/statisticalreport_2003.pdf.
43 Vincent RD, Chestnut DH. (1998). Epidural analgesia during labor.American Family Physician, 58(8), 1785–1792.
44 Perinatal Partnership Program of Eastern and Southeastern Ontario.(2002). Perinatal Newsletter, 19(3), 1–6.
45 Marmor TR, Krol DK. (2002). Labor pain management in the UnitedStates: Understanding patterns and the issue of choice. American Journal of Obstetrics and Gynecology, 186(5), S173–S180.
46 Cunningham FG, Gant NF, Leveno KJ, Gilstrap LC, Hauth JC, Wenstrom KD. (2001). Williams Obstetrics. Toronto: McGraw-Hill Medical Publishing Division.
47 Cargill YM, MacKinnon CJ. (2004). SOGC clinical practice guidelines:Guidelines for operative vaginal birth. Journal of Obstetrics and GynaecologyCanada, 25, 660–670.
48 Towner D, Castro MA, Eby-Wilkens E, Gilbert WM. (1999). Effect ofmode of delivery in nulliparous women on neonatal intracranial injury. TheNew England Journal of Medicine, 341(23), 1709–1714.
Giv
ing
Birt
h in
Can
ada:
A R
egio
nal P
rofil
e
62
49 Demissie K, Rhoads GG, Smulian JC, Balasubramanian BA, Gandhi K.(2004). Operative vaginal delivery and neonatal and infant adverse outcomes: Population based retrospective analysis. British Medical Journal, 329, 1–6.
50 Castro MA, Hoey SD, Towner D. (2003). Controversies in the use of thevacuum extractor. Seminars in Perinatology, 27(1), 46–53.
51 Johanson RB, Menon V. (2004). Vacuum extraction versus forceps for assisted vaginal delivery (Cochrane Database Systematic Review). In The Cochrane Library, Issue 1, 2004.
52 Wen SW, Liu S, Kramer MS, Marcoux S, Ohlsson A, Sauve R, Liston R.(2001). Comparison of maternal and infant outcomes between vacuumextraction and forceps deliveries. American Journal of Epidemiology, 153(2), 103–107.
53 Kabiru WN, Jamieson D, Graves W, Lindsay M. (2001). Trends in operative vaginal delivery rates and associated maternal complication rates in an inner-city hospital. American Journal of Obstetrics andGynecology, 184(6), 1112–1114.
54 Society of Obstetricians and Gynaecologists of Canada. (1996). Guidelinesfor the safe and appropriate use of forceps in modern obstetrics. Journal ofthe Society of Obstetricians and Gynaecologists of Canada, 65–66.
55 Burlington DB. (1998). FDA Public Health Advisory: Need for CautionWhen Using Vacuum Assisted Delivery Devices. www.fda.gov/cdrh/fetal598.html.
56 Losos JZ. (1999). The Use of Vacuum Assisted Delivery Devices and Fetal Subgaleal Haemorrhage. www.hc-sc.gc.ca/hpfb-dgpsa/tpd-dpt/alert_110_e.pdf.
57 [Author unknown] (1984). Vacuum versus forceps. The Lancet,323(8369), 144.
58 Australian Institute of Health and Welfare National Perinatal Statistics Unit. (2004). Australia’s Mothers and Babies 2000.www.npsu.unsw.edu.au/ps12.pdf.
59 New Zealand Health Information Service. (2003). Report on Maternity2000 & 2001. www.nzhis.govt.nz/publications/maternityreport00-01.pdf.
60 Cunningham FG, Gant NF, Leveno KJ, Gilstrap LC, Hauth JC, Wenstrom KD.(2001). Operative Obstetrics. In Williams Obstetrics. Toronto: McGraw-HillMedical Publishing Division.
61 Joseph KS, Young DS, Dodds L, O’Connell CM, Allen VM, Chandra S,Allen AC. (2003). Changes in maternal characteristics and obstetric practice and recent increases in primary cesarean delivery. Obstetrics andGynecology, 102, 791–800.
62 Robertson PA, Laros Jr. RK, Zhao R. (1990). Neonatal and maternal outcome in low-pelvic and mid-pelvic operative deliveries. AmericanJournal of Obstetrics and Gynecology, 162, 1436–1444.
63 Patel RR, Murphy DJ. (2004). Forceps delivery in modern obstetric practice. British Medical Journal, 328, 1302–1305.
64 Bonni A. (2003). Forceps Delivery. www.emedicine.com/med/topic3284.htm.
65 Sciarra C, Trim K. (2000). Operative Vaginal Deliveries in Hamilton. A Review of Residents’ Readiness to Practice in Relation to Maternal and Neonatal Morbidities. Department of Obstetrics and Gynecology,McMaster University.
66 Pope CS, O’Grady JP, Hoffman D. (2002). Vacuum Extraction. www.emedicine.com/med/topic3389.htm.
67 Park JS, Robinson JN, Norwitz ER. (2003). Rotational forceps: Shouldthese procedures be abandoned? Seminars in Perinatology, 27(1), 112–120.
68 Sibbald B. (1999). SOGC sounds ALARM on legal pitfalls facingOB/Gyns. Canadian Medical Association Journal, 161(5), 565–567.
69 Learman LA. (1998). Regional differences in operative obstetrics: A look to the south. Obstetrics and Gynecology, 92(4), 514–519.
70 Bofill JA, Rust OA, Perry Jr. KG, Roberts WE, Martin RW, Morrison JC.(1996). Forceps and vacuum delivery: A survey of North American residency programs. Obstetrics and Gynecology, 88(4), 622–625.
71 Bofill JA. (2000). Operative obstetrics: A lost art? Obstetrical andGynecological Survey, 55(7), 405–406.
72 O’Grady JP, Pope CS, Hoffman DE. (2002). Forceps delivery. ClinicalObstetrics and Gynecology, 16(1), 1–16.
73 Schoon PG. (2001). A guest editorial: Episiotomy: Yea or nay. Obstetricaland Gynecological Survey, 56(11), 667–669.
74 Klein MC, Gauthier RJ, Robbins JM, Kaczorowski J, Jorgensen SH, Franco ED, Johnson B, Waghorn K, Gelfand MM, Guralnick MS, Luskey GW, Joshi AK. (1994). Relationship of episiotomy to perineal trauma and morbidity, sexual dysfunction, and pelvic floor relaxation.American Journal of Obstetrics and Gynecology, 171, 591–598.
75 Flynn P, Franiek J, Janssen P, Hannah WJ, Klein MC. (1997). How can sec-ond stage management prevent perineal trauma? Critical review. CanadianFamily Physician, 43, 73–84.
76 Schuurmans N, Gagné GP, Ezzat A, Colliton I, MacKinnon CJ, Dushinski B,Caddick R. (1998). Healthy beginnings: Guidelines for care during pregnancy and childbirth. Journal of the Society of Obstetricians andGynaecologists of Canada, 71, 55–58.
77 Carroli G, Belizan J. (2004). Episiotomy for vaginal birth. (CochraneDatabase Systematic Review). In The Cochrane Library, Issue 2, 2004.
78 Eason E, Labrecque M, Wells G, Feldman P. (2000). Preventing perinealtrauma during childbirth: A systematic review. Obstetrics and Gynecology,95(3), 464–471.
79 Riskin-Mashiah S, O’Brien Smith E, Wilkins IA. (2002). Risk factors forsevere perineal tear: Can we do better? American Journal of Perinatology,19(5), 225–234.
80 Signorello LB, Harlow BL, Chekos AK, Repke JT. (2000). Midline episiotomy and anal incontinence: Retrospective cohort study. British Medical Journal, 320, 86–90.
63

81 Weber AM, Walters MD, Piedmonte MR, Ballard LA. (2001). Anterior colporrhaphy: A randomized trial of three surgical techniques. American Journal of Obstetrics and Gynecology, 185(6), 1299–1304.
82 Martin JA, Hamilton BE, Sutton PD, Ventura SJ, Menacker F, MunsonML. (2003). Division of Vital Statistics. Births: Final Data for 2002.National Vital Statistics Reports, 52(10).
83 Royal College of Obstetricians and Gynaecologists Clinical EffectivenessSupport Unit. (2001). The National Sentinel Caesarean Section Audit Report.London, England, RCOG Press.
84 Bailit JL, Dooley SL, Peaceman AN. (1999). Risk adjustment for interhospital comparison of primary cesarean rates. Obstetrics and Gynecology, 93(6), 1025–1030.
85 Heffner LJ, Elkin E, Fretts RC. (2003). Impact of labor induction, gestational age, and maternal age on cesarean delivery rates. Obstetrics and Gynecology, 102(2), 287–293.
86 Liston R, Crane J. (2002). Fetal health surveillance in labour. Journal of Obstetrics and Gynaecology Canada, 112, 1–13.
87 Martel MJ, MacKinnon CJ. (2004). SOGC Clinical Practice Guidelines:Guidelines for vaginal birth after previous caesarean birth. Journal ofObstetrics and Gynaecology Canada, 26(7), 660–670.
88 House of Commons Health Committee. (2003). Provision of Maternity Services: Fourth Report of Session 2002–03, Volume 1, 2003 London, England, The Stationary Office Limited.
89 Minkoff H, Chervenak FA. (2003). Elective primary caesarean delivery. The New England Journal of Medicine, 348(10), 946–950.
90 Hannah ME. (2004). Planned elective caesarean section: A reasonable choice for some women? Canadian Medical Association Journal, 170(5), 813–814.
91 Jackson N, Paterson-Brown S. (2001). Physical sequelae of caesarean section. Clinical Obstetrics and Gynecology, 15(1), 49–61.
92 DiGirolamo AM, Grummer-Strawn LM, Fein S. (2001). Maternity carepractices: Implications for breastfeeding. Birth, 28(2), 94–100.
93 Bond GM, Holloway M. (1992). Anaesthesia and breast-feeding—The effect on mother and infant. Anaesthesia and Intensive Care, 20(4), 426–430.
94 Hannah ME, Hannah WJ, Hewson SA, Hodnett ED, Saigai S, Willan AR.(2000). Planned caesarean section versus planned vaginal birth for breechpresentation at term: A randomized multicentre trial. The Lancet,356(9239), 1375–1383.
95 Hutton EK, Kaufman K, Hodnett E, Amankwah K, Hewson SA, McKay D, Szalai JP, Hannah ME. (2003). External cephalic version beginning at 34 weeks’ gestation versus 37 weeks’ gestation: A randomized multicentre trial. American Journal of Obstetrics andGynecology, 189, 245–254.
Giv
ing
Birt
h in
Can
ada:
A R
egio
nal P
rofil
e
64

96 Hofmeyr GJ, Kulier R. (2004). External cephalic version for breech presentation at term (Cochrane Database Systematic Review). In The Cochrane Library, Issue 2, 2004.
97 Mancuso KM, Yancey MK, Murphy JA, Markenson GR. (2000). Epidural analgesia for cephalic version: a randomized trial. Obstetrics and Gynecology, 95, 648–651.
98 Hofmeyr GJ, Hannah ME. (2004). Planned caesarean for term breechdelivery (Cochrane Database Systematic Review). In The CochraneLibrary, Issue 3, 2004.
99 McNiven P, Kaufman K, McDonald H. (2001). Best evidence in anestheticpractice prevention: Planned cesarean delivery reduces early perinatal andneonatal complications for term breech presentations. Canadian Journal ofAnaesthesia, 48(11), 1114–1116.
100 Maine D, Bailey P. (2001). Caesarean sections as a proportion of all births.In Indicators for Design, Monitoring and Evaluation of Maternal MortalityPrograms. Measure Project, AMDD Programme, Columbia University.http://cpmcnet.columbia.edu/dept/sph/popfam/amdd/docs/monitoring.pdf.
101 Walker R, Turnball D, Wilkinson C. (2002). Strategies to address globalcesarean section rates: A review of the evidence. Birth, 29(1), 28–39.
102 Organisation for Economic Co-operation and Development. (2004).OECD Health Data 2004. www.oecd.org/dataoecd/13/55/31963408.xls.
103 Wiegers TA. (2003). General practitioners and their role in maternitycare. Health Policy, 66, 51–59.
104 Cameron B, Cameron S. (2001). Outcomes in rural obstetrics, Athertonhospital 1992–2000. Australian Journal of Rural Health, 9, S39–S42.
105 Gould JB, Davey B, Stafford RS. (1989). Socioeconomic differences in rates of cesarean section. The New England Journal of Medicine,321(4), 233–239.
106 Béhague DP, Victora CG, Barros FC. (2002). Consumer demand for caesarean sections in Brazil: Informed decision making, patient choice, or social inequality? A population based birth cohort study linking ethnographic and epidemiological methods. British Medical Journal,324, 942–947.
107 Melender HL. (2002). Experiences of fears associated with pregnancy and childbirth: A study of 329 pregnant women. Birth, 29(2), 101–111.
108 Lo JC. (2003). Patients’ attitudes vs. physicians’ determination:Implications for cesarean sections. Social Science and Medicine,57, 91–96.
109 Kansal SS. (1998). The art of conceiving. Asian Journal of Obstetrics and Gynaecology Practice, 2(4), 57–58.
110 CBC News. (2004). Mothers, Doctors Debate ‘Too Posh to Push’ C-Sections.www.cbc.ca/stories/print/2004/02/27/sci-tech/c_sections040227.
111 Potter JE, Berquó E, Perpétuo IHO, Leal OF, Hopkins K, Souza MR, de Carvalho Formiga MC. (2001). Unwanted caesarean sections amongpublic and private patients in Brazil: Prospective study. British MedicalJournal, 323, 1155–1158. 65

112 Barley K, Aylin P, Bottle A, Jarman B. (2004). Dr Foster’s case notes:Social class and elective caesareans in the English NHS. British MedicalJournal, 328(7453), 1399.
113 Society of Obstetricians and Gynaecologists of Canada. (2004). C-Sections on Demand—SOGC’s Position. ww.sogc.org/sogcnet/sogc_docs/press/releases2004/pdfs/ElectiveCaesareansPart%20II.pdf.
114 Enkin M, Keirse MJNC, Neilson J, Crowther C, Duley L, Hodnett E,Hofmeyer J. (2000). A Guide to Effective Care in Pregnancy and Childbirth,Third Edition. New York: Oxford University Press.
115 Apgar V. (1953). A Proposal for a New Method of Evaluation of the NewbornInfant. International Anesthesia Research Society, July-August, 260. VirginiaBeach, VA.
116 Tappero EP, Honeyfield ME. (2003). Physical Assessment of the Newborn: A Comprehensive Approach to the Art of Physical Examination, Third Edition. Santa Rosa, CA: NICU Ink.
117 Beaulieu MD. (1994). Screening for Congenital Hypothyroidism. InCanadian Task Force on the Periodic Health Examination: Canadian Guide to Clinical Preventive Health Care, 190–194. Ottawa: Health Canada.
118 Feldman W. (1994). Screening for Phenylketonuria. In Canadian TaskForce on the Periodic Health Examination: Canadian Guide to ClinicalPreventive Health Care, 180–188. Ottawa: Health Canada.
119 Applegarth DA, Toone JR, Lowry RB. (2000). Incidence of inborn errors of metabolism in British Columbia, 1969–1996. Pediatrics, 105(1), e10–e15.
120 Wen SW, Liu S, Fowler D. (1998). Trends and variations in neonatal length of in-hospital stay in Canada. Canadian Journal of Public Health,89(2), 115–119.
121 Canadian Paediatric Society, Society of Obstetricians and Gynaecologistsof Canada. (1996). Early Discharge and Length of Stay for Term Birth.SOGC Clinical Practice Guidelines, 56, 1–8.
122 Canadian Paediatric Society, The Society of Obstetricians andGynaecologists of Canada. (2004). Facilitating Discharge Home Following a Normal Term Birth. www.cps.ca/english/statements/FN/fn96-02.htm.
123 Lock M, Ray JG. (1999). Higher neonatal morbidity after routine earlyhospital discharge: Are we sending newborns home too early? CanadianMedical Association Journal, 161(3), 249–253.
124 Goldenberg RL. (2002). The management of preterm labor. Obstetrics andGynecology, 100(5), 1020–1037.
125 Canadian Institute of Child Health. (2000). The Health of Canada’sChildren: A CICH Profile, Third Edition. Canada: CICH.
126 Joseph KS, Demissie K, Kramer MS. (2002). Obstetric intervention, stillbirth, and preterm birth. Seminars in Perinatology, 26(4), 250–259.
127 Canadian Institute of Child Health. (2004). The Health of Canada’sChildren: A CICH Profile: Low Birth Weight. www.cich.ca/PDFFiles/ProfileFactSheets/English/LBWEng.pdf.
Giv
ing
Birt
h in
Can
ada:
A R
egio
nal P
rofil
e
66

128 Kramer MS. (1997). Preventing preterm birth: Are we making anyprogress? Yale Journal of Biology and Medicine, 70, 227–232.
129 British Columbia Reproductive Care Program. (2001). Obstetric Guideline2A: Preterm Labour. www.rcp.gov.bc.ca/Guidelines/Obstetrics/December_24th,2001/Master.OB2A.PTL.October.PDF.
130 Berkowitz GS, Papiernik E. (1993). Epidemiology of preterm birth.Epidemiologic Reviews, 15(2), 414–433.
131 Van den Hof M, Crane J. (2001). Ultrasound cervical assessment in predicting preterm birth. Journal of the Society of Obstetricians and Gynaecologists of Canada, 23(5), 418–421.
132 Heaman MI, Sprague AE, Stewart PJ. (2001). Reducing the preterm birth rate: A population health strategy. Journal of Obstetric, Gynecologic,and Neonatal Nursing, 30, 20–29.
133 Iams JD. (2003). The epidemiology of preterm birth. Clinics in Perinatology, 30, 651–664.
134 Kramer MS, Platt R, Yang H, Joseph KS, Wen SW, Morin L, Usher RH.(1998). Secular trends in preterm birth. A hospital-based cohort study.Journal of the American Medical Association, 280, 1849–1854.
135 Joseph KS, Kramer MS, Marcoux S, Ohlsson A, Wen SW, Allen A, Platt R. (1998). Determinants of preterm birth rates in Canada from 1981 through 1983 and from 1992 through 1994. The New England Journal of Medicine, 339, 1434–1439.
136 Canadian Paediatric Society (Fetus and Newborn Committee). (2000). Enhanced roles for health professionals in newborn care. Paediatrics and Child Health, 5(2), 106–109.
137 Lee SK, McMillan DD, Ohlsson A, Pendray M, Synnes A, Whyte R,Chien L, Sale J, The Canadian NICU Network. (2000). Variations in practice and outcomes in the Canadian NICU network: 1996–1997.Pediatrics, 106(5), 1070–1079.
138 Noble L. (2003). Developments in neonatal technology continue to improve infant outcomes. Pediatric Annals, 32(9), 595–603.
139 Statistics Canada. (2004). Infant Mortality Rates: CANSIM Table102–0030. Ottawa: Statistics Canada. www.statcan.ca/english/Pgdb/health21a.htm.
140 Sankaran K, Chien L, Walker R, Seshia M, Ohlsson A, Lee SK, TheCanadian Neonatal Network. (2002). Variations in mortality rates amongCanadian neonatal intensive care units. Canadian Medical AssociationJournal, 166(2), 173–178.
141 British Columbia Reproductive Care Program. (2002). Report on theFindings of a Consensus Symposium on the Provision of Postpartum Services in British Columbia. http://www.rcp.gov.bc.ca/Publications/Postpartum%20Consensus.pdf.
142 Walker CR, Watters N, Nadon C, Graham K, Niday P. (1999). Dischargeof mothers and babies from hospital after birth of a healthy full-terminfant: Developing criteria through a community-wide consensus process.Canadian Journal of Public Health, 90(5), 313–315. 67
143 D’Amour D, Goulet L, Labadie JF, Bernier L, Pineault R. (2003).Accessibility, continuity and appropriateness: Key elements in assessingintegration of perineal services. Health and Social Care in the Community,11(5), 397–404.
144 Johnson D, Jin Y, Truman C. (2002). Early discharge of Alberta motherspost-delivery and the relationship to potentially preventable newbornreadmissions. Canadian Journal of Public Health, 93(4), 276–280.
145 Lee KS, Perlman M, Ballantyne M, Elliot I, To T. (1995). Associationbetween duration of neonatal hospital stay and readmission rate. Journal of Pediatrics, 127(5), 758–766.
146 Liu L, Clemens CJ, Shay SK, Davis K, Davis RL, Novack AH. (1997).The safety of newborn early discharge: The Washington State experience.Journal of the American Medical Association, 278(4), 293–298.
147 Liu S, Wen SW, McMillan D, Trouton K, Fowler D, McCourt C. (2000).Increased neonatal readmission rate associated with decreased length of hospital stay at birth in Canada. Canadian Journal of Public Health,91(1), 46–50.
148 Braveman P, Egerter S, Pearl M, Marchi K, Miller C. (1995). Early discharge of newborns and mothers: A critical review of the literature.Problems Associated with Early Discharge of Newborn Infants. Pediatrics,96(4), 716–726.
149 Gagnon AJ, Edgar L, Kramer MS, Papageorgiou A, Waghorn K, Klein MC.(1997). A randomized trial of a program of early postpartum dischargewith nurse visitation. American Journal of Obstetrics and Gynecology,176(1), 205–211.
150 Edmonson MB, Stoddard JJ, Owens LM. (1997). Hospital readmission with feeding-related problems after early postpartum discharge of normal new-borns. Journal of the American Medical Association, 278(4), 299–303.
151 Brown S, Small R, Faber B, Krastev A, Davis P. (2004). Early postnatal discharge from hospital for healthy mothers and term infants. (CochraneDatabase Systematic Review). In The Cochrane Library, Issue 1, 2004.
152 Sword WA, Watt S, Krueger PD, Lee KS, Sheehan DD, Roberts JG, Gafni A. (2001). Understanding newborn infant readmission: Findings of the Ontario mother and infant survey. Canadian Journal of Public Health, 92(3), 196–200.
153 Sword W, Watt S, Gafni A, Lee KS, Krueger P, Roberts J, Sheehan D.(2001). The Ontario Mother and Infant Survey. Postpartum Health and Social Service Utilization: A Five-site Ontario Study. Ottawa: CanadianHealth Services Research Foundation.
154 Malkin JD, Broder MS, Keeler E. (2000). Do longer postpartum staysreduce newborn readmissions? Analysis using instrumental variables.Health Services Research, 35(5), 1071–1091.
Giv
ing
Birt
h in
Can
ada:
A R
egio
nal P
rofil
e
68
