glass fiber-reinforced polymer bars as top mat ... fiber reinforced polymer bars as top mat...
TRANSCRIPT

FINAL CONTRACT REPORT
GLASS FIBER-REINFORCED POLYMER BARS AS TOP MAT REINFORCEMENT
FOR BRIDGE DECKS
J. M. DeFREESE and
C. L. ROBERTS-WOLLMANN
Via Department of Civil and Environmental Engineering Virginia Polytechnic Institute and State University
VIRGINIA TRANSPORTATION RESEARCH COUNCIL
FINAL CONTRACT REPORT
GLASS FIBER REINFORCED POLYMER BARS AS TOP MAT REINFORCEMENT FOR BRIDGE DECKS
J.M. DeFreese and C.L. Roberts-Wollmann Via Department of Civil and Environmental Engineering
Virginia Polytechnic Institute and State University
Project Manager Dr. Jose Gomez, Virginia Transportation Research Council
Contract Research Sponsored by Virginia Transportation Research Council
Virginia Transportation Research Council (A Cooperative Organization Sponsored Jointly by the
Virginia Department of Transportation and the University of Virginia)
Charlottesville, Virginia
September 2002 VTRC 03-CR6

NOTICE
The project that is the subject of this report was done under contract for the Virginia Department of Transportation, Virginia Transportation Research Council. The contents of this report reflect the views of the authors, who are responsible for the facts and the accuracy of the data presented herein. The contents do not necessarily reflect the official views or policies of the Virginia Department of Transportation, the Commonwealth Transportation Board, or the Federal Highway Administration. This report does not constitute a standard, specification, or regulation.
Each contract report is peer reviewed and accepted for publication by Research Council staff with expertise in related technical areas. Final editing and proofreading of the report are performed by the contractor.
Copyright 2002 by the Commonwealth of Virginia.
.. 11

ABSTRACT
The objectives of this research were to characterize the material and bond properties of three commercially available GFRP (glass fiber reinforced polymer) reinforcing bars, and evaluate the effects of the material properties and the current ACI design recommendations (ACI 2001) on the design of a bridge deck with GFRP as top mat reinforcement. The tensile properties evaluated were ultimate tensile strength, tensile modulus of elasticity and ultimate rupture strain. Ultimate bond stress and load-slip behavior of the three types of bars were evaluated using beam- end bond stress tests.
For the tensile tests, for each type of GFRP bar, three bar sizes were tested: No. 4, No. 5, and No. 6. For each bar size and manufacturer, five samples were tested. The average ultimate tensile strengths varied from 80.4 ksi to 119 ksi, with coefficients of variation for the five-bar samples ranging from 2.6% to 8.0%. The average moduli of elasticity for the three manufacturers were very similar, with a high of 6340 ksi and a low of 5800 ksi. All bars showed linear elastic behavior to rupture. The bar rupture strains varied from 1.4% to 1.9%.
The bars also had similar average maximum bond stresses, with a high of 2600 psi and a low of 2360 psi. The load-slip behaviors exhibited by the three bar types were each unique. Pre- peak behavior was similar, but post-peak behavior varied depending on the surface treatment of the bar.
The design material properties for each bar type were determined using the recommendations of ACI Committee 440 (ACI 2001). These properties are presented in Table 14. of the report. The property with the greatest influence on the selection of bar size and spacing for a bridge deck reinforced with GFRP reinforcement is the modulus of elasticity. The reinforcing bar with the highest modulus of elasticity will result in the most economical design in terms of materials required. Realistically, however, a bridge deck design that is based on the lowest value of each measured material property will not greatly increase the quantity of GFRP reinforcing, and will enable any of the manufactures’ products to be used successfully in a given project.
... 111

FINAL CONTRACT REPORT
GLASS FIBER REINFORCED POLYMER BARS AS TOP MAT REINFORCEMENT FOR BRIDGE DECKS
J. M. DeFreese Graduate Research Engineer
Via Department of Civil and Environmental Engineering Virginia Polytechnic Institute and State University
C.L. Roberts-Wollmann Assistant Professor
Via Department of Civil and Environmental Engineering Virginia Polytechnic Institute and State University
INTRODUCTION
A primary contributor to the premature deterioration of bridge decks is the chloride- induced corrosion of steel reinforcing bars. One promising alternative to mild steel reinforcement is Fiber Reinforced Polymer (FRP) bars, in particular Glass Fiber Reinforced Polymer (GFRP) bars.
GFRP bars have several advantages over steel reinforcement, but the most obvious advantage for bridge deck applications is that they are non-reactive to chlorides. GFRP bars are also more light-weight than steel bars and therefore may result in lower shipping costs and easier construction operations.
However, GFRP bars also have several disadvantages. The stress-strain behavior of GFRP bars is linear elastic to failure, with no yield plateau. This requires a different design approach than for concrete reinforced with mild steel bars, in which proper design ensures that the steel yields before the concrete crushes. With GFRP reinforcement, designs in which the concrete crushes before the GFRP ruptures are encouraged. Another disadvantage is that GFRP bars have a much lower modulus of elasticity than steel. This can lead to serviceability problems such as wide cracking and large deflections. Finally, although GFRP bars do not corrode, they do experience a loss of strength with time, particularly in an alkaline environment, such as concrete.
Due to these disadvantages, along with a general lack of data in some areas, there is some concern about using GFRP reinforcement as the sole reinforcing in a bridge deck. To maximize the advantages of both types of reinforcing, it has been proposed to use GFRP bars as the top mat of reinforcing in a bridge deck while using plain or epoxy coated mild steel bars as the bottom mat. Using GFRP bars as the top mat of reinforcing significantly increases the cover depth over
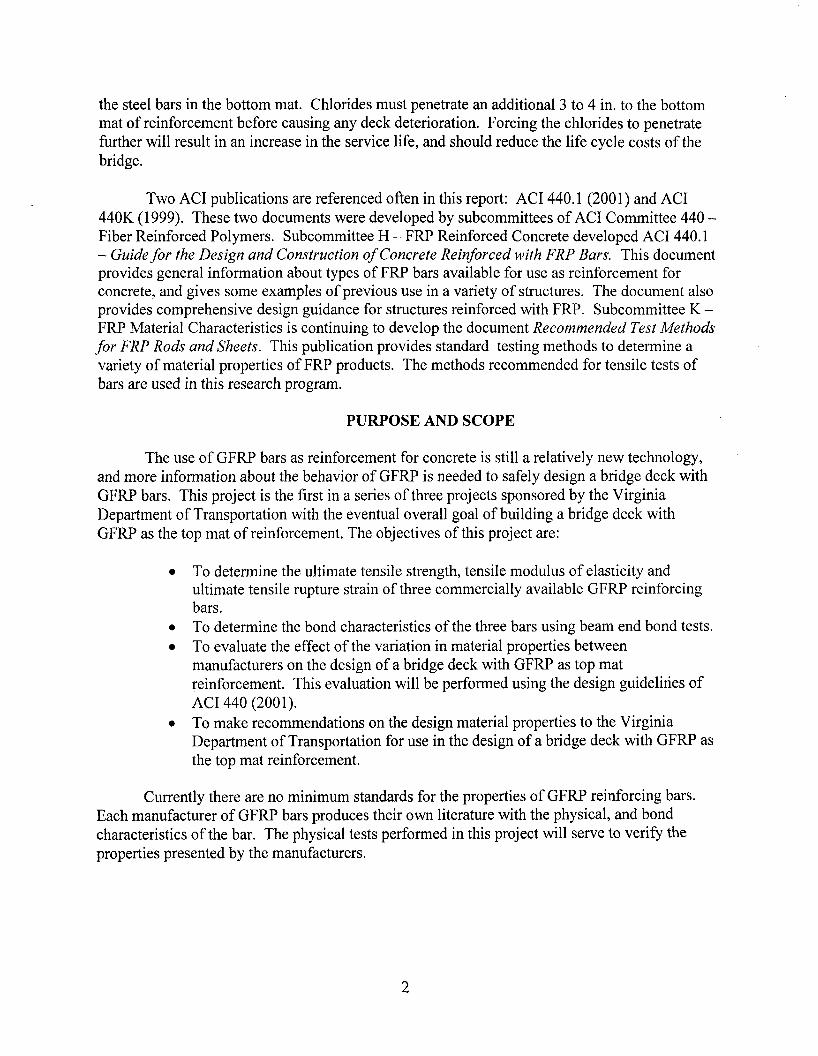
the steel bars in the bottom mat. Chlorides must penetrate an additional 3 to 4 in. to the bottom mat of reinforcement before causing any deck deterioration. Forcing the chlorides to penetrate further will result in an increase in the service life, and should reduce the life cycle costs of the bridge.
Two ACI publications are referenced often in this report: ACI 440.1 (200 1) and ACI 440K (1 999). These two documents were developed by subcommittees of ACI Committee 440 - Fiber Reinforced Polymers. Subcommittee H - FRP Reinforced Concrete developed ACI 440.1 - Guide for the Design and Construction of Concrete Reinforced with FRP Bars. This document provides general information about types of FRP bars available for use as reinforcement for concrete, and gives some examples of previous use in a variety of structures. The document also provides comprehensive design guidance for structures reinforced with FRP. Subcommittee K - FRP Material Characteristics is continuing to develop the document Recommended Test Methods for FRP Rods and Sheets. This publication provides standard testing methods to determine a variety of material properties of FRP products. The methods recommended for tensile tests of bars are used in this research program.
PURPOSE AND SCOPE
The use of GFRP bars as reinforcement for concrete is still a relatively new technology, and more information about the behavior of GFRP is needed to safely design a bridge deck with GFRP bars. This project is the first in a series of three projects sponsored by the Virginia Department of Transportation with the eventual overall goal of building a bridge deck with GFRP as the top mat of reinforcement. The objectives of this project are:
To determine the ultimate tensile strength, tensile modulus of elasticity and ultimate tensile rupture strain of three commercially available GFRP reinforcing bars. To determine the bond characteristics of the three bars using beam end bond tests. To evaluate the effect of the variation in material properties between manufacturers on the design of a bridge deck with GFRP as top mat reinforcement. This evaluation will be performed using the design guidelines of ACI 440 (2001). To make recommendations on the design material properties to the Virginia Department of Transportation for use in the design of a bridge deck with GFRP as the top mat reinforcement.
0
0
Currently there are no minimum standards for the properties of GFRP reinforcing bars. Each manufacturer of GFRP bars produces their own literature with the physical, and bond characteristics of the bar. The physical tests performed in this project will serve to verify the properties presented by the manufacturers.
2

Figure 1. Examples of the three manufacturers’ bars.
METHODS
Tensile Properties
The first phase of the experimental program was the performance of tensile tests of No. 4, No. 5, and No. 6 nominal diameter bars for three different manufacturers of GFRP bar. These bar sizes were chosen because they are sizes typically used in bridge decks. In the tensile tests, the bars were loaded in uniaxial tension in a universal testing machine (UTM). Corresponding deformations and/or strains were read with bonded electrical resistance strain gages and a clip-on extensometer. The purpose of this phase of the testing program was to determine the ultimate tensile strength, modulus of elasticity and rupture strain of the bars. All of the tensile tests were performed in accordance with the ACI 440K (1 999) document, which sets standards for testing of FRP rods and sheets.
Materials
GFRP reinforcing bars were donated to the program by Hughes Brothers Inc, Marshall Corporation, and Pultrall. Each bar type is recognizable by its unique surface characteristics. The Hughes Brothers’ bars are denoted by helically wrapped fibers and a mild sand impregnation. The Marshall Corporation’s bars have mechanical deformations similar to those of mild steel bars. Pultrall’s bars are gray in color, with no deformations and have a heavy sand impregnation. All three bars are shown in Figure 1.
3

End Anchors
Bar Size
Typical GFRP bars have fibers running in the longitudinal direction of the bar, with no cross fibers. This results in the bars having different material properties in the longitudinal and transverse direction. Due to this anisotropic nature of the GFRP bars, precautions must taken when gripping the bars for tensile tests to avoid the occurrence of a premature pinching type failure at the grips instead of the desired tensile failure. To preclude a failure in the gripping area, steel pipe end anchors with epoxy filler between the pipe and the bar were placed on the ends of the bars to allow for the uniform distribution of load from the grips of the UTM to the bar.
Gage Anchor Total Bar Anchor
Length, Length Length Diameter
The bar testing length, anchor lengths, and anchor diameters were determined in accordance with ACI 440K Recommended Test Methods for FRP Rods and Sheets (1 999). The total bar length includes the gage or testing length, and the anchor or cylinder length. ACI-440K (1 999) specifies both of these lengths, as well as the diameter of the anchors. The testing length must be 40 times the nominal bar diameter, but not less than 4 in.. The anchor length, L,, in inches, is determined in accordance with Equation 1, but not less than 10 in.
JI,A , in L , = -
Where: f,, = ultimate tensile strength, ksi A = cross-sectional area of the specimens, in2
2
The inside diameter of the cylindrical anchor is required to be at least 0.40-0.55 in. greater than the nominal bar diameter. Adhering to these specifications, the GFRP bar lengths, anchor lengths, and anchor diameters were calculated and are shown in Table 1.
4

Figure 2. Typical End Anchor
The end anchor fabrication recommendations in ACI 440K were followed with some modifications. Before casting the epoxy filler, the inside surfaces of the end anchors were scored, and then etched with muriatic acid, to improve the bond between the epoxyhand resin and the end anchor. Each end anchor was covered at both ends with a PVC plumber’s cap (see Figure 2.) The exterior cap of the end anchor had a hole in the center, drilled to a depth approximately half the thickness of the cap. The interior cap, or the cap that faces the testing length of the bar, had a hole drilled in the center of the cap. Both the holes were drilled to 0.125 in. larger than the nominal diameter of the bar. ACI 440K recommends that the end anchors be cast in a horizontal position. However, it was felt that there would be difficulties in completely filling the anchor because of the very viscous nature of the selected epoxy. Instead of the ACI 440K recommended horizontal casting position for the anchors, a vertical orientation was selected, and casting proceeded as follows. After the exterior cap was placed on the anchor, a quantity of epoxy filler was mixed. The epoxy was from West System, with a ratio of the epoxy resirhand mix of five parts epoxy resin with three parts sand and one part epoxy hardener by weight. Once thoroughly mixed, the epoxy resin was poured into the anchor to approximately half full. The bar was then inserted into the anchor, and moved around in the anchor until it was seated in the partial depth hole in the exterior cap. This ensured that the bar was centered throughout the anchor. Once the bar was seated in the hole of the exterior cap, more epoxy resin was added through the top of the anchor until it was full. Then the interior cap was placed over the other end of the anchor. The bar and anchor assembly were then secured in a vertical position and allowed to cure for at least 24 hours.
Tensile Test Procedures
The tensile tests were performed in accordance with ACI-440K (1 999). A load rate of 45 ksilminute was chosen, as it fell midway within the range of 14.5-72.5 ksi/minute specified. During the course of testing, the elongation of the bar was measured by a 2 in. clip-on extensometer. In addition, each bar had two electrical resistance strain gages bonded on opposite sides of the bar at mid-height of the testing section. Strain gage readings were taken by hand, at predetermined load levels with strain indicator boxes. The load rate throughout the test was controlled by computer, but was manually stopped every 10 ksi so that strain readings could be
5

taken from the indicator boxes. The clip on extensometer was removed at approximately 70% of the guaranteed ultimate tensile strength of the bar, as determined from the manufacturers' literature. This was a precautionary measure to ensure that the extensometer was not damaged. Strain gage readings continued to be taken until failure of the gage. The bar was loaded until failure, with failure defined as the shedding of at least 50% of the load with no additional load taken by the bar.
Beam End Bond Stress Tests
The second phase of testing consisted of performing beam end bond tests. Beam end bond tests are an accurate way of simulating flexural behavior, by placing the GFRP rebar in the tensile region of the concrete. Figure 3 shows a schematic of a beam end bond test and how it approximates the conditions of the end portion of a beam in bending. The objective of these tests was to determine load-slip behavior and maximum bond stress for each type and size of bar. Concrete blocks with GFRP bars embedded a specific length inside the block were cast. After curing was complete, the blocks were placed within a specially designed test frame, and loaded in such a manner as to replicate flexural loading in a beam. As load was applied to the bar, the force in the bar, the elongation of the bar over a given gage length, the live or loaded end slip, and the free or non-loaded end slip were measured. The procedures for this phase of testing are not specified in the ACI-440K document; but they are similar to procedures of other literature (Johnston and Zia (1982), ASTM A994-95 (1 995)).
J A
Beam in flexure A'
A Beam end bond test
Figure 3. Beam-end bond tests compared to beam in flexure.
6

Details of Test Specimens
The test specimens for this phase of testing were concrete blocks with GFRP rebar embedded in the top, and bottom of the blocks. The blocks were 36 in. long, 8 in. wide, and 15 in. tall. The GFRP bars were positioned in the cross-section 2.75 in. from the top or bottom. This allowed for the GFRP bars to be inside the shear reinforcement, which had 1 in. of clear cover on all sides. Typical specimen dimensions are shown in Figure 4.
The blocks were cast on their sides, and a gang form was chosen to minimize the materials needed. Four forms were made, and used in two separate casts. Rebar cages were constructed, of mild steel rebar, to resist the shear forces in the concrete. The reinforcing design was modeled after Johnston and Zia (1982). The rebar cage consisted of four No. 4 bars in the corners of the cage with No. 3 closed stirrups spaced every 6 in. A small variation was made for the cage used with the No. 6 bars. Six No. 4 bars were used instead of four No. 4 bars. The reinforcement layout is also shown in Figure 4.
The GFRP bar end anchor preparation for the bond test was the same as for the tensile test with anchors only required at one end of the bar. The bar length included the anchor length, space to allow for the testing equipment and instrumentation, the entire length of the block, and an extension out of the free end of the block.
The bonded length of bar within the specimens was selected to ensure that slip would ensue prior to rupture of the bar. The bond stress reported in the manufacturers’ literature was used in conjunction with the ultimate tensile strength found in the first phase of testing to determine the bonded lengths for the tests. The bonded lengths chosen for the testing program were 5 times the bar diameter, and 7.5 times the bar diameter. This is a relatively short length compared to the length of the block, and required that the remaining length of the bar be de- bonded. This was accomplished with a length of pipe fit around the GFRP bar to allow the bar to pass through the block with little to no frictional resistance. The pipe de-bonders used in the experimental program were either metal or PVC electrical conduit.
As mentioned earlier, the specimens were cast in two separate operations. Concrete was procured from a local ready-mix concrete supplier, with a standard 3000 psi mix requested. The first batch of concrete had a tested 28-day concrete compressive strength of 4200 psi. This concrete was used to fabricate all of the Hughes Brothers and Marshall specimens. The second batch of concrete had a tested 28-day concrete compressive strength of 3400 ksi , and was used for casting the Pultrall specimens.
7

/ , / 2 tests 1..
each block . -.-
Figure 4 Beam-end bond test specimen
‘m= -- ---- - - -- - - --
Test Frame and Instrumentation
A special loading frame was constructed for the beam-end bond stress tests, as shown in Figure 5. Load was applied, in the horizontal direction, to one of the GFRP bars in the block. A horizontal reaction was required to keep the block stationary. Also two vertical reactions were needed, to resist the overturning moment.
Loading was applied to the GFRP bar with a tension actuator. The load was measured by a load cell. A special tension rig was fabricated to load the bar through the end anchors. A compression load cell and ram were placed on the top of the specimen to provide and measure the downward reaction. The hydraulic ram could also be adjusted to keep the specimen level during testing.
LVDTs (linear variable differential transformer) were used to measure the slip of the bar on the loaded end as well as the free end. The LVDTs were also used to measure the elongation of the bar along a specified gage length. A total of five LVDTs were used for testing. Four of the LVDTs were used on the loaded end in conjunction with a specially designed bar rig (see Figure 6.). The bar rig ties all four of the LVDTs together, and attaches them to the bar. The rig consists of two aluminum clamps that hold the LVDTs to the bar, and a small aluminum pipe cut in half to attach the LVDTs to each other. The two LVDTs closest to the block are used to measure the loaded end slip of the bar. The two rear LVDTs measure the elongation of the bar over a specified gage length (typically 7.5 in). The gage length is the distance between the two bar clamps. The elongation measurement provided data to calculate the modulus of the bar being tested.
8

I I
Hvrgdlaic Tmicn Ram i I
M e we ~<lcke~ -’
Figure 5. Test frame and equipment
Figure 6. Loaded end bar rig and LVDTs.
One LVDT was used to measure the free end slip of the bar. It was attached using a steel bracket that was held to the concrete block by four bolts. The free end LVDT is shown in Figure 7.
All instrumentation was connected to Measurement Group’s System 6000 data acquisition system. This system simultaneously took readings from all five LVDTs and both load cells at a rate of 10 readings per second.
9

Bond Test Procedures
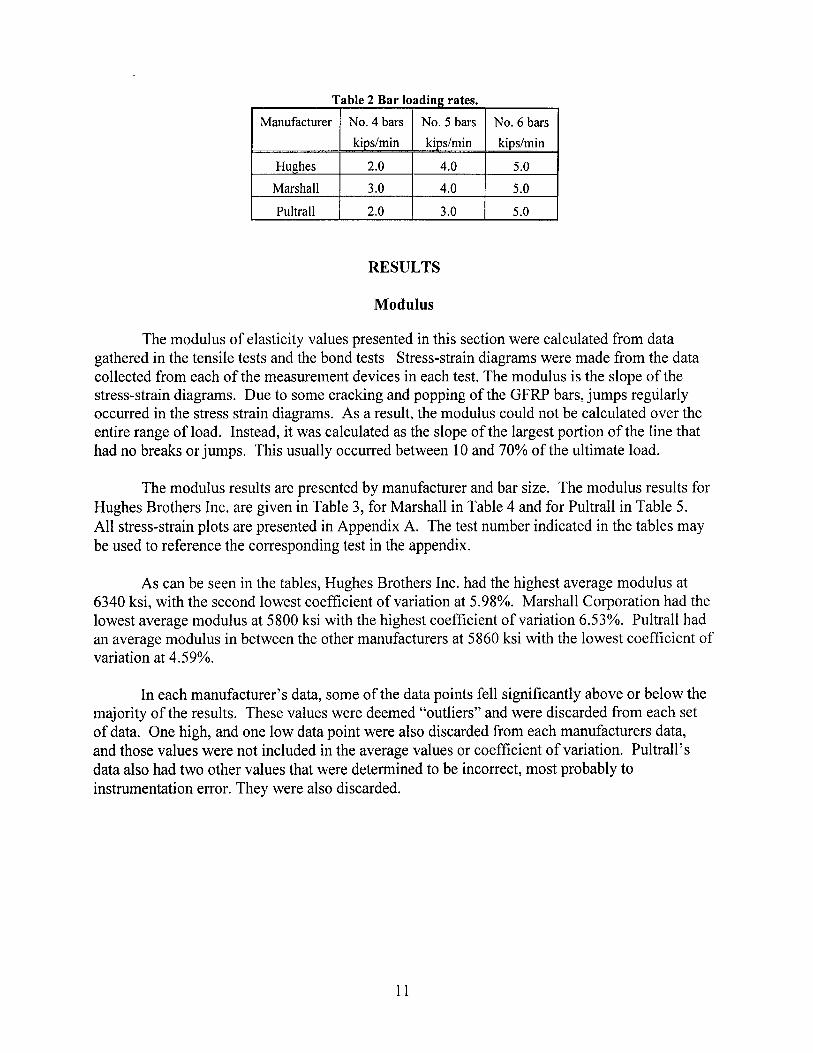
During testing, load was applied to the GFRP bar via an electric pump, which controlled the hydraulic ram. The rate of load application was operator, not computer, controlled. The load rate was chosen to meet the requirements of the ACI 440K (1 999) document, and ASTM standard A 944-95 (1995) for beam end bond tests. ACI 440K (1999) states that load should be applied at a rate not greater than 5 kipdminute. ASTM requires that the load be applied at a rate between 10% and 33% of the published bond strength data per minute. Load rates were selected to satisfy both requirements, and are presented in Table 2.
Figure 7. Free end LVDT.
During testing, the operator applied load to the bar at the given load rates with the hydraulic ram. Care was taken to make sure that the load was applied at as constant a rate as possible. Data were recorded continuously throughout the testing. The test was concluded when all of the displacement LVDTs had reached their maximum stroke, which in all cases was after the load had peaked and had subsequently 'fallen off. At this point recording was stopped, and the data was saved. The block was then flipped over, and the second bar was tested in the same fashion.
10
RESULTS
Modulus
The modulus of elasticity values presented in this section were calculated from data gathered in the tensile tests and the bond tests Stress-strain diagrams were made from the data collected from each of the measurement devices in each test. The modulus is the slope of the stress-strain diagrams. Due to some cracking and popping of the GFRP bars, jumps regularly occurred in the stress strain diagrams. As a result, the modulus could not be calculated over the entire range of load. Instead, it was calculated as the slope of the largest portion of the line that had no breaks or jumps. This usually occurred between 10 and 70% of the ultimate load.
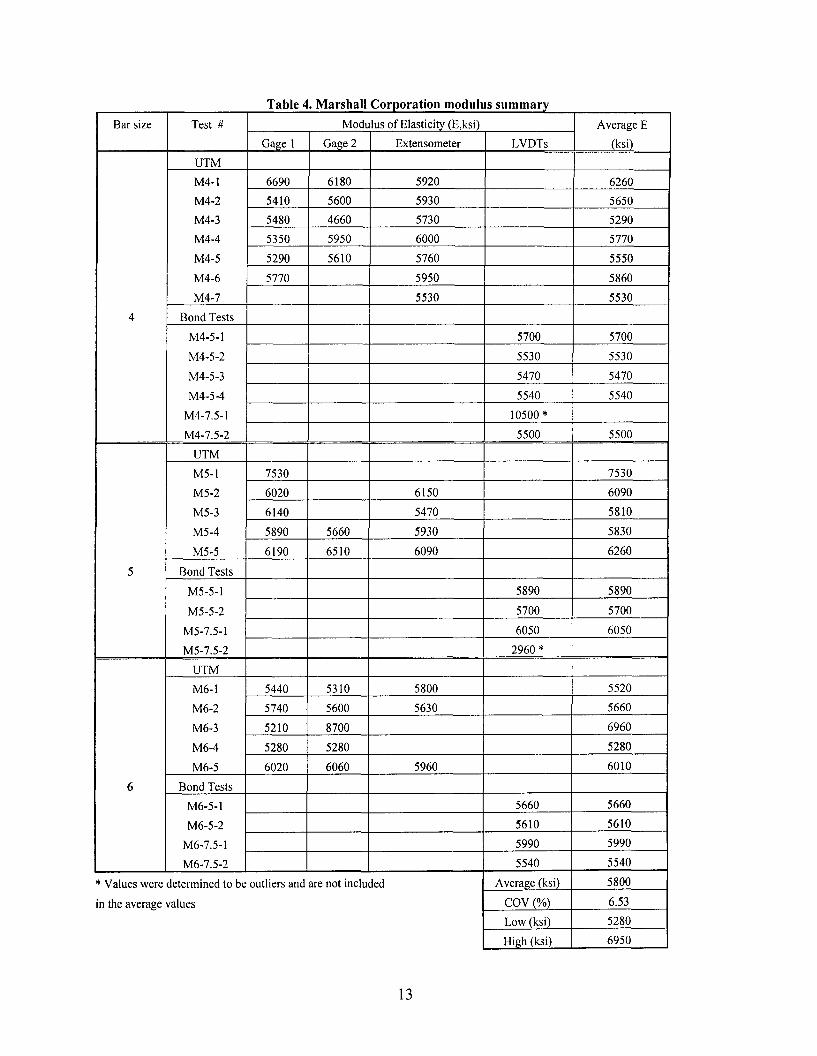
The modulus results are presented by manufacturer and bar size. The modulus results for Hughes Brothers Inc. are given in Table 3, for Marshall in Table 4 and for Pultrall in Table 5. All stress-strain plots are presented in Appendix A. The test number indicated in the tables may be used to reference the corresponding test in the appendix.
As can be seen in the tables, Hughes Brothers Inc. had the highest average modulus at 6340 ksi, with the second lowest coefficient of variation at 5.98%. Marshall Corporation had the lowest average modulus at 5800 ksi with the highest coefficient of variation 6.53%. Pultrall had an average modulus in between the other manufacturers at 5860 ksi with the lowest coefficient of variation at 4.59%.
In each manufacturer’s data, some of the data points fell significantly above or below the majority of the results. These values were deemed “outliers” and were discarded from each set of data. One high, and one low data point were also discarded from each manufacturers data, and those values were not included in the average values or coefficient of variation. Pultrall’s data also had two other values that were determined to be incorrect, most probably to instrumentation error. They were also discarded.
11

HB4-5- 1
HB4-5-2
HB4-5-3 HB4-5-4
HB4-7.5- 15 HB4-7.5-1 _____
UTM HB5-1
HB5-2
HB5-3
HB5-4
6020 6020
6090 6090
6190 6190 6080 6080 6210 6210
HB5-5
Bond Tests HB5-5-1
HB5-5-2
HB5-7.5-1
2920 *
6920 6920 5960 6600
6240 6240
6000 6000
5660 5660
* Values were determined to be outliers and are not included
in the average values
73 70
12
Bar size
4
5
6
* Values were determined to be outliers and are not included
in the average values
Avera e (ksi) cov (%
I
13

Table 5. Pultrall modulus summarv
P6-7.5-1 P6-7.5-2
Bar size
5860 5860
6220 6220
#4
#5
#6
Test # Modulus of Elasticity (E, ksi) Average E I I I
UTM
* Values were considered outliers and not included in the average values
** Values were considered bad data points and are not included
in the average values
Avera e ksi
cov (Yo)
14
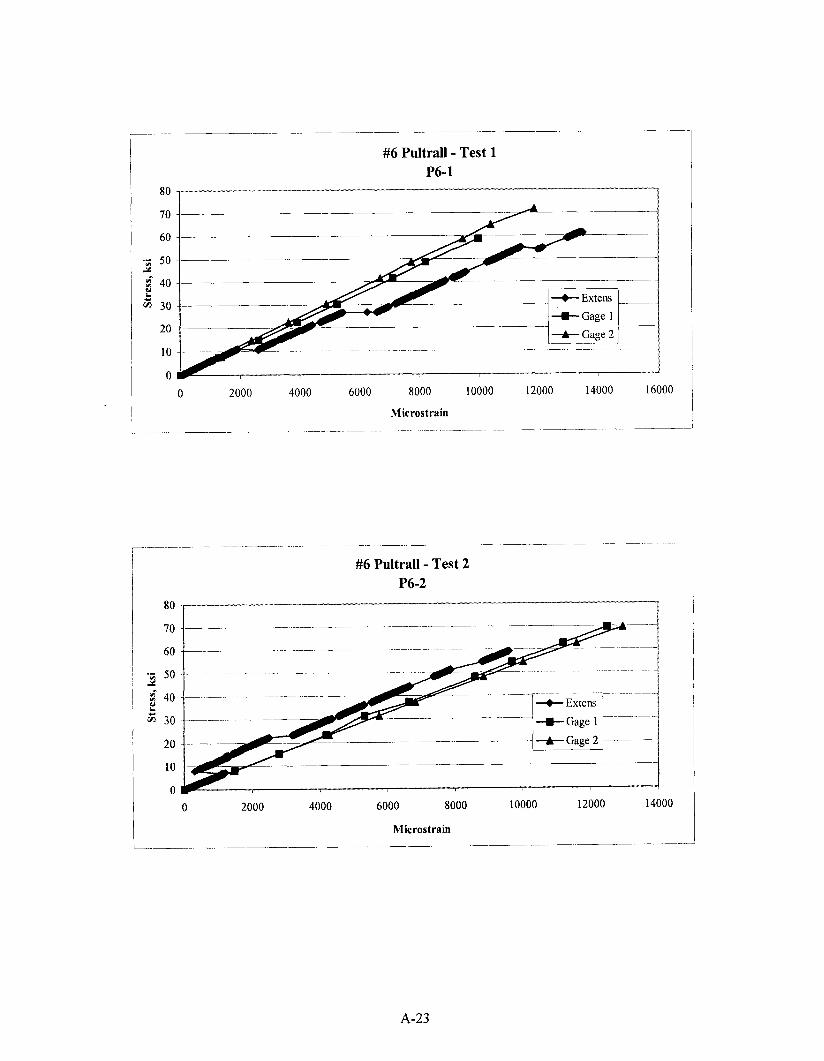
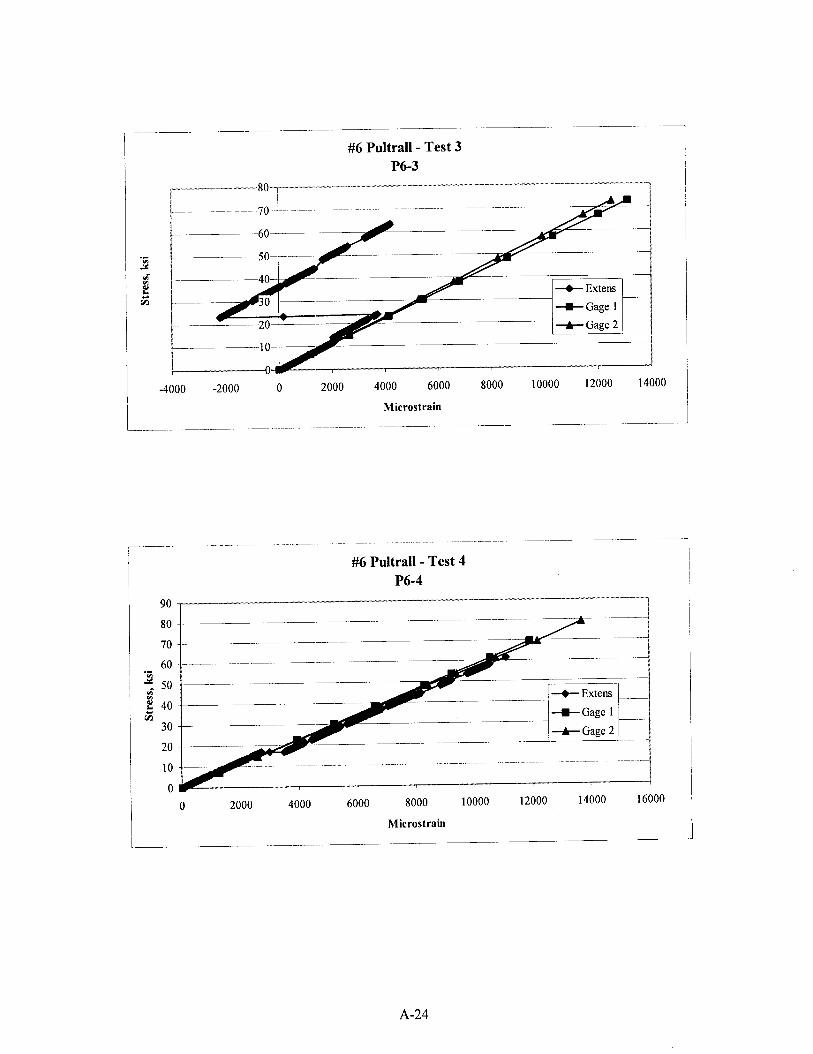
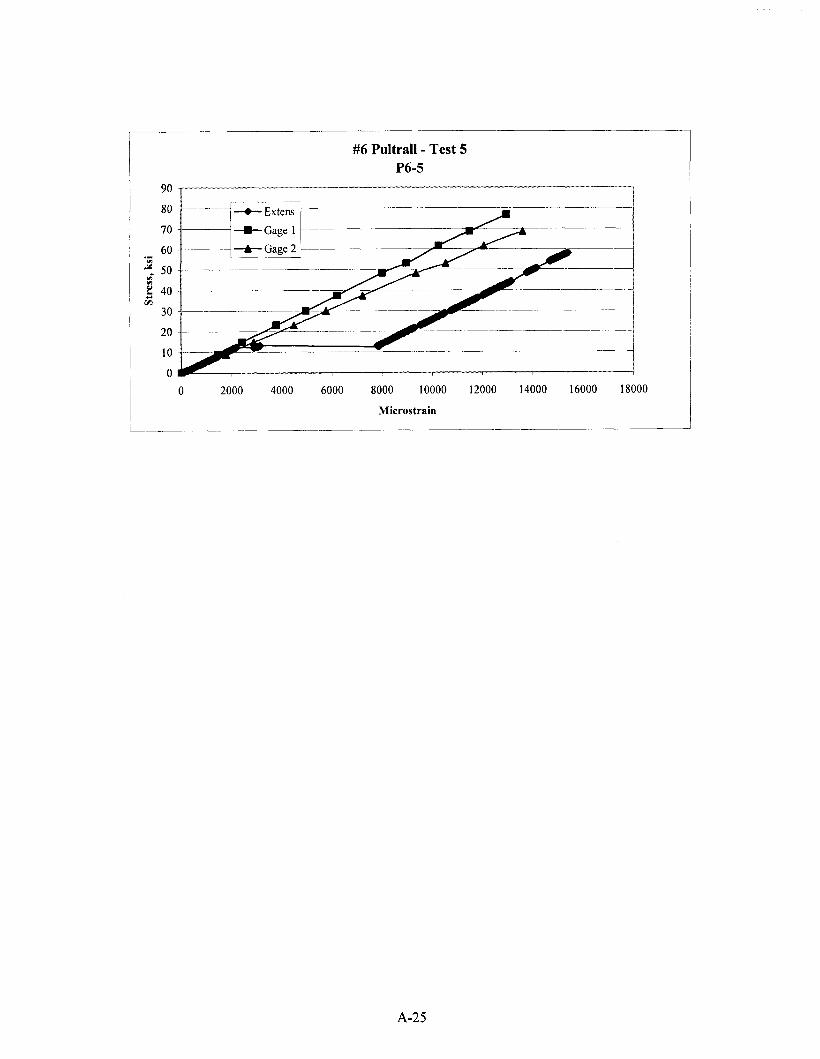
Stress-Strain Diagrams
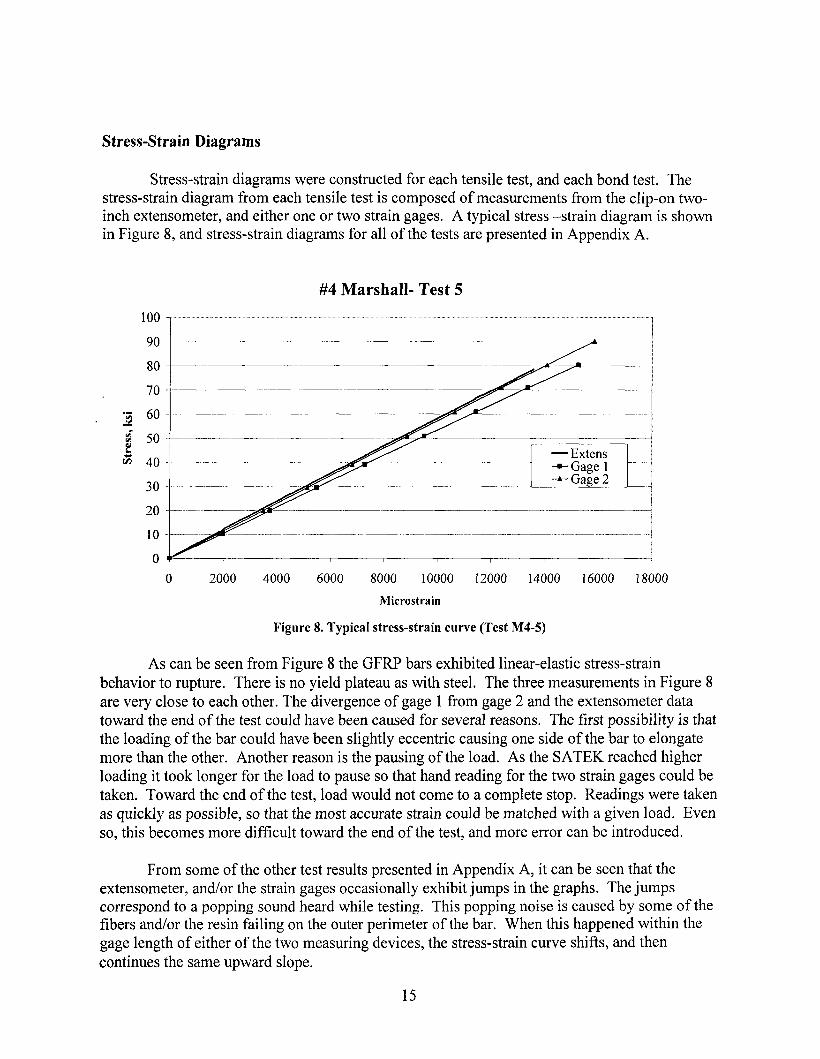
Stress-strain diagrams were constructed for each tensile test, and each bond test. The stress-strain diagram from each tensile test is composed of measurements from the clip-on two- inch extensometer, and either one or two strain gages. A typical stress -strain diagram is shown in Figure 8, and stress-strain diagrams for all of the tests are presented in Appendix A.
#4 Marshall- Test 5
100
90
80
70
2 60
3 50
$J 40
30
20
10
0
- Q L
0 2000 4000 6000 8000 10000 12000 14000 16000 18000
Microstrain
Figure 8. Typical stress-strain curve (Test M4-5)
As can be seen from Figure 8 the GFRP bars exhibited linear-elastic stress-strain behavior to rupture. There is no yield plateau as with steel. The three measurements in Figure 8 are very close to each other. The divergence of gage 1 from gage 2 and the extensometer data toward the end of the test could have been caused for several reasons. The first possibility is that the loading of the bar could have been slightly eccentric causing one side of the bar to elongate more than the other. Another reason is the pausing of the load. As the SATEK reached higher loading it took longer for the load to pause so that hand reading for the two strain gages could be taken. Toward the end of the test, load would not come to a complete stop. Readings were taken as quickly as possible, so that the most accurate strain could be matched with a given load. Even so, this becomes more difficult toward the end of the test, and more error can be introduced.
From some of the other test results presented in Appendix A, it can be seen that the extensometer, and/or the strain gages occasionally exhibit jumps in the graphs. The jumps correspond to a popping sound heard while testing. This popping noise is caused by some of the fibers and/or the resin failing on the outer perimeter of the bar. When this happened within the gage length of either of the two measuring devices, the stress-strain curve shifts, and then continues the same upward slope.
15

All of the graphs in Appendix A present measurements from all the measuring devices utilized for the particular test shown on the graph. If a measuring device does not appear on the graph, then either it was not present during the test or the data from that device was considered unreliable and not included in the graph. All of the stress-strain diagrams for the tensile tests are shown individually, and are present in the format of Figure 8. The bond tests only have one measuring device for stress-strain behavior (the average of two LVDTs over a 7.5 in gage length), therefore the stress-strain diagrams from the bond tests are grouped by manufacturer and bar size in Appendix A. Each of the stress-strain curves for the bond tests is denoted in the legend by the manufacturer’s initials (HB for Hughes Brothers, M for Marshall and P for Pultrall), the bar size (No. 4, No. 5, or No 6), the embedment length ( 5 or 7.5 times the bar diameter), and the test number (1 or 2).
Bar Measured Tensile Strength, ksi
Size Test 1 I Test2 I Test 3 I Test4 I Test 5 Manufacturer
Average Ultimate Tensile Strength & Rupture Strain
Average COV ksi %
Ultimate tensile strength, or breaking strength data was recorded with each tensile test. The ultimate tensile strength data is compiled for each test by manufacturer and bar size, and is shown in Table 6
Pultrall
#6 107 115 113 95.7 112 109 7.10
#4 79.2 83.4 93.5 95.1 88.0 87.9 7.62
#5 83.4 81.2 87.2 82.8 82.8 83.5 2.62
#6 76.7 79.0 85.3 83.7 77.2 80.4 4.83
______-______.______---
It can be seen from Table 6 that Hughes Brothers No. 4 bars exhibited the highest average ultimate tensile strength at 119 ksi, and Pultrall’s No. 6 bars exhibited the lowest average ultimate tensile strength at 80 ksi. One general trend apparent in Table 6 is that the ultimate tensile strength decreases with an increase in bar diameter, however this does not hold true for the Marshall bars. This may be in part due to the highly variable data as evidenced by the large coefficient of variation with the No. 5, and No. 6 Marshall bars. Table 6 also indicates that the Hughes Brothers bars had the highest average ultimate tensile strength, and the lowest coefficient of variation.
16

Rupture Strain
Another characteristic of the GFRP bars obtained from the tensile test is the rupture strain. This value is calculated using the ultimate tensile strength, and the modulus for each individual tensile test. Equation 2 gives the rupture strain calculation.
- Oult E &rupture -
Where: &rupture = rupture strain, microstrain oult = ultimate tensile strength, ksi E = modulus of elasticity, ksi
The rupture strain for each test, as well as the average by bar size and manufacturer, is given in Table 7.
Table 7. Tensile RuDture Strains
The rupture strain data exhibits some of the same results as the ultimate tensile strength. Generally, the rupture strain decreases with an increase in bar diameter. This, again, is not true for the Marshall bars which decrease from the No. 4 to No. 5 bars but then increase from No. 5 to No. 6. Due to its low strength and relatively high modulus, Pultrall has the lowest rupture strain value at 0.0139. Marshall had high strength and low modulus, which resulted in the highest rupture strain value at 0.0 192
In conclusion, the behavior of the three manufacturers’ bars exhibited in the tensile tests is quite similar, and there are some general trends in the data. Hughes Brothers exhibited the highest average values for all of the tensile test characteristics, while Pultrall yielded the lowest. Marshall had average values between the other two manufacturers, and had the highest coefficient of variation of all the manufacturers with respect to tensile test characteristics.
17

Bond Test Results
-4
0
1 o
Load versus Slip Graphs
-
I I I I
0. I 0.2 0.3 0.4 Ot5
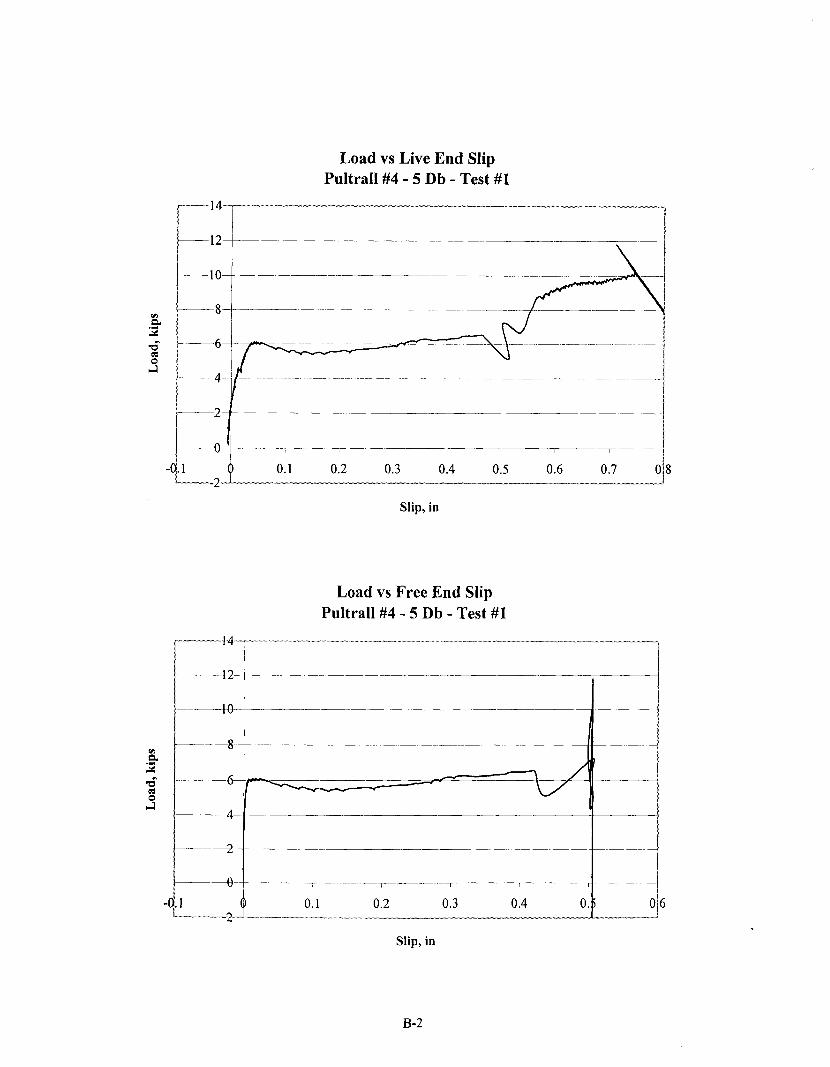
A load versus live end slip curve was created for each of the bond tests. The raw displacement measured by the slip LVDTs included the slip of the bar plus the elongation of the unbonded length of the bar within the test block. To determine the portion of the total displacement attributable to the bar elongation, the modulus for each tested bar was calculated from the slope of the stress-strain diagram, which was produced for each test. The strain data were collected by the two LVDTs that measured the elongation of the bar over a measured gage length. The elongation of the unbonded portion of the bar as calculated with the measured modulus was subtracted from the overall movement of the bar to obtain the slip.
The load was plotted against the calculated live end slip. A typical load versus live end slip plot is shown in Figure 9.
The slip data collected by the free end LVDT were used to construct the load versus free end slip curve. A typical load versus free end slip plot is shown in Figure 10. Load versus slip plots for all of the tests are paired together, live end and free end slip, and presented in Appendix B.
g
Load vs Live End Slip Hughes Bros. #6 - 7.5Db - Test #I
Slip, in
Figure 9. Typical load vs. live end slip plot.
It can be seen by comparing the graphs in Appendix B that each manufacturer’s bar exhibits a different type of load-slip behavior. The Hughes Brothers’ bars typically show a large amount of slip (approximately 0.15 to 0.20 in.) before the peak load is reached. After peak, the bars continue to hold a relatively high percentage of the peak load (approximately 80 to 90% of
18

the peak load) for continued slipping before the load is finally shed. Conversely, Marshall's bars exhibit a small amount of slip, typically less than 0.04 in., when the peak load is reached. Once the peak load is reached, the majority of the load is shed. Then, as slip continues, small peaks in bond stress occur. Pultrall bars exhibit the same pre-peak behavior as Marshall with a small amount of slip at peak load, typically less than 0.04 in. However, after the peak, Pultrall bars hold 50-80% of peak load as slip continues. A comparison is shown in Figure 1 1.
Load vs Free End Slip Hughes Bros. #6 - 7.5 Db - Test #1
"""I 30. . . . . . . .I".. . .." . . . . . " " " .."I_. ." ........... ...,......... .. .....
I 1 ~
-0.1 0 0. I 0.2 0.3 0.4 0.5 0.6
Slip, in
Figure 10 Typical load vs. free end slip plot.
Many of the graphs in Appendix B show negative slips through some of the loading regime. In reality, this behavior is highly improbable, and is likely the result of some type of error. There are a few possible reasons for this type of behavior. The first reason is that there is some inadvertent misalignment in the test setup. If the hydraulic ram that applies load to the bar was not in line with the block, then the ram could have pulled the bar at a small angle so that the LVDTs would shift slightly closer to the block. Another possible reason for the error could have been some small rotation of the block. As load was being applied to the bar by the ram, the other compression ram and load cell that provided the reaction that kept the block level could have moved just enough to allow some small rotation. It is also possible that this rotation could have come from a test frame that wasn't stiff enough to prevent those small deflections. Still another possible reason could be that some cement paste leaked into the bond breaker tubes causing the unbonded length to be shorter than measured. This would in turn affect the elongation of bar, and the calculation to determine the final end slip. Regardless of the reason, the accuracy of the measured live end slip at peak bond stress is questionable for the graphs that exhibit the negative slip behavior, however, the peak bond stress measurement is considered reliable.
19

Maximum Bond Stress and Embedment Length Comparison
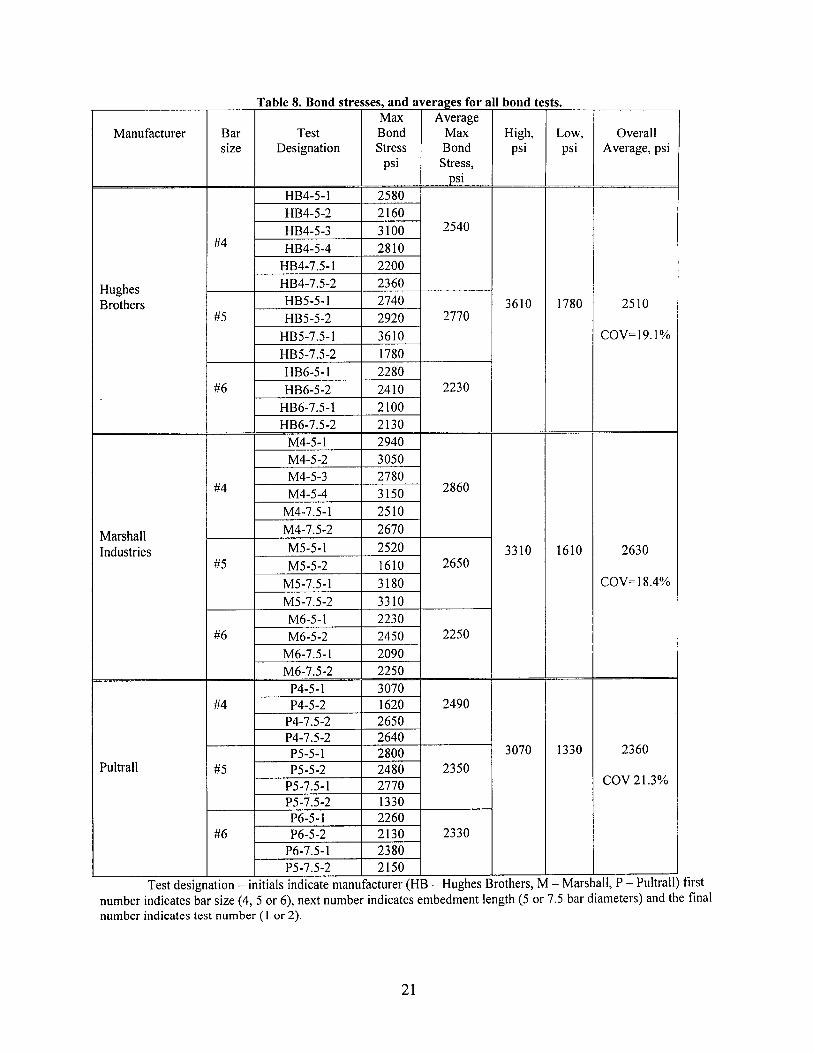
The maximum bond stress was calculated for each bond test in the experimental program. It was calculated by dividing the largest load held by the bar by the circumference of the bar times the bonded length. The maximum bond stresses for all of the tests are shown in Table 8. In Table 8, the maximum bond stress is grouped by manufacturer, and bar size.
Typical Load vs. Live End Slip Curves #6 bar - 5 Db
20
15
, I I
0 0.1 0.2 0.3 0.4 0.5 Slip, in
Figure 11. Comparison of Load-Slip Behaviors
It can be seen from Table 8 that all of the manufacturers’ bars showed similar peak bond stresses. They all had close to the same average maximum bond stress for all bar sizes, with Marshall having the highest bond stress at 2630 psi, and Pultrall having the lowest at 2360 psi. The variability in maximum bond stress within each set of bars was also similar with Pultrall having the highest coefficient of variation at 2 1.3%’ and Marshall having the lowest at 18.4%. A general trend in the data is that the average maximum bond stress decreases with an increase in bar diameter. This is true for all of the bars except the Hughes Brothers No. 5 bars.
Table 9 shows a comparison of bond stresses measured with different embedment lengths. The embedment lengths were set at 5 times the bar diameter (5Db), and 7.5 times the bar diameter (7.5Db). Generally, the average maximum bond stress decreases with an increase in the embedment length. This holds true for all of the bars tested with the exception of Marshall’s No. 5 bars, and Pultrall’s No. 4 bars. Only two tests were done per embedment length for those two types of bar so this could be a reflection of the small sample size and high variability.
20
Manufacturer
#6
Hughes Brothers
~ . . ~
P6-5-2 2130 2330 P6-7.5- 1 2380
Marshall Industries
Puitrall
I HB4-7.5-1 I 2200 I
HB6-7.5-1 2100 HB6-7.5-2 2130
M4-5- 1 2940 M4-5-2 M4-5-3 M4-5-4 2860 #4
M4-7.5- 1 25 10 M4-7.5-2 2670
~
M5-5-1 2520 #5 M5-5-2 1610 2650
M5-7.5-1 3180 M5 -7.5-2 33 10 M6-5- 1 I 2230 M6-5-2 I 2450 2250
M6-7.5-1 I 2090 I
t P4-7.5-2 I 2650 P4-7.5 -2 P5-5-1
P5-7.5- 1 P5-7.5-2 P6-5-1 2260
bond tc
High, psi
3 10
3310
3070
P5-7.5-2 I 2150 I Test designation - initials indicate manufacturer (HB - Hughes Brothers, R
3.
Low, psi
1780
1610
-
1330
- Mars
Overall Average, psi
25 0
COV=19.1%
2630
COV=l8.4%
2360
COV 21.3%
ill, P - Pultral number indicates bar size (4, 5 or 6), next number indicates embedment length (5 or 7.5 bar diameters) and t number indicates test number ( 1 or 2) .
first : final
21

DISCUSSION
Design Material Properties
Presented in the previous section were the measured material properties for each test and the average values for each type of GFRP bar. In this section, properties for design are discussed. Comparisons are made to properties that are presented by the bar manufacturers in their product literature.
Design Tensile Strength
The ultimate tensile strength was determined for each tensile test performed. This data was averaged by bar size and manufacturer. The tested average tensile strength, as well as the standard deviation, the manufacturer's published tensile strength data, the guaranteed tensile strength, and the design tensile strength are shown in Table 10.
The guaranteed tensile strength, f*fu, is defined by the ACI 440.1 (2001) design guide as the tested average or mean tensile strength minus three times the standard deviation (f*fu = fu,ave - 30). Also, the ACI 440.1 (2001) desiFn guide states that the design tensile strength shall be the guaranteed ultimate tensile strength, f fu, multiplied by an environmental reduction factor, CE. CE is taken as 0.7 for GFRP bars exposed to earth and weather, and accounts for the expected loss in tensile strength of the GFRP bar in an alkaline environment over the course of its service life.
Examination of Table 10 indicates that Hughes Brothers publishes tensile strength values below the average tensile strength. The published values are very similar to the guaranteed tensile strength as defined by ACI 440.1 (2001), calculated with the data from this test series. The other manufacturers publish values that are close to or above the tested average tensile strength values. The difference may be the result of the small sample size (five bars per bar size
22

per manufacturer) for the tested averages, however it appears their published values are average tensile strength, not guaranteed. Also Pultrall is the only manufacturer to publish an increase in tensile strength with bar size. This is not consistent with the tested results, which showed a drop in tensile strength with increasing bar size.
Manufacturer
Hughes Bros.
Marshall
Pultrall
Table 10. Tens Tested
#6 I 109 I 7.7
#4 1 87.9 1 6.7
83.5 2.2 I I
#6 I 80.4 3.9 ) 2: (ffu = tffu*Ce, where Ce = 0.7)
: Strength ' Guaranteed
Tensile Strength'
(PfJ (ksi)
107
93
87
98
81
85
67
77
69
blues Manufacturer's Design Tensile
Published Strength per Tensile Strength ACI 440'
(ffu) (ffu)
(ksi) (ksi)
100 75
95 65
104 60
104 48
If Pultrall and Marshall are publishing average strength instead of guaranteed strength, this may be due in part to the fact that the ACI 440.1 (2001) design guide was released in April of 200 1, and most of the manufacturers' literature was published before that time. The published literature does not necessarily reflect the recommendations of the ACI 440.1 (2001). Therefore, for the design of a bridge deck, a designer first must positively determine design strength values.
One design alternative would be to use the manufacturers' published tensile strength data, which assumes that the manufacturer has established their own level of confidence that their bars will meet or exceed their published values. This would require that the designer specify tighter quality control in construction using GFRP bars. Random sampling of the manufacturers' product would ensure that the GFRP bars placed in construction would meet the criteria used in the design. Specifying to a manufacturer that excess material be shipped to a construction sight would allow for random samples to be gathered and tested. The testing would ensure that the bars used in construction meet or exceed what is published in the manufacturers' literature. This type of specification is analogous to cylinder testing of concrete placed during construction.
Another alternative is to require that the manufacturer submit test data to substantiate that the published design strengths meet the ACI 440.1 definitions.
Some consideration should be given to the ACI 440.1 's definition of guaranteed tensile strength. The guaranteed tensile strength, ff,, as defined by the ACI 440.1 (200 1) design guide, yields a 99.87% probability (assuming a normal distribution) that any given GFRP bar will meet
23

or exceed ff,. This is a very small probability of failure, which in turn leads to conservative design values for tensile strength. This is an extremely safe approach, however it tends to negate one of the advantages of GFRP bars, which is their high tensile strength. One way to utilize more of the tensile strength of a GFRP bar is to consider redefining the guaranteed tensile strength. The ACI 3 18-99 (1999) building code in section 5.3.2.1 uses a 99% probability of meeting or exceeding strength when defining the required compressive strength of concrete. This is assuming a I% risk of not meeting specified strength. A 1% probability of failure for GFRP bars would change the definition of guaranteed tensile strength to the mean minus 2.33 standard deviations (f*fu = f&e - 2.330). Defining the guaranteed tensile strength in this manner will allow a designer to use more of the tensile strength of a GFRP bar.
In conclusion, there are several options for a designer to choose with regards to the tensile strength of GFRP bars. The least conservative approach would be to use the manufacturers' published data to design for tensile strength, and ensure that these design criteria are met with random sample testing. As an alternative, the designer could require the manufacturer to supply test results, and design according the ACI 440.1 (2001) design guide. If a designer wished to utilize more of the tensile strength of the bars, consideration could be given to altering the definition of guaranteed tensile strength to the mean minus 2.33 standard deviations (ffU = f,,,, - 2.330). This would increase the usable tensile strength of the FRP bars, but would require the manufacturer to submit test results to establish the mean and standard deviation.
Design Modulus of Elasticity
Stress-strain data were collected from all of the tensile and all of the bond tests, in order to perform modulus calculations. From the data collected, the modulus was calculated as the slope of the longest continuous (linear with no jumps or breaks) portion of the stress-strain diagram. The modulus was then compiled and averaged by bar size and manufacturer. The average tested tensile modulus, the design tensile modulus, the manufacturers' published tensile modulus, and average modulus minus three standard deviations are shown in Table 1 1.
The design tensile modulus is defined by ACI 440.1 (2001) design guide as the average tensile modulus. Table 11 shows that Hughes Brothers Inc. publishes a modulus that is lower than the average tested tensile modulus. The tested moduli for the Marshall bars and the Pultrall bars were lower than the published values. Even so, observing the general trend of these data results in the conclusion that manufacturers are publishing the average tensile modulus.
ACI 440.1 (2001) specifies that the design tensile modulus is equal to the average tensile modulus. The code does not require the subtraction of three standard deviations as with the tensile strength. As a result, there is not a 99.87% probability that all similar bars will meet or exceed the design tensile modulus. This may seem to be an unconservative approach to design, but investigating the effects the modulus has on design provides insight into the rationale behind this decision.
24

Pultrall
One area influenced by the modulus is the crack width calculations. The ACI 440.1 (2001) design guide specifies the equation used to determine crack widths shown in Equation 3
(3) 2 . 2 w = -Pkb f f3Jd ,A E,
Where: w = Crack width (in) Ef = Modulus of elasticity (ksi) p = ratio of the distance from the neutral axis to the extreme tension fiber to the distance
kb = Bond dependent factor ff = Tensile stress in FRP bar (ksi) d, = distance from the center of the bar to extreme tension fiber of the effected area, A.
A = Effective tension area of concrete, defined as the bar spacing multiplied by twice the
from the neutral axis to the center of the tensile reinforcement
(in)
cover distance (in2)
#4 5770 420 5770 6100 4510
#5 5900 240 5900 6100 5190
#6 5870 180 5870 6100 5320
ALL 5860 270 5860 6100 5050
From Equation 3, it can be seen that the crack width will increase with a decrease in the modulus of elasticity. ACI 440.1 (2001) advises a limit for crack widths of 0.02 in. for GFRP in concrete with exterior exposure. The effect of the modulus can be seen by examining the change
25

in crack width for a typical bridge deck application. A crack width comparison was made assuming the following parameters:
slab depth of 7.5 in. depth to bar of 1.5 in. factored service moment of 159 kip-in. per foot width of slab service moment of 54.9 kip-in. per foot width of slab
0
0
0 No. 6 bar Using the design tensile modulus in Table 11 for a Hughes Brothers No.6 bar, a bar spacing of 5.25 in. will result in a crack width of 0.021 in., just slightly over the recommended width. If the mean modulus minus three standard deviations were used instead of the mean, for the same bar spacing, the crack width would increase to 0.025 in. This is a small difference in crack width, especially considering the inherent inaccuracy of crack width calculations. However, to maintain a crack width of 0.020 in. with the smaller modulus, the bar spacing would need to be reduced to 4.5 in. This decrease would cause a significant increase in the number of GFRP bars needed to control the crack width. Since cracking is a serviceability issue and not a strength issue, no failure would occur if the crack limit was exceeded due to a bar that did not meet the specified design modulus.
Another area affected by the modulus is the strength reduction factor (4) for flexure. The strength reduction factor (4) is determined by the ratio of the provided reinforcement ratio (pj) compared to the balanced reinforcement ratio (pjb). The modulus affects the calculation of the balanced reinforcement ratio (p jb ) . The ACI 440.1 (2001) design guide specifies the balanced reinforcement ratio, and it is given in Equation 4.
Where: = Concrete strength dependent factor (range 0.65 to 0.85)
f c = Concrete strength (ksi) ft,, = Design tensile strength of FRP bar (ksi) E/= Design modulus of FRP bar (ksi) zcu = Ultimate concrete strain (0.003)
ACI 440.1 (2001) also specifies the criteria for the strength reduction factor (4) for flexure. The strength reduction factor (4) is 0.5 for cases where pj is less than or equal to pfi (pj <pfb,O= 0.5), since an under-reinforced beam would fail due to bar rupture, which is considered to be a very sudden and brittle failure. For cases where the p j is greater than or equal to 1.4 times p~ ACI 440.1 (200 1) recommends a 4 factor of 0.70 (pj >1.4pfb, 4 = 0.7). This failure would be controlled by concrete crushing, which is considered to be somewhat less brittle. For cases where p j is between Pfb and 1.4 times pfb, the 4 factor recommended by ACI 440.1 (2001) is defined as the ratio of pj to twice Pjb ( p f ~ < pj I 1 . 4 ~ 0 , 4 = pj/2pfi).
Evaluating Equation 4, it can be seen that a larger design modulus will cause a larger balanced reinforcement ration (pfb). From the criterion set by ACI 440.1 (2001), a larger pjb will result in the use of a smaller 4 factor, which will cause a greater reduction in the calculated
26

moment capacity of section reinforced with GFRP bars. So indirectly, a larger design modulus of elasticity will result in smaller moment capacities for a given cross-section, and reinforcement arrangement.
The ACI 440.1 (200 1) design guide recommends the use of the average tensile modulus as the design modulus for concrete reinforced with GFRP bars. This specification is slightly unconservative with respect to serviceability issues. Even so, if the mean minus three standard deviations were used for the modulus, in design, the number of bars required would increase significantly and the bar spacing could become so small as to be impractical for use. Using the average modulus for the design modulus has a more conservative effect on strength issues. A larger modulus results in a greater reduction in the calculated moment capacity. Understanding that only serviceability aspects are adversely affected by the use of a larger design modulus of elasticity, and that the structural integrity is not compromised, it can be concluded that using the average modulus for the design modulus is safe and acceptable for design.
Design Coefficients Related to Bond Behavior
Characterization
Each of the manufacturers’ bars in the testing program exhibited a different type of bond behavior. Hughes Brothers’ bars exhibited a great deal of slip, approximately 0.15 to 0.20 in. before reaching the peak load, and continued to hold around 80% to 90% of the load after reaching the peak. Marshall’s bars reached their peak load within the first 0.04 in. of slip, and then lost the majority (approximately 75%) of the load. Pultrall also reached the peak load with small slips (approximately 0.04 in.), then continued to hold 50% to 80% of the load as the bar continued to slip. Figure 11 shows the typical behavior of all the of the manufacturers’ bars.
Each of the manufacturers’ bars exhibits a distinct pre-peak and post-peak behavior, which will influence the overall performance of the bars. In a failure situation such as a vehicle impact on the barrier rail of a bridge, which could result in bond failure of the GFRP bars, Hughes Brothers’ bars would perform best. Since the bars allow a large amount of slip before the peak is reached, and then continue to hold up to 90% of the load after peak, they could exhibit some degree of ductility in the case of a bond failure. The bars could slip and still hold load, yielding large deflections, and crack widths, giving some warning before impending failure. The same would not hold true for the Pultrall bars. Their bars have a higher peak bond stress than Hughes Brothers’ bars, but only hold up to 70% of the load after the peak has been exceeded. In a case where large deflections or bond failures could occur, such as vehicular impact on the barrier rail of a bridge, the Pultrall bars may not have enough post-peak strength to hold the structure together after the damage is incurred. Marshall’s bars exhibit the largest drop in load held after the peak load is attained. Since Marshall’s bars only maintain approximately 25% of the load after the peak is reached, they would not do well in the case of a vehicle impacting the barrier rail of a bridge. Once the peak load is exceeded the bars would shed the load and failure of the barrier rail and bridge overhang would be quick, and with little warning.
In typical service situations, however, all of the manufacturers’ bars could be expected to perform well. The ACI 440.1 (2001) design guide states that stresses in GFRP bars under
27
sustained or cyclic load shall be limited to 20% of the design tensile strength, to prevent a creep rupture or fatigue failure. Taking the lowest possible value for the design tensile strength for No. 6 bars from Table 10, which is the Pultrall bar, it can be found that the bar can be stressed to 9.6 ksi. This equates to a 4.3 kip load in the bar. Referring to Figure 11 it can be seen that all the bars have similar slips at this load level.
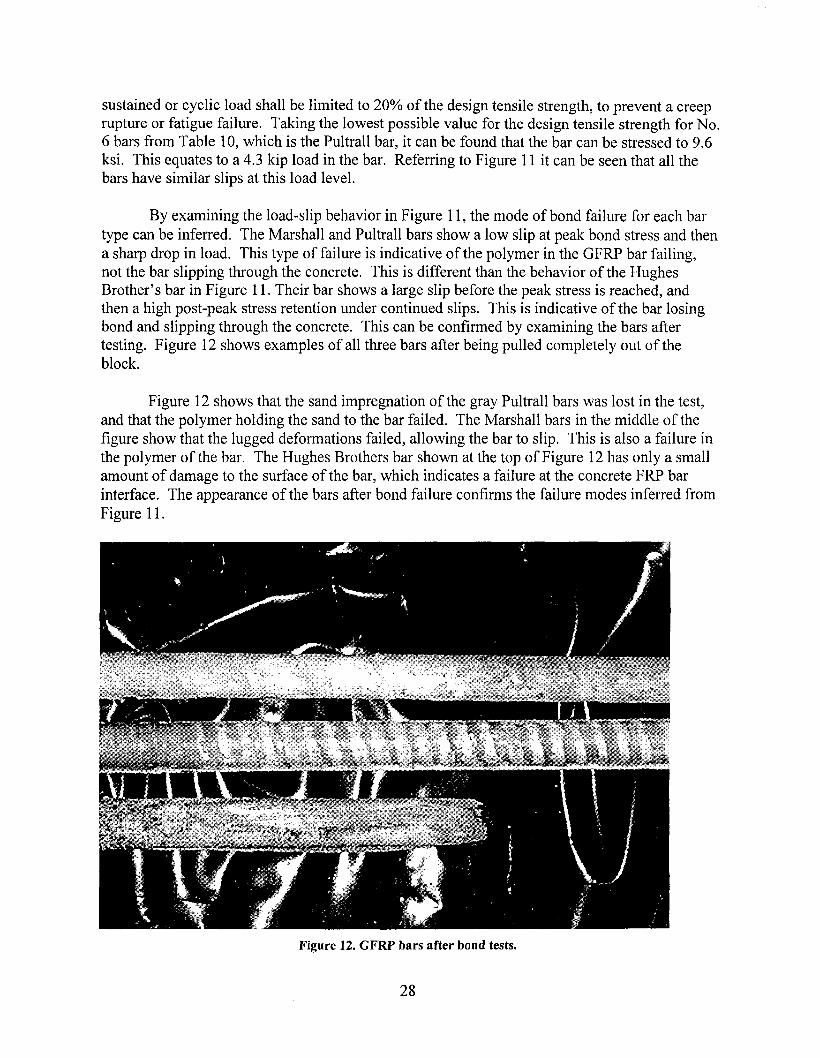
By examining the load-slip behavior in Figure 1 1, the mode of bond failure for each bar type can be inferred. The Marshall and Pultrall bars show a low slip at peak bond stress and then a sharp drop in load. This type of failure is indicative of the polymer in the GFRP bar failing, not the bar slipping through the concrete. This is different than the behavior of the Hughes Brother’s bar in Figure 1 1. Their bar shows a large slip before the peak stress is reached, and then a high post-peak stress retention under continued slips. This is indicative of the bar losing bond and slipping through the concrete. This can be confirmed by examining the bars after testing. Figure 12 shows examples of all three bars after being pulled completely out of the block.
Figure 12 shows that the sand impregnation of the gray Pultrall bars was lost in the test, and that the polymer holding the sand to the bar failed. The Marshall bars in the middle of the figure show that the lugged deformations failed, allowing the bar to slip. This is also a failure in the polymer of the bar. The Hughes Brothers bar shown at the top of Figure 12 has only a small amount of damage to the surface of the bar, which indicates a failure at the concrete FRP bar interface. The appearance of the bars after bond failure confirms the failure modes inferred from Figure 11.
Figure 12. GFRP bars after bond tests.
28

Design Effect
Deflections Bond behavior, and bond stress influence the design of concrete reinforced with GFRP
bars in several ways. The bond behavior of FRP bars is taken into account in the control of deflections in the ACI 440.1 (2001) design guide. ACI 440.1 (2001) specifies the formula for the effective moment of inertia (Ie). It is given here in Equation 5.
Where: Mcr = Cracking moment M, = Applied moment I, = Gross moment of Inertia IC, = Cracked moment of Inertia
The factor P d is given in Equation 6
Ef pd
Where: El = The design modulus for GFRP E, = The modulus for steel a b =bond dependent factor.
ACI 440.1 (2001) specifies the a b term to be 0.5, which is the same for steel. There is no information given in the guide as to why or how this was chosen. There are definite differences in the bond characteristics of steel bars and GFRP bars, particularly those that are not deformed. But due to the limited guidance provided by ACI 440.1 (2001), no recommendations can be given to determine the a b factors for the bars tested in the program. Until further research can provide greater understanding, designers are left to rely on the judgment of the 440 committee.
Cracking The crack width calculations are another area affected by bond. The crack width
equation specified by ACI 440.1 (200 1) is given in Equation 3. The bond behavior is accounted for in the bond dependent coefficient, kb. As with the a b factor, little guidance is given as to how to determine kb for a given bar. The ACI 440.1 (2001) design guide specifies the factor, kt,, to be 1 .O for steel bars. Bars with superior bond performance to that of steel have a kb value less than 1 .O while bars having inferior bond performance have a kb value greater than 1 .O. The only additional recommendation given by ACI 440.1 (2001) is that deformed FRP bars shall have a kb value of 1.2. With this guidance, a kb value for Marshall’s bars, which are deformed, is 1.2. Referring to the results in Appendix B and Figure 1 1, it can be seen that Marshall and Pultrall
29

exhibit similar bond behavior. On this basis, a kb of 1.2 is recommended for bars manufactured by Pultrall. The bars produced by Hughes Brother exhibit a different bond behavior than Marshall or Pultrall, although, at lower loads all of the bars behave similarly. Still, it is recommended that the bars produced by Hughes Brothers use a kb value of 1.3.
Development Length Another area that is largely dependent on the bond behavior is the development length
calculations for FRP bars. ACI 440.1 (2001) specifies the equation for the basic development length (lbf), in in., that comes from equilibrium. This is shown in Equation 7.
dbff i l
4?f !bf =-
Where: db = diameter of reinforcing bar (in) ff, = Design tensile strength of the bar (ksi) pf = Average bond stress (ksi)
Since the average bond stress is not known in most cases, ACI 440.1 (200 1) has developed an equation to use for design purposes. The design equation for development length is shown in Equation 8.
The two equations can be compared using the average maximum bond stresses obtained in the testing program. The results of this comparison are shown in Table 12.
(7)
It can be seen in Table 12 that Equation 8 yields a development length three to four times larger that of Equation 7. This occurs for several reasons. It occurs in part due to the fact that
30

the ACI 440.1 (2001) design guide ensures that the bar will fail due to slipping of the bars vs. cracking or splitting of the concrete. Another reason is the tested average maximum bond strength values were determined from specimens with a short embedment length, and due to the non-linear bond stress distribution found along the bar (Larralde and Silva-Rodriguez, 1993), the values decrease with an increase in embedment length. There is a great deal of variability in the measured bond stresses, with coefficient of variation ranging from 1 8 to 2 1 %. If a guaranteed bond stress were used to calculate the development length, the length would increase substantially. Also, the ACI 440.1 (2001) design guide incorporates a factor of safety into Equation 8. Regardless of the reasons for the differences, Equation 8 presents a conservative estimate for the development length.
Some manufacturers publish a maximum bond stress in their literature. These numbers could be used in conjunction with equation 7 to produce a development length. Table 13 shows the development length calculated with Equation 7 using the manufacturers published literature. All of the manufacturers’ bond stress results came from direct pullout tests, and it is not specified whether the results are averages or lower bounds. If bond stress values are not available (NA) from the manufacturers literature, it is reflected in the table.
Published Values
Comparing Table 12 and Table 13, it can be seen that the manufacturers’ published bond stresses are lower in all cases than the tested maximum average bond stress. This results in longer development lengths, using Equation 7. The lower maximum bond stress values published in the manufacturers literature are likely the result of using a longer embedment length, and gathering data from a larger sample size. Even though the development lengths are longer using the published data over the tested data, the design equation for the development length (Equation 8, Table 12) is still two to three times larger than either of the calculated values. Although it is conservative, the use of Equation 8 should bring confidence to any design that the development length criteria is satisfied. Therefore, it is recommended that the design equation (Equation 8) be used when determining the development length.
31

CONCLUSIONS
This report presented the tested tensile and bond properties of three commercially available GFRP reinforcing bars. Design values were determined based on the conducted tests. The properties investigated included the tensile strength, modulus of elasticity, peak bond stress, and general bond behavior of the bars. These properties influence many different areas of design including design tensile stress, design modulus, crack width calculation, deflection control, and development length estimation. Each of the investigated properties was related to the relevant area of design. From the developed relationships between the properties, and their design influence, the following general conclusions can be made.
9
The design tensile stress specified by the ACI 440.1 (200 1) design guide is believed to be somewhat conservative, and alternative design approaches were proposed. The design modulus specified by ACI 440.1 (2001) was found to be acceptable for design. It is difficult to provide recommendations for the bond coefficient for deflection calculations ( a b ) because not enough guidance is given in the ACI 440.1 (2001) guide. Design values were given for the kb factor for crack width calculations for each of the tested manufacturers. The design development length calculation given in ACI 440.1 (2001) was found to be conservative.
.
. RECOMMENDATIONS
Design Values
Table 14 presents a summary of the recommended design values for each manufacturer and bar size, and also the properties of a fictitious bar that is the combination of all the lowest measured material properties. If these properties were used in design, all bars would be acceptable for the design.
32

Further Research
It is clear that material and bond properties of FRP reinforcement have a significant effect on the design of a bridge deck. The tensile strength, modulus, peak bond stress and bond behavior have impacts in several areas. These areas include the design tensile strength, the design modulus, deflection control, crack width calculations, and development length estimations. Each area was given considerable review and evaluation, and recommendations were made based on the results from the testing program, and the ACI 440.1(2001) design guide.
From the evaluation of the results, and the specifications set by the ACI 440.1 (200 1) design guide, further research is needed to better understand crack width and deflection behavior. No guidance is given by ACI 440.1 (2001) design guide in relation to the a b (bond dependent) factor used in deflection calculations, and very little guidance is given for the kb (bond dependent) factor used in crack width calculations. More beam end bond test should be performed using different types of FRP bars at different embedment lengths, and these results should be compared to those of normal mild steel bars under the same conditions. For comparison, flexural tests of beams and slabs should be conducted and crack widths and deflections carefully determined. The results from these tests would aid in determining criteria to more accurately define a b , and kb bond dependent values for FRP bars.
ACKNOWLEDGEMENTS
The authors appreciate this opportunity to perform research sponsored by the Virginia Transportation Research Council and the Federal Highway Administration’s Innovative Bridge Research and Construction Program. The support of Jose Gomez of VTRC is gratefully acknowledged. Also greatly appreciated were the assistance and material donations provided by Doug Gremel of Hughes Brothers, Salem Faza and Sam Steere of Marshall Industries and Eric Martin of Pultrall.
33

REFERENCES
ASTM A 944-95 , Standard Test Method for Comparing Bond Strength of Steel Reinforcivlg Bars to Concrete Using Beam-End Specimens, West Conshohocken, PA, 1995.
Building Code Requirements for Structural Concrete (31 8-99) and Commentary (31 8R-99), American Concrete Institute Committee 3 18, Farmingtion Hill, MI, 1999.
Design Manual. Marshall Industries Composites, Inc., Lima, Ohio, 1999.
Glass Fiber Reinforced Polymer Rebar. Hughes Brothers, Inc., Seward, Nebraska, 2000.
Guide for the Design and Construction of Concrete Reinforced with FRP Bars, American Concrete Institute Committee 440, Farmington Hills, MI, 200 1.
Isorod Pultrall. Online. Internet. 200 1 Available: http://www.pultrall.adsinc.ca/indx padprod pag/cons padprod pag/isorodts.htm
Johnston, D.W. and Zia, P., Bond Characteristics of Epoxy Coated Reinforcing Bars. Report No. FHWA/NC/82-002, North Carolina State University, Raleigh, North Carolina. 1982.
Larralde, J. and Silva-Rodriguez, R. Bond and Slip of FRP Rebars in Concrete. Journal of
Standard Test Methods for FRP Rod and Sheet. American Concrete Institute Committee 448K,
Materials in Civil Engineering, Vol. 5 , No. 1, January 1993, pp. 30-40.
Farmington Hills, MI, 1999.
34
APPENDIX A Stress-Strain Diagrams For Tensile And Bond Tests
Al-Tensile Tests
Legend for entries are as follows: 0
0
Extens - data collected by the two-inch clip-on extensometer, Gage 1 - data collected by a strain gage mounted at the mid-point of the bar Gage 2 - data collected by a second strain gage also mounted at the mid-point of the bar
A- 1

4 - v) v) Y L
r%
#4 Hughes Brothers - Test 1 HB4-1
100
80
60
40
20
0 0 2000 4000 6000 8000 10000 12000 14000 16000 18000
Microstrain
120
100
80 3
20
#4 Hughes Brothers - Test 2 HB4-2
0 0 2000 4000 6000 8000 10000 12000 14000 16000 18000 20000
Microstrain
A-2

100
90 80 70
#4 Hughes Brothers - Test 3 HB4-3
1
30 20 10
0 0 2000 4000 6000 8000 10000 12000 14000 16000 18000 20000
Microstrain _ _ .-
I20
IO0
80
60
40
20
0
#4 Hughes Brothers - Test 4 HB4-4
1
0 2000 4000 6000 8000 10000 12000 14000 16000 18000
Microstrain
A-3
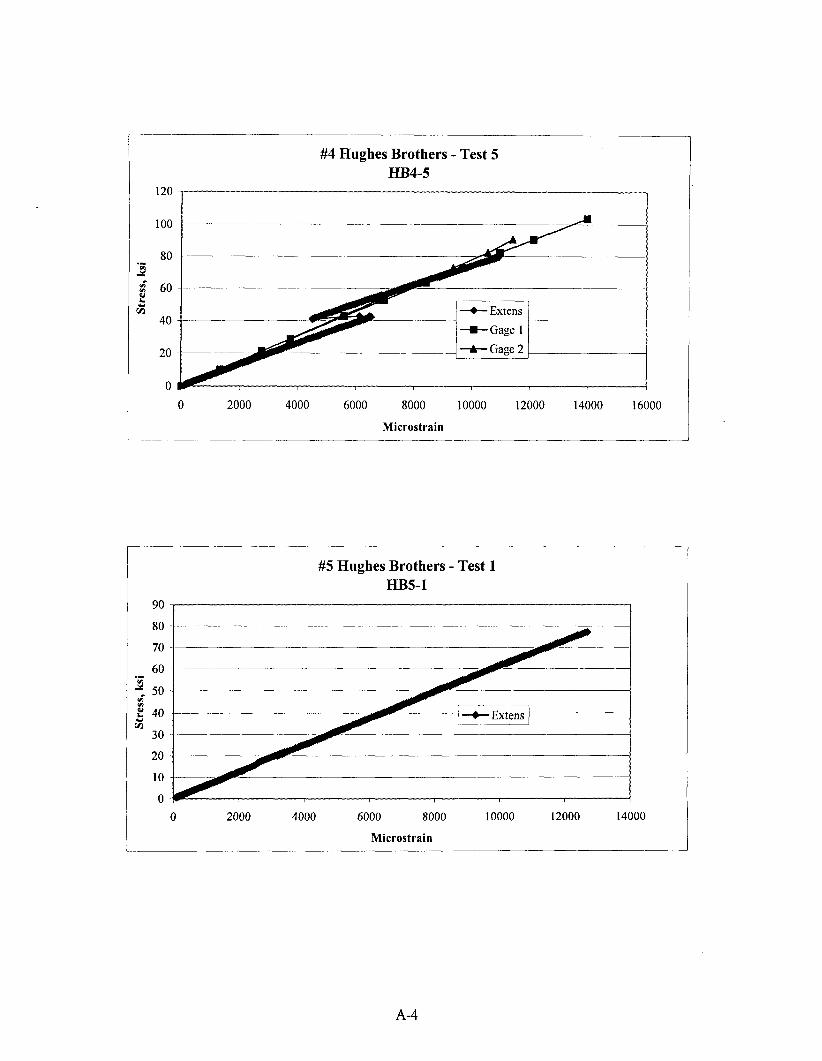
120
100
80
60
40
20
0 0
#4 Hughes Brothers - Test 5 HB4-5
2000 4000 6000 8000 10000 12000 14000 16000
Microstrain
#5 Hughes Brothers - Test 1 HB5-1
90 J 1 80
70
60
50
E 40
30
v)
;;
20
I O
0
0 2000 4000 6000 8000
Microstrain
10000 I2000 14000
A-4

100
90
80
IO 60
50
40
30
20
10
0
#5 Hughes Brothers - Test 2 HB5-2
L - 6
--t Extens +Gage 1
L
0 2000 4000 6000 8000 10000 12000 14000 16000 18000
Microstrain
#5 Hughes Brothers - Test 3 HB5-3
- ~~~ ---*.-- ~ - - - ~ _ x x - * x x - I 2 O r------- 100
80
60
40
20
, I
15000 20000 25000 0 5000 10000
A-5

120
100
80
d 60 2 z
40
20
0
4
0 2000 4000 6000 8000 10000 12000 14000 16000 18000
120
100
80
d 60
z 40
20
0
3 0 L
0 2000 4000 6000 8000 10000 12000 14000 16000
Microstrain -
A-6

#6 Hughes Brothers - Test 1 HB6-1
90
80
70
60
2 50 m" v)
f 40 t%
30
20
10
0 0 2000 4000 6000 8000 10000 12000 14000 16000
Microstrain
90
80
70
60
3- 50 rA v)
f 40 2
30
20
10
0
#6 Hughes Brothers - Test 2 HB6-2
0 5000 I0000 15000 20000 25000
_- Microstrain -.__
A-7

#6 Hughes Brothers - Test 3 HB6-3
- 15000 - 10000 -5000 0 5000 10000
Microstrain
#6 Hughes Brothers - Test 4 HB6-4
0 5000 10000 15000 20000 25000 30000
Microstrain - I----- ____--
A-8

80
70
60 ' 50 UT E 40 z
30
20
I O
0 0 2000 4000 6000 8000 10000 12000 14000 16000
#4 Marshall - Test 1 M4-1
0 2000 4000 6000 8000 10000 12000 14000 16000 18000
Microstrain -
~
A-9

#4 Marshall - Test 2 M4-2
0 2000 4000 6000 8000 10000 12000 14000 16000 18000
Microstrain
120
IO0
80
60
40
20
0 0 5000 10000 15000 20000
Microstrain
25000
A-10

120
100
80
60
40
20
0
#4 Marshall - Test 4 M4-4
I I X __-,I .---”--~------------------------
15000 20000 25000 0 5000 10000
Microstrain
Microstrain
A-1 1

#4 Marshall - Test 6 M4-6
- -
#4 Marshall - Test 7 M4-7
A-12

90
80
70
60 ' 50 VT 2 40 j;
30
20
1 10
0
I
1
#5 Marshall - Test 1 M5-1
5000 10000 15000 -5000 0 -15000 -10000
Microstrain __ -J - __- --___---- __--
A-13

.
#5 Marshall - Test 3
90
80
70
.- 60 9 50 2 40
30
20
10
0
VI
_ _ _
0 5000 10000 15000 20000 25000 30000 35000 40000
1 : VI u
L
l g
i
0 5000 10000 -5000 Microstrain i
A-14
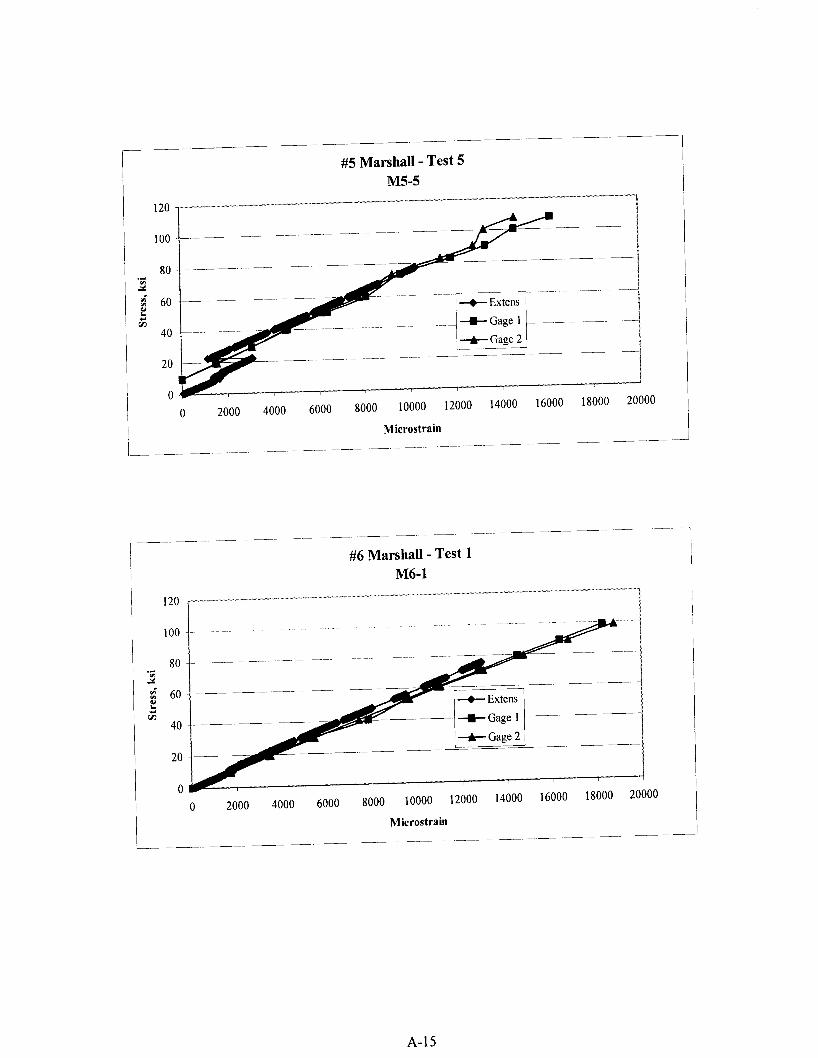
120
IO0
80
60
40
20 ___-___
0 2000 4000 6000 8000 10000 12000 14000 16000 18000 20000
,
Microstrain
120
100
80
60
40
20
0
Microstrain
A-15

#6 Marshall - Test 2 M6-2
I- I I I
I20
100
80
60
40
20
0 -30000 -20000 -10000 0 10000 20000
Microstrain ~ _ _ - -
~
100
90
80
70
60
50
40
30
20
10
0
#6 Marshall - Test 3 M6-3
0 5000 10000 15000 20000 25000
Microstrain ~
A-16

Microstrain
~
#6 Marshall - Test 5 M6-5
100
80 2 d 60
j; 40
20
0
.-
u
0 L""" 7""" - - - - Microstrain
A-17

#4 Pultrall - Test 1 P4-1
"7 - 90 ,~ _I_-xLIxIIIAx----------
80
70
60
?. 50
E 40 s 30
20
IO
0
.- v)
I- - 7-
. ---
t 1
10000 12000 14000 4000 6000 8000 0 2000 Microstrain
60
50
2 40
b 30
20
IO
0
.- ul v) u
v1
J
+Gage 1
0 2000 4000 6000 8000 10000 12000 14000
Microstrain
A-1 8

so 70
60
-- 50 3 5 40
j; 30
20
10
0
a
0 3000 6000 9000
Microstrain _ .
12000
~- -
15000
-
10000 12000 14000 2000 4000 6000 SO00
Microstrain -1
A-19
70
60
3 50
5 40 2
30
20
10
0 0 3000 6000 9000 12000 15000
Microstrain ~ - -
~ ~ ~ _ _ ~ ~ ~~
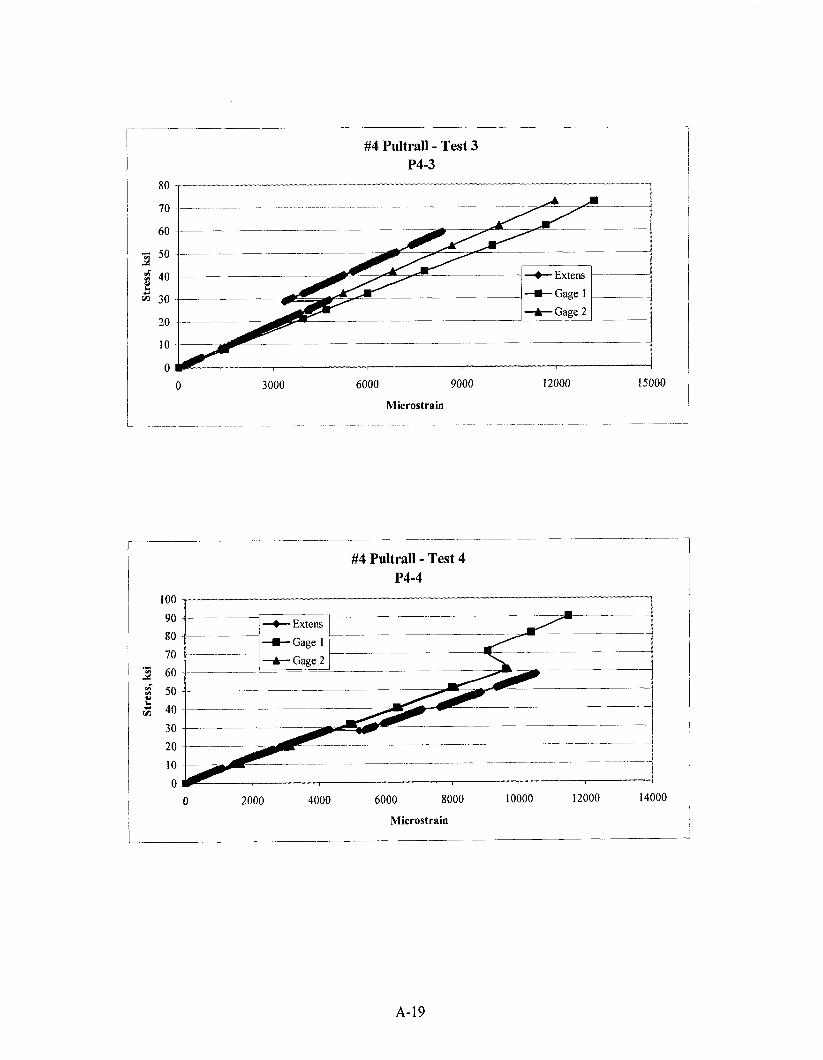
I loo--.------ ---
.- 2
;; rA v1 u L
I
90
80
70 60 50
40
30 20 10
0 4000 6000 8000 10000 12000 14000
Microstrain L 2ooo
A-19

#4 Pultrall - Test 5 P4-5
70
60
50
40
30
20
10
0
0 2000 4000 6000 8000 10000 12000 14000 16000
Microstrain _~_~.__________. ____ _ _ _ _ _ _ _ _ _ ~ ~ _ ~
#5 Pultrall - Test 1 P5- 1
80
70
60
*- 50 9 5 40
30
20
10
0
L
0 2000 4000 6000 8000 10000 12000 14000 16000
Microstrain - _______-___
A-20

80
70
60
*- 50 r" 5 40 2
30
20
10
0
. c 4000 6000 8000 10000 12000 14000 16000 0 2000
Microstrain - - -~ _ ~ _ ~ _ _ - ~
-
i
A-2 1
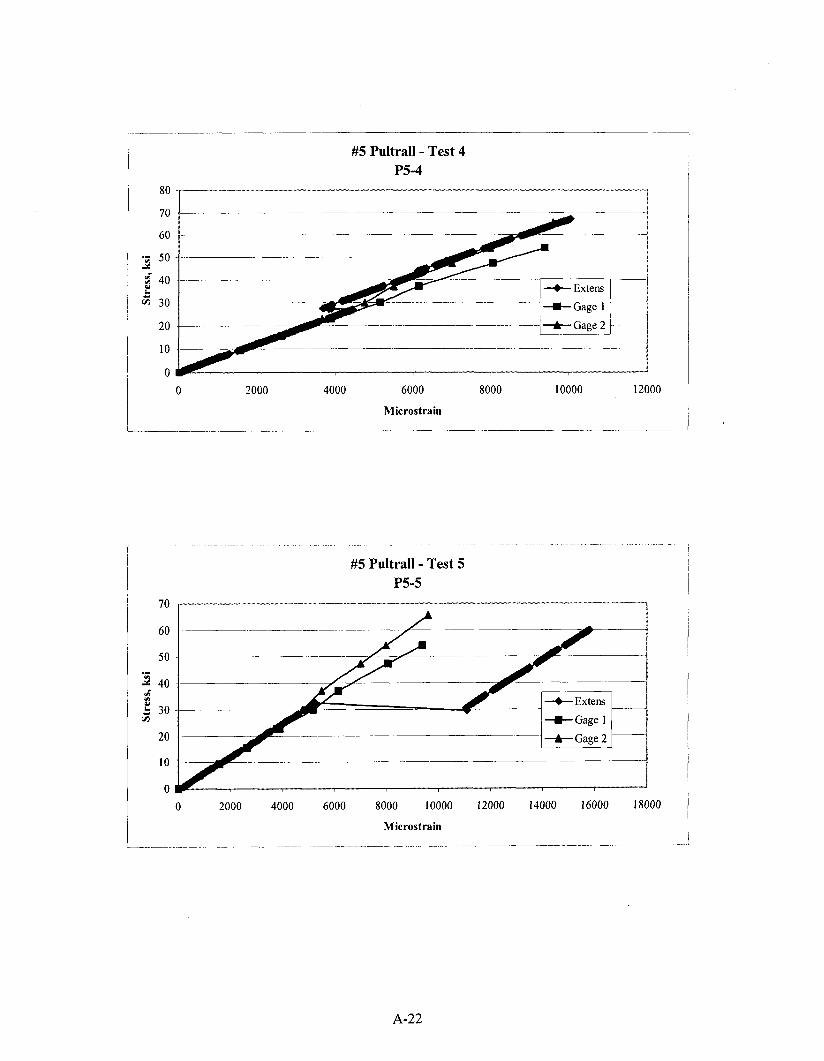
#5 Pultrall - Test 4 P5-4
80
70
60
e- 50 2 f 40
30 i
20
10
0 0 2000 4000 6000 8000 10000 12000
Microstrain - ~- - ~ ~ _ _ _ _ _ _ _ _ _ _ ~ _ _ ~ _ _ _
70
60
50
3 40 d
3 30
20
10
0
.- v)
r/l
#5 Pultrall - Test 5 P5-5
0 2000 4000 6000 8000 10000 12000 14000 16000 18000
Microstrain
A-22
70
60
.- 50 s 5 40
30
20
10
0
u
0 2000 4000 6000 8000 10000 12000 14000 16000
Microstrain
80
70
60
0- 50 s 1 40
30
20
IO
0
I.
#6 Pultrall - Test 2 P6-2
2000 4000 6000 8000 10000 12000 14000 0
Microstrain ~ _ _ _
A-23
-4000 -2000 0 2000 4000 6000 8000 10000 12000 14000
Microstrain - - ___ ._ -.
90
80
70
60 P I 50
2 40 ;;
30
20
10
0
- v1
2000 4000 6000 8000 10000 12000 14000 16000 0 M ic rost rain
____
A-24
#6 Pultrall - Test 5 P6-5
---- 90 _x^ ,--_Ix ~~
0 2000 4000 6000 8000 10000 12000 14000 16000 18000
Microstrain
A-2 5

A-2 - Bond Tests
In this section, the stress-strain diagrams developed from data collected during the bond tests are presented. Ech graph shows all diagrams for a given bar size and manufacturer. Graphs display the results from up to six bond tests. The tests are designated as follows:
1.
2. 3. 4.
Initials for manufacturer- HB - Hughes Brothers M - Marshall P - Pultrall
Bar size -No. 4, No. 5 or No. 6 Embedment Length - 5 or 7.5 bar diameters Test number - 1,2,3, or 4
A-26

Bond Tests - Hughes Brothers #4 Bars
I 0 1000 2000 3000 4000 5000 6000 7000 8000 9000 10000
Microstrain _ _ _ ~ I ____ ~~~ --__--___-
60
20
10
80 1
Bond Tests - Hughes Brothers #5 Bars
~~
70
60
._ 50 9 5 40
' 30
20
10
0
u L
10000 12000 0 2000 4000 6000 8000
Microstrain ~ -~ ~_ __.__ -_--_____ -~~
A-21

70 1
Bond Tests - Hughes Brothers #6 Bars
60 i 50 h m 9 40
E 30 i%
20
10
' 0
v v)
0 2000 4000 6000 8000 10000 12000 14000 16000
Microstrain ! _ _ _ _ ~ -~ - - _ _ _ ~ ~ - ~ ~ ~ _ _ ___
0 2000 4000 6000 8000 10000 12000 14000
Microstrain
A-2 8

-2
- 6 O G
1 + M5-5-2 + M5-7.5- 1 * M5-7.5-2
--50+-----=
30 -10 4 2000 4000 6000 8000 10000 12000 14000 16000
Microstrain
Bond Tests - Marshall #6 Bars
4 2000 4000 6000 8000 10000 12000 1 4 ~ 3 0 -10
Microstrain
A-29

Bond Tests - Pultrall#4 Bars
-20 J
Bond Tests - PuItrall#5 Bars
-2000 2000 4000 6000 8000 10000 12000 14000
Microstrain .__ ~_
A-30

80
70-
60-
50-
40-
30-
20-
10-
0-
__ _-
___-
.___
)O -10
Bond Tests - Pultrall#6 Bars
,
I I I
I I 2000 4000 6000 8000 10000 12000
Microstrain
A-3 1

APPENDIX B Load Versus Slip Plots
B- 1
Load vs Live End Slip Pultrall#4 - 5 Db - Test #I
vl a 3 a- m s
Load vs Free End Slip Pultrall#4 - 5 Db - Test #1
B-2

-0.1
7-
6
5 -
4-
3-
2-
1
0
___-
~~
__-
___ --
0 0.1 0.2 0.3
Slip, in
Load vs Free End Slip Pultrall#4 - 5 Db - Test #2
0.4 0.5 0.6
_I I I I
0.3 0.4 0.5 0.6 -0.1 0 0.1 0.2
Slip, in
B-3

1'4 1 4\
-0-
Load vs Live End Slip Pultrall#4 - 7.5 Db - Test #I
-0.1 0 0.1 0.2 0.3 0.4 0.5 0.6 0.7 0.8 0.9
Slip, in
No free end data for this specimen
B -4

Load vs Live End Slip Pultrall#4 - 7.5 Db - Test #2
v) a 3
m
.I
6 2
n V I , I I
0.4 0.6 0.8 1 -0.2 0 0.2
Slip, in
Load vs Free End Slip Pultrall#4 - 7.5 Db -Test #2
p”’ 1
0.3 0.4 0.5 0.6 -0.1 0 0.1 0.2
Slip, in
B-5

Load vs Live End Slip Pultrall#5 - 5 Db - Test #1
.- 12
5
A
m 6
12 3 a-
s m
-0.2 0
20
16
12
8 __--
4 ___--
0"
0.2 0.4 0.6
Slip, in
Load vs Free End Slip Pultrall#5 - 5 Db - Test #1
0.8 1 1 .L
-0.1 0 0.1 0.2 0.3
Slip, in
0.4 0.5 0.6
B-6

%
d .I Y
m s
16
12
-8 ~
4 ~ _ - -
0
-0.2
vl a 3 a- m s
-0.1
Load vs Live End Slip Pultrall#5 - 5 Db - Test #2
.",.-____- pw---.---___-w"---
0 0.2 0.4 0.6
SliD. in
0.8 1 1.2
16- _-"".
12- __-
8-
4- ___--
0- 0
Load vs Free End Slip Pultrall#5 - 5 Db - Test #2
, I I I I
0.1 0.2 0.3
Slip, in
0.4 0.5 0.6
B-7

25- ,,---.
20-
15-
10- -~
5 ___-
0-
1
5 -"-
6
Load vs Free End Slip Pultrall#5 - 7.5 Db - Test #1
- -
1 I I I I
0.2 0.3 0.4 0.5 0.1
~
Slip, in
6
B-8

Load vs Live End Slip Pultrall#5 - 7.5 Db - Test #2
14-
12-
10-
8-
6-
4-
2-
0-
I I 2"
"I ll."l""
___
_--
~-
Slip, in
Load vs. Free End Slip Pultrall#5 - 7.5 Db - Test #2
6
1- 1- - - T~ - -- T-- - - ~
0.1 0.2 0.3 0.4 0.5 016 ,,.,,,, "-. , I"___x ,.lll".._ ,.....,-l""._..III..X" ~ . - . .
Slip, in
B-9

Load vs Live End Slip Pultrall#6 - 5 Db - Test #1
y1 a 3 -0" c8 s
-0. I
20
16
4
0 0
0 0. I 0.2 0.3 0.4 0.5 0.6
Slip, in
Load vs Free End Slip Pultrall#6 - 5 Db - Test #1
0.1 0.2 0.3
Slip, in
0.7
0.4 0.5 0.6
B-10

Load vs Live End Slip Pultrall#6 - 5 Db - Test #2
v) a a m
.- a" 2
-0.2 0
I I I , 1
0.2 0.4
Slip, in
0.6
Load vs Free End Slip Pultrall#6 - 5 Db - Test #2
0.8 1 1.2
-0.1 0 0.1 0.2 0.3
Slip, in
0.4 0.5 0.6
B-11

Load vs Live End Slip Pultrall#6 - 7.5 Db - Test #1
-0.2 0 0.2 0.4 0.6 0.8 1
Slip, in
Load vs Free End Slip Pultrall#6 -7.5 Db - Test #1
B-12

Load vs Live End Slip Pultrall#6 - 7.5 Db - Test #2
m a Y
m
.I
d s
-0.1 0 0.1 0.2 0.3 0.4 0.5 0.6 0.7 0.8 0.9 1
Slip, in
Load vs Free End Slip Pultrall#6 - 7.5 Db - Test #2
3 0- --
25- _--
20-
15- ___
10-
5 -
0- -0.1 0 0.1 0.2 0.3
Slip, in
0.4 0.5 0.6
B-13