glob sppi monthly co2 report -...
TRANSCRIPT

glob
January 2009
Vol. I
Issue 1
SPPI Monthly CO2Report
Christopher Monckton, Editor

2
The Bush Years: 8 Years of Global Cooling 3CO2 Rising below IPCC Predictions – Chart 4IPCC Exponential CO2 Growth Not Occurring – Chart 5The 29-Year Global Warming Trend- Chart 6The Bush Years – Chart 7The Gore Years – Chart 8Sea Level Rise – Chart 9Arctic Sea Ice Extent – Chart 10Antarctic Sea Ice Extent – Chart 1130 Years of Sea Ice – Chart 12Hurricane and Tropical Cyclone Activity – Chart 13Climate-Sensitivity Ready Reckoner 14New Science – Breaking News in the Journals 15
30-Second Summary 15Tropical Atlantic and Caribbean Cyclones 15“Global Warming” and Wildfires 16Estimating 21st Century Sea-level Rise 16How Permanent is Permafrost? 17The Middle Ages Were Warmer Than Today 17
Contents

3
The Bush Years: 8 years’ global coolingSPPI’s Monthly CO2 Report shows that throughout the eight years of George Bush’s presidency there hasbeen a downtrend in global temperature at a rate equivalent to 2 °F (1.1 °C) per century. Main points –
Since Al Gore’s climate movie An Inconvenient Truth was launched in January 2005, global cooling has occurred at theequivalent of 11 °F (6 °C) per century. If this very rapid cooling were to continue, the Earth would be in an Ice Age by 2100.
The UN’s climate panel, the IPCC, had projected temperature increases at 4.5 to 9.5 °F (2.4 to 5.3 °C) per century, with acentral estimate of 7 °F (3.9 °C) per century. None of the IPCC’s computer models had predicted a prolonged cooling.
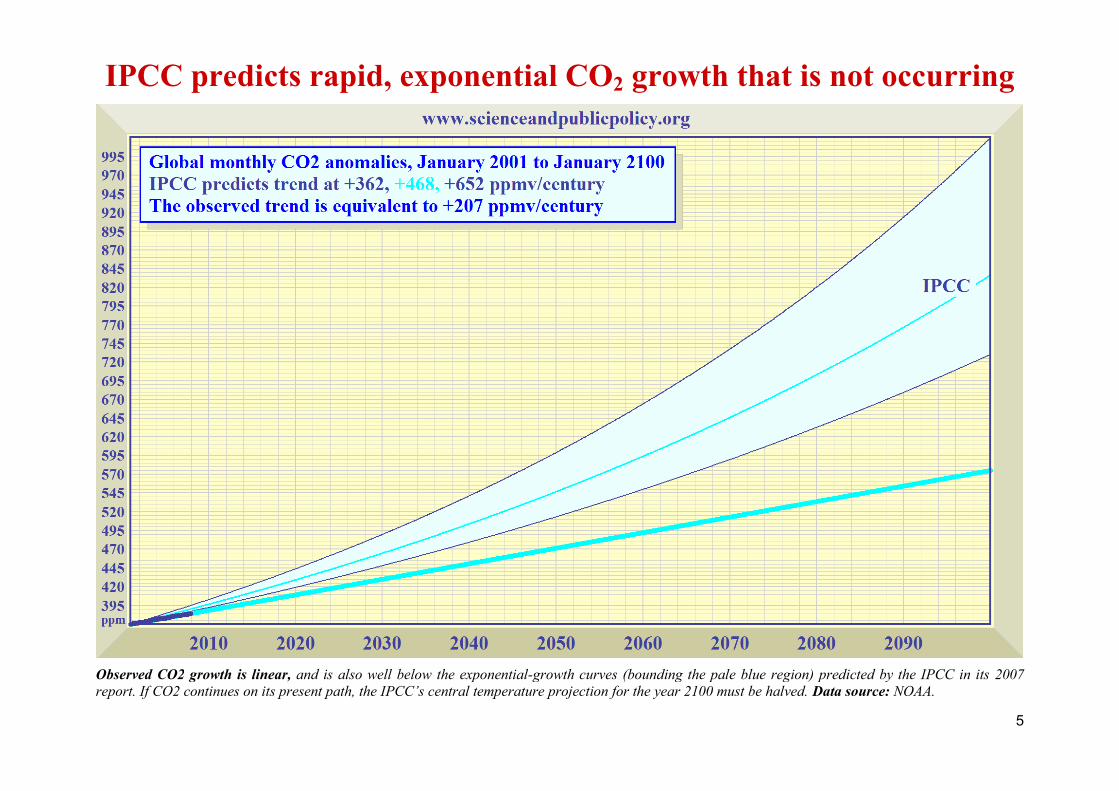
The IPCC’s estimates of growth in atmospheric CO2 concentration are excessive. They assume CO2 concentration willrise exponentially from today’s 385 parts per million to reach 730 to 1020 ppm, central estimate 836 ppm, by 2100.
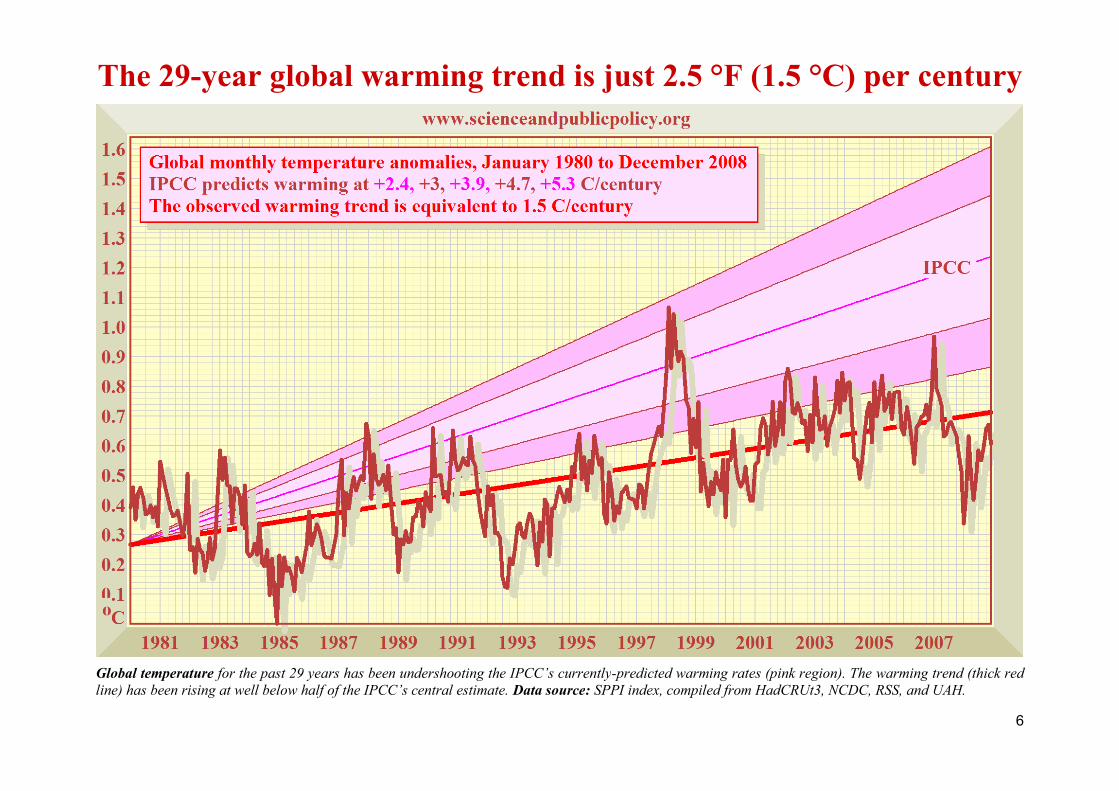
However, during President Bush’s eight-year term, CO2 concentration rose in a straight line towards just 575 ppmv by 2100.This alone halves the IPCC’s temperature projections. Since 1980 temperature has risen at only 2.5 °F (1.5 °C) per century.
The University of Colorado has published no sea-level data from the JASON monitoring satellite since the summer of 2008.However, sea level has been rising at just 1 ft (32 cm) per century, well below the IPCC’s recently-reduced 2 ft maximum.
Sea ice extent in the Arctic recovered to the 30-year average during the early winter of 2008. In the Antarctic, sea ice extentreached a record high late in 2007, and has remained plentiful since. Global sea ice extent shows no trend for 30 years.
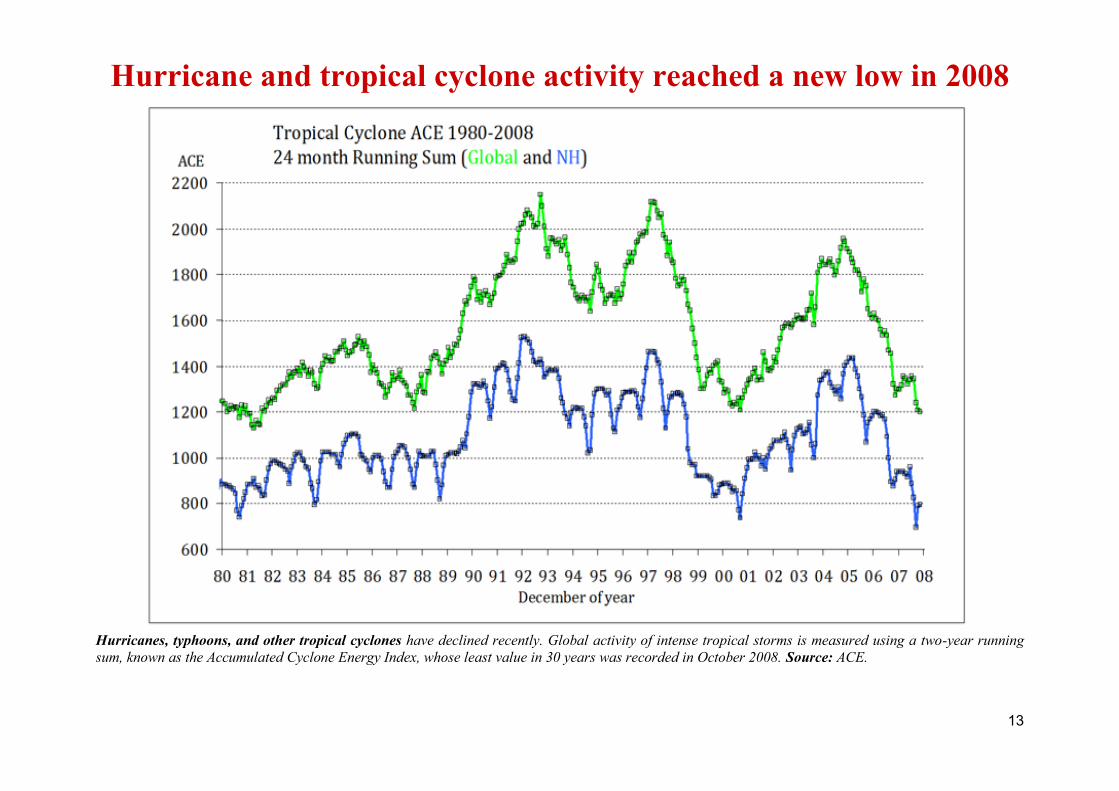
The Accumulated Cyclone Energy Index is a 24-month running sum of monthly energy levels in all hurricanes,typhoons and tropical cyclones. The Accumulated Cyclone Energy Index hit a 30-year low in October 2008.
A paper explaining how SPPI’s CO2 and temperature graphs are computer-generated is under peer review and will beavailable soon. For future editions of the Monthly CO2 Report, go to www.scienceandpublicpolicy.org.
SPPI Monthly CO2 Report January 2009Analysis for Today’s Policymakers

4
CO2 concentration is rising, but is well below IPCC predictions
CO2 is rising in a straight line, well below the IPCC’s projected range of increases in CO2 concentration (pale blue region). The deseasonalized real-worlddata are shown as a thick, dark-blue line superimposed on the least-squares linear-regression trend. Data source: NOAA.
5
IPCC predicts rapid, exponential CO2 growth that is not occurring
Observed CO2 growth is linear, and is also well below the exponential-growth curves (bounding the pale blue region) predicted by the IPCC in its 2007report. If CO2 continues on its present path, the IPCC’s central temperature projection for the year 2100 must be halved. Data source: NOAA.
6
The 29-year global warming trend is just 2.5 °F (1.5 °C) per century
Global temperature for the past 29 years has been undershooting the IPCC’s currently-predicted warming rates (pink region). The warming trend (thick redline) has been rising at well below half of the IPCC’s central estimate. Data source: SPPI index, compiled from HadCRUt3, NCDC, RSS, and UAH.

7
The Bush Years: 8 years’ global cooling at 2 °F (1.1 °C) per century
In defiance of prediction, throughout the Bush presidency global temperatures were on a pronounced downtrend. The IPCC’s predicted warming path (pinkregion) bears no relation to the global cooling that has been observed in the 21st century to date. Source: SPPI global temperature index.

8
The Gore Years: 4 years’ rapid cooling at 11 °F (6 °C) per century
Global cooling has been particularly rapid since Al Gore launched his climate movie. If the cooling trend of the past four years were to persist, there wouldbe an Ice Age by 2100. The cooling has been caused partly by a prolonged la Nina, partly by the current prolonged solar minimum. Source: SPPI Index.

9
Sea level is rising 1 ft/century, half the IPCC’s projected maximum
Steady rise in sea level: The average rise in sea level over the past 10,000 years was 4 feet/century. Now, sea-level rise is little more than 1 ft/century. Asrecently as 2001, the IPCC had predicted that sea level might rise as much as 3 ft in the 21st century. However, this maximum was cut by more than one-thirdto less than 2 feet in the IPCC’s 2007 report. Moerner (2004) says there is little reason to suppose that sea level will rise in the 21st century by more than the8 inches observed in the 20th century. Mr. Justice Burton, in the UK High Court, bluntly commented on Al Gore’s predicted 20ft sea-level rise as follows:“The Armageddon scenario that he depicts is not based on any scientific view.” Source: University of Colorado.

10
Arctic sea-ice extent has scarcely declined in the 29 years since 1980
Arctic sea ice (purple region) covered almost the same area of the Northern Hemisphere in mid-January 2009 as it had done 29 years previously in mid-January 1980. Except in Greenland, snow cover was not shown in 1980, but is shown (white) in 2009. Summer sea ice covered its least extent in 30 yearsduring the late summer of 2007. However, NASA has attributed that sudden decline to unusual poleward movements of heat transported by currents andwinds. The decline cannot have been caused by “global warming”, because, as the SPPI Global Temperature Index shows, there has been a cooling trendglobally during the past eight years. At almost the same moment as summer sea-ice extent reached its minimum in the Arctic, sea-ice extent in the Antarcticreached its maximum, though the latter event was very much less widely reported in the media than the former. Source: University of Illinois.

11
Antarctic sea-ice extent reached a 30-year peak in late 2007
No threat to penguins: The extent of Antarctic sea ice shows a gentle but definite uptrend over the past 30 years. The peak extent, which occurred late in2007, followed shortly after the sharp decline in Arctic sea ice in the late summer of that year. Source: University of Illinois, 2009.

12
The regular “heartbeat” of global sea-ice extent: steady for 30 years
Planetary “cardiogram”: There has been a very slight decline in the trend (red) of global sea-ice extent over the decade, chiefly attributable to loss of sea icein the Arctic during the summer, which was well below the mean in 2007, with some recovery in 2008. However, the 2009 peak sea-ice extent was exactly onthe 1979-2000 mean. The decline in summer sea-ice extent in the Arctic, reflected in the global anomalies over most of the past eight years, runs counter tothe global cooling trend over the same period, suggesting that the cause of the regional sea-ice loss cannot have been “global warming”. Seabed volcanicactivity recently reported in the Greenland/Iceland gap, with seabed temperatures of up to 574 °F, may have contributed to the loss of Arctic sea-ice. Source:University of Illinois.
13
Hurricane and tropical cyclone activity reached a new low in 2008
Hurricanes, typhoons, and other tropical cyclones have declined recently. Global activity of intense tropical storms is measured using a two-year runningsum, known as the Accumulated Cyclone Energy Index, whose least value in 30 years was recorded in October 2008. Source: ACE.

14
Your climate-sensitivity ready reckonerEvery month we spotlight a scientific issue in plain English. Here is a step-by-step ready-reckoner which will let youuse a pocket calculator to make your own instant estimate of global temperature change in response to CO2 increase.
STEP 1: Decide how far into the future you want your forecast to go, and estimate how much CO2 will be in the atmosphere atthat date. Example: Let us do a forecast to 2100. The Monthly CO2 Report charts show CO2 rising to C = 575 parts permillion by the end of the century, compared with B = 385 parts per million in late 2008.
STEP 2: Next, work out the proportionate increase C/B in CO2 concentration. In our example, C/B = 575/385 = 1.49.
STEP 3: Take the natural logarithm ln(C/B) of the proportionate increase. If you have a scientific calculator, find the naturallogarithm directly using the “ln” button. If not, look up the logarithm in the table below. In our example, ln 1.49 = 0.40.
n 1.05 1.10 1.15 1.20 1.25 1.30 1.35 1.40 1.45 1.50 1.55 1.60 1.65 1.70 1.75 1.80 1.85 1.90 1.95 2.00ln 0.05 0.10 0.14 0.18 0.22 0.26 0.30 0.34 0.37 0.41 0.44 0.47 0.50 0.53 0.56 0.59 0.62 0.64 0.67 0.69n 2.05 2.10 2.15 2.20 2.25 2.30 2.35 2.40 2.45 2.50 2.55 2.60 2.65 2.70 2.75 2.80 2.85 2.90 2.95 3.00
ln 0.72 0.74 0.77 0.79 0.81 0.83 0.85 0.88 0.90 0.92 0/94 0.96 0.97 0.99 1.01 1.03 1.05 1.06 1.08 1.10
STEP 4: Choose a climate sensitivity coefficient c from the table below –
Coefficient c ... SPPI minimum SPPI central SPPI maximum IPCC minimum IPCC central IPCC maximum
... for C° 0.7 1.4 2.1 2.9 4.7 6.5
... for F° 1.25 2.50 3.75 5.25 8.5 11.75
STEP 5: Find the temperature change ΔT by multiplying the natural logarithm of the proportionate increase in CO2
concentration by your climate sensitivity coefficient. In our example, we’ll chose the IPCC central estimate c = 8.5 F. Then –
ΔT = c ln(C/B) = 8.5 x 0.40 = 3.4 F°, your predicted manmade warming to 2100. It’s as simple as that!
SPPI Monthly CO2 Report : : Science FocusSpotlight on the changing science behind the changing climate

15
The Monthly CO2 Report summarizes key recent scientific papers, selected from those featured weekly at www.co2science.org, thatsignificantly add to our understanding of the climate question. This month we review papers about the effects of “global warming”on hurricanes, wildfires, sea-level rise, and permafrost. Our final paper gives evidence that the Middle Ages were warmer than today.
Thirty-Second Summary Recent increases in cyclone frequency are not caused by “global warming”. Human activities have led to a decrease in wildfires over the past 150 years. Sea level will not rise by more than 0.8 meters this century. The permafrost will not be thawing anytime soon. 657 scientists from 384 institutions in 40 countries on the co2science.org Medieval Warm Period database
say the Middle Ages were warmer than today.
Tropical Atlantic and Caribbean cyclones Chenoweth, M. and Divine, D. 2008. A document-based 318-year record of tropical cyclones in the Lesser Antilles, 1690-2007. Geochemistry, Geophysics,
Geosystems 9: 10.1029/2008GC002066.
From newspaper accounts, ships' logbooks, meteorological journals and other records, the authors reconstructed the history of tropical cyclonespassing through the 61.5 °W meridian between the coast of South America (~9.7 °N) and 25.0 °N from 1690-2007, “the longest and mostcomplete record for any area of the world.” The authors found “no evidence of statistically significant trend in the number of tropical cyclonespassing through the region on any timescale”, but “hurricane frequency is down about 20% in the 20th century compared to earlier centuries” and“this decline is consistent with the 20th-century observed record of decreasing hurricane landfall rates in the U.S. The authors’ results stronglysuggest that short-term increases in cyclone frequency appear to be nothing more than a simple recovery from a short-term dip (within a century-scale lull) in yearly cyclone numbers that had reduced them to their lowest frequency in three centuries. Recent increases in cyclone frequencyhave nothing to do with anthropogenic “global warming”.
SPPI Monthly CO2 Report : : New ScienceBREAKING NEWS IN THE JOURNALS, FROM www.co2science.org

16
“Global warming” and wildfires
Marlon, J.R., Bartlein, P.J., Carcaillet, C., Gavin, D.G., Harrison, S.P., Higuera, P.E., Joos, F., Power, M.J. and Prentice, I.C. 2008. Climate and human influences onglobal biomass burning over the past two millennia. Nature Geoscience 1: 697-702.
The authors say, “Large, well-documented wildfires have recently generated worldwide attention, and raised concerns about the impacts ofhumans and climate change on wildfire regimes.” To see what the global wildfire “range of natural variability” has actually been, they used“sedimentary charcoal records spanning six continents to document trends in both natural and anthropogenic biomass burning [over] the past twomillennia”. They report that “global biomass burning declined from AD 1 to ~1750, before rising sharply between 1750 and 1870”, after whichit “declined abruptly”. They say the initial long-term decline in global biomass burning was due to “a long-term global cooling trend”, while theysuggest that the rise in fires that followed was “linked to increasing human influences”. The authors say the decline in fires after 1870 occurred“despite increasing air temperatures and population.” They add that the “reduction in the amount of biomass burned over the past 150 years tothe global expansion of intensive grazing, agriculture and fire management”. Despite evidence from prior centuries that planet-wide warmingmay indeed have had a tendency to promote wildfires on a global basis (since global cooling had a tendency to reduce them), technologicaldevelopments during the industrial age appear to have overpowered this natural tendency: Man has become a dominant factor for good inleading to a decrease in global wildfires over the past 150 years.
Estimating 21st-century sea-level rise
Pfeffer, W.T., Harper, J.T. and O'Neel, S. 2008. Kinematic constraints on glacier contributions to 21st-Century sea-level rise. Science 321: 1340-1343.
In his testimony of 26 April 2007 before the U.S. House of Representatives’ Select Committee on Energy Independence and “Global Warming”,NASA's James Hansen said, “There is increasing realization that sea level rise this century may be measured in meters if we follow business-as-usual fossil fuel emissions.” But is this really so? The answer is important because, as Pfeffer et al. write in the introduction to their newanalysis, “underestimates will prompt inadequate preparation for change, [but] overestimates will exhaust and redirect resourcesinappropriately.”
The three U.S. researchers gave particular emphasis to Greenland in view of its supposed “vulnerability to ongoing Arctic warming andmeltwater-related feedbacks, recent accelerations of ice motion, and its large volume reductions during the last interglacial”, as well as toAntarctica. They used “a simple kinematic approach” that determined the velocities of their outlet glaciers that would be “required to achievevarious magnitudes of sea level rise by 2100". They concluded that “increases in excess of 2 meters are physically untenable”, noting that “atotal sea-level rise of about 2 meters by 2100 could occur under physically possible glaciological conditions but only if all variables are quicklyaccelerated to extremely high limits”, after which “more plausible but still accelerated conditions lead to total sea-level rise by 2100 of about 0.8

17
meters”. For comparison they indicate that the consensus estimate of the IPCC's most recent Fourth Assessment Report was a sea-level rise ofonly 0.18 to 0.59 meters by 2100. James Hansen and Al Gore are wrong to say sea level may rise by several meters this century.
How permanent is permafrost? Froese, D.G., Westgate, J.A., Reyes, A.V., Enkin, R.J. and Preece, S.J. 2008. Ancient permafrost and a future, warmer Arctic. Science 321: 1648.
Warming-induced thawing of peatland permafrost has been predicted to turn boreal and tundra biomes into major carbon sources, releasingmassive amounts of long-sequestered carbon to the atmosphere as CO2 and methane, possibly freeing enough of the two trace gases to rivaldirect anthropogenic emissions, considerably amplifying “global warming”. Froese et al. investigated relict ground ice within the discontinuouspermafrost zone of Canada's central Yukon Territory, where they found large vertically-foliated ice wedges within a few meters of the surfacethat were overlain by a volcanic ash layer (Gold Run tephra). Measurements provided “a weighted-mean age of 740,000 ± 60,000 years beforepresent”, consistent with “faunal ages associated with this bed and the normal magnetic polarity of the surrounding sediments”. Theirobservations indicate that “permafrost has survived within the discontinuous permafrost zone since at least the early-Middle Pleistocene”, notingthat “this age range includes several glacial-interglacial cycles ... considered to be longer and warmer than the present interglaciation”. They saytheir finding “highlights the resilience of permafrost to past warmer climate and suggests that permafrost and associated carbon reservoirs morethan a few meters below the surface may be more stable than previously thought”. The permafrost will not be thawing any time soon.
The Middle Ages were warmer than today: Columbia Icefield, Canadian Rockies, Canada
Edwards, T.W.D., Birks, S.J., Luckman, B.H. and MacDonald, G.M. 2008. Climatic and hydrologic variability during the past millennium in the eastern RockyMountains and northern Great Plains of western Canada. Quaternary Research 70: 188-197.
The authors developed a cellulose δ13C dendrochronology from cross-dated 10-yearincrements of 16 sub-fossil snags and living-tree ring sequences of Englemann spruce treesfrom upper-alpine treeline sites near Athabasca Glacier and subfossil material from theforefield of Robson Glacier plus living and snag material of whitebark pines adjacent toBennington Glacier, spanning the period AD 951-1990, as well as an oxygen isotope (δ18O)dendrochronology for the same period. Using pairs of data from these sources, theycalculated past changes in temperature over Canada's Columbia Icefield at 53°N, 118°W.They reported “evidence of previously unrecognized winter warmth during the MedievalClimate Anomaly (~AD 1100-1250)” –
Columbia Icefield mean winter temperature (Twin) relative to 1941-1990.
18
If you'd like to learn more about climate change science,request a speaker or have any questions,
contact Robert Ferguson, SPPI President.