global alternatives survey 2017 - willis towers watson€¦ · property sectors such as healthcare,...
TRANSCRIPT

July 2017
Global Alternatives Survey 2017
© 2017 Willis Towers Watson. All rights reserved. Proprietary and Confidential. For Willis Towers Watson and Willis Towers Watson client use only.
Including the top alternative asset manager rankings

Survey statistics
FoHF* Direct
Hedge
Funds*
Private
Equity FoF*
Direct
Private
Equity
Funds*
Real Estate
Strategies
Direct
Commodities
Funds
Direct
Infrastructure
Funds
Natural
Resources
Illiquid
Credit
Insurance
Linked
Investments
Total
USD billion
Top 100 total assets 227.7 674.6 492.1 695.0 1,427.7 21.5 161.2 - 359.9 - 4,059.7 10%
Top 100 Pension
Fund assets79.0 187.5 293.1 113.3 665.7 - 125.7 15.4 122.8 9.4 1,611.9 9%
Top 25 Insurance
Company assets6.7 - 28.1 - 237.2 - 30.7 - 163.6 - 466.3 32%
Top 25 Sovereign
Wealth Fund assets28.7 39.1 6.1 26.8 56.2 - 15.9 - 7.4 - 180.1 7%
Top 25 Endowment
& Foundation assets12.8 32.0 14.0 15.0 8.4 - - - 4.3 - 86.5 3%
Top 25 Fund of
Funds assets- 40.6 - 42.8 5.9 - 3.1 - 2.2 - 94.6 8%
Top 25 Wealth
Manager assets24.4 106.4 16.8 16.1 245.1 - 28.8 - 12.2 - 449.8 5%
Top 25 Bank assets 30.5 16.1 - - 28.1 - 5.9 - 17.3 - 97.9 6%
562 entries are included in the survey. The majority of the data (532 entries) comes directly from investment managers with the remainder coming from publicly available sources. This includes the Global Billion Dollar Club list, published by HedgeFund Intelligence.
Investor
Type
Manager
Type
* Figures for some of these managers were obtained from publicly available sources and using data derived from the Global Billion Dollar Club, published by HedgeFund Intelligence
© 2017 Willis Towers Watson. All rights reserved. Proprietary and Confidential. For Willis Towers Watson and Willis Towers Watson client use only. 2

Sections
Hedge Funds
Private Equity
Real Estate
Infrastructure
Commodities
Natural Resources
Illiquid Credit
Insurance-Linked Investments
© 2017 Willis Towers Watson. All rights reserved. Proprietary and Confidential. For Willis Towers Watson and Willis Towers Watson client use only. 3
Asset Class
Trends
Section I
The top 100 alternative asset managers
globally by total assets under management
(AuM)
Top 100
alternative
asset
managers by
AuM
Section II
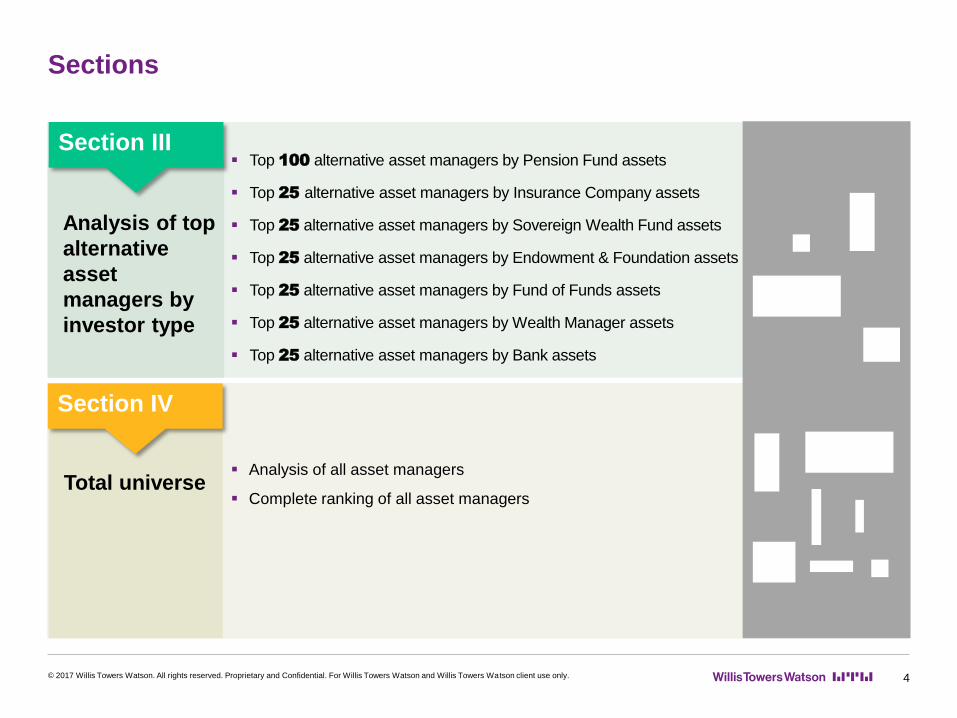
Sections
Top 100 alternative asset managers by Pension Fund assets
Top 25 alternative asset managers by Insurance Company assets
Top 25 alternative asset managers by Sovereign Wealth Fund assets
Top 25 alternative asset managers by Endowment & Foundation assets
Top 25 alternative asset managers by Fund of Funds assets
Top 25 alternative asset managers by Wealth Manager assets
Top 25 alternative asset managers by Bank assets
© 2017 Willis Towers Watson. All rights reserved. Proprietary and Confidential. For Willis Towers Watson and Willis Towers Watson client use only. 4
Analysis of top
alternative
asset
managers by
investor type
Section III
Analysis of all asset managers
Complete ranking of all asset managersTotal universe
Section IV

Asset Class Trends
Section 1
© 2017 Willis Towers Watson. All rights reserved. Proprietary and Confidential. For Willis Towers Watson and Willis Towers Watson client use only.
Hedge Funds - Key Trends
© 2017 Willis Towers Watson. All rights reserved. Proprietary and Confidential. For Willis Towers Watson and Willis Towers Watson client use only. 6
Asset Class Trends
The evolving HF landscape
Recent returns have been disappointing leading to a greater focus by investors on differentiated higher return mandates and value for
money. Facilitating this effort is the recognition that “hedge funds” are not an asset class. Designing a mandate that concentrates on
capturing a manager’s competitive advantage is becoming a popular way for investors to try and move up the return/risk spectrum.
There are also diversifying return drivers that are best sourced outside of the traditional hedge fund structure and for fees that are
much lower – commonly referred to as alternative beta strategies and include strategies such as reinsurance, trend, carry, value, and
merger arbitrage.
However, given the rapid growth in this emerging space, there is some risk of crowding, and investors who don’t fully understand the
risks of investing here should work with an advisor or outsource. This is especially important among the quantitative and factor-based
strategies, many of which carry left-tail risks and are managed using an antiquated or less differentiated approach.
Further, while they are called alternative “beta” strategies, there usually is some element of manager skill necessary despite the
mechanical approach to implementation – for instance in screening, sourcing, modelling, risk management and execution. In terms of
alpha seeking managers - that bar is high but there are definitely good opportunities for skillful managers to prove they can add both
diversity and incremental returns.
Future outlook
While there have been performance headwinds for some hedge fund strategies, the need for diversity away from traditional equities
and credit markets continues to be important. Hedge funds and alternative beta strategies are uniquely equipped to deliver returns
while helping investors mitigate downside risks.
While we anticipate that some capital will be withdrawn from the industry, especially the hedge fund of funds industry given the high
fees traditionally charged by these organizations, overall we continue to see value to be had if done correctly and when the fees and
expenses represent a fair split of the value added by the hedge fund manager. Industry wide, we anticipate continued growth in
alternative beta strategies and assets, but would also expect more traditional hedge fund managers willing to offer better customized
solutions at more reasonable fees to attract and retain more long-term institutional capital.
Private Equity - Key Trends
© 2017 Willis Towers Watson. All rights reserved. Proprietary and Confidential. For Willis Towers Watson and Willis Towers Watson client use only. 7
The evolving private equity landscape
Last year we noted that fundraising had been buoyant because of strong distributions and with investors looking for alpha after other
asset classes struggled to deliver. This story remains the same with investors flocking to private equity and the largest managers
being the greatest beneficiaries. Similar to previous years, with inexpensive debt packages that have little in the way of covenants
and increasing competition from trade buyers, pricing increased again and is on par with levels not seen since right before the last
financial crisis. It is very much a sellers’ market though we note there was a drop in the number of deals done last year suggesting
we are seeing some price discipline by participants and some weariness of transacting brought on by political events such as Brexit.
One recent development that has gained popularity is subscription line financing. With cheap and abundantly available credit, private
equity managers are extending the timeframe in which they use subscription line financing to purchase assets. While these have the
benefit of delivering higher IRRs on investments, interest expense can add up over time and there is high systematic risk if the fund
and markets fall at once and investors cannot repay the subscription line if called. The SEC is looking closer at these lines from a
regulatory standpoint.
The secondary market stabilized last year and continues to be a sellers’ one as seen with increasing pricing and buyers of secondary
interests raising funds easily.
Future outlook
In the short-term, we expect returns in the upper end of the market to decrease as pricing is incredibly rich and there are too many
deals that have been priced and levered to perfection to withstand a downturn. We also would expect managers to find ways of
adding value after purchase through “buy-and-build” strategies and focusing on operational improvements to justify lofty purchase
price multiples. We would not be surprised to see more managers look to offer longer terms funds as a way to navigate the current
market and as we noted last year we are seeing asset owners doing deals themselves and dis-intermediating private equity
managers and we expect that trend to continue. In the long term, the secondary market will mature thus making the asset class more
transactional and less relationship based, and the largest private equity managers will finish their transformation into full fledge asset
management firms.
Asset Class Trends

Real Estate - Key Trends
© 2017 Willis Towers Watson. All rights reserved. Proprietary and Confidential. For Willis Towers Watson and Willis Towers Watson client use only. 8
Asset Class Trends
The evolving real estate landscape
Real estate markets have cooled in many markets around the world. In the US rising rate expectations and an increasingly narrow
property yield gap versus government bonds have subdued returns relative to previous years. Property fundamentals in Canada have been
relatively weak especially in the more commodity driven regions. In Europe, the UK’s EU referendum and various elections in European
countries have increased macro and political concerns. However, in Europe, despite some rising inflation expectations, bond yields have
remained low which has provided support for real estate with a stable lease profile. In Australia commercial real estate has been a
reasonably strong performer on the back of declining bond yields and robust property fundamentals.
Listed property companies in aggregate broadly trade at long run average levels relative to book value. However, there are some notable
exceptions such as the UK, where the listed market appears to be more pessimistic relative to the unlisted market around potential Brexit-
impacts and continental Europe where stocks trade at premiums. One particular dynamic worth noting is the large underperformance from
US retail stocks this year driven by a weak occupier market from retailers, in particular department stores, in light of continued online
retailing challenges and the consequential scaling back of stores.
Long lease property strategies in Europe have continued to see interest from de-risking pension funds given the expected return differential
relative to bonds and the higher inflation expectations. In many regions around the world we are seeing growing interest in alternative
property sectors such as healthcare, storage, student assets or the Private Rented Sector (PRS) in the UK. Strategically, the addition of
these alternative sectors generally helps diversify against the cyclicality of offices which can often be a disproportional contributor to risk in
portfolios.
Future outlook
We continue to believe that, despite real estate in many regions looking attractive relative to bonds, investors should be patient and
selective when investing new real estate allocations at the current time. We believe US and UK markets are at higher points in their real
estate cycles, meaning one needs to be increasingly cautious of higher risk property strategies, particularly those using high levels of debt.
The continental European market appears further away from peak cycle. Despite its economic issues, with low interest rates, property
looks reasonably supported as long as prolonged deflation can be avoided.
We believe future demand for long lease property strategy is likely to persist as long as bond yields remain low. The ability to source
attractive assets however is becoming more difficult and so subscription queues for such strategies are likely to remain long.
We expect greater defensiveness from certain property sectors more aligned with thematic tailwinds such as student assets (growing
emerging market wealth), property healthcare (demographics), logistics (e-commerce) and residential/storage (urbanization).

Infrastructure - Key Trends
© 2017 Willis Towers Watson. All rights reserved. Proprietary and Confidential. For Willis Towers Watson and Willis Towers Watson client use only. 9
Asset Class Trends
The evolving infrastructure landscape
Deployment by institutional investors into the infrastructure asset class has increased again, in fact 2016 saw a number of records set
in the unlisted infrastructure fundraising industry. There is also a record number of funds in the market now seeking capital. However,
we see some decline in the number of funds managing to reach a final close annually. There is an ongoing trend of capital
concentration, with large funds raising larger funds than before. A significant number of funds who were among the early closed-
ended fund offerings are reaching the end of their lives and are finding that the future looks uncertain. This is driving activity around
extensions, stapled offerings, etc.
The number of deals completed in 2016 has remained similar to recent years, while aggregate capital invested in 2016 increased.
Strong fundraising environment together with increased level of dry powder and increased availability of debt as well as increased
demand from investors have led to increasing competition which has driven up the price of infrastructure assets globally. It is
becoming more challenging to find and source assets at attractive valuations now than it was 12 months ago. Plus the average size
of infrastructure deals increased as well which adds to the challenge. This situation also impacts the terms of the funds being raised,
in particular large funds, and we see the terms becoming less aligned with investors in the funds. Some large asset owners and
institutional investors are looking to invest directly in infrastructure by forming club deals and JVs which allows them to structure it in
a more cost-efficient way and have more control over the strategy. In some countries, like Australia, we see the government being
more proactive in attempting to encourage institutional investors to invest in infrastructure.
Future outlook
The increased institutional investor interest in infrastructure investments has both cyclical and structural aspects. Cyclically investors
are facing an uncertain economic outlook and are seeking opportunities to diversify risks and return drivers. Structurally almost all
institutions are either not yet invested in infrastructure or are below their target allocation. Despite the headlines which suggest that
investor demand is outpacing supply and therefore driving up asset prices, the reality is that the requirement for private investment in
infrastructure is immense in all geographic regions.
We will continue to see managers develop in order to capture these opportunities through more engagement with stakeholders
(governments, regulators, communities), possibly more specialisation and definitely a higher appreciation of the asset management
skills required to manage the risks inherent in an infrastructure portfolio. We will also continue to see the range of implementation
options for investors increase beyond the traditional private equity-like pooled fund model and the in-house direct investment model.

Commodities - Key Trends
© 2017 Willis Towers Watson. All rights reserved. Proprietary and Confidential. For Willis Towers Watson and Willis Towers Watson client use only. 10
Asset Class Trends
The evolving commodities landscape
Although investors do still seek commodity exposure within their diversifying portfolios, the asset class has been de-emphasised
relative to its heightened popularity in the early 2000s when strong performance attracted investors into the space. While we do not
encourage investors to chase returns, it remains that commodities face an uncertain outlook over the coming years and this is being
reflected in investor preference.
Future outlook
Our medium-term view on commodities remains neutral. Our outlook is primarily driven by energy, due to its high weighting in the
major commodities indices, DJ UBS and S&P GSC. Commodities are expected to broadly benefit from rising prices in 2017 after
many cycle-lows in 2016.
A few trends may influence the shape of oil market globally: OPEC member compliance, the strength and pace of the US shale
patch’s rebound and the persistence of global demand on growth. Base metals are expected to gain from a more active global
economy and rising manufacturing activities. Copper saw a positive outlook adjustment as stronger-than-anticipated Chinese
demand outpaces weaker supply growth. Zinc remains the metal with strong supporting fundamentals. The outlook for gold is slightly
weaker on the back of a stronger macroeconomic outlook, rising inflation and interest rate expectations and muted market response
to political uncertainty.
Natural Resources - Key Trends
© 2017 Willis Towers Watson. All rights reserved. Proprietary and Confidential. For Willis Towers Watson and Willis Towers Watson client use only. 11
Asset Class Trends
The evolving natural resources landscape
Natural resources are experiencing increased investor interest for their diversification benefits and strong links to various thematic
trends (e.g. growing global population, changing demographic, changing dietary requirements, etc.) in a world where the economic
outlook is mostly uninspiring. New managers and strategies continue to appear on a regular basis. In agriculture, substantial
allocations have been made by a range of institutional investors. Managers are beginning to look beyond land-only strategies to also
focus on how supply chain initiatives can help boost returns and dampen volatility.
We have also seen the appearance of a few water strategies which is a popular theme with investors. However, the global
opportunity set is still small compared to other areas. The timberland market seems to have flattened somewhat which may not be
surprising given that it is the most mature area of real assets and we still expect to see some correction in valuations in US
timberland. And finally, there are a large number of managers seeking to exploit the opportunity in the mining sector caused by the
lack of access to traditional sources of finance, banks and the public equity markets.
Future outlook
Investments by institutional investors in natural resources are still at a very nascent stage despite the ever increasing amount of
interest. In terms of investors appetite, energy is still a preferred strategy followed by timberland, metals & mining, agriculture and
water. As the asset class matures, we expect it to follow the trajectories of the real estate and infrastructure sectors. We are seeing a
wider range of strategies, vehicles and alignment structures being introduced into the market. This is a natural part of the
development of the asset class and should enable more institutions to find implementation routes which suit them.
In the key agricultural markets of the US and Brazil, dampening prices and a more attractive entry level from a currency perspective
could drive an uptick in interest in those two regions respectively. There are also some discussions about potential change in the
Brazilian law which is currently quite restrictive in terms of the foreign ownership of land. If the new law is approved then it may
trigger additional interest from foreign investors. However, in the short term the pressure on US farmland prices seems to be causing
a certain amount of nervousness in the market. Timberland managers will continue to develop their capabilities outside of the US
which will enable investors to access an opportunity set which is at a more interesting stage of development than the one in the US.
We are likely to continue to see new strategies emerge which are related to water and other environmental, or sustainability and
technology themes.

Illiquid Credit & Insurance-Linked Investments - Key Trends
© 2017 Willis Towers Watson. All rights reserved. Proprietary and Confidential. For Willis Towers Watson and Willis Towers Watson client use only. 12
The evolving illiquid credit landscape
The illiquid credit category is inclusive of all closed-end funds with a predominant focus on credit, with the most common being
private debt (e.g. direct lending, commercial real estate debt, mezzanine, etc.) and distressed debt.
The key trend has been the continued growth of the institutional lending landscape, with numerous new funds being raised globally,
and increasing interest in private debt strategies by investors globally. We expect this trend to continue. Investor appetite also
continues apace as investors consider taking on both greater illiquidity and risk in their credit portfolios to compensate for lower yields
in public markets. Additionally, investors appear ever more comfortable allocating to specialist strategies, recognizing that the private
debt space is becoming a much more varied marketplace.
There are some concerns that as competition has increased in some markets that yields are not always offering sufficient
compensation for the illiquidity and risk being assumed, so we would urge caution when reviewing private debt strategies today.
Future outlook
We expect that demand for private debt strategies will remain high, particularly for those asset classes offering floating rate yields.
Some asset classes will, however, become less attractive as ever more institutional capital flows into the asset class. We would also
expect that more specialist strategies will attract greater interest.
Asset Class Trends
The evolving insurance-linked investments landscape
Insurance-Linked Investments (ILI) are seen as great diversifiers for institutional investors’ portfolios. The greater acceptance of ILI by
pension funds in particular has led to increasing inflows into the asset class over recent years.
Future outlook
The premiums for catastrophe reinsurance have been coming down in recent years. This has been a result of not just the inflow of
institutional capital, but moreover as a result of the limited natural catastrophe losses in recent years which has led to reinsurance
companies having stronger balance sheets and having less need to transfer certain risks as a result.

Willis Towers Watson / Financial Times Top 100
Alternative Asset Managers by Total AuM
Section 2
How to read this section
This section shows the top 100 managers ranked by total AuM. Each manager is counted separately in each
individual asset class, so they may appear multiple times if their AuM are large in more than one asset class.
These top 100 are analysed in relation to the regions they invest in and in relation to assets managed by
investor type.
© 2017 Willis Towers Watson. All rights reserved. Proprietary and Confidential. For Willis Towers Watson and Willis Towers Watson client use only.
Top 100 Alternative Asset Managers
Executive summary
© 2017 Willis Towers Watson. All rights reserved. Proprietary and Confidential. For Willis Towers Watson and Willis Towers Watson client use only. 14
The top 100 alternative asset managers, ranked by total AuM, managed
USD 4,059.7 bn on behalf of their investors in 2016 compared to USD 3,676.3 bn in 2015, a 10%
increase.
The largest block of alternative assets is managed in Real Estate Strategies followed by Direct Private
Equity Funds, Direct Hedge Funds, Private Equity Funds of Funds, Illiquid Credit, Funds of Hedge
Funds, Direct Infrastructure Funds and Direct Commodities Funds. There were no Natural Resources
or Insurance-Linked Investments Fund managers among the top 100 ranking by total AuM.
Pension Funds are the largest investors in alternative assets (33%) among the top 100 alternative
asset managers, followed by Wealth Managers, Insurance Companies, Sovereign Wealth Funds,
Endowments and Foundations, Banks and Fund of Funds.
In terms of where the assets are invested, North America (51%) accounts for the largest amount of
alternative assets, followed by Europe (32%) and Asia Pacific (7%).
Top 100 Alternative Asset Managers
Top 100 Alternative Asset Managers
© 2017 Willis Towers Watson. All rights reserved. Proprietary and Confidential. For Willis Towers Watson and Willis Towers Watson client use only. 15
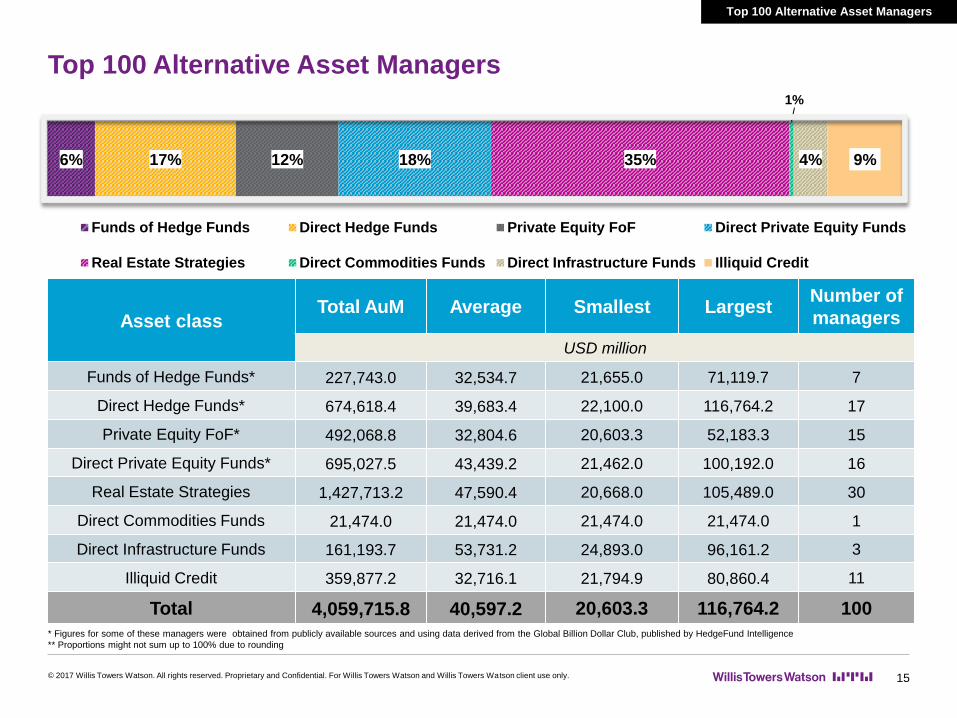
6% 17% 12% 18% 35%
1%
4% 9%
Funds of Hedge Funds Direct Hedge Funds Private Equity FoF Direct Private Equity Funds
Real Estate Strategies Direct Commodities Funds Direct Infrastructure Funds Illiquid Credit
Asset classTotal AuM Average Smallest Largest
Number of
managers
USD million
Funds of Hedge Funds* 227,743.0 32,534.7 21,655.0 71,119.7 7
Direct Hedge Funds* 674,618.4 39,683.4 22,100.0 116,764.2 17
Private Equity FoF* 492,068.8 32,804.6 20,603.3 52,183.3 15
Direct Private Equity Funds* 695,027.5 43,439.2 21,462.0 100,192.0 16
Real Estate Strategies 1,427,713.2 47,590.4 20,668.0 105,489.0 30
Direct Commodities Funds 21,474.0 21,474.0 21,474.0 21,474.0 1
Direct Infrastructure Funds 161,193.7 53,731.2 24,893.0 96,161.2 3
Illiquid Credit 359,877.2 32,716.1 21,794.9 80,860.4 11
Total 4,059,715.8 40,597.2 20,603.3 116,764.2 100
Top 100 Alternative Asset Managers
* Figures for some of these managers were obtained from publicly available sources and using data derived from the Global Billion Dollar Club, published by HedgeFund Intelligence
** Proportions might not sum up to 100% due to rounding

Distribution by Investor Type
Top 100 Alternative Asset Managers
© 2017 Willis Towers Watson. All rights reserved. Proprietary and Confidential. For Willis Towers Watson and Willis Towers Watson client use only. 16
Asset classTotal assets Average Smallest Largest
Number of
managers
USD million
Pension Fund 1,330,810.3 17,744.1 591.0 90,512.7 75
Insurance Company 500,493.3 7,253.5 130.7 71,371.9 69
Sovereign Wealth Fund 221,332.2 3,628.4 0.1 23,310.2 61
Endowment and Foundation 94,941.1 1,356.3 1.0 10,898.0 70
Fund of Funds 75,859.0 2,107.2 25.5 10,200.0 36
Wealth Manager 77,819.2 1,809.7 49.0 19,104.0 43
Bank 612,595.8 9,281.8 40.0 35,215.0 66
* The category “Other” has been included for assets that could not be allocated into the survey’s categories, it has not been analysed in detail.
** Proportions might not sum up to 100% due to rounding
33% 12% 5%
2% 2%
15%
2%
28%
Pension Fund Insurance Company Sovereign Wealth Fund
Endowment and Foundation Fund of Funds Wealth Manager
Bank Other
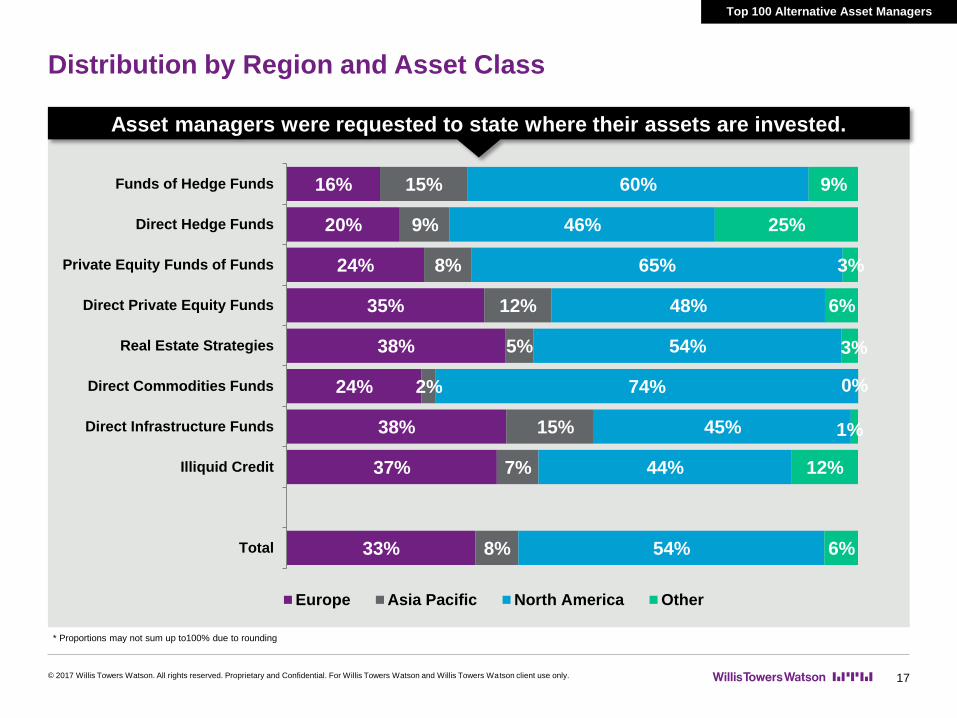
Distribution by Region and Asset Class
© 2017 Willis Towers Watson. All rights reserved. Proprietary and Confidential. For Willis Towers Watson and Willis Towers Watson client use only. 17
33%
37%
38%
24%
38%
35%
24%
20%
16%
8%
7%
15%
2%
5%
12%
8%
9%
15%
54%
44%
45%
74%
54%
48%
65%
46%
60%
6%
12%
1%
0%
3%
6%
3%
25%
9%
Total
Illiquid Credit
Direct Infrastructure Funds
Direct Commodities Funds
Real Estate Strategies
Direct Private Equity Funds
Private Equity Funds of Funds
Direct Hedge Funds
Funds of Hedge Funds
Europe Asia Pacific North America Other
* Proportions may not sum up to100% due to rounding
Top 100 Alternative Asset Managers
Asset managers were requested to state where their assets are invested.

Comparison 2015 – 2016
© 2017 Willis Towers Watson. All rights reserved. Proprietary and Confidential. For Willis Towers Watson and Willis Towers Watson client use only. 18
Includes only managers who participated in both years
Total assets for the top 100 alternative asset managers increased from USD 3,545.8 bn in 2015 to
USD 3,882.2 bn in 2016 (9%)
The split by asset class is broadly similar to last year with slight increases in Private Equity FoF, Direct
Commodities Funds and Illiquid Credit.
There are 96 managers in the top 100 that also participated in 2015.
6%
6%
17%
17%
12%
13%
18%
18%
36%
36%
<1%
1%
5%
6%
2015
2016
Funds of Hedge Funds Direct Hedge Funds Private Equity FoF
Direct Private Equity Funds Real Estate Strategies Direct Commodities Funds
Illiquid Credit
Top 100 Alternative Asset Managers
* Proportions might not sum up to 100% due to rounding

Comparison 2015 – 2016
© 2017 Willis Towers Watson. All rights reserved. Proprietary and Confidential. For Willis Towers Watson and Willis Towers Watson client use only. 19
Includes only managers who participated in both years
Funds of Hedge Funds assets account for 6% of all assets managed by the top 100 managers.
There are 7 Funds of Hedge Funds managers in the top 100 ranking
Funds of Hedge
Funds
There are 17 Direct Hedge Fund managers in the top 100 ranking. The proportion of Direct Hedge Fund assets in the top 100 remained steady at 17% in 2016
Direct Hedge Funds
The proportion of Private Equity Funds of Funds AuM slightly increased to 13% in 2016, up
from 12% in 2015
The are 15 Private Equity Funds of Funds managers in the top 100 ranking.
Private Equity Funds
of Funds
There are 16 Direct Private Equity managers in the top 100 ranking.
Direct Private Equity assets increased by 9% from 2015 to 2016 but its proportion remained
steady at 18%.
Direct Private Equity
Funds
There are 29 Real Estate Strategies managers in the top 100 ranking, more than any other asset class.
Real Estate Strategies remains the largest asset class with 36% of all assets managed by the top 100 asset managers.
Real Estate Strategies
There are 3 Direct Infrastructure managers in the top 100 ranking.
Assets proportion in the top 100 remained unchanged at 4%
Direct Infrastructure
Funds
There are 8 Illiquid Credit managers in the top 100 ranking.
Assets increased by 15% from 2015 to 2016.Illiquid Credit
Top 100 Alternative Asset Managers
Top 100 ranking ranked by Total AuM
© 2017 Willis Towers Watson. All rights reserved. Proprietary and Confidential. For Willis Towers Watson and Willis Towers Watson client use only. 20
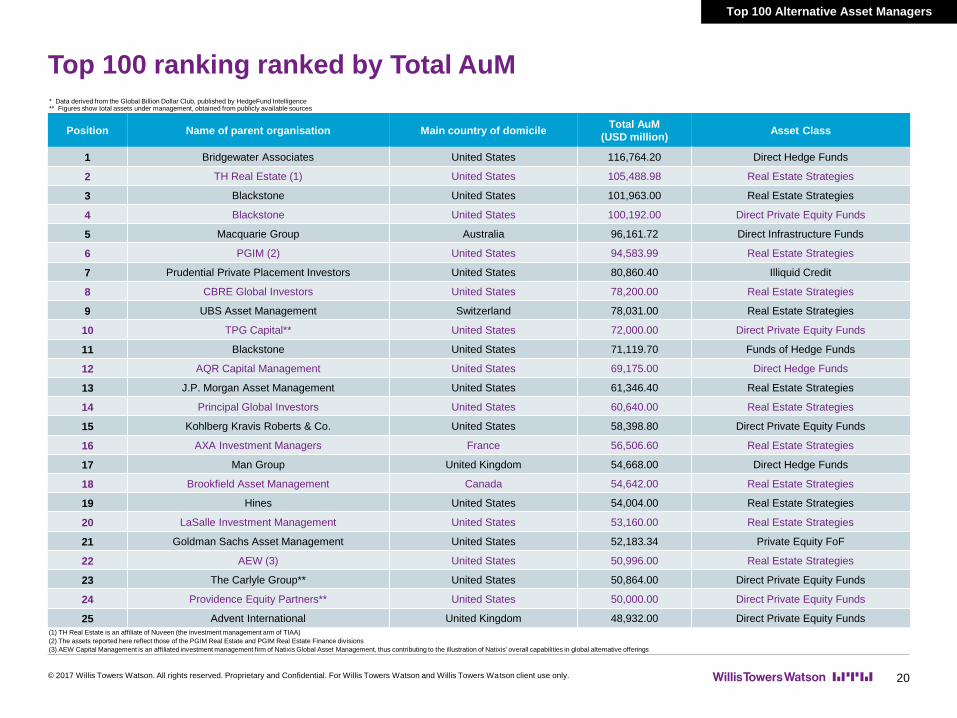
Position Name of parent organisation Main country of domicileTotal AuM
(USD million)Asset Class
1 Bridgewater Associates United States 116,764.20 Direct Hedge Funds
2 TH Real Estate (1) United States 105,488.98 Real Estate Strategies
3 Blackstone United States 101,963.00 Real Estate Strategies
4 Blackstone United States 100,192.00 Direct Private Equity Funds
5 Macquarie Group Australia 96,161.72 Direct Infrastructure Funds
6 PGIM (2) United States 94,583.99 Real Estate Strategies
7 Prudential Private Placement Investors United States 80,860.40 Illiquid Credit
8 CBRE Global Investors United States 78,200.00 Real Estate Strategies
9 UBS Asset Management Switzerland 78,031.00 Real Estate Strategies
10 TPG Capital** United States 72,000.00 Direct Private Equity Funds
11 Blackstone United States 71,119.70 Funds of Hedge Funds
12 AQR Capital Management United States 69,175.00 Direct Hedge Funds
13 J.P. Morgan Asset Management United States 61,346.40 Real Estate Strategies
14 Principal Global Investors United States 60,640.00 Real Estate Strategies
15 Kohlberg Kravis Roberts & Co. United States 58,398.80 Direct Private Equity Funds
16 AXA Investment Managers France 56,506.60 Real Estate Strategies
17 Man Group United Kingdom 54,668.00 Direct Hedge Funds
18 Brookfield Asset Management Canada 54,642.00 Real Estate Strategies
19 Hines United States 54,004.00 Real Estate Strategies
20 LaSalle Investment Management United States 53,160.00 Real Estate Strategies
21 Goldman Sachs Asset Management United States 52,183.34 Private Equity FoF
22 AEW (3) United States 50,996.00 Real Estate Strategies
23 The Carlyle Group** United States 50,864.00 Direct Private Equity Funds
24 Providence Equity Partners** United States 50,000.00 Direct Private Equity Funds
25 Advent International United Kingdom 48,932.00 Direct Private Equity Funds
Top 100 Alternative Asset Managers
* Data derived from the Global Billion Dollar Club, published by HedgeFund Intelligence** Figures show total assets under management, obtained from publicly available sources
(2) The assets reported here reflect those of the PGIM Real Estate and PGIM Real Estate Finance divisions
(3) AEW Capital Management is an affiliated investment management firm of Natixis Global Asset Management, thus contributing to the illustration of Natixis' overall capabilities in global alternative offerings
(1) TH Real Estate is an affiliate of Nuveen (the investment management arm of TIAA)

Top 100 ranking ranked by Total AuM
© 2017 Willis Towers Watson. All rights reserved. Proprietary and Confidential. For Willis Towers Watson and Willis Towers Watson client use only. 21
Position Name of parent organisation Main country of domicileTotal AuM
(USD million)Asset Class
26 HarbourVest Partners United States 47,333.00 Private Equity FoF
27 Aviva Investors United Kingdom 46,249.00 Real Estate Strategies
28 Deutsche Asset Management Germany 46,193.00 Real Estate Strategies
29 J. P. Morgan Asset Management* United States 45,000.00 Direct Hedge Funds
30 Barings United Kingdom 44,824.94 Real Estate Strategies
31 Pathway Capital Management United States 44,636.00 Private Equity FoF
32 Warburg Pincus** United States 44,000.00 Direct Private Equity Funds
33 Apollo Global Management United States 43,628.00 Direct Private Equity Funds
34 Credit Suisse Asset Management Switzerland 43,199.82 Real Estate Strategies
35 AlpInvest Partners Netherlands 41,434.00 Private Equity FoF
36 Hamilton Lane Advisors United States 40,366.80 Private Equity FoF
37 Brookfield Asset Management Canada 40,139.00 Direct Infrastructure Funds
38 Cohen & Steers Capital Management United States 38,920.00 Real Estate Strategies
39 Renaissance Technologies United States 38,795.20 Direct Hedge Funds
40 Union Investment Germany 36,494.35 Real Estate Strategies
41 Ardian France 35,715.00 Private Equity FoF
42 Pantheon United Kingdom 35,190.00 Private Equity FoF
43 Goldman Sachs Merchant Banking Division United States 35,100.00 Direct Private Equity Funds
44 M&G Investments United Kingdom 34,838.20 Real Estate Strategies
45 Millennium Management United States 34,090.00 Direct Hedge Funds
46 BlackRock United States 33,804.00 Direct Hedge Funds
47 Och-Ziff Capital Management Group United States 33,700.00 Direct Hedge Funds
48 UBS Asset Management Switzerland 33,630.00 Funds of Hedge Funds
49 Two Sigma Advisers United States 33,300.00 Direct Hedge Funds
50 Permira United Kingdom 32,942.00 Direct Private Equity Funds
Top 100 Alternative Asset Managers
* Data derived from the Global Billion Dollar Club, published by HedgeFund Intelligence** Figures show total assets under management, obtained from publicly available sources

Top 100 ranking ranked by Total AuM
© 2017 Willis Towers Watson. All rights reserved. Proprietary and Confidential. For Willis Towers Watson and Willis Towers Watson client use only. 22
Position Name of parent organisation Main country of domicileTotal AuM
(USD million)Asset Class
51 Vista Equity Partners** United States 32,374.42 Direct Private Equity Funds
52 Bain Capital Private Equity United States 32,200.00 Direct Private Equity Funds
53 Elliot Management* United States 31,800.00 Direct Hedge Funds
54 Alcentra United Kingdom 31,374.50 Illiquid Credit
55 Baupost Group* United States 30,300.00 Direct Hedge Funds
56 Bentall Kennedy Canada 30,269.00 Real Estate Strategies
57 M&G Investments United Kingdom 30,019.48 Illiquid Credit
58 Nuveen (1) United States 29,936.37 Illiquid Credit
59 Prologis United States 29,753.20 Real Estate Strategies
60 Neuberger Berman United States 29,194.10 Private Equity FoF
61 AXA Investment Managers France 28,824.38 Illiquid Credit
62 Heitman United States 28,811.00 Real Estate Strategies
63 Goldman Sachs Merchant Banking Division United States 28,800.00 Illiquid Credit
64 Barings United Kingdom 28,735.00 Illiquid Credit
65 Clarion Partners United States 28,565.00 Real Estate Strategies
66 Invesco United States 28,090.00 Real Estate Strategies
67 Goldman Sachs Asset Management United States 27,952.00 Funds of Hedge Funds
68 D. E. Shaw Group United States 27,852.00 Direct Hedge Funds
69 Oaktree Capital Management United States 27,788.29 Illiquid Credit
70 Adage Capital Management* United States 27,700.00 Direct Hedge Funds
71 Lexington Partners** United States 27,467.91 Private Equity FoF
72 LGT Capital Partners Switzerland 27,090.53 Private Equity FoF
73 Davidson Kempner Capital Management* United States 26,500.00 Direct Hedge Funds
74 Morgan Stanley Investment Management United States 26,424.00 Real Estate Strategies
75 Citadel (2) United States 26,200.00 Direct Hedge Funds
Top 100 Alternative Asset Managers
* Data derived from the Global Billion Dollar Club, published by HedgeFund Intelligence** Figures show total assets under management, obtained from publicly available sources
(2) Citadel total AuM is as of 1/1/2017
(1) Nuveen is the investment management arm of TIAA

Top 100 ranking ranked by Total AuM
© 2017 Willis Towers Watson. All rights reserved. Proprietary and Confidential. For Willis Towers Watson and Willis Towers Watson client use only. 23
Position Name of parent organisation Main country of domicileTotal AuM
(USD million)Asset Class
76 HPS Investment Partners United States 26,070.88 Illiquid Credit
77 GCM Grosvenor United States 25,886.30 Funds of Hedge Funds
78 GSO Capital Partners United States 25,673.00 Illiquid Credit
79 Hellman & Friedman** United States 25,430.30 Direct Private Equity Funds
80 BNP Paribas REIM France 25,267.00 Real Estate Strategies
81 EnTrustPermal* United States 25,200.00 Funds of Hedge Funds
82 IFM Investors Australia 24,893.00 Direct Infrastructure Funds
83 J.P. Morgan Asset Management – Private Equity United States 24,463.00 Private Equity FoF
84 Aberdeen Asset Management United Kingdom 24,154.19 Real Estate Strategies
85 Silver Lake** United States 24,000.00 Direct Private Equity Funds
86 Legal & General United Kingdom 23,750.00 Real Estate Strategies
87 Leonard Green** United States 23,503.99 Direct Private Equity Funds
88 Mashall Wace* United Kingdom 22,870.00 Direct Hedge Funds
89 GCM Grosvenor United States 22,744.60 Private Equity FoF
90 Adams Street Partners United States 22,618.25 Private Equity FoF
91 Morgan Stanley Investment Management United States 22,300.00 Funds of Hedge Funds
92 Farallon Capital Management* United States 22,100.00 Direct Hedge Funds
93 Oak Hill Advisors United States 21,794.90 Illiquid Credit
94 Starwood Capital Group United States 21,680.51 Real Estate Strategies
95 BlackRock United States 21,655.00 Funds of Hedge Funds
96 BlackRock United States 21,474.00 Direct Commodities Funds
97 Riverstone Holdings United States 21,462.00 Direct Private Equity Funds
98 Coller Capital United Kingdom 21,029.00 Private Equity FoF
99 Standard Life Investments United Kingdom 20,668.00 Real Estate Strategies
100 Partners Group Switzerland 20,603.30 Private Equity FoF
Total 4,059,715.84
Top 100 Alternative Asset Managers
* Data derived from the Global Billion Dollar Club, published by HedgeFund Intelligence** Figures show total assets under management, obtained from publicly available sources

Top 100 Alternative Asset Managers by
Pension Fund Assets
Section 3.A
© 2017 Willis Towers Watson. All rights reserved. Proprietary and Confidential. For Willis Towers Watson and Willis Towers Watson client use only.
Executive summary
© 2017 Willis Towers Watson. All rights reserved. Proprietary and Confidential. For Willis Towers Watson and Willis Towers Watson client use only. 25
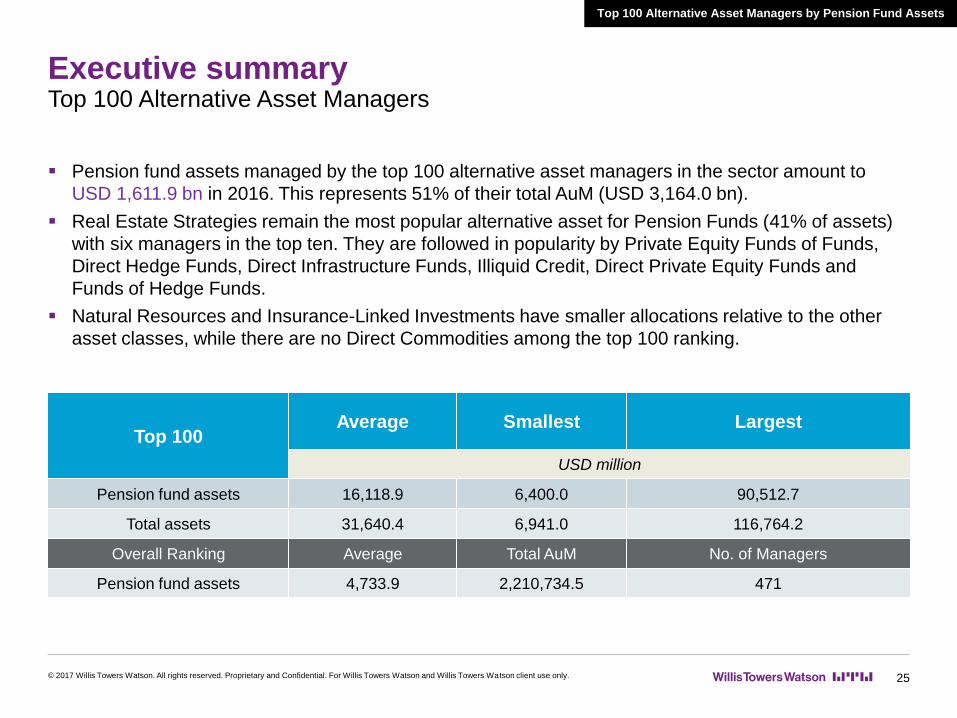
Top 100 Alternative Asset Managers
Pension fund assets managed by the top 100 alternative asset managers in the sector amount to
USD 1,611.9 bn in 2016. This represents 51% of their total AuM (USD 3,164.0 bn).
Real Estate Strategies remain the most popular alternative asset for Pension Funds (41% of assets)
with six managers in the top ten. They are followed in popularity by Private Equity Funds of Funds,
Direct Hedge Funds, Direct Infrastructure Funds, Illiquid Credit, Direct Private Equity Funds and
Funds of Hedge Funds.
Natural Resources and Insurance-Linked Investments have smaller allocations relative to the other
asset classes, while there are no Direct Commodities among the top 100 ranking.
Top 100 Alternative Asset Managers by Pension Fund Assets
Top 100Average Smallest Largest
USD million
Pension fund assets 16,118.9 6,400.0 90,512.7
Total assets 31,640.4 6,941.0 116,764.2
Overall Ranking Average Total AuM No. of Managers
Pension fund assets 4,733.9 2,210,734.5 471

5% 12% 18% 7% 41% 8%
1%
8%
1%
Funds of Hedge Funds Direct Hedge Funds Private Equity Funds of Funds
Direct Private Equity Funds Real Estate Strategies Direct Infrastructure Funds
Natural Resources Illiquid Credit Insurance-Linked Investments
© 2017 Willis Towers Watson. All rights reserved. Proprietary and Confidential. For Willis Towers Watson and Willis Towers Watson client use only.
Distribution by Asset Class
* Proportions might not sum up to 100% due to rounding
Top 100 Alternative Asset Managers by Pension Fund Assets
26
Asset classTotal AuM Average Smallest Largest
Number of
managers
USD million
Funds of Hedge Funds 79,044.8 11,292.1 6,819.2 29,274.0 7
Direct Hedge Funds 187,536.7 17,048.8 6,847.0 70,037.0 11
Private Equity Funds of Funds 293,106.3 17,241.5 6,882.6 38,233.7 17
Direct Private Equity Funds 113,265.2 12,585.0 7,267.7 23,821.4 9
Real Estate Strategies 665,654.9 17,990.7 6,453.0 90,512.7 37
Direct Infrastructure Funds 125,706.8 17,958.1 6,400.0 59,216.0 7
Natural Resources 15,409.7 15,409.7 15,409.7 15,409.7 1
Illiquid Credit 122,761.0 12,276.1 6,693.0 29,649.4 10
Insurance-Linked Investments 9,408.0 9,408.0 9,408.0 9,408.0 1
Total 1,611,893.3 16,118.9 6,400.0 90,512.7 100

Comparison 2015 – 2016
© 2017 Willis Towers Watson. All rights reserved. Proprietary and Confidential. For Willis Towers Watson and Willis Towers Watson client use only. 27
Includes only managers who participated in both years
Total Pension Fund assets of managers participating in 2015 and 2016 increased from USD
1,390.8 bn in 2015 to 1,542.4 USD bn in 2016 (11%).
Pension fund asset allocation to alternatives remained broadly similar to the previous year. Direct
Hedge Funds, Direct Private Equity Funds and Illiquid Credit increased at the expense of Funds of
Hedge Funds, Private Equity Funds of Funds and Direct Infrastructure Funds.
There are 95 managers in the top 100 that also participated in 2015.
* Proportions might not sum up to 100% due to rounding
6%
5%
11%
12%
20%
19%
6%
7%
42%
42%
9%
8%
1%
1%
4%
5%
1%
1%
2015
2016
Funds of Hedge Funds Direct Hedge Funds Private Equity Funds of Funds
Direct Private Equity Funds Real Estate Strategies Direct Infrastructure Funds
Natural Resources Illiquid Credit Insurance-Linked Investments
Top 100 Alternative Asset Managers by Pension Fund Assets

Comparison 2015 – 2016
© 2017 Willis Towers Watson. All rights reserved. Proprietary and Confidential. For Willis Towers Watson and Willis Towers Watson client use only. 28
Includes only managers who participated in both years Pension Fund assets have increased by 1% from 2015 to 2016 but the proportion decreased
from 6% to 5% in 2016.
There are 7 managers in the top 100 that also participated in 2015.
Funds of Hedge
Funds
Account for over 12% of Pension Fund assets in this ranking, up from 11% in 2015.
There are 11 managers in the top 100 that also participated in 2015.Direct Hedge Funds
Private Equity Funds of Funds managers have the second largest amount of Pension Fund
assets in the survey with 19% in 2016, down from 20% in 2015.
17 managers in the top 100 also participated in 2015
Private Equity Funds
of Funds
There are 9 managers in the top 100 which participated in both years.
The proportion of Pension Fund assets increased from 6% in 2015 to 7% in 2016.
Direct Private Equity
Funds
Account for 42% of Pension Fund assets in this ranking, remaining flat compared to 2015. Real Estate Strategies have the greatest number of funds (35) in the top 100 participating in
both years.Real Estate Strategies
Account for over 8% of the total Top 100, down from 9% in 2015.
There are 7 managers participating in both 2015 and 2016.
Direct Infrastructure
Funds
There are 7 managers who participated in both 2015 and 2016 Pension Fund assets have increased by 17% from 2014 to 2015, while the proportion slightly
increased to 5%, up from 4% in 2015.Illiquid Credit
Note: All data in this section refers to the Total Assets for the Top 100 Alternative Asset Managers by Pension Fund assets
Top 100 Alternative Asset Managers by Pension Fund Assets
There is only one manager which participated in both years whose proportion of Pension Fund
assets remained steady at 1%.Natural Resources
There is only one manager which participated in both years whose proportion of Pension Fund
assets remained steady at 1%.
Insurance-Linked
Investments
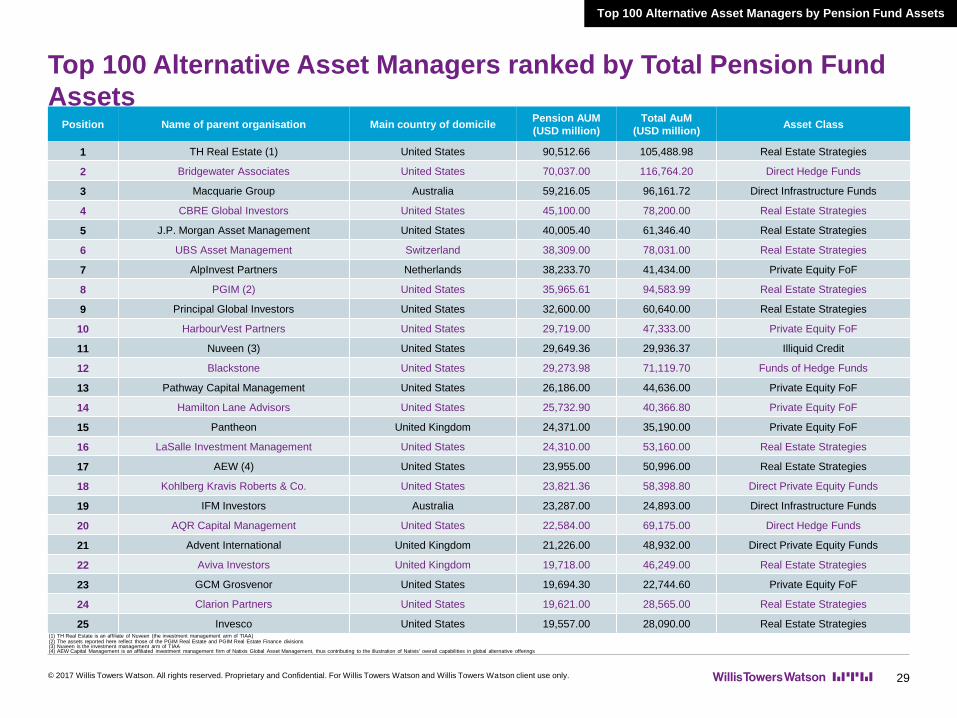
Top 100 Alternative Asset Managers ranked by Total Pension Fund
Assets
© 2017 Willis Towers Watson. All rights reserved. Proprietary and Confidential. For Willis Towers Watson and Willis Towers Watson client use only. 29
Top 100 Alternative Asset Managers by Pension Fund Assets
Position Name of parent organisation Main country of domicilePension AUM
(USD million)
Total AuM
(USD million)Asset Class
1 TH Real Estate (1) United States 90,512.66 105,488.98 Real Estate Strategies
2 Bridgewater Associates United States 70,037.00 116,764.20 Direct Hedge Funds
3 Macquarie Group Australia 59,216.05 96,161.72 Direct Infrastructure Funds
4 CBRE Global Investors United States 45,100.00 78,200.00 Real Estate Strategies
5 J.P. Morgan Asset Management United States 40,005.40 61,346.40 Real Estate Strategies
6 UBS Asset Management Switzerland 38,309.00 78,031.00 Real Estate Strategies
7 AlpInvest Partners Netherlands 38,233.70 41,434.00 Private Equity FoF
8 PGIM (2) United States 35,965.61 94,583.99 Real Estate Strategies
9 Principal Global Investors United States 32,600.00 60,640.00 Real Estate Strategies
10 HarbourVest Partners United States 29,719.00 47,333.00 Private Equity FoF
11 Nuveen (3) United States 29,649.36 29,936.37 Illiquid Credit
12 Blackstone United States 29,273.98 71,119.70 Funds of Hedge Funds
13 Pathway Capital Management United States 26,186.00 44,636.00 Private Equity FoF
14 Hamilton Lane Advisors United States 25,732.90 40,366.80 Private Equity FoF
15 Pantheon United Kingdom 24,371.00 35,190.00 Private Equity FoF
16 LaSalle Investment Management United States 24,310.00 53,160.00 Real Estate Strategies
17 AEW (4) United States 23,955.00 50,996.00 Real Estate Strategies
18 Kohlberg Kravis Roberts & Co. United States 23,821.36 58,398.80 Direct Private Equity Funds
19 IFM Investors Australia 23,287.00 24,893.00 Direct Infrastructure Funds
20 AQR Capital Management United States 22,584.00 69,175.00 Direct Hedge Funds
21 Advent International United Kingdom 21,226.00 48,932.00 Direct Private Equity Funds
22 Aviva Investors United Kingdom 19,718.00 46,249.00 Real Estate Strategies
23 GCM Grosvenor United States 19,694.30 22,744.60 Private Equity FoF
24 Clarion Partners United States 19,621.00 28,565.00 Real Estate Strategies
25 Invesco United States 19,557.00 28,090.00 Real Estate Strategies
(4) AEW Capital Management is an affiliated investment management firm of Natixis Global Asset Management, thus contributing to the illustration of Natixis' overall capabilities in global alternative offerings
(2) The assets reported here reflect those of the PGIM Real Estate and PGIM Real Estate Finance divisions(1) TH Real Estate is an affiliate of Nuveen (the investment management arm of TIAA)
(3) Nuveen is the investment management arm of TIAA

Top 100 Alternative Asset Managers ranked by Total Pension Fund
Assets
Top 100 Alternative Asset Managers by Pension Fund Assets
© 2017 Willis Towers Watson. All rights reserved. Proprietary and Confidential. For Willis Towers Watson and Willis Towers Watson client use only. 30
Position Name of parent organisation Main country of domicilePension AUM
(USD million)
Total AuM
(USD million)Asset Class
26 Man Group United Kingdom 19,439.00 54,668.00 Direct Hedge Funds
27 Credit Suisse Asset Management Switzerland 19,123.82 43,199.82 Real Estate Strategies
28 Deutsche Asset Management Germany 18,281.00 46,193.00 Real Estate Strategies
29 Heitman United States 18,009.00 28,811.00 Real Estate Strategies
30 M&G Investments United Kingdom 16,959.23 30,019.48 Illiquid Credit
31 LGT Capital Partners Switzerland 16,171.68 27,090.53 Private Equity FoF
32 Brookfield Asset Management Canada 15,743.00 54,642.00 Real Estate Strategies
33 Nuveen (1) United States 15,409.66 15,514.12 Natural Resources
34 Permira United Kingdom 15,222.00 32,942.00 Direct Private Equity Funds
35 J.P. Morgan Asset Management – Private Equity United States 14,677.00 24,463.00 Private Equity FoF
36 Goldman Sachs Asset Management United States 14,304.96 52,183.34 Private Equity FoF
37 BlackRock United States 14,159.00 33,804.00 Direct Hedge Funds
38 Oak Hill Advisors United States 14,057.60 21,794.90 Illiquid Credit
39 AMP Capital Australia 13,809.00 16,068.00 Real Estate Strategies
40 Ardian France 13,374.00 35,715.00 Private Equity FoF
41 BlackRock United States 13,183.00 20,492.00 Real Estate Strategies
42 Oaktree Capital Management United States 13,078.76 27,788.29 Illiquid Credit
43 Adams Street Partners United States 12,947.87 22,618.25 Private Equity FoF
44 GCM Grosvenor United States 12,696.10 25,886.30 Funds of Hedge Funds
45 Ares Management United States 12,508.74 19,897.87 Direct Private Equity Funds
46 Aberdeen Asset Management United Kingdom 12,272.19 24,154.19 Real Estate Strategies
47 Legal & General United Kingdom 11,914.00 23,750.00 Real Estate Strategies
48 Brookfield Asset Management Canada 11,907.00 40,139.00 Direct Infrastructure Funds
49 Morgan Stanley Investment Management United States 11,834.00 26,424.00 Real Estate Strategies
50 Portfolio Advisors United States 11,641.82 14,833.58 Private Equity FoF
(1) Nuveen is the investment management arm of TIAA

Top 100 Alternative Asset Managers ranked by Total Pension Fund
Assets
Top 100 Alternative Asset Managers by Pension Fund Assets
© 2017 Willis Towers Watson. All rights reserved. Proprietary and Confidential. For Willis Towers Watson and Willis Towers Watson client use only. 31
Position Name of parent organisation Main country of domicilePension AUM
(USD million)
Total AuM
(USD million)Asset Class
51 Neuberger Berman United States 11,415.40 29,194.10 Private Equity FoF
52 Bentall Kennedy Canada 11,324.00 30,269.00 Real Estate Strategies
53 Standard Life Investments United Kingdom 11,229.70 20,668.00 Real Estate Strategies
54 PIMCO United States 11,128.00 16,943.00 Direct Hedge Funds
55 Partners Group Switzerland 10,132.10 20,603.30 Private Equity FoF
56 Two Sigma Advisers United States 9,820.00 33,300.00 Direct Hedge Funds
57 First State Investments Australia 9,750.26 12,780.52 Direct Infrastructure Funds
58 Brigade Capital United States 9,598.00 18,380.00 Direct Hedge Funds
59 ISPT Australia 9,582.00 9,582.00 Real Estate Strategies
60 Och-Ziff Capital Management Group United States 9,575.00 33,700.00 Direct Hedge Funds
61 QIC Australia 9,471.64 10,495.09 Real Estate Strategies
62 Schroders Investment Management United Kingdom 9,434.00 14,942.00 Real Estate Strategies
63 Nephila Capital Bermuda 9,408.00 10,157.00 Insurance-Linked Investments
64 Alcentra United Kingdom 9,288.50 31,374.50 Illiquid Credit
65 Hermes Investment Management United Kingdom 9,085.00 9,359.00 Real Estate Strategies
66 SL Capital Partners United Kingdom 9,026.00 11,360.00 Private Equity FoF
67 Beach Point Capital Management United States 9,016.00 12,146.00 Illiquid Credit
68 Bouwinvest REIM Netherlands 8,915.00 8,926.00 Real Estate Strategies
69 Cinven United Kingdom 8,896.00 16,386.99 Direct Private Equity Funds
70 Aberdeen Asset Management United Kingdom 8,739.47 10,707.07 Funds of Hedge Funds
71 Bridgepoint United Kingdom 8,657.00 12,993.00 Direct Private Equity Funds
72 PATRIZIA Immobilien Germany 8,600.00 19,650.00 Real Estate Strategies
73 Coller Capital United Kingdom 8,596.00 21,029.00 Private Equity FoF
74 Prudential Private Placement Investors United States 8,533.50 80,860.40 Illiquid Credit
75 HPS Investment Partners United States 8,522.01 26,070.88 Illiquid Credit
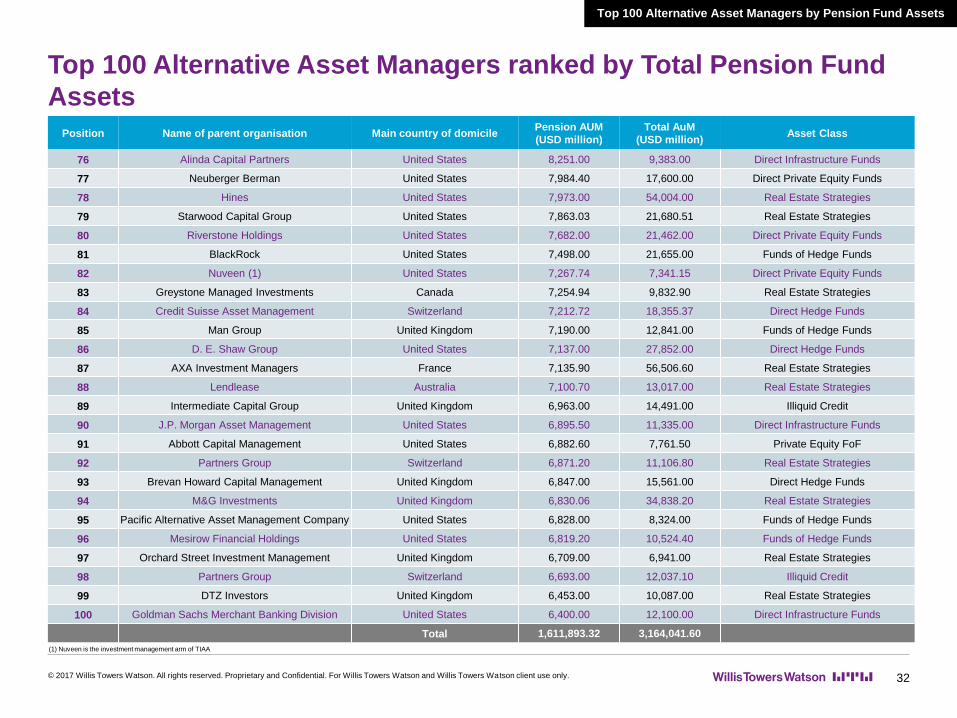
Top 100 Alternative Asset Managers ranked by Total Pension Fund
Assets
Top 100 Alternative Asset Managers by Pension Fund Assets
© 2017 Willis Towers Watson. All rights reserved. Proprietary and Confidential. For Willis Towers Watson and Willis Towers Watson client use only. 32
Position Name of parent organisation Main country of domicilePension AUM
(USD million)
Total AuM
(USD million)Asset Class
76 Alinda Capital Partners United States 8,251.00 9,383.00 Direct Infrastructure Funds
77 Neuberger Berman United States 7,984.40 17,600.00 Direct Private Equity Funds
78 Hines United States 7,973.00 54,004.00 Real Estate Strategies
79 Starwood Capital Group United States 7,863.03 21,680.51 Real Estate Strategies
80 Riverstone Holdings United States 7,682.00 21,462.00 Direct Private Equity Funds
81 BlackRock United States 7,498.00 21,655.00 Funds of Hedge Funds
82 Nuveen (1) United States 7,267.74 7,341.15 Direct Private Equity Funds
83 Greystone Managed Investments Canada 7,254.94 9,832.90 Real Estate Strategies
84 Credit Suisse Asset Management Switzerland 7,212.72 18,355.37 Direct Hedge Funds
85 Man Group United Kingdom 7,190.00 12,841.00 Funds of Hedge Funds
86 D. E. Shaw Group United States 7,137.00 27,852.00 Direct Hedge Funds
87 AXA Investment Managers France 7,135.90 56,506.60 Real Estate Strategies
88 Lendlease Australia 7,100.70 13,017.00 Real Estate Strategies
89 Intermediate Capital Group United Kingdom 6,963.00 14,491.00 Illiquid Credit
90 J.P. Morgan Asset Management United States 6,895.50 11,335.00 Direct Infrastructure Funds
91 Abbott Capital Management United States 6,882.60 7,761.50 Private Equity FoF
92 Partners Group Switzerland 6,871.20 11,106.80 Real Estate Strategies
93 Brevan Howard Capital Management United Kingdom 6,847.00 15,561.00 Direct Hedge Funds
94 M&G Investments United Kingdom 6,830.06 34,838.20 Real Estate Strategies
95 Pacific Alternative Asset Management Company United States 6,828.00 8,324.00 Funds of Hedge Funds
96 Mesirow Financial Holdings United States 6,819.20 10,524.40 Funds of Hedge Funds
97 Orchard Street Investment Management United Kingdom 6,709.00 6,941.00 Real Estate Strategies
98 Partners Group Switzerland 6,693.00 12,037.10 Illiquid Credit
99 DTZ Investors United Kingdom 6,453.00 10,087.00 Real Estate Strategies
100 Goldman Sachs Merchant Banking Division United States 6,400.00 12,100.00 Direct Infrastructure Funds
Total 1,611,893.32 3,164,041.60
(1) Nuveen is the investment management arm of TIAA

0.00
20.00
40.00
60.00
80.00
100.00
120.00
140.00
160.00
Dec-12 Dec-13 Dec-14 Dec-15 Dec-16
Ind
ex
De
c 2
01
2 =
10
0*
Funds of Hedge Funds Private Equity Funds of Funds
Real Estate Strategies Direct Commodities Funds
Direct Infrastructure Funds Direct Hedge Funds
Direct Private Equity Funds
Managers that have participated for the past five years
Five-year comparison
© 2017 Willis Towers Watson. All rights reserved. Proprietary and Confidential. For Willis Towers Watson and Willis Towers Watson client use only. 33
Pension fund assets managed by the 27 Fund of Hedge
Funds managers that participated in the last five years rose
by 1% in 2016. Average annual growth since 2012 has been
5%.
Growth in pension fund assets managed by the 31 Private
Equity Funds of Funds that participated in the last five years
slowed somewhat in 2016, with a rise in assets of 5%. This
followed a period of steady growth between 2012 and 2015.
Pension fund assets managed by the 59 Real Estate
Strategies Fund managers that participated in the last five
years kept growing in 2016, rising 9% on assets managed
compared to 2015. This followed two years of modest
decline between 2012 and 2014.
Pension fund assets managed by the 18 Direct
Commodities Fund Managers that have participated in the
last five years recovered in 2016 from their decline since
2012 and increased 12% compared to 2015.
Pension fund assets managed by the 39 Direct
Infrastructure Fund Managers that participated in the last
five years rose by 6% in 2016 and have been growing
steadily since 2012.
Pension fund assets managed by the 61 Direct Hedge Fund
Managers that have participated in the last five years have
grown steadily since 2012 at an average rate of 11%.
Pension fund assets managed by the 26 Direct Private
Equity Fund Managers that have participated in the last five
years rose by 23% in 2016 following a period of slight
decrease between 2012 and 2015.
Total Universe – Pension Fund Assets
AuM Variation

Top 25 Alternative Asset Managers by
Insurance Company Assets
Section 3.B
© 2017 Willis Towers Watson. All rights reserved. Proprietary and Confidential. For Willis Towers Watson and Willis Towers Watson client use only.
Executive summary
© 2017 Willis Towers Watson. All rights reserved. Proprietary and Confidential. For Willis Towers Watson and Willis Towers Watson client use only. 35
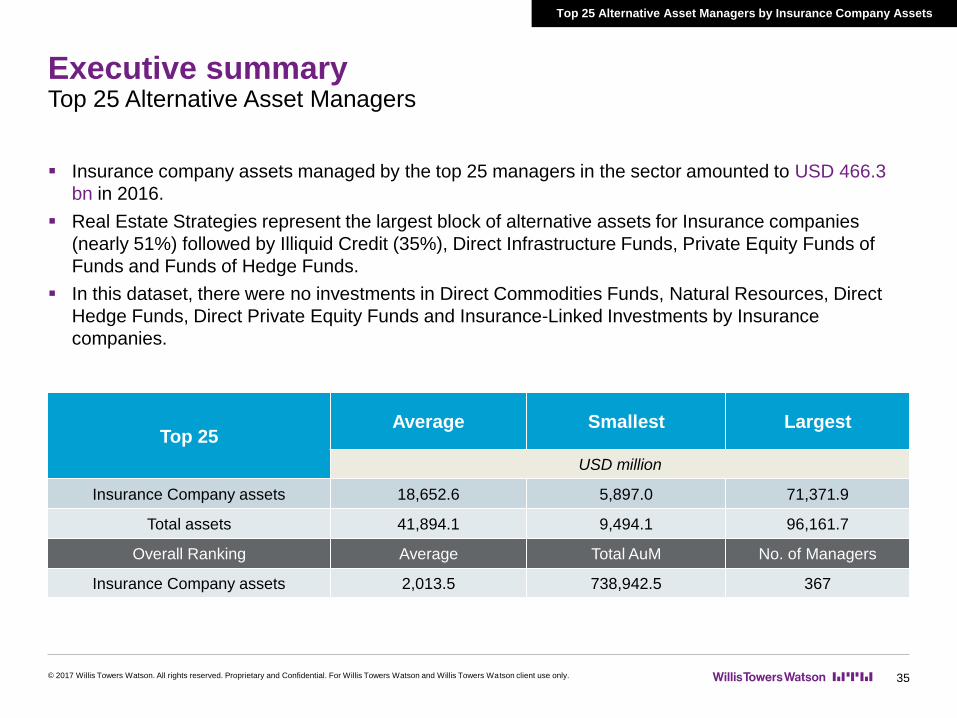
Top 25 Alternative Asset Managers
Top 25 Alternative Asset Managers by Insurance Company Assets
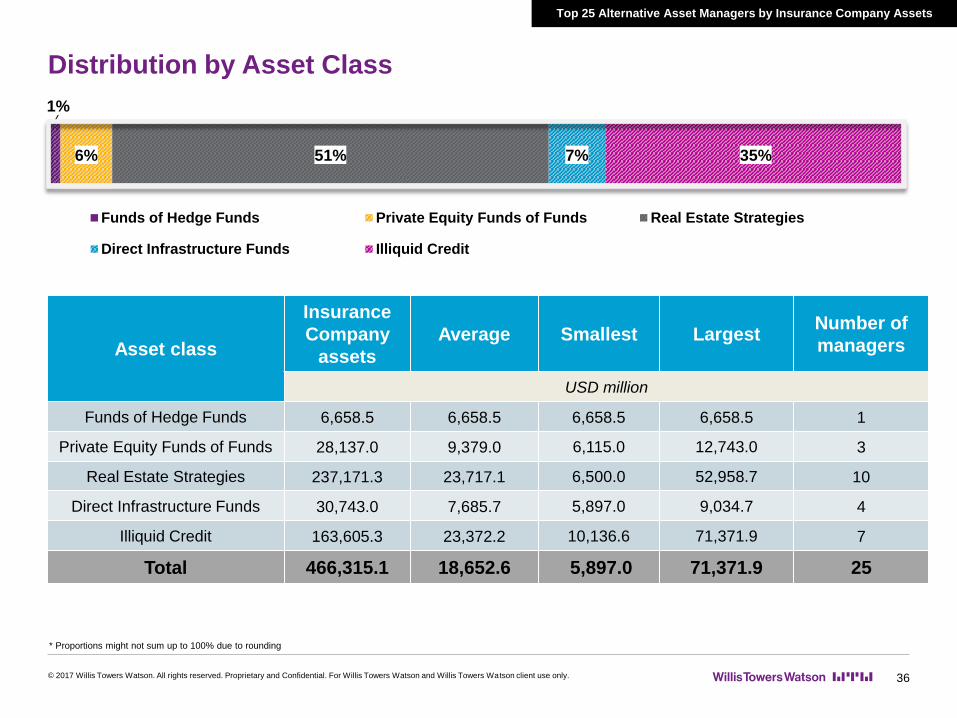
Insurance company assets managed by the top 25 managers in the sector amounted to USD 466.3
bn in 2016.
Real Estate Strategies represent the largest block of alternative assets for Insurance companies
(nearly 51%) followed by Illiquid Credit (35%), Direct Infrastructure Funds, Private Equity Funds of
Funds and Funds of Hedge Funds.
In this dataset, there were no investments in Direct Commodities Funds, Natural Resources, Direct
Hedge Funds, Direct Private Equity Funds and Insurance-Linked Investments by Insurance
companies.
Top 25Average Smallest Largest
USD million
Insurance Company assets 18,652.6 5,897.0 71,371.9
Total assets 41,894.1 9,494.1 96,161.7
Overall Ranking Average Total AuM No. of Managers
Insurance Company assets 2,013.5 738,942.5 367
Distribution by Asset Class
36
1%
6% 51% 7% 35%
Funds of Hedge Funds Private Equity Funds of Funds Real Estate Strategies
Direct Infrastructure Funds Illiquid Credit
Top 25 Alternative Asset Managers by Insurance Company Assets
* Proportions might not sum up to 100% due to rounding
Asset class
Insurance
Company
assets
Average Smallest LargestNumber of
managers
USD million
Funds of Hedge Funds 6,658.5 6,658.5 6,658.5 6,658.5 1
Private Equity Funds of Funds 28,137.0 9,379.0 6,115.0 12,743.0 3
Real Estate Strategies 237,171.3 23,717.1 6,500.0 52,958.7 10
Direct Infrastructure Funds 30,743.0 7,685.7 5,897.0 9,034.7 4
Illiquid Credit 163,605.3 23,372.2 10,136.6 71,371.9 7
Total 466,315.1 18,652.6 5,897.0 71,371.9 25
© 2017 Willis Towers Watson. All rights reserved. Proprietary and Confidential. For Willis Towers Watson and Willis Towers Watson client use only.

© 2017 Willis Towers Watson. All rights reserved. Proprietary and Confidential. For Willis Towers Watson and Willis Towers Watson client use only. 37
Includes only managers who participated in both years
Insurance company assets from managers participating in 2015 and 2016 increased from USD 317.6
bn in 2015 to USD 371.6 bn in 2016 (17%).
Insurance companies have tended to invest in Real Estate Strategies and that trend has remained
broadly unchanged, with proportions decreasing from 65% to 64%.
There are 22 managers in the top 25 that also participated in 2015.
2%
2%
7%
8%
65%
64%
5%
6%
21%
21%
2015
2016
Funds of Hedge Funds Private Equity Funds of Funds
Real Estate Strategies Direct Infrastructure Funds
Illiquid Credit
* Proportions might not sum up to 100% due to rounding
Top 25 Alternative Asset Managers by Insurance Company Assets
Top 25 comparison 2015 - 2016
Top 25 Alternative Asset Managers ranked by Insurance Company Assets
© 2017 Willis Towers Watson. All rights reserved. Proprietary and Confidential. For Willis Towers Watson and Willis Towers Watson client use only. 38
Top 25 Alternative Asset Managers by Insurance Company Assets
Position Name of parent organisation Main country of domicileInsurance AUM
(USD million)
Total AUM
(USD million)Asset Class
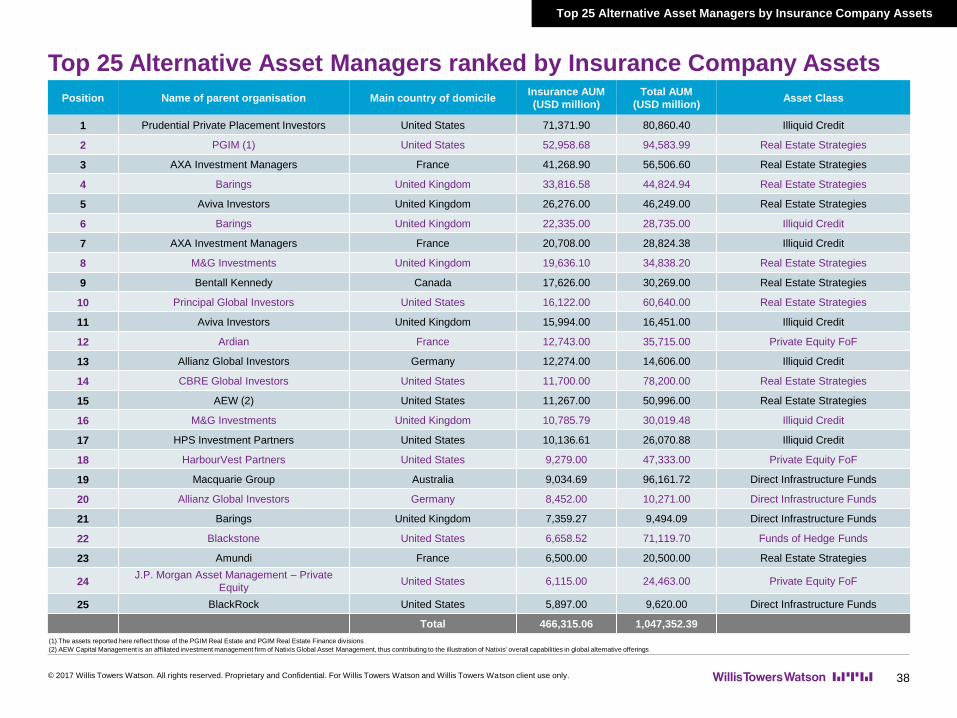
1 Prudential Private Placement Investors United States 71,371.90 80,860.40 Illiquid Credit
2 PGIM (1) United States 52,958.68 94,583.99 Real Estate Strategies
3 AXA Investment Managers France 41,268.90 56,506.60 Real Estate Strategies
4 Barings United Kingdom 33,816.58 44,824.94 Real Estate Strategies
5 Aviva Investors United Kingdom 26,276.00 46,249.00 Real Estate Strategies
6 Barings United Kingdom 22,335.00 28,735.00 Illiquid Credit
7 AXA Investment Managers France 20,708.00 28,824.38 Illiquid Credit
8 M&G Investments United Kingdom 19,636.10 34,838.20 Real Estate Strategies
9 Bentall Kennedy Canada 17,626.00 30,269.00 Real Estate Strategies
10 Principal Global Investors United States 16,122.00 60,640.00 Real Estate Strategies
11 Aviva Investors United Kingdom 15,994.00 16,451.00 Illiquid Credit
12 Ardian France 12,743.00 35,715.00 Private Equity FoF
13 Allianz Global Investors Germany 12,274.00 14,606.00 Illiquid Credit
14 CBRE Global Investors United States 11,700.00 78,200.00 Real Estate Strategies
15 AEW (2) United States 11,267.00 50,996.00 Real Estate Strategies
16 M&G Investments United Kingdom 10,785.79 30,019.48 Illiquid Credit
17 HPS Investment Partners United States 10,136.61 26,070.88 Illiquid Credit
18 HarbourVest Partners United States 9,279.00 47,333.00 Private Equity FoF
19 Macquarie Group Australia 9,034.69 96,161.72 Direct Infrastructure Funds
20 Allianz Global Investors Germany 8,452.00 10,271.00 Direct Infrastructure Funds
21 Barings United Kingdom 7,359.27 9,494.09 Direct Infrastructure Funds
22 Blackstone United States 6,658.52 71,119.70 Funds of Hedge Funds
23 Amundi France 6,500.00 20,500.00 Real Estate Strategies
24J.P. Morgan Asset Management – Private
EquityUnited States 6,115.00 24,463.00 Private Equity FoF
25 BlackRock United States 5,897.00 9,620.00 Direct Infrastructure Funds
Total 466,315.06 1,047,352.39
(2) AEW Capital Management is an affiliated investment management firm of Natixis Global Asset Management, thus contributing to the illustration of Natixis' overall capabilities in global alternative offerings
(1) The assets reported here reflect those of the PGIM Real Estate and PGIM Real Estate Finance divisions

Top 25 Alternative Asset Managers by
Sovereign Wealth Fund Assets
Section 3.C
© 2017 Willis Towers Watson. All rights reserved. Proprietary and Confidential. For Willis Towers Watson and Willis Towers Watson client use only.
Executive summary
© 2017 Willis Towers Watson. All rights reserved. Proprietary and Confidential. For Willis Towers Watson and Willis Towers Watson client use only. 40
Top 25 Alternative Asset Managers
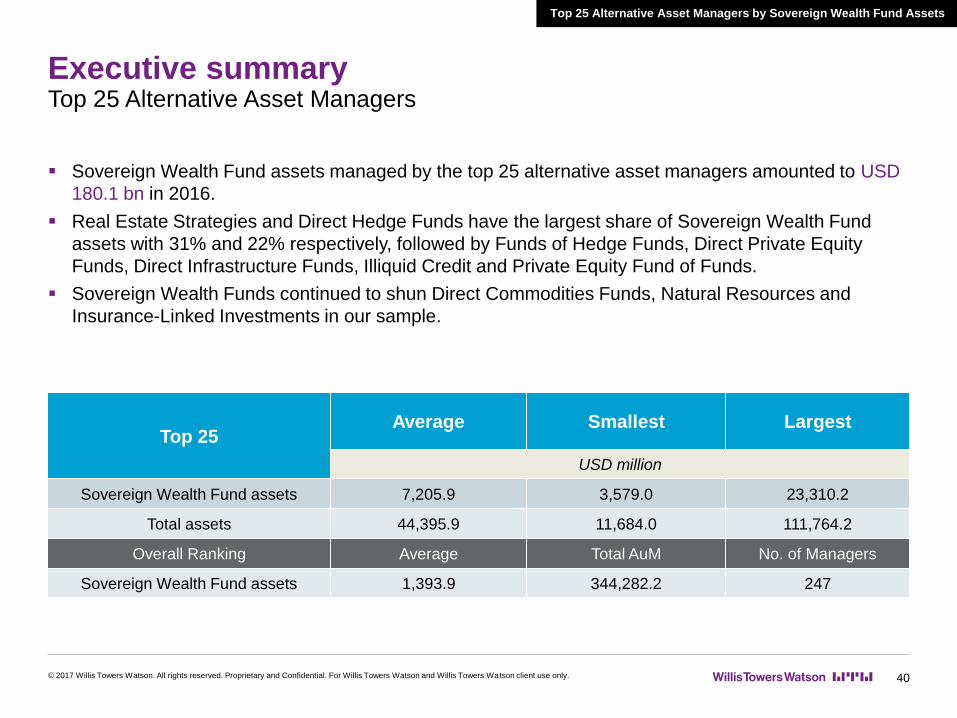
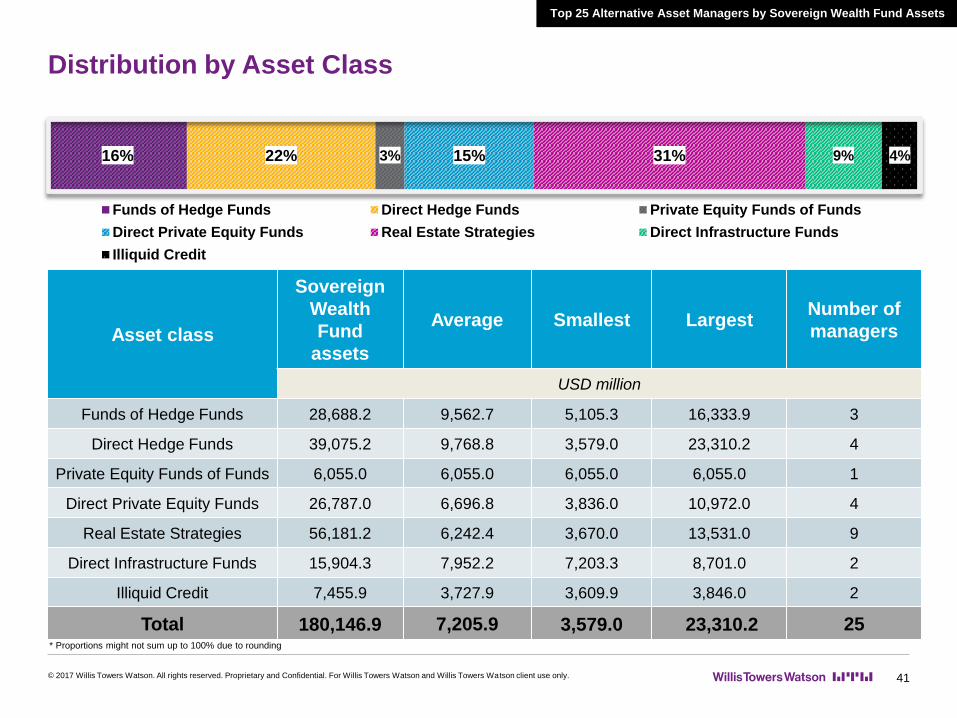
Sovereign Wealth Fund assets managed by the top 25 alternative asset managers amounted to USD
180.1 bn in 2016.
Real Estate Strategies and Direct Hedge Funds have the largest share of Sovereign Wealth Fund
assets with 31% and 22% respectively, followed by Funds of Hedge Funds, Direct Private Equity
Funds, Direct Infrastructure Funds, Illiquid Credit and Private Equity Fund of Funds.
Sovereign Wealth Funds continued to shun Direct Commodities Funds, Natural Resources and
Insurance-Linked Investments in our sample.
Top 25 Alternative Asset Managers by Sovereign Wealth Fund Assets
Top 25Average Smallest Largest
USD million
Sovereign Wealth Fund assets 7,205.9 3,579.0 23,310.2
Total assets 44,395.9 11,684.0 111,764.2
Overall Ranking Average Total AuM No. of Managers
Sovereign Wealth Fund assets 1,393.9 344,282.2 247
Distribution by Asset Class
© 2017 Willis Towers Watson. All rights reserved. Proprietary and Confidential. For Willis Towers Watson and Willis Towers Watson client use only. 41
16% 22% 3% 15% 31% 9% 4%
Funds of Hedge Funds Direct Hedge Funds Private Equity Funds of Funds
Direct Private Equity Funds Real Estate Strategies Direct Infrastructure Funds
Illiquid Credit
Top 25 Alternative Asset Managers by Sovereign Wealth Fund Assets
* Proportions might not sum up to 100% due to rounding
Asset class
Sovereign
Wealth
Fund
assets
Average Smallest LargestNumber of
managers
USD million
Funds of Hedge Funds 28,688.2 9,562.7 5,105.3 16,333.9 3
Direct Hedge Funds 39,075.2 9,768.8 3,579.0 23,310.2 4
Private Equity Funds of Funds 6,055.0 6,055.0 6,055.0 6,055.0 1
Direct Private Equity Funds 26,787.0 6,696.8 3,836.0 10,972.0 4
Real Estate Strategies 56,181.2 6,242.4 3,670.0 13,531.0 9
Direct Infrastructure Funds 15,904.3 7,952.2 7,203.3 8,701.0 2
Illiquid Credit 7,455.9 3,727.9 3,609.9 3,846.0 2
Total 180,146.9 7,205.9 3,579.0 23,310.2 25
Top 25 comparison 2015 - 2016
© 2017 Willis Towers Watson. All rights reserved. Proprietary and Confidential. For Willis Towers Watson and Willis Towers Watson client use only. 42
Includes only managers who participated in both years
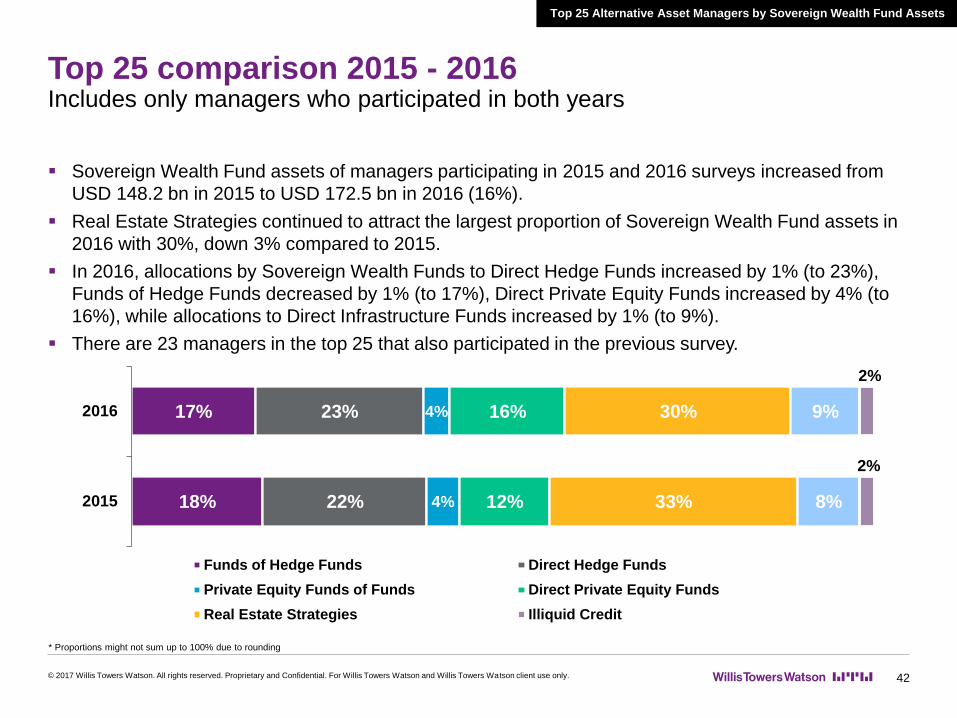
Sovereign Wealth Fund assets of managers participating in 2015 and 2016 surveys increased from
USD 148.2 bn in 2015 to USD 172.5 bn in 2016 (16%).
Real Estate Strategies continued to attract the largest proportion of Sovereign Wealth Fund assets in
2016 with 30%, down 3% compared to 2015.
In 2016, allocations by Sovereign Wealth Funds to Direct Hedge Funds increased by 1% (to 23%),
Funds of Hedge Funds decreased by 1% (to 17%), Direct Private Equity Funds increased by 4% (to
16%), while allocations to Direct Infrastructure Funds increased by 1% (to 9%).
There are 23 managers in the top 25 that also participated in the previous survey.
18%
17%
22%
23%
4%
4%
12%
16%
33%
30%
8%
9%
2%
2%
2015
2016
Funds of Hedge Funds Direct Hedge Funds
Private Equity Funds of Funds Direct Private Equity Funds
Real Estate Strategies Illiquid Credit
Top 25 Alternative Asset Managers by Sovereign Wealth Fund Assets
* Proportions might not sum up to 100% due to rounding

Top 25 Alternative Asset Managers ranked by Sovereign Wealth
Fund Assets
© 2017 Willis Towers Watson. All rights reserved. Proprietary and Confidential. For Willis Towers Watson and Willis Towers Watson client use only. 43
Top 25 Alternative Asset Managers by Sovereign Wealth Fund Assets
Position Name of parent organisation Main country of domicileSovereign AUM
(USD million)
Total AUM
(USD million)Asset Class
1 Bridgewater Associates United States 23,310.20 116,764.20 Direct Hedge Funds
2 Blackstone United States 16,333.90 71,119.70 Funds of Hedge Funds
3 Brookfield Asset Management Canada 13,531.00 54,642.00 Real Estate Strategies
4 Kohlberg Kravis Roberts & Co. United States 10,972.04 58,398.80 Direct Private Equity Funds
5 Brookfield Asset Management Canada 8,701.00 40,139.00 Direct Infrastructure Funds
6 Man Group United Kingdom 8,536.00 54,668.00 Direct Hedge Funds
7 Prologis United States 8,340.60 29,753.20 Real Estate Strategies
8 Advent International United Kingdom 7,779.00 48,932.00 Direct Private Equity Funds
9 BlackRock United States 7,249.00 21,655.00 Funds of Hedge Funds
10 Macquarie Group Australia 7,203.31 96,161.72 Direct Infrastructure Funds
11 Ardian France 6,055.00 35,715.00 Private Equity FoF
12 Hines United States 5,804.00 54,004.00 Real Estate Strategies
13 AXA Investment Managers France 5,633.40 56,506.60 Real Estate Strategies
14 Starwood Capital Group United States 5,263.24 21,680.51 Real Estate Strategies
15 GCM Grosvenor United States 5,105.30 25,886.30 Funds of Hedge Funds
16 CBRE Global Investors United States 5,100.00 78,200.00 Real Estate Strategies
17 LaSalle Investment Management United States 5,039.00 53,160.00 Real Estate Strategies
18 Bain Capital Private Equity United States 4,200.00 32,200.00 Direct Private Equity Funds
19 Oaktree Capital Management United States 3,845.99 27,788.29 Illiquid Credit
20 Permira United Kingdom 3,836.00 32,942.00 Direct Private Equity Funds
21 DEXUS Property Group Australia 3,800.00 12,309.17 Real Estate Strategies
22 BlackRock United States 3,670.00 20,492.00 Real Estate Strategies
23 Two Sigma Advisers United States 3,650.00 33,300.00 Direct Hedge Funds
24 Oak Hill Advisors United States 3,609.90 21,794.90 Illiquid Credit
25 Trian Fund Management United States 3,579.00 11,684.00 Direct Hedge Funds
Total 180,146.89 1,109,896.39

Top 25 Alternative Asset Managers by
Endowment and Foundation Assets
Section 3.D
© 2017 Willis Towers Watson. All rights reserved. Proprietary and Confidential. For Willis Towers Watson and Willis Towers Watson client use only.

Executive summary
© 2017 Willis Towers Watson. All rights reserved. Proprietary and Confidential. For Willis Towers Watson and Willis Towers Watson client use only. 45
Top 25 Alternative Asset Managers
Endowment and Foundation assets managed by the top 25 managers amounted to USD 86.5 bn in
2016.
Of the alternative asset classes surveyed, Endowment and Foundation assets are the most evenly
distributed: Direct Hedge Funds have the largest allocation, followed by Direct Private Equity Funds.
Next in order are Private Equity Funds of Funds, Funds of Hedge Funds and Real Estate Strategies.
Illiquid credit have the lowest allocation from Endowments and Foundations, and there are no
allocations to Direct Commodities Funds, Direct Infrastructure Funds, Natural Resources or
Insurance-Linked Investments in this sample.
Top 25 Alternative Asset Managers by Endowment and Foundation Assets
Top 25Average Smallest Largest
USD million
Endowment & Foundation assets 3,460.2 1,907.0 10,898.0
Total assets 36,229.0 4,622.0 116,764.2
Overall Ranking Average Total AuM No. of Managers
Endowment & Foundation assets 545.7 191,541.7 351

Distribution by Asset Class
© 2017 Willis Towers Watson. All rights reserved. Proprietary and Confidential. For Willis Towers Watson and Willis Towers Watson client use only. 46
15% 37% 16% 17% 10% 5%
Funds of Hedge Funds Direct Hedge Funds Private Equity Funds of Funds
Direct Private Equity Funds Direct Real Estate Illiquid Credit
* Proportions might not sum up to 100% due to rounding
Top 25 Alternative Asset Managers by Endowment and Foundation Assets
Asset class
Endowment
and
Foundation
assets
Average Smallest LargestNumber of
managers
USD million
Funds of Hedge Funds 12,843.7 4,281.2 2,762.0 7,298.9 3
Direct Hedge Funds 31,952.8 3,550.3 1,910.0 10,898.0 9
Private Equity Funds of Funds 14,039.6 3,509.9 1,907.0 6,325.3 4
Direct Private Equity Funds 15,035.5 3,758.9 2,200.0 6,100.0 4
Real Estate Strategies 8,351.9 2,784.0 2,149.0 3,583.9 3
Illiquid Credit 4,282.2 2,141.1 2,027.6 2,254.6 2
Total 86,505.6 3,460.2 1,907.0 10,898.0 25

Top 25 comparison 2015 - 2016
© 2017 Willis Towers Watson. All rights reserved. Proprietary and Confidential. For Willis Towers Watson and Willis Towers Watson client use only. 47
Includes only managers who participated in both years
Endowment and Foundation assets for managers in the top 25 participating in 2015 and 2016
increased from USD 74.2 bn in 2015 to USD 84.5 bn in 2016 (14%).
Direct Hedge Funds and Private Equity Funds of Funds increased their proportions in 2016, from 35%
to 38% and 12% to 17% respectively, at the expense of Direct Private Equity Funds which decreased
from 23% to 18%.
There are 24 Endowment and Foundation managers that also participated in 2015.
16%
15%
35%
38%
12%
17%
23%
18%
10%
10%
3%
3%
2015
2016
Funds of Hedge Funds Direct Hedge Funds Private Equity Funds of Funds
Direct Private Equity Funds Real Estate Strategies Illiquid Credit
Top 25 Alternative Asset Managers by Endowment and Foundation Assets
* Proportions might not sum up to 100% due to rounding

Top 25 Alternative Asset Managers ranked by Endowment and
Foundation Assets
Top 25 Alternative Asset Managers by Endowment and Foundation Assets
© 2017 Willis Towers Watson. All rights reserved. Proprietary and Confidential. For Willis Towers Watson and Willis Towers Watson client use only. 48
Position Name of parent organisation Main country of domicileE&F AUM
(USD million)
Total AUM
(USD million)Asset Class
1 Bridgewater Associates United States 10,898.00 116,764.20 Direct Hedge Funds
2 Blackstone United States 7,298.85 71,119.70 Funds of Hedge Funds
3 Neuberger Berman United States 6,325.30 29,194.10 Private Equity FoF
4 Bain Capital Private Equity United States 6,100.00 32,200.00 Direct Private Equity Funds
5 Advent International United Kingdom 3,913.00 48,932.00 Direct Private Equity Funds
6 Two Sigma Advisers United States 3,710.00 33,300.00 Direct Hedge Funds
7J.P. Morgan Asset Management – Private
EquityUnited States 3,671.00 24,463.00 Private Equity FoF
8 Credit Suisse Asset Management Switzerland 3,583.93 43,199.82 Real Estate Strategies
9 AQR Capital Management United States 3,379.39 69,175.00 Direct Hedge Funds
10 Fir Tree Partners United States 3,089.00 10,262.00 Direct Hedge Funds
11 Clayton, Dubilier & Rice United States 2,822.47 18,816.48 Direct Private Equity Funds
12 LGT Capital Partners Switzerland 2,782.83 10,123.26 Funds of Hedge Funds
13 Evanston Capital Management United States 2,762.00 4,622.00 Funds of Hedge Funds
14 Hines United States 2,619.00 54,004.00 Real Estate Strategies
15 Wellington Management United States 2,454.00 10,278.00 Direct Hedge Funds
16 Millennium Management United States 2,320.00 34,090.00 Direct Hedge Funds
17 Värde Partners United States 2,254.61 8,457.61 Illiquid Credit
18 Renaissance Technologies United States 2,207.40 38,795.20 Direct Hedge Funds
19 Energy Capital Partners United States 2,200.00 12,200.00 Direct Private Equity Funds
20 AEW (1) United States 2,149.00 50,996.00 Real Estate Strategies
21 LGT Capital Partners Switzerland 2,136.27 27,090.53 Private Equity FoF
22 Oaktree Capital Management United States 2,027.55 27,788.29 Illiquid Credit
23 D. E. Shaw Group United States 1,985.00 27,852.00 Direct Hedge Funds
24 Man Group United Kingdom 1,910.00 54,668.00 Direct Hedge Funds
25 HarbourVest Partners United States 1,907.00 47,333.00 Private Equity FoF
Total 86,505.60 905,724.18
(1) AEW Capital Management is an affiliated investment management firm of Natixis Global Asset Management, thus contributing to the illustration of Natixis' overall capabilities in global alternative offerings

Top 25 Alternative Asset Managers by Fund
of Funds Assets
Section 3.E
© 2017 Willis Towers Watson. All rights reserved. Proprietary and Confidential. For Willis Towers Watson and Willis Towers Watson client use only.
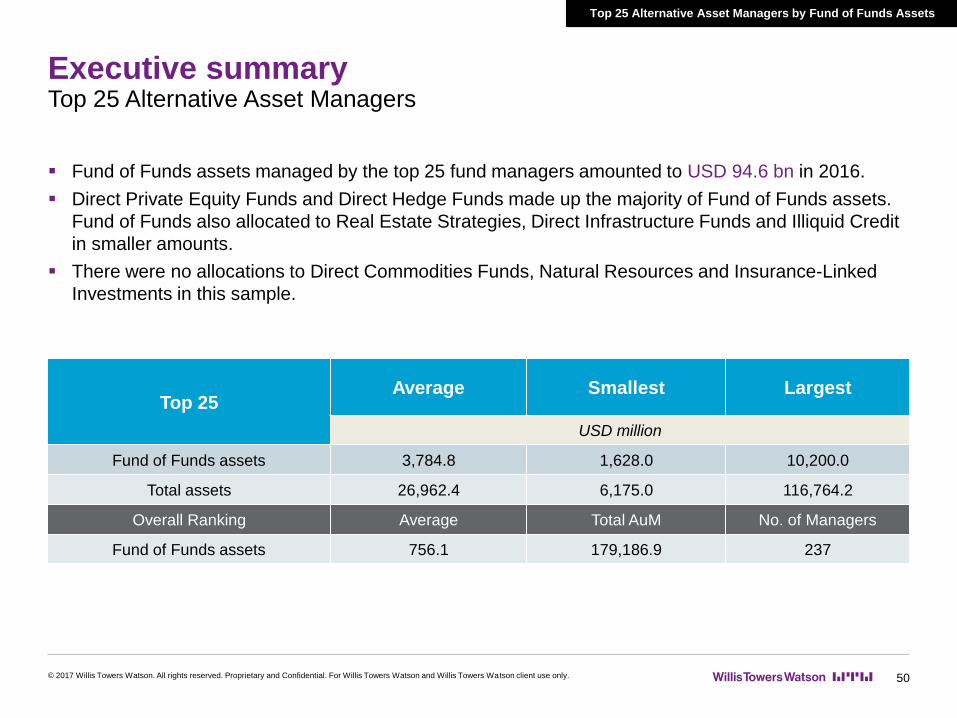
Executive summary
© 2017 Willis Towers Watson. All rights reserved. Proprietary and Confidential. For Willis Towers Watson and Willis Towers Watson client use only. 50
Top 25 Alternative Asset Managers
Fund of Funds assets managed by the top 25 fund managers amounted to USD 94.6 bn in 2016.
Direct Private Equity Funds and Direct Hedge Funds made up the majority of Fund of Funds assets.
Fund of Funds also allocated to Real Estate Strategies, Direct Infrastructure Funds and Illiquid Credit
in smaller amounts.
There were no allocations to Direct Commodities Funds, Natural Resources and Insurance-Linked
Investments in this sample.
Top 25 Alternative Asset Managers by Fund of Funds Assets
Top 25Average Smallest Largest
USD million
Fund of Funds assets 3,784.8 1,628.0 10,200.0
Total assets 26,962.4 6,175.0 116,764.2
Overall Ranking Average Total AuM No. of Managers
Fund of Funds assets 756.1 179,186.9 237
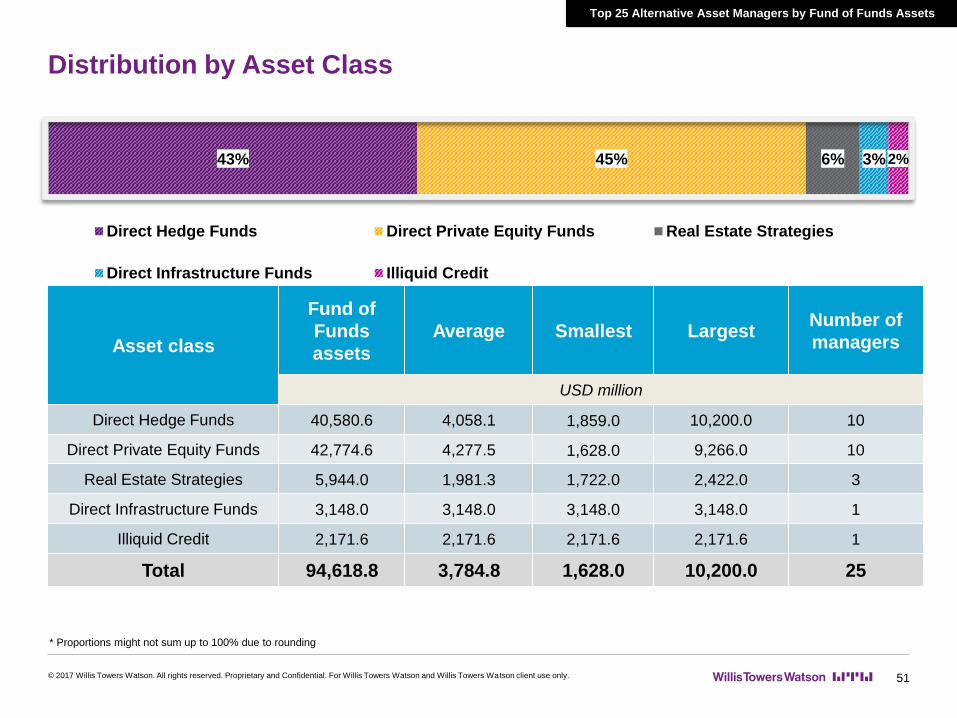
Distribution by Asset Class
© 2017 Willis Towers Watson. All rights reserved. Proprietary and Confidential. For Willis Towers Watson and Willis Towers Watson client use only. 51
* Proportions might not sum up to 100% due to rounding
Top 25 Alternative Asset Managers by Fund of Funds Assets
43% 45% 6% 3%2%
Direct Hedge Funds Direct Private Equity Funds Real Estate Strategies
Direct Infrastructure Funds Illiquid Credit
Asset class
Fund of
Funds
assets
Average Smallest LargestNumber of
managers
USD million
Direct Hedge Funds 40,580.6 4,058.1 1,859.0 10,200.0 10
Direct Private Equity Funds 42,774.6 4,277.5 1,628.0 9,266.0 10
Real Estate Strategies 5,944.0 1,981.3 1,722.0 2,422.0 3
Direct Infrastructure Funds 3,148.0 3,148.0 3,148.0 3,148.0 1
Illiquid Credit 2,171.6 2,171.6 2,171.6 2,171.6 1
Total 94,618.8 3,784.8 1,628.0 10,200.0 25
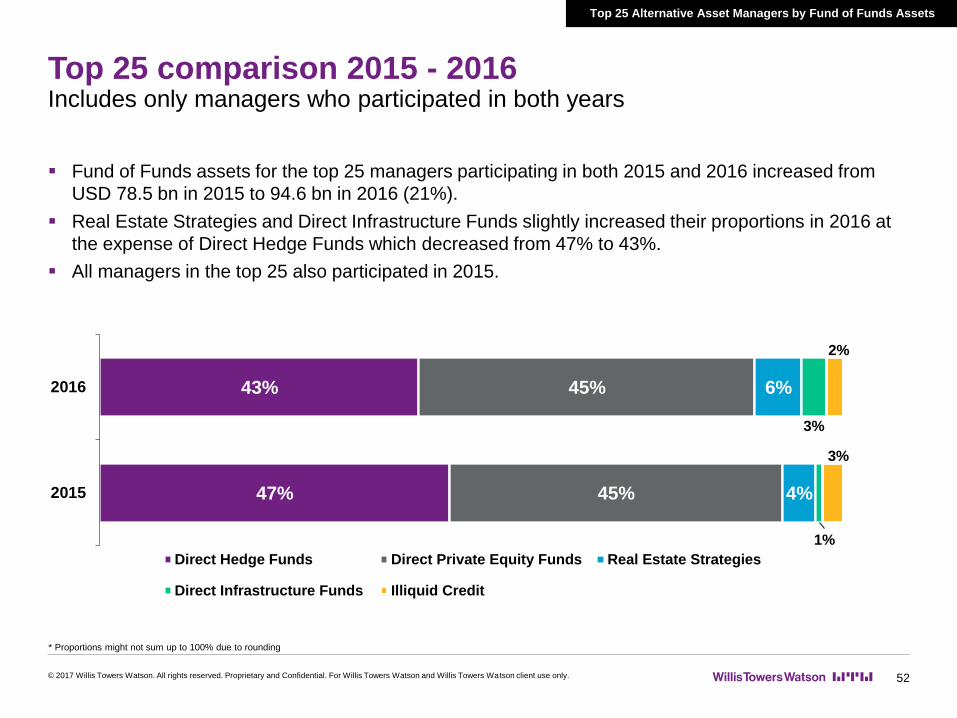
Top 25 comparison 2015 - 2016
© 2017 Willis Towers Watson. All rights reserved. Proprietary and Confidential. For Willis Towers Watson and Willis Towers Watson client use only. 52
Includes only managers who participated in both years
Fund of Funds assets for the top 25 managers participating in both 2015 and 2016 increased from
USD 78.5 bn in 2015 to 94.6 bn in 2016 (21%).
Real Estate Strategies and Direct Infrastructure Funds slightly increased their proportions in 2016 at
the expense of Direct Hedge Funds which decreased from 47% to 43%.
All managers in the top 25 also participated in 2015.
Top 25 Alternative Asset Managers by Fund of Funds Assets
47%
43%
45%
45%
4%
6%
1%
3%
3%
2%
2015
2016
Direct Hedge Funds Direct Private Equity Funds Real Estate Strategies
Direct Infrastructure Funds Illiquid Credit
* Proportions might not sum up to 100% due to rounding
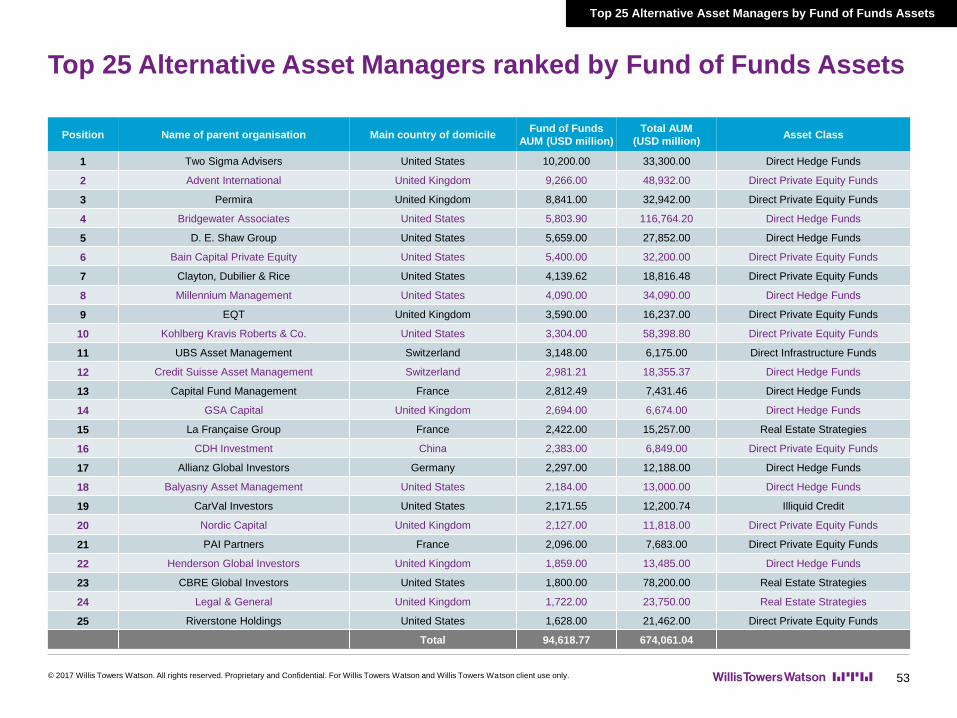
Top 25 Alternative Asset Managers ranked by Fund of Funds Assets
© 2017 Willis Towers Watson. All rights reserved. Proprietary and Confidential. For Willis Towers Watson and Willis Towers Watson client use only. 53
Top 25 Alternative Asset Managers by Fund of Funds Assets
Position Name of parent organisation Main country of domicileFund of Funds
AUM (USD million)
Total AUM
(USD million)Asset Class
1 Two Sigma Advisers United States 10,200.00 33,300.00 Direct Hedge Funds
2 Advent International United Kingdom 9,266.00 48,932.00 Direct Private Equity Funds
3 Permira United Kingdom 8,841.00 32,942.00 Direct Private Equity Funds
4 Bridgewater Associates United States 5,803.90 116,764.20 Direct Hedge Funds
5 D. E. Shaw Group United States 5,659.00 27,852.00 Direct Hedge Funds
6 Bain Capital Private Equity United States 5,400.00 32,200.00 Direct Private Equity Funds
7 Clayton, Dubilier & Rice United States 4,139.62 18,816.48 Direct Private Equity Funds
8 Millennium Management United States 4,090.00 34,090.00 Direct Hedge Funds
9 EQT United Kingdom 3,590.00 16,237.00 Direct Private Equity Funds
10 Kohlberg Kravis Roberts & Co. United States 3,304.00 58,398.80 Direct Private Equity Funds
11 UBS Asset Management Switzerland 3,148.00 6,175.00 Direct Infrastructure Funds
12 Credit Suisse Asset Management Switzerland 2,981.21 18,355.37 Direct Hedge Funds
13 Capital Fund Management France 2,812.49 7,431.46 Direct Hedge Funds
14 GSA Capital United Kingdom 2,694.00 6,674.00 Direct Hedge Funds
15 La Française Group France 2,422.00 15,257.00 Real Estate Strategies
16 CDH Investment China 2,383.00 6,849.00 Direct Private Equity Funds
17 Allianz Global Investors Germany 2,297.00 12,188.00 Direct Hedge Funds
18 Balyasny Asset Management United States 2,184.00 13,000.00 Direct Hedge Funds
19 CarVal Investors United States 2,171.55 12,200.74 Illiquid Credit
20 Nordic Capital United Kingdom 2,127.00 11,818.00 Direct Private Equity Funds
21 PAI Partners France 2,096.00 7,683.00 Direct Private Equity Funds
22 Henderson Global Investors United Kingdom 1,859.00 13,485.00 Direct Hedge Funds
23 CBRE Global Investors United States 1,800.00 78,200.00 Real Estate Strategies
24 Legal & General United Kingdom 1,722.00 23,750.00 Real Estate Strategies
25 Riverstone Holdings United States 1,628.00 21,462.00 Direct Private Equity Funds
Total 94,618.77 674,061.04
Top 25 Alternative Asset Managers by
Wealth Manager Assets
Section 3.F
© 2017 Willis Towers Watson. All rights reserved. Proprietary and Confidential. For Willis Towers Watson and Willis Towers Watson client use only.

Executive summary
© 2017 Willis Towers Watson. All rights reserved. Proprietary and Confidential. For Willis Towers Watson and Willis Towers Watson client use only. 55
Top 25 Alternative Asset Managers
Wealth Management assets managed by the top 25 fund managers amounted to USD 449.8 bn in
2016.
Real Estate Strategies are the most popular alternative assets for Wealth Management firms followed
by Direct Hedge Funds, Direct Infrastructure Funds, Funds of Hedge Funds, Private Equity Funds of
Funds, Direct Private Equity Funds and Illiquid Credit.
There were no Wealth Manager investments in Direct Commodities Funds, Natural Resources and
Insurance-Linked Investments in this sample.
Top 25 Alternative Asset Managers by Wealth Manager Assets
Top 25Average Smallest Largest
USD million
Wealth Manager assets 17,993.9 11,554.5 35,215.0
Total assets 44,117.8 12,882.3 96,161.7
Overall Ranking Average Total AuM No. of Managers
Wealth Manager assets 2,552.9 1,087,527.6 426
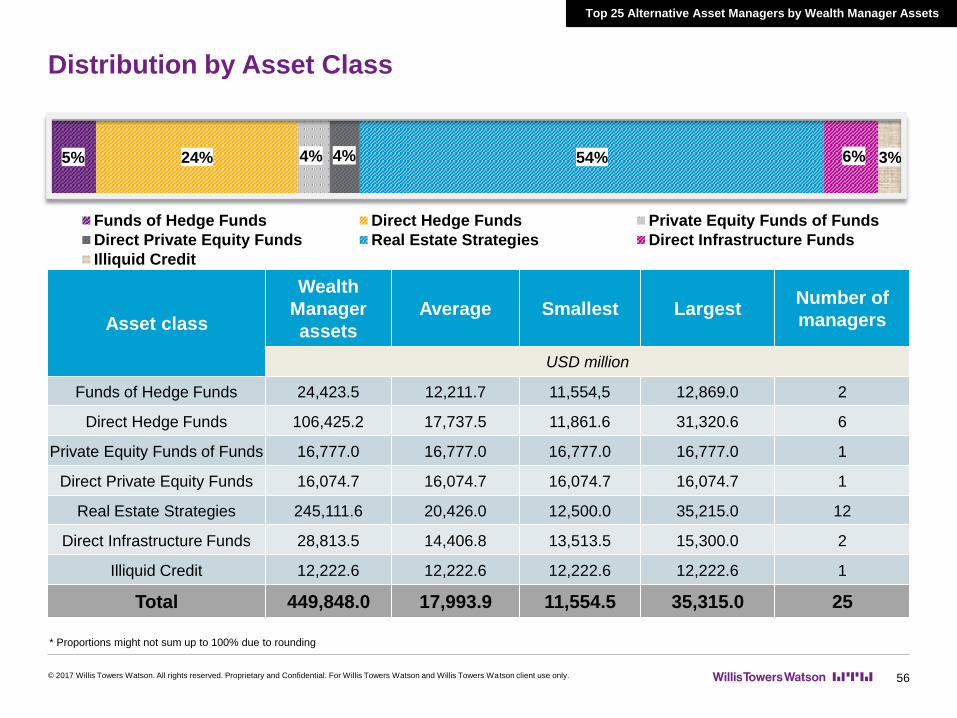
Distribution by Asset Class
5% 24% 4% 4% 54% 6% 3%
Funds of Hedge Funds Direct Hedge Funds Private Equity Funds of Funds
Direct Private Equity Funds Real Estate Strategies Direct Infrastructure Funds
Illiquid Credit
Top 25 Alternative Asset Managers by Wealth Manager Assets
© 2017 Willis Towers Watson. All rights reserved. Proprietary and Confidential. For Willis Towers Watson and Willis Towers Watson client use only. 56
* Proportions might not sum up to 100% due to rounding
Asset class
Wealth
Manager
assets
Average Smallest LargestNumber of
managers
USD million
Funds of Hedge Funds 24,423.5 12,211.7 11,554,5 12,869.0 2
Direct Hedge Funds 106,425.2 17,737.5 11,861.6 31,320.6 6
Private Equity Funds of Funds 16,777.0 16,777.0 16,777.0 16,777.0 1
Direct Private Equity Funds 16,074.7 16,074.7 16,074.7 16,074.7 1
Real Estate Strategies 245,111.6 20,426.0 12,500.0 35,215.0 12
Direct Infrastructure Funds 28,813.5 14,406.8 13,513.5 15,300.0 2
Illiquid Credit 12,222.6 12,222.6 12,222.6 12,222.6 1
Total 449,848.0 17,993.9 11,554.5 35,315.0 25

Top 25 comparison 2015 - 2016
© 2017 Willis Towers Watson. All rights reserved. Proprietary and Confidential. For Willis Towers Watson and Willis Towers Watson client use only. 57
Includes only managers who participated in both years
Wealth Manager assets for the top 25 managers participating in both 2015 and 2016 increased from
USD 370.4 bn in 2015 to USD 419.8 bn in 2016 (13%).
Real Estate Strategies attracted the largest amount of Wealth Manager assets in 2015 and 2016, with
allocations in the top 25 with a steady 54%.
Proportions remained broadly unchanged for the remaining asset classes with a slight increase in
Private Equity Funds of Funds at the expense of Direct Hedge Funds.
There are 23 managers in the top 25 that also participated in 2015.
7%
6%
23%
22%
2%
4%
6%
4%
54%
54%
7%
7%
3%
3%
2015
2016
Funds of Hedge Funds Direct Hedge Funds Private Equity Funds of Funds
Direct Private Equity Funds Real Estate Strategies Direct Infrastructure Funds
Illiquid Credit
Top 25 Alternative Asset Managers by Wealth Manager Assets
* Proportions might not sum up to 100% due to rounding

Top 25 Alternative Asset Managers ranked by Wealth Manager
Assets
© 2017 Willis Towers Watson. All rights reserved. Proprietary and Confidential. For Willis Towers Watson and Willis Towers Watson client use only. 58
Top 25 Alternative Asset Managers by Wealth Manager Assets
Position Name of parent organisation Main country of domicileWealth Managers
AUM (USD million)
Total AUM
(USD million)Asset Class
1 UBS Asset Management Switzerland 35,215.00 78,031.00 Real Estate Strategies
2 Renaissance Technologies United States 31,320.60 38,795.20 Direct Hedge Funds
3 Hines United States 30,214.00 54,004.00 Real Estate Strategies
4 Union Investment Germnay 30,211.62 36,494.35 Real Estate Strategies
5 Deutsche Asset Management Germany 22,286.00 46,193.00 Real Estate Strategies
6 Brookfield Asset Management Canada 22,081.00 54,642.00 Real Estate Strategies
7 Millennium Management United States 18,140.00 34,090.00 Direct Hedge Funds
8 Man Group United Kingdom 17,520.00 54,668.00 Direct Hedge Funds
9 J.P. Morgan Asset Management United States 17,271.00 61,346.40 Real Estate Strategies
10 Cohen & Steers Capital Management United States 16,885.00 38,920.00 Real Estate Strategies
11 Pathway Capital Management United States 16,777.00 44,636.00 Private Equity FoF
12 Kohlberg Kravis Roberts & Co. United States 16,074.70 58,398.80 Direct Private Equity Funds
13 LaSalle Investment Management United States 15,853.00 53,160.00 Real Estate Strategies
14 Brookfield Asset Management Canada 15,300.00 40,139.00 Direct Infrastructure Funds
15 Fidelity International Bermuda 14,473.76 15,433.47 Real Estate Strategies
16 Prologis United States 14,421.20 29,753.20 Real Estate Strategies
17 Platinum Asset Management Australia 14,400.00 18,000.00 Direct Hedge Funds
18 CBRE Global Investors United States 13,700.00 78,200.00 Real Estate Strategies
19 Macquarie Group Australia 13,513.51 96,161.72 Direct Infrastructure Funds
20 HSBC Alternative Investment Group United Kingdom 13,183.00 13,702.00 Direct Hedge Funds
21 Morgan Stanley Investment Management United States 12,869.00 22,300.00 Funds of Hedge Funds
22 Amundi France 12,500.00 20,500.00 Real Estate Strategies
23 Alcentra United Kingdom 12,222.60 31,374.50 Illiquid Credit
24 Goldman Sachs Asset Management United States 11,861.60 12,882.30 Direct Hedge Funds
25 Blackstone United States 11,554.45 71,119.70 Funds of Hedge Funds
Total 449,848.04 1,102,944.64
Top 25 Alternative Asset Managers by Bank
Assets
Section 3.G
© 2017 Willis Towers Watson. All rights reserved. Proprietary and Confidential. For Willis Towers Watson and Willis Towers Watson client use only.
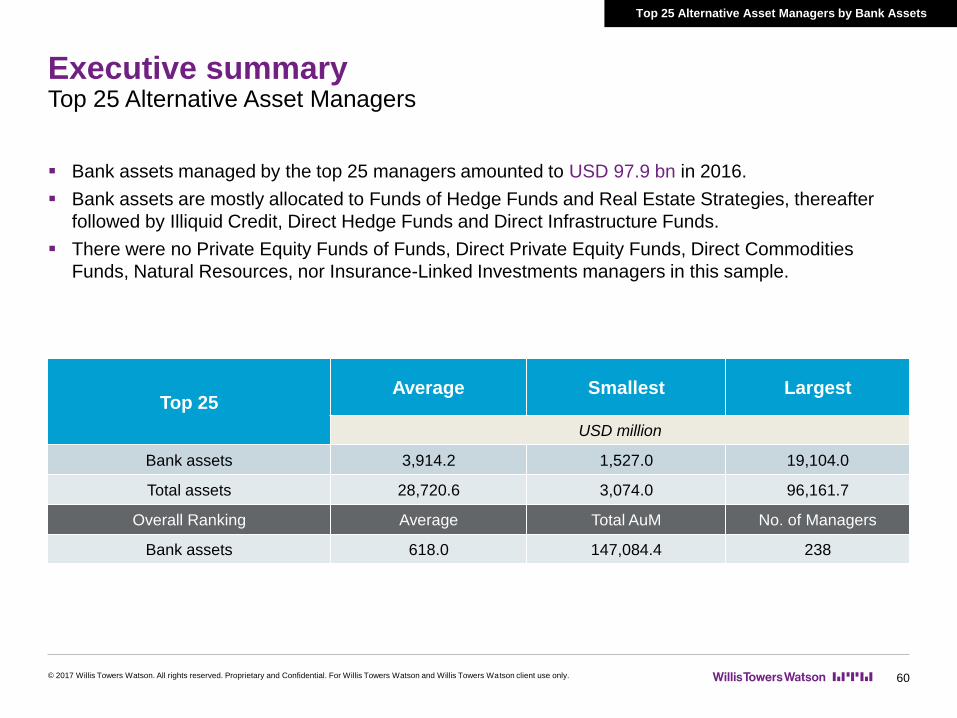
Executive summary
© 2017 Willis Towers Watson. All rights reserved. Proprietary and Confidential. For Willis Towers Watson and Willis Towers Watson client use only. 60
Top 25 Alternative Asset Managers
Bank assets managed by the top 25 managers amounted to USD 97.9 bn in 2016.
Bank assets are mostly allocated to Funds of Hedge Funds and Real Estate Strategies, thereafter
followed by Illiquid Credit, Direct Hedge Funds and Direct Infrastructure Funds.
There were no Private Equity Funds of Funds, Direct Private Equity Funds, Direct Commodities
Funds, Natural Resources, nor Insurance-Linked Investments managers in this sample.
Top 25 Alternative Asset Managers by Bank Assets
Top 25Average Smallest Largest
USD million
Bank assets 3,914.2 1,527.0 19,104.0
Total assets 28,720.6 3,074.0 96,161.7
Overall Ranking Average Total AuM No. of Managers
Bank assets 618.0 147,084.4 238
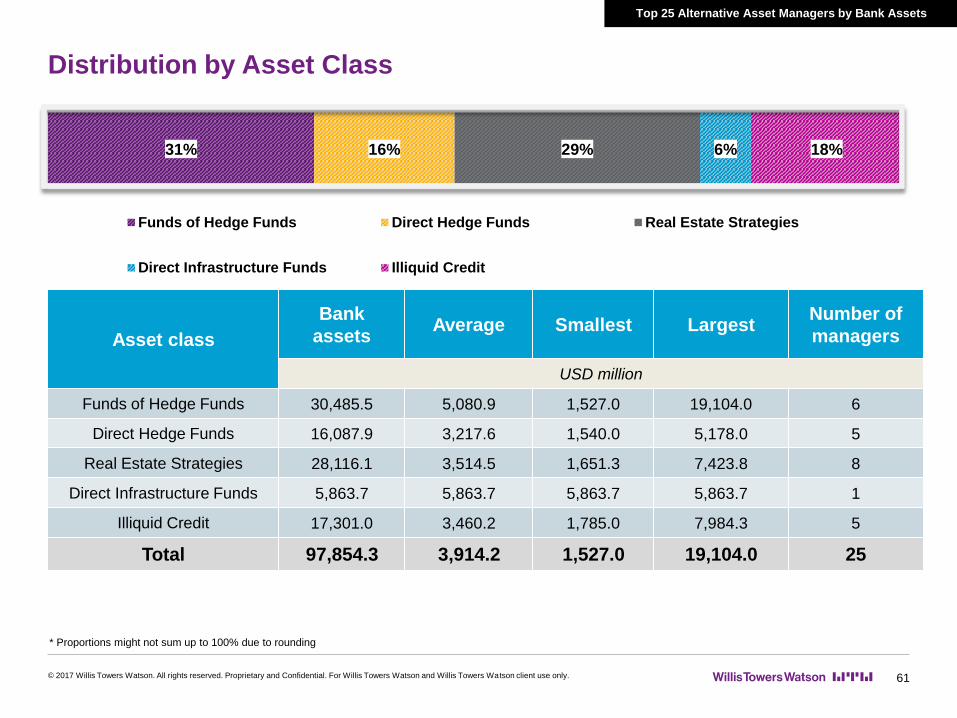
31% 16% 29% 6% 18%
Funds of Hedge Funds Direct Hedge Funds Real Estate Strategies
Direct Infrastructure Funds Illiquid Credit
Distribution by Asset Class
© 2017 Willis Towers Watson. All rights reserved. Proprietary and Confidential. For Willis Towers Watson and Willis Towers Watson client use only. 61
Top 25 Alternative Asset Managers by Bank Assets
* Proportions might not sum up to 100% due to rounding
Asset class
Bank
assetsAverage Smallest Largest
Number of
managers
USD million
Funds of Hedge Funds 30,485.5 5,080.9 1,527.0 19,104.0 6
Direct Hedge Funds 16,087.9 3,217.6 1,540.0 5,178.0 5
Real Estate Strategies 28,116.1 3,514.5 1,651.3 7,423.8 8
Direct Infrastructure Funds 5,863.7 5,863.7 5,863.7 5,863.7 1
Illiquid Credit 17,301.0 3,460.2 1,785.0 7,984.3 5
Total 97,854.3 3,914.2 1,527.0 19,104.0 25
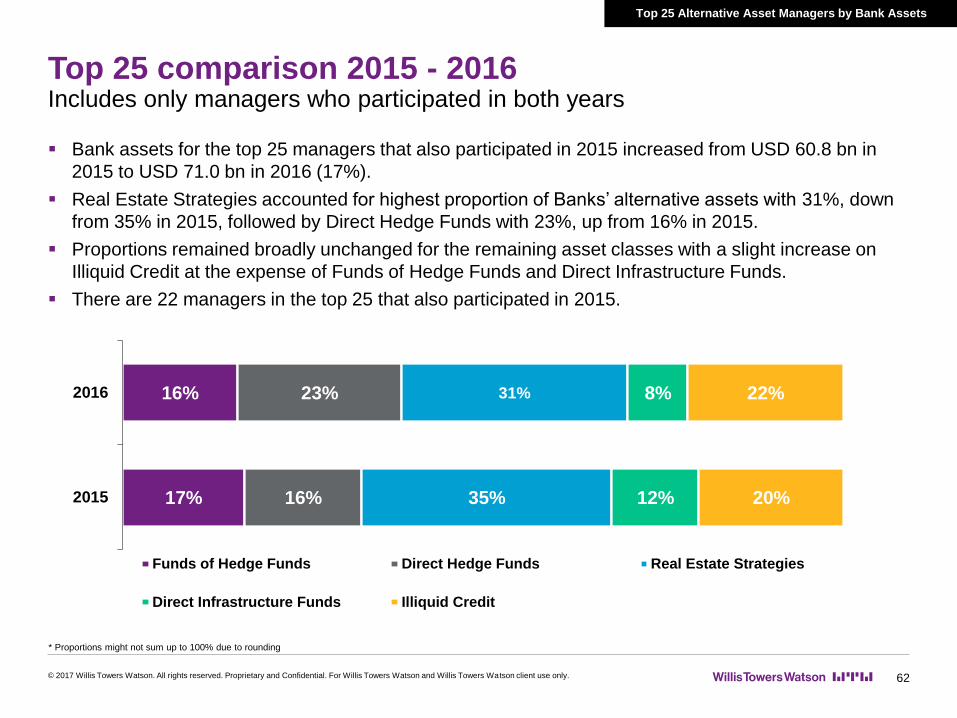
Top 25 comparison 2015 - 2016
© 2017 Willis Towers Watson. All rights reserved. Proprietary and Confidential. For Willis Towers Watson and Willis Towers Watson client use only. 62
Includes only managers who participated in both years
Bank assets for the top 25 managers that also participated in 2015 increased from USD 60.8 bn in
2015 to USD 71.0 bn in 2016 (17%).
Real Estate Strategies accounted for highest proportion of Banks’ alternative assets with 31%, down
from 35% in 2015, followed by Direct Hedge Funds with 23%, up from 16% in 2015.
Proportions remained broadly unchanged for the remaining asset classes with a slight increase on
Illiquid Credit at the expense of Funds of Hedge Funds and Direct Infrastructure Funds.
There are 22 managers in the top 25 that also participated in 2015.
17%
16%
16%
23%
35%
31%
12%
8%
20%
22%
2015
2016
Funds of Hedge Funds Direct Hedge Funds Real Estate Strategies
Direct Infrastructure Funds Illiquid Credit
Top 25 Alternative Asset Managers by Bank Assets
* Proportions might not sum up to 100% due to rounding

Top 25 Alternative Asset Managers ranked by Bank Assets
Top 25 Alternative Asset Managers by Bank Assets
© 2017 Willis Towers Watson. All rights reserved. Proprietary and Confidential. For Willis Towers Watson and Willis Towers Watson client use only. 63
Position Name of parent organisation Main country of domicileBanks AUM
(USD million)
Total AUM
(USD million)Asset Class
1 UBS Asset Management Switzerland 19,104.00 33,630.00 Funds of Hedge Funds
2 Alcentra United Kingdom 7,984.30 31,374.50 Illiquid Credit
3 Credit Suisse Asset Management Switzerland 7,423.78 43,199.82 Real Estate Strategies
4 Macquarie Group Australia 5,863.74 96,161.72 Direct Infrastructure Funds
5 PATRIZIA Immobilien Germany 5,800.00 19,650.00 Real Estate Strategies
6 Man Group United Kingdom 5,178.00 54,668.00 Direct Hedge Funds
7 Balyasny Asset Management United States 4,953.00 13,000.00 Direct Hedge Funds
8 Union Investment Germnay 3,922.93 36,494.35 Real Estate Strategies
9 Ares Management United States 3,687.24 14,283.55 Illiquid Credit
10 Hines United States 2,805.00 54,004.00 Real Estate Strategies
11 LGT Capital Partners Switzerland 2,738.03 10,123.26 Funds of Hedge Funds
12 Allianz Global Investors Germany 2,727.00 3,074.00 Funds of Hedge Funds
13 Credit Suisse Asset Management Switzerland 2,606.94 18,355.37 Direct Hedge Funds
14 UBS Asset Management Switzerland 2,584.00 78,031.00 Real Estate Strategies
15 GCM Grosvenor United States 2,470.80 25,886.30 Funds of Hedge Funds
16 Berkshire Group United States 2,203.45 4,176.95 Real Estate Strategies
17 BNP Paribas Investment Partners France 1,958.77 5,036.42 Illiquid Credit
18 Abbey Capital Ireland 1,918.69 3,577.63 Funds of Hedge Funds
19 AXA Investment Managers France 1,885.70 28,824.38 Illiquid Credit
20 Brigade Capital United States 1,810.00 18,380.00 Direct Hedge Funds
21 Allianz Global Investors Germany 1,785.00 14,606.00 Illiquid Credit
22 AXA Investment Managers France 1,725.60 56,506.60 Real Estate Strategies
23 Columbia Threadneedle Investments United States 1,651.30 8,830.10 Real Estate Strategies
24 Two Sigma Advisers United States 1,540.00 33,300.00 Direct Hedge Funds
25 Man Group United Kingdom 1,527.00 12,841.00 Funds of Hedge Funds
Total 97,854.27 718,014.95

Total Universe
Section 4
How to read this section
This section shows the total universe of all survey participants, ranked by total assets under management in
each individual alternatives asset class. It also includes regions in which they invest and where the
managers are domiciled.
© 2017 Willis Towers Watson. All rights reserved. Proprietary and Confidential. For Willis Towers Watson and Willis Towers Watson client use only.
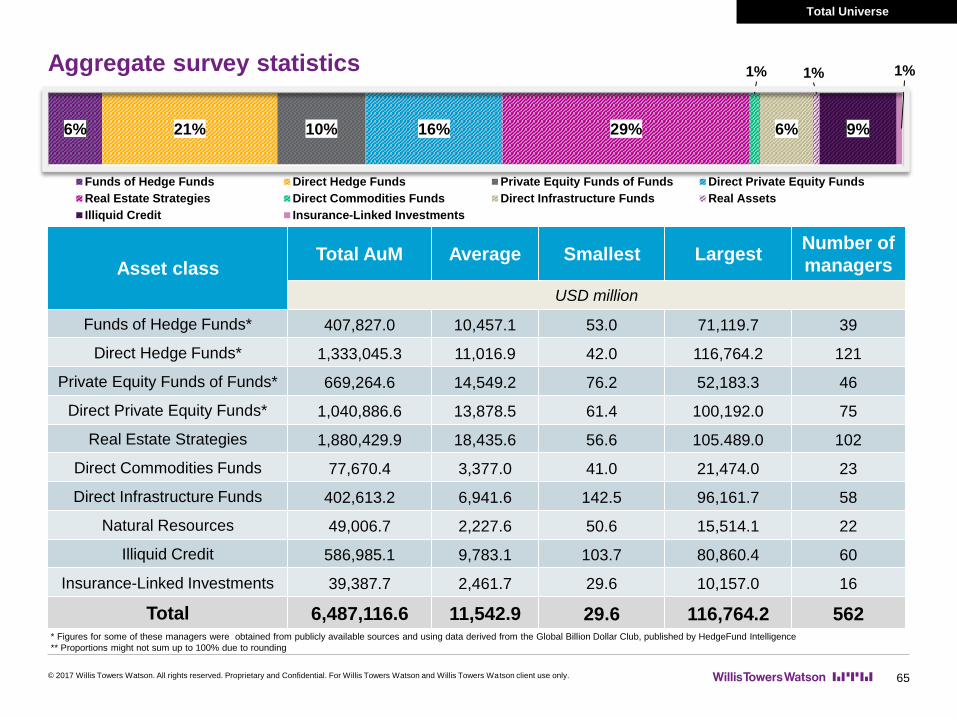
6% 21% 10% 16% 29%
1%
6%
1%
9%
1%
Funds of Hedge Funds Direct Hedge Funds Private Equity Funds of Funds Direct Private Equity Funds
Real Estate Strategies Direct Commodities Funds Direct Infrastructure Funds Real Assets
Illiquid Credit Insurance-Linked Investments
Asset classTotal AuM Average Smallest Largest
Number of
managers
USD million
Funds of Hedge Funds* 407,827.0 10,457.1 53.0 71,119.7 39
Direct Hedge Funds* 1,333,045.3 11,016.9 42.0 116,764.2 121
Private Equity Funds of Funds* 669,264.6 14,549.2 76.2 52,183.3 46
Direct Private Equity Funds* 1,040,886.6 13,878.5 61.4 100,192.0 75
Real Estate Strategies 1,880,429.9 18,435.6 56.6 105.489.0 102
Direct Commodities Funds 77,670.4 3,377.0 41.0 21,474.0 23
Direct Infrastructure Funds 402,613.2 6,941.6 142.5 96,161.7 58
Natural Resources 49,006.7 2,227.6 50.6 15,514.1 22
Illiquid Credit 586,985.1 9,783.1 103.7 80,860.4 60
Insurance-Linked Investments 39,387.7 2,461.7 29.6 10,157.0 16
Total 6,487,116.6 11,542.9 29.6 116,764.2 562
Total Universe
* Figures for some of these managers were obtained from publicly available sources and using data derived from the Global Billion Dollar Club, published by HedgeFund Intelligence
** Proportions might not sum up to 100% due to rounding
Aggregate survey statistics
© 2017 Willis Towers Watson. All rights reserved. Proprietary and Confidential. For Willis Towers Watson and Willis Towers Watson client use only. 65

Aggregate survey statistics by investor type
© 2017 Willis Towers Watson. All rights reserved. Proprietary and Confidential. For Willis Towers Watson and Willis Towers Watson client use only. 66
Total Universe
34% 11% 5% 3%3% 17% 2% 24%
Pension Fund Insurance Company Sovereign Wealth Fund
Endowment and Foundation Fund of Funds Wealth Manager
Bank Other
* The category “Other” has been included for assets that could not be allocated into the survey’s categories, it has not been analysed in detail.
Asset class
Total
AuMAverage Smallest Largest
Number of
managers
USD million
Pension Fund 2,210,734.5 4,733.9 0.4 90,512.7 467
Insurance Company 738,942.5 2,013.5 0.8 71,371.9 367
Sovereign Wealth Funds 344,282.2 1,393.9 0.1 23,310.2 247
Endowment and Foundation 191,541.7 545.7 0.7 10,898.0 351
Fund of Funds 179,186.9 756.1 0.4 10,200.0 237
Wealth Manager 1,087,527.6 2,552.9 1.1 35,215.0 426
Bank 147,084.3 618.0 0.1 19,104.0 238
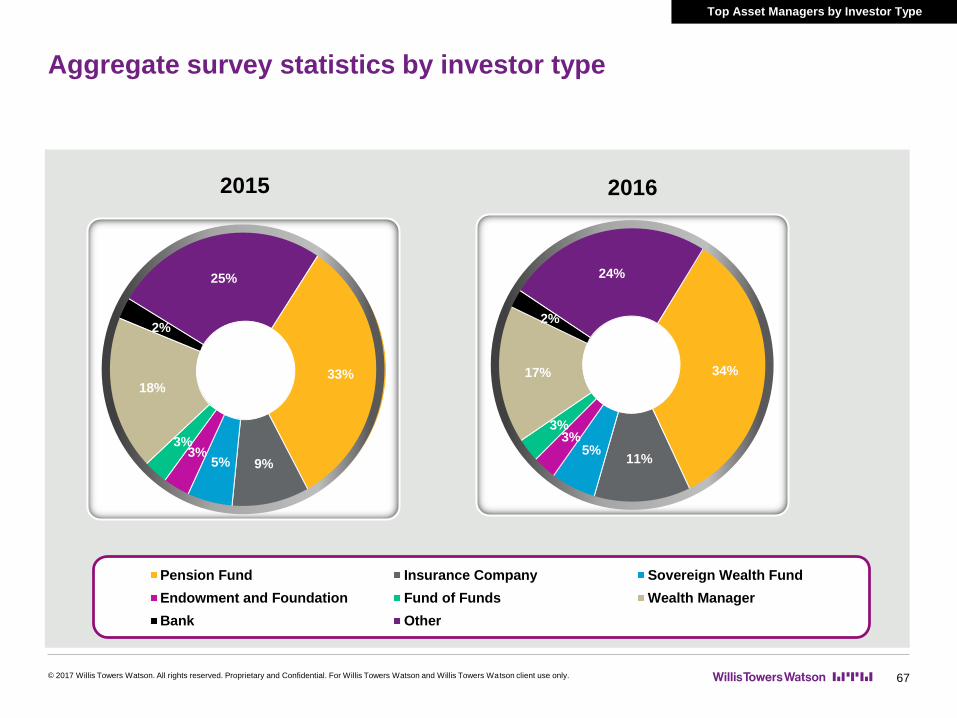
Aggregate survey statistics by investor type
© 2017 Willis Towers Watson. All rights reserved. Proprietary and Confidential. For Willis Towers Watson and Willis Towers Watson client use only. 67
Top Asset Managers by Investor Type
33%
9%5%3%
3%
18%
2%
25%
2015
Pension Fund Insurance Company Sovereign Wealth Fund
Endowment and Foundation Fund of Funds Wealth Manager
Bank Other
34%
11%5%
3%3%
17%
2%
24%
2016
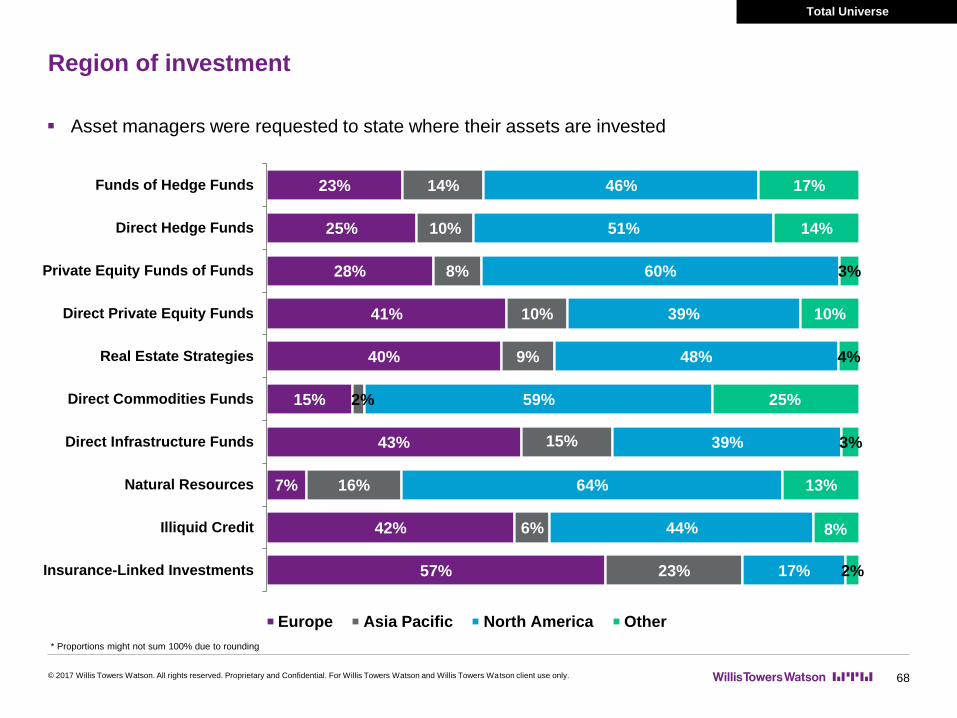
Total Universe
57%
42%
7%
43%
15%
40%
41%
28%
25%
23%
23%
6%
16%
15%
2%
9%
10%
8%
10%
14%
17%
44%
64%
39%
59%
48%
39%
60%
51%
46%
2%
8%
13%
3%
25%
4%
10%
3%
14%
17%
Insurance-Linked Investments
Illiquid Credit
Natural Resources
Direct Infrastructure Funds
Direct Commodities Funds
Real Estate Strategies
Direct Private Equity Funds
Private Equity Funds of Funds
Direct Hedge Funds
Funds of Hedge Funds
Europe Asia Pacific North America Other
* Proportions might not sum 100% due to rounding
Region of investment
© 2017 Willis Towers Watson. All rights reserved. Proprietary and Confidential. For Willis Towers Watson and Willis Towers Watson client use only. 68
Asset managers were requested to state where their assets are invested

Region of investment (aggregated) and domicile
© 2017 Willis Towers Watson. All rights reserved. Proprietary and Confidential. For Willis Towers Watson and Willis Towers Watson client use only. 69
Around 59% of the managers domiciled in Europe are based in the UK; 18% are in Switzerland and
12% are in France.
Around 89% of North America managers are domiciled in the US.
Asia Pacific is represented by 47 managers from Australia, China, Hong Kong, New Zealand and
Singapore.
Total Universe
35% 10% 48% 7%
* Proportions might not sum 100% due to rounding
Distribution by investment
Distribution by domicile
29% 5% 66%
Europe Asia Pacific Central/North America Other
<1%

Five-year comparison
© 2017 Willis Towers Watson. All rights reserved. Proprietary and Confidential. For Willis Towers Watson and Willis Towers Watson client use only. 70
Year-on-year growth in the total assets managed by the
31 Funds of Hedge Fund managers that participated in
the last five years has averaged 7%, however they
remained unchanged during 2016.
Total assets managed by the 34 Private Equity Funds of
Funds managers that participated in the last five years
have shown continuous growth over the period, averaging
9% year-on-year growth since 2012.
After a modest decline in 2013, total assets managed by
the Real Estate Strategies managers that participated in
the last five years grew significantly in 2016, up 6% on the
previous year.
Total assets managed by the 18 Direct Commodities Fund
Managers that have participated in the last five years
recovered in 2016 from their decline since 2012 and
increased 22% compared to 2015. Total assets fell 57%
since 2012.
Total assets managed by the 39 Direct Infrastructure Fund
Managers that have participated in the last five years have
been growing steadily since 2012 and increased by 10%
in 2016.
Total assets managed by the 81 Direct Hedge Fund
managers that have participated in the last five years have
seen a steady increase, averaging 9% year-on-year
growth since 2012.
Total assets managed by the 42 Direct Private Equity
Fund Managers that participated in the last five years
grew by 9% in 2016 after a slight decrease in 2014.
Managers that have participated for the past five years
0
20
40
60
80
100
120
140
160
Dec-12 Dec-13 Dec-14 Dec-15 Dec-16
Ind
ex D
ec 2
01
2 =
100
Funds of Hedge Funds Private Equity Funds of Funds
Real Estate Strategies Direct Commodities Funds
Direct Infrastructure Funds Direct Hedge Funds
Direct Private Equity Funds
AuM Variation
Total Universe
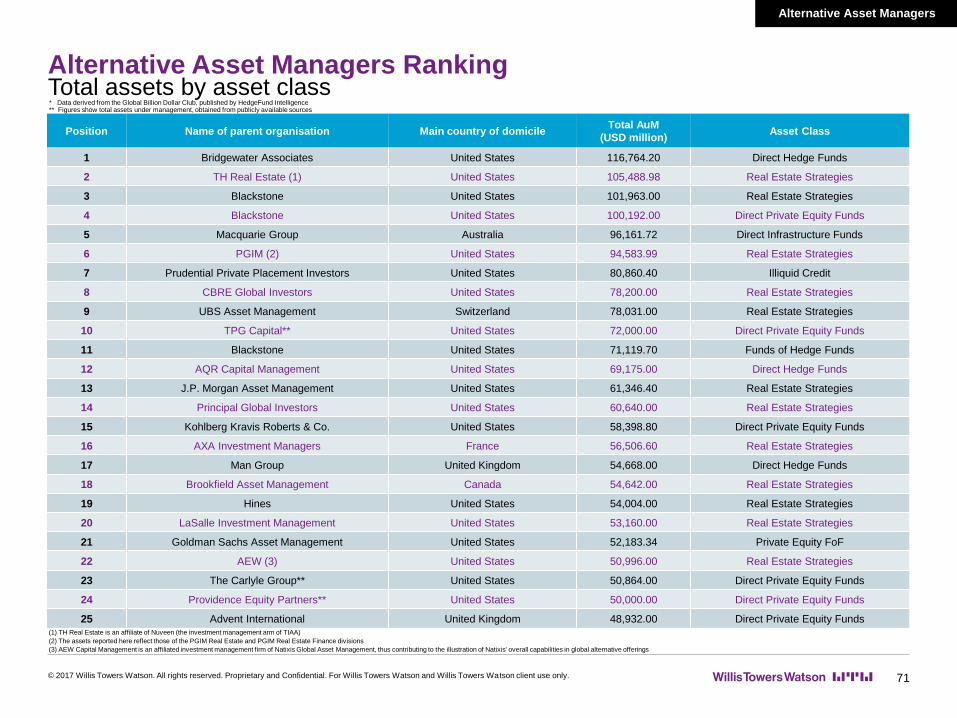
Position Name of parent organisation Main country of domicileTotal AuM
(USD million)Asset Class
1 Bridgewater Associates United States 116,764.20 Direct Hedge Funds
2 TH Real Estate (1) United States 105,488.98 Real Estate Strategies
3 Blackstone United States 101,963.00 Real Estate Strategies
4 Blackstone United States 100,192.00 Direct Private Equity Funds
5 Macquarie Group Australia 96,161.72 Direct Infrastructure Funds
6 PGIM (2) United States 94,583.99 Real Estate Strategies
7 Prudential Private Placement Investors United States 80,860.40 Illiquid Credit
8 CBRE Global Investors United States 78,200.00 Real Estate Strategies
9 UBS Asset Management Switzerland 78,031.00 Real Estate Strategies
10 TPG Capital** United States 72,000.00 Direct Private Equity Funds
11 Blackstone United States 71,119.70 Funds of Hedge Funds
12 AQR Capital Management United States 69,175.00 Direct Hedge Funds
13 J.P. Morgan Asset Management United States 61,346.40 Real Estate Strategies
14 Principal Global Investors United States 60,640.00 Real Estate Strategies
15 Kohlberg Kravis Roberts & Co. United States 58,398.80 Direct Private Equity Funds
16 AXA Investment Managers France 56,506.60 Real Estate Strategies
17 Man Group United Kingdom 54,668.00 Direct Hedge Funds
18 Brookfield Asset Management Canada 54,642.00 Real Estate Strategies
19 Hines United States 54,004.00 Real Estate Strategies
20 LaSalle Investment Management United States 53,160.00 Real Estate Strategies
21 Goldman Sachs Asset Management United States 52,183.34 Private Equity FoF
22 AEW (3) United States 50,996.00 Real Estate Strategies
23 The Carlyle Group** United States 50,864.00 Direct Private Equity Funds
24 Providence Equity Partners** United States 50,000.00 Direct Private Equity Funds
25 Advent International United Kingdom 48,932.00 Direct Private Equity Funds
Total assets by asset class
Alternative Asset Managers
* Data derived from the Global Billion Dollar Club, published by HedgeFund Intelligence** Figures show total assets under management, obtained from publicly available sources
Alternative Asset Managers Ranking
© 2017 Willis Towers Watson. All rights reserved. Proprietary and Confidential. For Willis Towers Watson and Willis Towers Watson client use only. 71
(2) The assets reported here reflect those of the PGIM Real Estate and PGIM Real Estate Finance divisions
(3) AEW Capital Management is an affiliated investment management firm of Natixis Global Asset Management, thus contributing to the illustration of Natixis' overall capabilities in global alternative offerings
(1) TH Real Estate is an affiliate of Nuveen (the investment management arm of TIAA)

Total assets by asset class
Alternative Asset Managers
Alternative Asset Managers Ranking
© 2017 Willis Towers Watson. All rights reserved. Proprietary and Confidential. For Willis Towers Watson and Willis Towers Watson client use only. 72
* Data derived from the Global Billion Dollar Club, published by HedgeFund Intelligence** Figures show total assets under management, obtained from publicly available sources
Position Name of parent organisation Main country of domicileTotal AuM
(USD million)Asset Class
26 HarbourVest Partners United States 47,333.00 Private Equity FoF
27 Aviva Investors United Kingdom 46,249.00 Real Estate Strategies
28 Deutsche Asset Management Germany 46,193.00 Real Estate Strategies
29 J. P. Morgan Asset Management* United States 45,000.00 Direct Hedge Funds
30 Barings United Kingdom 44,824.94 Real Estate Strategies
31 Pathway Capital Management United States 44,636.00 Private Equity FoF
32 Warburg Pincus** United States 44,000.00 Direct Private Equity Funds
33 Apollo Global Management United States 43,628.00 Direct Private Equity Funds
34 Credit Suisse Asset Management Switzerland 43,199.82 Real Estate Strategies
35 AlpInvest Partners Netherlands 41,434.00 Private Equity FoF
36 Hamilton Lane Advisors United States 40,366.80 Private Equity FoF
37 Brookfield Asset Management Canada 40,139.00 Direct Infrastructure Funds
38 Cohen & Steers Capital Management United States 38,920.00 Real Estate Strategies
39 Renaissance Technologies United States 38,795.20 Direct Hedge Funds
40 Union Investment Germany 36,494.35 Real Estate Strategies
41 Ardian France 35,715.00 Private Equity FoF
42 Pantheon United Kingdom 35,190.00 Private Equity FoF
43 Goldman Sachs Merchant Banking Division United States 35,100.00 Direct Private Equity Funds
44 M&G Investments United Kingdom 34,838.20 Real Estate Strategies
45 Millennium Management United States 34,090.00 Direct Hedge Funds
46 BlackRock United States 33,804.00 Direct Hedge Funds
47 Och-Ziff Capital Management Group United States 33,700.00 Direct Hedge Funds
48 UBS Asset Management Switzerland 33,630.00 Funds of Hedge Funds
49 Two Sigma Advisers United States 33,300.00 Direct Hedge Funds
50 Permira United Kingdom 32,942.00 Direct Private Equity Funds
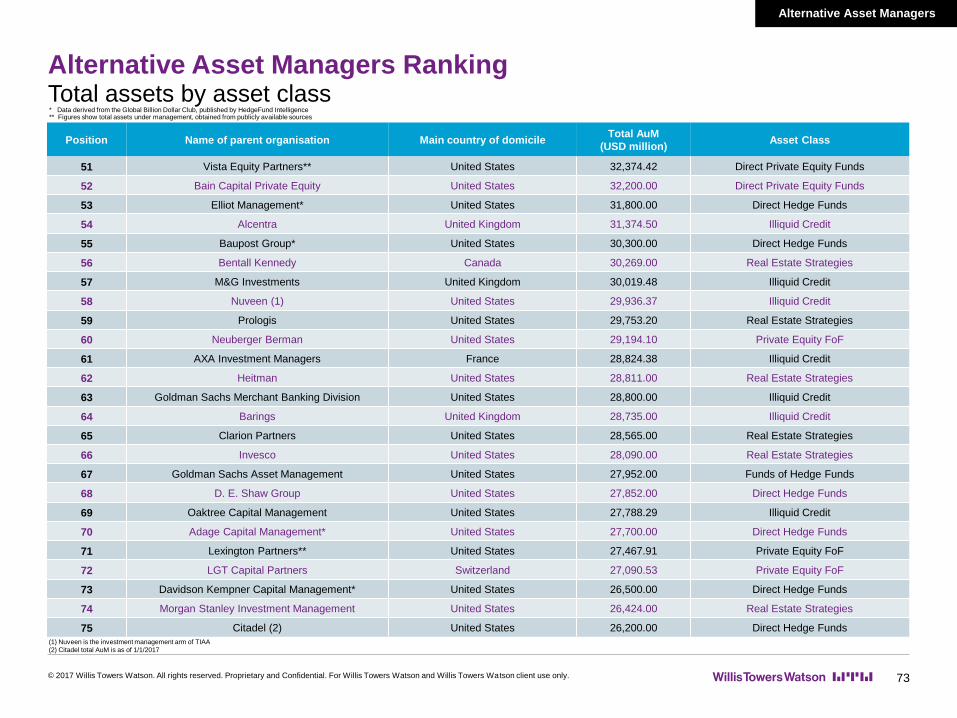
Alternative Asset Managers
Alternative Asset Managers Ranking
© 2017 Willis Towers Watson. All rights reserved. Proprietary and Confidential. For Willis Towers Watson and Willis Towers Watson client use only. 73
Total assets by asset class
Position Name of parent organisation Main country of domicileTotal AuM
(USD million)Asset Class
51 Vista Equity Partners** United States 32,374.42 Direct Private Equity Funds
52 Bain Capital Private Equity United States 32,200.00 Direct Private Equity Funds
53 Elliot Management* United States 31,800.00 Direct Hedge Funds
54 Alcentra United Kingdom 31,374.50 Illiquid Credit
55 Baupost Group* United States 30,300.00 Direct Hedge Funds
56 Bentall Kennedy Canada 30,269.00 Real Estate Strategies
57 M&G Investments United Kingdom 30,019.48 Illiquid Credit
58 Nuveen (1) United States 29,936.37 Illiquid Credit
59 Prologis United States 29,753.20 Real Estate Strategies
60 Neuberger Berman United States 29,194.10 Private Equity FoF
61 AXA Investment Managers France 28,824.38 Illiquid Credit
62 Heitman United States 28,811.00 Real Estate Strategies
63 Goldman Sachs Merchant Banking Division United States 28,800.00 Illiquid Credit
64 Barings United Kingdom 28,735.00 Illiquid Credit
65 Clarion Partners United States 28,565.00 Real Estate Strategies
66 Invesco United States 28,090.00 Real Estate Strategies
67 Goldman Sachs Asset Management United States 27,952.00 Funds of Hedge Funds
68 D. E. Shaw Group United States 27,852.00 Direct Hedge Funds
69 Oaktree Capital Management United States 27,788.29 Illiquid Credit
70 Adage Capital Management* United States 27,700.00 Direct Hedge Funds
71 Lexington Partners** United States 27,467.91 Private Equity FoF
72 LGT Capital Partners Switzerland 27,090.53 Private Equity FoF
73 Davidson Kempner Capital Management* United States 26,500.00 Direct Hedge Funds
74 Morgan Stanley Investment Management United States 26,424.00 Real Estate Strategies
75 Citadel (2) United States 26,200.00 Direct Hedge Funds
* Data derived from the Global Billion Dollar Club, published by HedgeFund Intelligence** Figures show total assets under management, obtained from publicly available sources
(2) Citadel total AuM is as of 1/1/2017
(1) Nuveen is the investment management arm of TIAA

Alternative Asset Managers
Alternative Asset Managers Ranking
© 2017 Willis Towers Watson. All rights reserved. Proprietary and Confidential. For Willis Towers Watson and Willis Towers Watson client use only. 74
Total assets by asset class
Position Name of parent organisation Main country of domicileTotal AuM
(USD million)Asset Class
76 HPS Investment Partners United States 26,070.88 Illiquid Credit
77 GCM Grosvenor United States 25,886.30 Funds of Hedge Funds
78 GSO Capital Partners United States 25,673.00 Illiquid Credit
79 Hellman & Friedman** United States 25,430.30 Direct Private Equity Funds
80 BNP Paribas REIM France 25,267.00 Real Estate Strategies
81 EnTrustPermal* United States 25,200.00 Funds of Hedge Funds
82 IFM Investors Australia 24,893.00 Direct Infrastructure Funds
83 J.P. Morgan Asset Management – Private Equity United States 24,463.00 Private Equity FoF
84 Aberdeen Asset Management United Kingdom 24,154.19 Real Estate Strategies
85 Silver Lake** United States 24,000.00 Direct Private Equity Funds
86 Legal & General United Kingdom 23,750.00 Real Estate Strategies
87 Leonard Green** United States 23,503.99 Direct Private Equity Funds
88 Mashall Wace* United Kingdom 22,870.00 Direct Hedge Funds
89 GCM Grosvenor United States 22,744.60 Private Equity FoF
90 Adams Street Partners United States 22,618.25 Private Equity FoF
91 Morgan Stanley Investment Management United States 22,300.00 Funds of Hedge Funds
92 Farallon Capital Management* United States 22,100.00 Direct Hedge Funds
93 Oak Hill Advisors United States 21,794.90 Illiquid Credit
94 Starwood Capital Group United States 21,680.51 Real Estate Strategies
95 BlackRock United States 21,655.00 Funds of Hedge Funds
96 BlackRock United States 21,474.00 Direct Commodities Funds
97 Riverstone Holdings United States 21,462.00 Direct Private Equity Funds
98 Coller Capital United Kingdom 21,029.00 Private Equity FoF
99 Standard Life Investments United Kingdom 20,668.00 Real Estate Strategies
100 Partners Group Switzerland 20,603.30 Private Equity FoF
* Data derived from the Global Billion Dollar Club, published by HedgeFund Intelligence** Figures show total assets under management, obtained from publicly available sources

Alternative Asset Managers
Alternative Asset Managers Ranking
© 2017 Willis Towers Watson. All rights reserved. Proprietary and Confidential. For Willis Towers Watson and Willis Towers Watson client use only. 75
Total assets by asset class
Position Name of parent organisation Main country of domicileTotal AuM
(USD million)Asset Class
101 Amundi France 20,500.00 Real Estate Strategies
102 Hillhouse* China 20,500.00 Direct Hedge Funds
103 BlackRock United States 20,492.00 Real Estate Strategies
104 General Atlantic United States 20,000.00 Direct Private Equity Funds
105 Ares Management United States 19,897.87 Direct Private Equity Funds
106 PATRIZIA Immobilien Germany 19,650.00 Real Estate Strategies
107 Viking Global Investors* United States 19,000.00 Direct Hedge Funds
108 King Street Capital Management United States 18,900.00 Direct Hedge Funds
109 Clayton, Dubilier & Rice United States 18,816.48 Direct Private Equity Funds
110 Brigade Capital United States 18,380.00 Direct Hedge Funds
111 Credit Suisse Asset Management Switzerland 18,355.37 Direct Hedge Funds
112 Platinum Asset Management Australia 18,000.00 Direct Hedge Funds
113 Neuberger Berman United States 17,600.00 Direct Private Equity Funds
114 Thoma Bravo** United States 17,000.00 Direct Private Equity Funds
115 PIMCO United States 16,943.00 Direct Hedge Funds
116 Landmark Partners United States 16,532.20 Private Equity FoF
117 Aviva Investors United Kingdom 16,451.00 Illiquid Credit
118 Cinven United Kingdom 16,386.99 Direct Private Equity Funds
119 EQT United Kingdom 16,237.00 Direct Private Equity Funds
120 York Capital Management* United States 16,200.00 Direct Hedge Funds
121 AMP Capital Australia 16,068.00 Real Estate Strategies
122 GAM United Kingdom 16,059.00 Direct Hedge Funds
123 The Energy & Minerals Group** United States 16,000.00 Direct Private Equity Funds
124 Appaloosa Management* United States 16,000.00 Direct Hedge Funds
125 ValueAct Capital Management* United States 15,890.00 Direct Hedge Funds
* Data derived from the Global Billion Dollar Club, published by HedgeFund Intelligence** Figures show total assets under management, obtained from publicly available sources

Alternative Asset Managers
Alternative Asset Managers Ranking
© 2017 Willis Towers Watson. All rights reserved. Proprietary and Confidential. For Willis Towers Watson and Willis Towers Watson client use only. 76
Total assets by asset class
Position Name of parent organisation Main country of domicileTotal AuM
(USD million)Asset Class
126 BlackRock United States 15,678.00 Private Equity FoF
127 Brevan Howard Capital Management United Kingdom 15,561.00 Direct Hedge Funds
128 Nuveen (1) United States 15,514.12 Natural Resources
129 Fidelity International Bermuda 15,433.47 Real Estate Strategies
130 Cheyne Capital United Kingdom 15,289.30 Direct Hedge Funds
131 La Française Group France 15,257.00 Real Estate Strategies
132 Centerbridge Partners* United States 15,250.00 Direct Hedge Funds
133 Canyon Partners United States 15,100.00 Direct Hedge Funds
134 Savills Investment Management United Kingdom 15,019.00 Real Estate Strategies
135 Third Point* United States 15,000.00 Direct Hedge Funds
136 Schroders Investment Management United Kingdom 14,942.00 Real Estate Strategies
137 Portfolio Advisors United States 14,833.58 Private Equity FoF
138 Anchorage Capital Group United States 14,800.00 Direct Hedge Funds
139 Allianz Global Investors Germany 14,606.00 Illiquid Credit
140 Intermediate Capital Group United Kingdom 14,491.00 Illiquid Credit
141 Ares Management United States 14,283.55 Illiquid Credit
142 HSBC Alternative Investment Group United Kingdom 13,702.00 Direct Hedge Funds
143 Winton Capital Management United Kingdom 13,615.00 Direct Hedge Funds
144 Magnetar Capital United States 13,500.00 Direct Hedge Funds
145 Henderson Global Investors United Kingdom 13,485.00 Direct Hedge Funds
146 Ardian France 13,414.00 Direct Private Equity Funds
147 Kohlberg Kravis Roberts & Co. United States 13,316.81 Illiquid Credit
148 Crescent Capital Group United States 13,160.00 Illiquid Credit
149J.P. Morgan Alternative Asset Management: Hedge
Fund SolutionsUnited States 13,040.61 Funds of Hedge Funds
150 Lendlease Australia 13,017.00 Real Estate Strategies
* Data derived from the Global Billion Dollar Club, published by HedgeFund Intelligence** Figures show total assets under management, obtained from publicly available sources
(1) Nuveen is the investment management arm of TIAA

Alternative Asset Managers
Alternative Asset Managers Ranking
© 2017 Willis Towers Watson. All rights reserved. Proprietary and Confidential. For Willis Towers Watson and Willis Towers Watson client use only. 77
Total assets by asset class
Position Name of parent organisation Main country of domicileTotal AuM
(USD million)Asset Class
151 Balyasny Asset Management United States 13,000.00 Direct Hedge Funds
152 PIMCO United States 12,998.00 Direct Commodities Funds
153 Bridgepoint United Kingdom 12,993.00 Direct Private Equity Funds
154 Graham Capital Management United States 12,921.00 Direct Hedge Funds
155 Goldman Sachs Asset Management United States 12,882.30 Direct Hedge Funds
156 Oaktree Capital Management United States 12,865.42 Direct Private Equity Funds
157 Man Group United Kingdom 12,841.00 Funds of Hedge Funds
158 First State Investments Australia 12,780.52 Direct Infrastructure Funds
159 DEXUS Property Group Australia 12,309.17 Real Estate Strategies
160 Kayne Anderson Capital Advisors United States 12,216.80 Direct Infrastructure Funds
161 CarVal Investors United States 12,200.74 Illiquid Credit
162 Energy Capital Partners United States 12,200.00 Direct Private Equity Funds
163 Angelo, Gordon & Co. United States 12,198.00 Direct Hedge Funds
164 Allianz Global Investors Germany 12,188.00 Direct Hedge Funds
165 Beach Point Capital Management United States 12,146.00 Illiquid Credit
166 Goldman Sachs Merchant Banking Division United States 12,100.00 Direct Infrastructure Funds
167 Partners Group Switzerland 12,037.10 Illiquid Credit
168 Kennedy Wilson United States 12,004.00 Real Estate Strategies
169 Nordic Capital United Kingdom 11,818.00 Direct Private Equity Funds
170 Partners Group Switzerland 11,801.30 Direct Private Equity Funds
171 Trian Fund Management United States 11,684.00 Direct Hedge Funds
172 The Rock Creek Group* United States 11,500.00 Funds of Hedge Funds
173 Apollo Global Management United States 11,453.00 Real Estate Strategies
174 Lansdowne Partners United Kingdom 11,418.00 Direct Hedge Funds
175 Aberdeen Asset Management United Kingdom 11,395.06 Private Equity FoF
* Data derived from the Global Billion Dollar Club, published by HedgeFund Intelligence** Figures show total assets under management, obtained from publicly available sources

Alternative Asset Managers
Alternative Asset Managers Ranking
© 2017 Willis Towers Watson. All rights reserved. Proprietary and Confidential. For Willis Towers Watson and Willis Towers Watson client use only. 78
Total assets by asset class
Position Name of parent organisation Main country of domicileTotal AuM
(USD million)Asset Class
176 SL Capital Partners United Kingdom 11,360.00 Private Equity FoF
177 J.P. Morgan Asset Management United States 11,335.00 Direct Infrastructure Funds
178 Goldman Sachs Merchant Banking Division United States 11,183.10 Real Estate Strategies
179 Partners Group Switzerland 11,106.80 Real Estate Strategies
180 SkyBridge Capital United States 10,900.00 Funds of Hedge Funds
181 Aberdeen Asset Management United Kingdom 10,707.07 Funds of Hedge Funds
182 Mesirow Financial Holdings United States 10,524.40 Funds of Hedge Funds
183 Aetos Capital* United States 10,520.00 Funds of Hedge Funds
184 QIC Australia 10,495.09 Real Estate Strategies
185 Bain Capital Credit United States 10,470.53 Illiquid Credit
186 Avenue Capital Group United States 10,373.00 Direct Hedge Funds
187 The Abraaj Group United Arab Emirates 10,340.00 Direct Private Equity Funds
188 Wellington Management United States 10,278.00 Direct Hedge Funds
189 Allianz Global Investors Germany 10,271.00 Direct Infrastructure Funds
190 Fir Tree Partners United States 10,262.00 Direct Hedge Funds
191 Nephila Capital Bermuda 10,157.00 Insurance-Linked Investments
192 LGT Capital Partners Switzerland 10,123.26 Funds of Hedge Funds
193 Boston Partners United States 10,088.60 Direct Hedge Funds
194 HBK Capital Management United States 10,088.00 Direct Hedge Funds
195 DTZ Investors United Kingdom 10,087.00 Real Estate Strategies
196 Kohlberg Kravis Roberts & Co. United States 9,990.00 Funds of Hedge Funds
197 K2 Advisors* United States 9,850.00 Funds of Hedge Funds
198 Franklin Templeton United States 9,849.00 Funds of Hedge Funds
199 Greystone Managed Investments Canada 9,832.90 Real Estate Strategies
200 Morgan Stanley Investment Management United States 9,738.00 Private Equity FoF
* Data derived from the Global Billion Dollar Club, published by HedgeFund Intelligence** Figures show total assets under management, obtained from publicly available sources
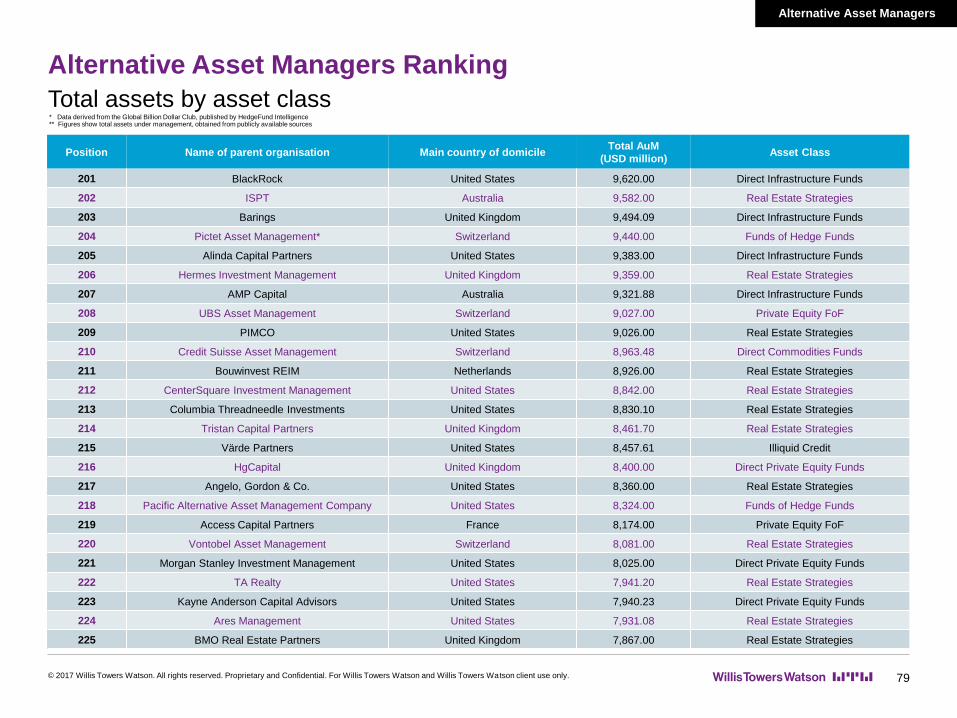
Alternative Asset Managers
Alternative Asset Managers Ranking
© 2017 Willis Towers Watson. All rights reserved. Proprietary and Confidential. For Willis Towers Watson and Willis Towers Watson client use only. 79
Total assets by asset class
Position Name of parent organisation Main country of domicileTotal AuM
(USD million)Asset Class
201 BlackRock United States 9,620.00 Direct Infrastructure Funds
202 ISPT Australia 9,582.00 Real Estate Strategies
203 Barings United Kingdom 9,494.09 Direct Infrastructure Funds
204 Pictet Asset Management* Switzerland 9,440.00 Funds of Hedge Funds
205 Alinda Capital Partners United States 9,383.00 Direct Infrastructure Funds
206 Hermes Investment Management United Kingdom 9,359.00 Real Estate Strategies
207 AMP Capital Australia 9,321.88 Direct Infrastructure Funds
208 UBS Asset Management Switzerland 9,027.00 Private Equity FoF
209 PIMCO United States 9,026.00 Real Estate Strategies
210 Credit Suisse Asset Management Switzerland 8,963.48 Direct Commodities Funds
211 Bouwinvest REIM Netherlands 8,926.00 Real Estate Strategies
212 CenterSquare Investment Management United States 8,842.00 Real Estate Strategies
213 Columbia Threadneedle Investments United States 8,830.10 Real Estate Strategies
214 Tristan Capital Partners United Kingdom 8,461.70 Real Estate Strategies
215 Värde Partners United States 8,457.61 Illiquid Credit
216 HgCapital United Kingdom 8,400.00 Direct Private Equity Funds
217 Angelo, Gordon & Co. United States 8,360.00 Real Estate Strategies
218 Pacific Alternative Asset Management Company United States 8,324.00 Funds of Hedge Funds
219 Access Capital Partners France 8,174.00 Private Equity FoF
220 Vontobel Asset Management Switzerland 8,081.00 Real Estate Strategies
221 Morgan Stanley Investment Management United States 8,025.00 Direct Private Equity Funds
222 TA Realty United States 7,941.20 Real Estate Strategies
223 Kayne Anderson Capital Advisors United States 7,940.23 Direct Private Equity Funds
224 Ares Management United States 7,931.08 Real Estate Strategies
225 BMO Real Estate Partners United Kingdom 7,867.00 Real Estate Strategies
* Data derived from the Global Billion Dollar Club, published by HedgeFund Intelligence** Figures show total assets under management, obtained from publicly available sources

Alternative Asset Managers
Alternative Asset Managers Ranking
© 2017 Willis Towers Watson. All rights reserved. Proprietary and Confidential. For Willis Towers Watson and Willis Towers Watson client use only. 80
Total assets by asset class
Position Name of parent organisation Main country of domicileTotal AuM
(USD million)Asset Class
226 Abbott Capital Management United States 7,761.50 Private Equity FoF
227 Nuveen (1) United States 7,757.78 Direct Commodities Funds
228 PAI Partners France 7,683.00 Direct Private Equity Funds
229 Ardian France 7,643.00 Direct Infrastructure Funds
230 Capital Fund Management France 7,431.46 Direct Hedge Funds
231 Partners Group Switzerland 7,422.20 Direct Infrastructure Funds
232 Nuveen (1) United States 7,341.15 Direct Private Equity Funds
233 Stonepeak Partners United States 7,285.50 Direct Infrastructure Funds
234 Hastings Funds Management Australia 7,277.13 Direct Infrastructure Funds
235 BlackRock United States 7,205.00 Illiquid Credit
236 Oaktree Capital Management United States 7,172.11 Real Estate Strategies
237 Harrison Street Real Estate Capital United States 7,160.00 Real Estate Strategies
238 Marathon Asset Management United States 7,126.00 Direct Hedge Funds
239 Antin Infrastructure Partners France 7,054.70 Direct Infrastructure Funds
240 Credit Suisse Asset Management Switzerland 7,023.40 Insurance-Linked Investments
241 Orchard Street Investment Management United Kingdom 6,941.00 Real Estate Strategies
242 CDH Investment China 6,849.00 Direct Private Equity Funds
243 Morgan Stanley Investment Management United States 6,766.00 Direct Infrastructure Funds
244 GSA Capital United Kingdom 6,674.00 Direct Hedge Funds
245 QIC Australia 6,594.84 Direct Infrastructure Funds
246 ASB Real Estate Investments United States 6,552.00 Real Estate Strategies
247 Deutsche Asset Management Germany 6,420.00 Private Equity FoF
248 Waterfall Asset Management United States 6,275.00 Direct Hedge Funds
249 The GPT Group Australia 6,229.34 Real Estate Strategies
250 Arrowgrass Capital Partners United Kingdom 6,226.00 Direct Hedge Funds
(1) Nuveen is the investment management arm of TIAA
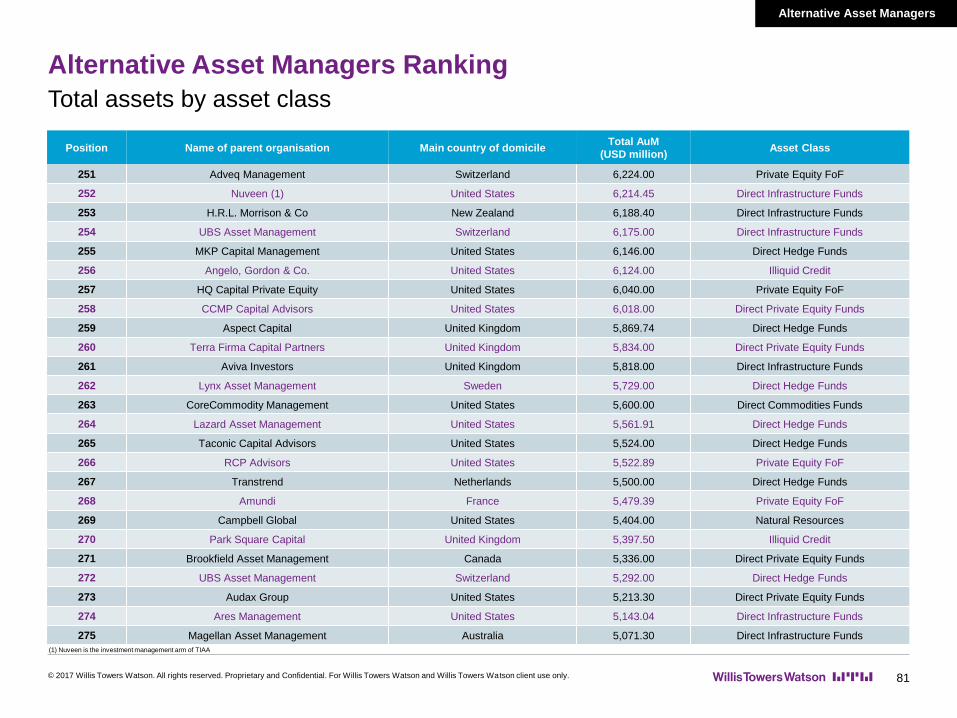
Alternative Asset Managers
Alternative Asset Managers Ranking
© 2017 Willis Towers Watson. All rights reserved. Proprietary and Confidential. For Willis Towers Watson and Willis Towers Watson client use only. 81
Total assets by asset class
Position Name of parent organisation Main country of domicileTotal AuM
(USD million)Asset Class
251 Adveq Management Switzerland 6,224.00 Private Equity FoF
252 Nuveen (1) United States 6,214.45 Direct Infrastructure Funds
253 H.R.L. Morrison & Co New Zealand 6,188.40 Direct Infrastructure Funds
254 UBS Asset Management Switzerland 6,175.00 Direct Infrastructure Funds
255 MKP Capital Management United States 6,146.00 Direct Hedge Funds
256 Angelo, Gordon & Co. United States 6,124.00 Illiquid Credit
257 HQ Capital Private Equity United States 6,040.00 Private Equity FoF
258 CCMP Capital Advisors United States 6,018.00 Direct Private Equity Funds
259 Aspect Capital United Kingdom 5,869.74 Direct Hedge Funds
260 Terra Firma Capital Partners United Kingdom 5,834.00 Direct Private Equity Funds
261 Aviva Investors United Kingdom 5,818.00 Direct Infrastructure Funds
262 Lynx Asset Management Sweden 5,729.00 Direct Hedge Funds
263 CoreCommodity Management United States 5,600.00 Direct Commodities Funds
264 Lazard Asset Management United States 5,561.91 Direct Hedge Funds
265 Taconic Capital Advisors United States 5,524.00 Direct Hedge Funds
266 RCP Advisors United States 5,522.89 Private Equity FoF
267 Transtrend Netherlands 5,500.00 Direct Hedge Funds
268 Amundi France 5,479.39 Private Equity FoF
269 Campbell Global United States 5,404.00 Natural Resources
270 Park Square Capital United Kingdom 5,397.50 Illiquid Credit
271 Brookfield Asset Management Canada 5,336.00 Direct Private Equity Funds
272 UBS Asset Management Switzerland 5,292.00 Direct Hedge Funds
273 Audax Group United States 5,213.30 Direct Private Equity Funds
274 Ares Management United States 5,143.04 Direct Infrastructure Funds
275 Magellan Asset Management Australia 5,071.30 Direct Infrastructure Funds
(1) Nuveen is the investment management arm of TIAA

Alternative Asset Managers
Alternative Asset Managers Ranking
© 2017 Willis Towers Watson. All rights reserved. Proprietary and Confidential. For Willis Towers Watson and Willis Towers Watson client use only. 82
Total assets by asset class
Position Name of parent organisation Main country of domicileTotal AuM
(USD million)Asset Class
276 BNP Paribas Investment Partners France 5,036.42 Illiquid Credit
277 Värde Partners United States 5,024.92 Direct Hedge Funds
278 Equistone Partners Europe United Kingdom 4,888.24 Direct Private Equity Funds
279 Amundi France 4,885.73 Illiquid Credit
280 Deutsche Asset Management Germany 4,872.00 Direct Infrastructure Funds
281 Kohlberg Kravis Roberts & Co. United States 4,851.28 Direct Infrastructure Funds
282 GMT Capital Corp. United States 4,800.00 Direct Hedge Funds
283 Wellington Management United States 4,728.00 Direct Commodities Funds
284 PineBridge Investments United States 4,724.40 Private Equity FoF
285 Evanston Capital Management United States 4,622.00 Funds of Hedge Funds
286 Credit Suisse Asset Management Switzerland 4,598.91 Funds of Hedge Funds
287 LGT Capital Partners Switzerland 4,575.67 Insurance-Linked Investments
288 Audax Group United States 4,555.95 Illiquid Credit
289 IK Investment Partners United Kingdom 4,515.00 Direct Private Equity Funds
290 Timbercreek Asset Management Canada 4,401.79 Real Estate Strategies
291 Lion Capital United Kingdom 4,372.00 Direct Private Equity Funds
292 Tikehau Investment Management France 4,332.67 Illiquid Credit
293 Pantheon United Kingdom 4,317.00 Natural Resources
294 Forum Partners United Kingdom 4,285.46 Real Estate Strategies
295 III Capital Management United States 4,226.86 Direct Hedge Funds
296 Berkshire Group United States 4,176.95 Real Estate Strategies
297 Wellington Management United States 4,154.00 Natural Resources
298 BlueBay Asset Management United Kingdom 4,132.04 Illiquid Credit
299 M3 Capital Partners United States 4,100.00 Direct Private Equity Funds
300 Securis Investment Partners United Kingdom 4,053.00 Insurance-Linked Investments

Alternative Asset Managers
Alternative Asset Managers Ranking
© 2017 Willis Towers Watson. All rights reserved. Proprietary and Confidential. For Willis Towers Watson and Willis Towers Watson client use only. 83
Total assets by asset class
Position Name of parent organisation Main country of domicileTotal AuM
(USD million)Asset Class
301 HSBC Alternative Investment Group United Kingdom 4,046.00 Real Estate Strategies
302 Arcus Infrastructure Partners United Kingdom 4,040.00 Direct Infrastructure Funds
303 Henderson Global Investors United Kingdom 3,992.00 Real Estate Strategies
304 Magnitude Capital United States 3,987.00 Funds of Hedge Funds
305 Campbell & Company United States 3,978.00 Direct Hedge Funds
306 Danske Private Equity Denmark 3,975.00 Private Equity FoF
307 Capital Dynamics Switzerland 3,944.00 Private Equity FoF
308 Fairview Capital United States 3,833.32 Private Equity FoF
309 Fairview Capital United States 3,733.20 Natural Resources
310 Macquarie Group Australia 3,711.98 Real Estate Strategies
311 Cantab, part of GAM Systematic United Kingdom 3,700.00 Direct Hedge Funds
312 HSBC Alternative Investment Group United Kingdom 3,670.00 Private Equity FoF
313 BlackRock United States 3,650.00 Direct Private Equity Funds
314 Neuberger Berman United States 3,639.70 Funds of Hedge Funds
315 PCCP United States 3,614.28 Real Estate Strategies
316 Chenavari Investment Managers United Kingdom 3,598.00 Direct Hedge Funds
317 Abbey Capital Ireland 3,577.63 Funds of Hedge Funds
318 Mesa West Capital United States 3,538.23 Real Estate Strategies
319 Northleaf Capital Partners Canada 3,518.58 Private Equity FoF
320 Kayne Anderson Capital Advisors United States 3,502.68 Real Estate Strategies
321 Blue Harbour Group United States 3,488.00 Direct Hedge Funds
322 Patron Capital United Kingdom 3,486.00 Real Estate Strategies
323 Mesirow Financial Holdings United States 3,435.00 Private Equity FoF
324 Highbridge Capital Management United States 3,414.00 Direct Hedge Funds
325 Leadenhall United Kingdom 3,410.95 Insurance-Linked Investments

Alternative Asset Managers
Alternative Asset Managers Ranking
© 2017 Willis Towers Watson. All rights reserved. Proprietary and Confidential. For Willis Towers Watson and Willis Towers Watson client use only. 84
Total assets by asset class
Position Name of parent organisation Main country of domicileTotal AuM
(USD million)Asset Class
326 Hermes Investment Management United Kingdom 3,374.35 Private Equity FoF
327 GSO Capital Partners United States 3,350.40 Direct Hedge Funds
328 Hermes Investment Management United Kingdom 3,295.00 Direct Infrastructure Funds
329 Aberdeen Asset Management United Kingdom 3,291.72 Direct Infrastructure Funds
330 Ardian France 3,239.00 Illiquid Credit
331 Capstone Investment Advisors United States 3,231.93 Direct Hedge Funds
332 Principal Global Investors United States 3,215.00 Direct Hedge Funds
333 Infracapital United Kingdom 3,205.00 Direct Infrastructure Funds
334 Crestline Investors United States 3,173.00 Direct Private Equity Funds
335 Beacon Capital Partners United States 3,146.00 Real Estate Strategies
336 MetLife Investment Advisors United States 3,117.40 Real Estate Strategies
337 Neuberger Berman United States 3,088.90 Direct Hedge Funds
338 Allianz Global Investors Germany 3,074.00 Funds of Hedge Funds
339 Macquarie Group Australia 3,074.00 Illiquid Credit
340 Meyer Bergman United Kingdom 3,047.00 Real Estate Strategies
341 EQT United Kingdom 3,034.00 Illiquid Credit
342 Macquarie Group Australia 3,031.46 Direct Hedge Funds
343 Odey Asset Management United Kingdom 2,968.00 Direct Hedge Funds
344 UBS Asset Management Switzerland 2,954.00 Direct Commodities Funds
345 Marathon Asset Management United States 2,915.00 Illiquid Credit
346 Gramercy Funds Management United States 2,849.60 Direct Hedge Funds
347 Kohlberg Kravis Roberts & Co. United States 2,824.72 Natural Resources
348 3i Group United Kingdom 2,773.00 Direct Private Equity Funds
349 Oaktree Capital Management United States 2,762.20 Direct Infrastructure Funds
350 Ivory Investment Management United States 2,755.00 Direct Hedge Funds
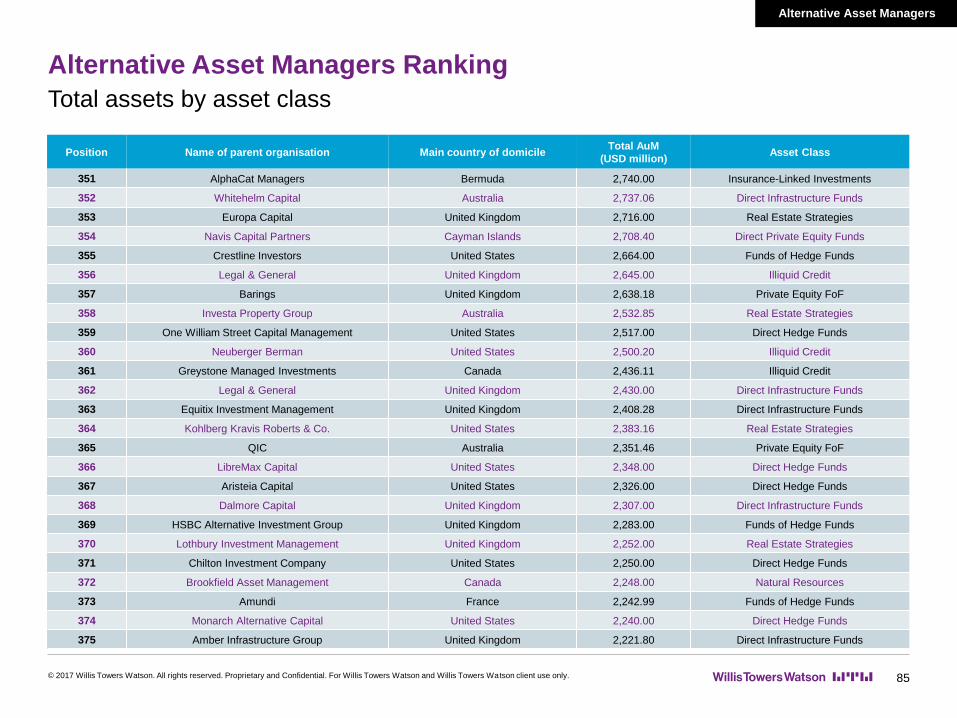
Alternative Asset Managers
Alternative Asset Managers Ranking
© 2017 Willis Towers Watson. All rights reserved. Proprietary and Confidential. For Willis Towers Watson and Willis Towers Watson client use only. 85
Total assets by asset class
Position Name of parent organisation Main country of domicileTotal AuM
(USD million)Asset Class
351 AlphaCat Managers Bermuda 2,740.00 Insurance-Linked Investments
352 Whitehelm Capital Australia 2,737.06 Direct Infrastructure Funds
353 Europa Capital United Kingdom 2,716.00 Real Estate Strategies
354 Navis Capital Partners Cayman Islands 2,708.40 Direct Private Equity Funds
355 Crestline Investors United States 2,664.00 Funds of Hedge Funds
356 Legal & General United Kingdom 2,645.00 Illiquid Credit
357 Barings United Kingdom 2,638.18 Private Equity FoF
358 Investa Property Group Australia 2,532.85 Real Estate Strategies
359 One William Street Capital Management United States 2,517.00 Direct Hedge Funds
360 Neuberger Berman United States 2,500.20 Illiquid Credit
361 Greystone Managed Investments Canada 2,436.11 Illiquid Credit
362 Legal & General United Kingdom 2,430.00 Direct Infrastructure Funds
363 Equitix Investment Management United Kingdom 2,408.28 Direct Infrastructure Funds
364 Kohlberg Kravis Roberts & Co. United States 2,383.16 Real Estate Strategies
365 QIC Australia 2,351.46 Private Equity FoF
366 LibreMax Capital United States 2,348.00 Direct Hedge Funds
367 Aristeia Capital United States 2,326.00 Direct Hedge Funds
368 Dalmore Capital United Kingdom 2,307.00 Direct Infrastructure Funds
369 HSBC Alternative Investment Group United Kingdom 2,283.00 Funds of Hedge Funds
370 Lothbury Investment Management United Kingdom 2,252.00 Real Estate Strategies
371 Chilton Investment Company United States 2,250.00 Direct Hedge Funds
372 Brookfield Asset Management Canada 2,248.00 Natural Resources
373 Amundi France 2,242.99 Funds of Hedge Funds
374 Monarch Alternative Capital United States 2,240.00 Direct Hedge Funds
375 Amber Infrastructure Group United Kingdom 2,221.80 Direct Infrastructure Funds
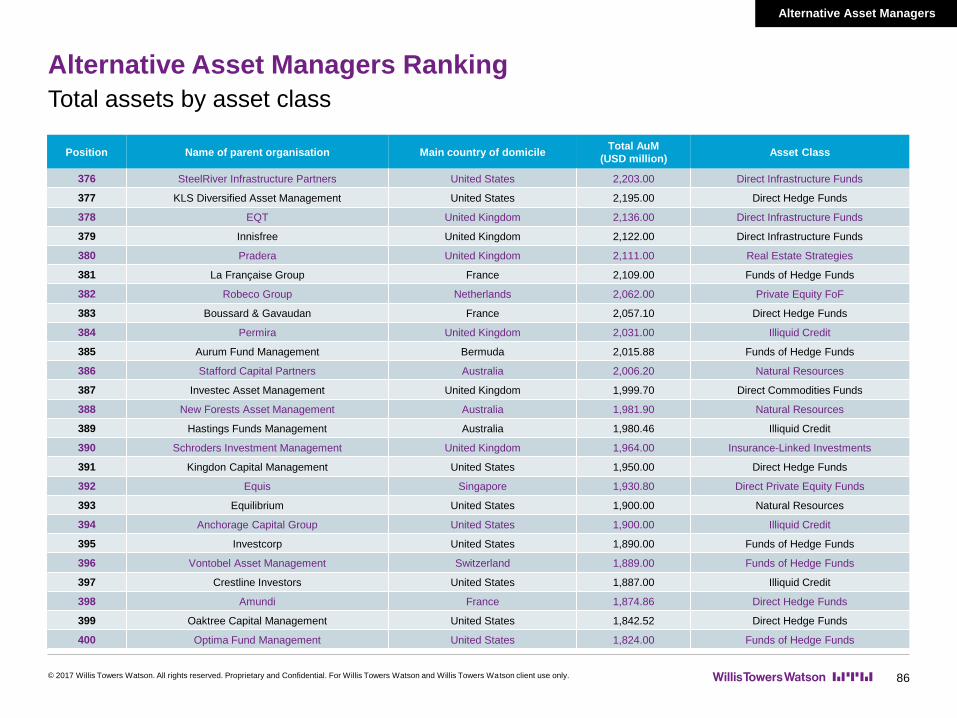
Alternative Asset Managers
Alternative Asset Managers Ranking
© 2017 Willis Towers Watson. All rights reserved. Proprietary and Confidential. For Willis Towers Watson and Willis Towers Watson client use only. 86
Total assets by asset class
Position Name of parent organisation Main country of domicileTotal AuM
(USD million)Asset Class
376 SteelRiver Infrastructure Partners United States 2,203.00 Direct Infrastructure Funds
377 KLS Diversified Asset Management United States 2,195.00 Direct Hedge Funds
378 EQT United Kingdom 2,136.00 Direct Infrastructure Funds
379 Innisfree United Kingdom 2,122.00 Direct Infrastructure Funds
380 Pradera United Kingdom 2,111.00 Real Estate Strategies
381 La Française Group France 2,109.00 Funds of Hedge Funds
382 Robeco Group Netherlands 2,062.00 Private Equity FoF
383 Boussard & Gavaudan France 2,057.10 Direct Hedge Funds
384 Permira United Kingdom 2,031.00 Illiquid Credit
385 Aurum Fund Management Bermuda 2,015.88 Funds of Hedge Funds
386 Stafford Capital Partners Australia 2,006.20 Natural Resources
387 Investec Asset Management United Kingdom 1,999.70 Direct Commodities Funds
388 New Forests Asset Management Australia 1,981.90 Natural Resources
389 Hastings Funds Management Australia 1,980.46 Illiquid Credit
390 Schroders Investment Management United Kingdom 1,964.00 Insurance-Linked Investments
391 Kingdon Capital Management United States 1,950.00 Direct Hedge Funds
392 Equis Singapore 1,930.80 Direct Private Equity Funds
393 Equilibrium United States 1,900.00 Natural Resources
394 Anchorage Capital Group United States 1,900.00 Illiquid Credit
395 Investcorp United States 1,890.00 Funds of Hedge Funds
396 Vontobel Asset Management Switzerland 1,889.00 Funds of Hedge Funds
397 Crestline Investors United States 1,887.00 Illiquid Credit
398 Amundi France 1,874.86 Direct Hedge Funds
399 Oaktree Capital Management United States 1,842.52 Direct Hedge Funds
400 Optima Fund Management United States 1,824.00 Funds of Hedge Funds

Alternative Asset Managers
Alternative Asset Managers Ranking
© 2017 Willis Towers Watson. All rights reserved. Proprietary and Confidential. For Willis Towers Watson and Willis Towers Watson client use only. 87
Total assets by asset class
Position Name of parent organisation Main country of domicileTotal AuM
(USD million)Asset Class
401 Goldman Sachs Asset Management United States 1,821.00 Direct Commodities Funds
402 Kayne Anderson Capital Advisors United States 1,801.51 Illiquid Credit
403 Wexford Capital United States 1,775.00 Direct Hedge Funds
404 Wolverine Asset Management United States 1,775.00 Direct Hedge Funds
405 Northleaf Capital Partners Canada 1,770.00 Direct Infrastructure Funds
406 PIMCO United States 1,723.00 Illiquid Credit
407 Invesco United States 1,703.00 Direct Commodities Funds
408 Equilibrium United States 1,700.00 Real Estate Strategies
409 Fulcrum Asset Management United Kingdom 1,696.00 Direct Hedge Funds
410 Mirova (1) France 1,694.70 Direct Infrastructure Funds
411 Deutsche Asset Management Germany 1,691.00 Direct Private Equity Funds
412 Monarch Alternative Capital United States 1,685.00 Direct Private Equity Funds
413 Palisade Investment Partners Australia 1,676.00 Direct Infrastructure Funds
414 Voya Alternative Asset Management Ireland 1,632.90 Direct Hedge Funds
415 SC Capital Partners Singapore 1,623.00 Real Estate Strategies
416 Spinnaker Capital United Kingdom 1,621.97 Direct Hedge Funds
417 Tremblant Capital United States 1,555.00 Direct Hedge Funds
418 Chenavari Investment Managers United Kingdom 1,526.00 Illiquid Credit
419 Amplitude Capital Switzerland 1,500.00 Direct Hedge Funds
420 JHL Capital Group United States 1,485.50 Direct Hedge Funds
421 Fengate Real Asset Investments Canada 1,480.00 Real Estate Strategies
422 Edesia Asset Management Switzerland 1,478.00 Direct Commodities Funds
423 First Quadrant United States 1,462.00 Direct Hedge Funds
424 Clessidra SGR Italy 1,430.65 Direct Private Equity Funds
425 Blue Sky Alternative Investments Australia 1,416.75 Real Estate Strategies
(1) Mirova is an affiliated investment management firm of Natixis Global Asset Management, thus contributing to the illustration of Natixis’ overall capabilities in global alternative offerings

Alternative Asset Managers
Alternative Asset Managers Ranking
© 2017 Willis Towers Watson. All rights reserved. Proprietary and Confidential. For Willis Towers Watson and Willis Towers Watson client use only. 88
Total assets by asset class
Position Name of parent organisation Main country of domicileTotal AuM
(USD million)Asset Class
426 Northleaf Capital Partners Canada 1,409.70 Illiquid Credit
427 Schroders Investment Management United Kingdom 1,405.00 Direct Commodities Funds
428 Investcorp United States 1,382.00 Direct Hedge Funds
429 Axium Infrastructure Canada 1,381.00 Direct Infrastructure Funds
430 Lombard Odier Investment Managers Switzerland 1,368.77 Direct Hedge Funds
431 Capital Dynamics Switzerland 1,364.00 Direct Infrastructure Funds
432 Morgan Stanley Investment Management United States 1,344.00 Illiquid Credit
433 Lombard Odier Investment Managers Switzerland 1,336.86 Direct Private Equity Funds
434 Intermediate Capital Group United Kingdom 1,335.00 Private Equity FoF
435 Presima Canada 1,319.37 Real Estate Strategies
436 Picton Mahoney Asset Management Canada 1,297.30 Direct Hedge Funds
437 IFM Investors Australia 1,290.00 Private Equity FoF
438 Twelve Capital Switzerland 1,276.39 Insurance-Linked Investments
439 Columbia Threadneedle Investments United States 1,251.60 Direct Commodities Funds
440 Sloane Robinson United Kingdom 1,233.00 Direct Hedge Funds
441 BMO Global Asset Management United Kingdom 1,231.00 Private Equity FoF
442 Hiscox Bermuda 1,217.00 Insurance-Linked Investments
443 Hermes Investment Management United Kingdom 1,216.78 Direct Private Equity Funds
444 Brockton Capital United Kingdom 1,158.70 Real Estate Strategies
445 Kempen Capital Management Netherlands 1,156.90 Funds of Hedge Funds
446 PineBridge Investments United States 1,120.20 Direct Private Equity Funds
447 Wellington Management United States 1,111.00 Direct Infrastructure Funds
448 Macquarie Group Australia 1,081.29 Direct Private Equity Funds
449 Investec Asset Management United Kingdom 1,080.00 Real Estate Strategies
450 Franklin Templeton United States 1,077.75 Direct Infrastructure Funds

Alternative Asset Managers
Alternative Asset Managers Ranking
© 2017 Willis Towers Watson. All rights reserved. Proprietary and Confidential. For Willis Towers Watson and Willis Towers Watson client use only. 89
Total assets by asset class
Position Name of parent organisation Main country of domicileTotal AuM
(USD million)Asset Class
451 Amundi France 1,073.32 Direct Private Equity Funds
452 Fengate Real Asset Investments Canada 1,068.00 Direct Infrastructure Funds
453 Macquarie Group Australia 1,067.88 Natural Resources
454 Aalto Invest United Kingdom 1,060.63 Illiquid Credit
455 Colliers Capital United Kingdom 1,033.00 Real Estate Strategies
456 PineBridge Investments United States 1,003.90 Illiquid Credit
457 Greylock Capital Management United States 989.00 Direct Hedge Funds
458 Greylock Capital Management United States 989.00 Illiquid Credit
459 Mesirow Financial Holdings United States 982.88 Real Estate Strategies
460 West Face Capital Canada 955.30 Direct Hedge Funds
461 BMO Global Asset Management United Kingdom 955.10 Direct Hedge Funds
462 Wellington Management United States 953.00 Direct Private Equity Funds
463 Mt. Logan Re Bermuda 932.24 Insurance-Linked Investments
464 D. E. Shaw Group United States 918.00 Illiquid Credit
465 Schroders Investment Management United Kingdom 882.00 Illiquid Credit
466 RWC Asset Management United Kingdom 870.35 Direct Hedge Funds
467 Stafford Capital Partners Australia 848.70 Private Equity FoF
468 Optima Fund Management United States 826.00 Direct Hedge Funds
469 Lombard Odier Investment Managers Switzerland 812.94 Direct Infrastructure Funds
470 Ethos Private Equity South Africa 785.45 Direct Private Equity Funds
471 Palmer Capital United Kingdom 750.00 Real Estate Strategies
472 Corpfinance International Canada 750.00 Direct Infrastructure Funds
473 Corpfinance International Canada 750.00 Illiquid Credit
474 Orchard Global Asset Management Singapore 741.00 Illiquid Credit
475 Deutsche Asset Management Germany 737.00 Direct Commodities Funds

Alternative Asset Managers
Alternative Asset Managers Ranking
© 2017 Willis Towers Watson. All rights reserved. Proprietary and Confidential. For Willis Towers Watson and Willis Towers Watson client use only. 90
Total assets by asset class
Position Name of parent organisation Main country of domicileTotal AuM
(USD million)Asset Class
476 OFI Global Asset Management United States 736.89 Real Estate Strategies
477 Schroders Investment Management United Kingdom 703.00 Private Equity FoF
478 AXA Investment Managers France 697.63 Insurance-Linked Investments
479 CarVal Investors United States 696.55 Real Estate Strategies
480 Aalto Invest United Kingdom 676.52 Real Estate Strategies
481 Wexford Capital United States 675.00 Direct Private Equity Funds
482 Orchard Global Asset Management Singapore 668.40 Direct Hedge Funds
483 Vontobel Asset Management Switzerland 668.00 Direct Commodities Funds
484 Investec Asset Management United Kingdom 667.00 Direct Infrastructure Funds
485 SCOR Investment Partners France 661.00 Insurance-Linked Investments
486 Credit Suisse Asset Management Switzerland 659.15 Direct Infrastructure Funds
487 Henderson Global Investors United Kingdom 650.00 Natural Resources
488 Aberdeen Asset Management United Kingdom 645.72 Natural Resources
489 Vontobel Asset Management Switzerland 637.00 Natural Resources
490 AMP Capital Australia 633.20 Direct Private Equity Funds
491 Allianz Global Investors Germany 611.00 Real Estate Strategies
492 Loomis, Sayles & Company United States 610.60 Direct Hedge Funds
493 QIC Australia 595.13 Direct Private Equity Funds
494 Henderson Global Investors United Kingdom 595.00 Direct Commodities Funds
495 Investec Asset Management United Kingdom 563.30 Natural Resources
496 Blue Road Capital United States 558.86 Direct Private Equity Funds
497 BlueBay Asset Management United Kingdom 547.74 Direct Hedge Funds
498 Blue Capital Management Bermuda 537.00 Insurance-Linked Investments
499 Riverstone Holdings United States 518.65 Illiquid Credit
500 Cygnus Asset Management Spain 518.00 Direct Hedge Funds

Alternative Asset Managers
Alternative Asset Managers Ranking
© 2017 Willis Towers Watson. All rights reserved. Proprietary and Confidential. For Willis Towers Watson and Willis Towers Watson client use only. 91
Total assets by asset class
Position Name of parent organisation Main country of domicileTotal AuM
(USD million)Asset Class
501 Angelo, Gordon & Co. United States 512.00 Direct Private Equity Funds
502 Cohen & Steers Capital Management United States 498.00 Direct Commodities Funds
503 ZAIS Group United States 474.18 Direct Hedge Funds
504 Visio Capital Management South Africa 473.00 Direct Hedge Funds
505 OFI Global Asset Management United States 470.98 Direct Commodities Funds
506 Senrigan Capital Hong Kong 453.49 Direct Hedge Funds
507 Franklin Templeton United States 452.67 Direct Private Equity Funds
508 Aetos Capital Real Estate United States 440.00 Real Estate Strategies
509 Investec Asset Management United Kingdom 435.20 Direct Private Equity Funds
510 Twelve Capital Switzerland 433.93 Illiquid Credit
511 Meridian Capital Partners United States 420.00 Funds of Hedge Funds
512 Barings United Kingdom 402.01 Natural Resources
513 OFI Global Asset Management United States 398.79 Direct Infrastructure Funds
514 Blue Sky Alternative Investments Australia 390.00 Natural Resources
515 D. E. Shaw Group United States 374.00 Direct Private Equity Funds
516 Crestline Investors United States 373.00 Direct Hedge Funds
517 CZ Capital United Kingdom 341.00 Direct Hedge Funds
518 Brookfield Asset Management Canada 335.00 Direct Hedge Funds
519 Taconic Capital Advisors United States 331.00 Illiquid Credit
520 Lombard Odier Investment Managers Switzerland 301.87 Direct Commodities Funds
521 Franklin Templeton United States 292.81 Real Estate Strategies
522 Blue Sky Alternative Investments Australia 276.41 Direct Private Equity Funds
523 Capital Dynamics Switzerland 268.00 Direct Private Equity Funds
524 Greystone Managed Investments Canada 267.84 Direct Infrastructure Funds
525 The Forest Company United Kingdom 256.00 Natural Resources
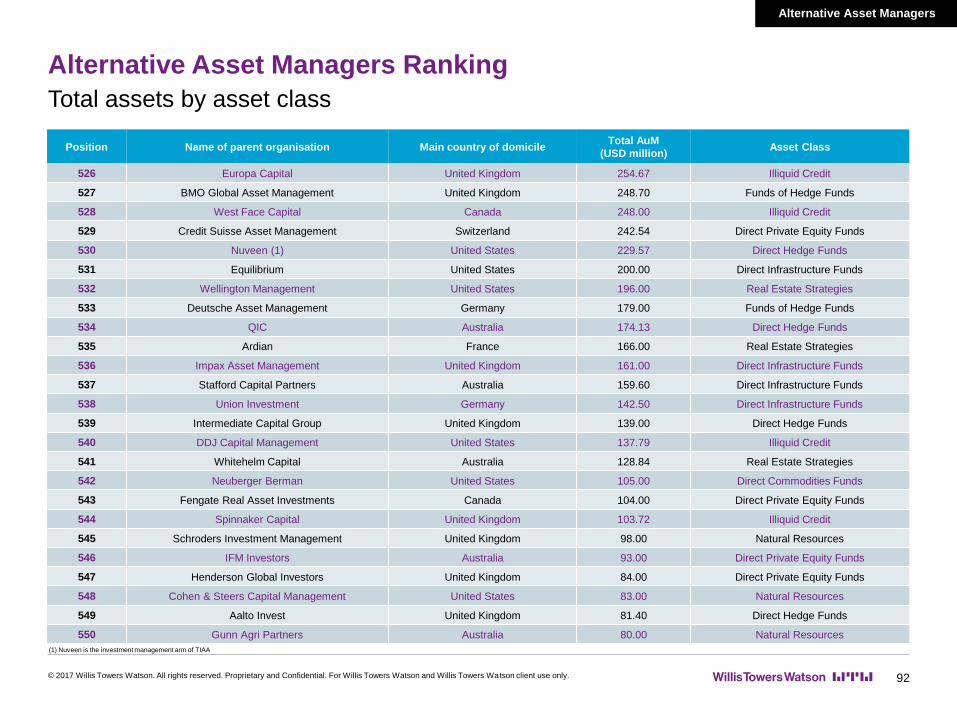
Alternative Asset Managers
Alternative Asset Managers Ranking
© 2017 Willis Towers Watson. All rights reserved. Proprietary and Confidential. For Willis Towers Watson and Willis Towers Watson client use only. 92
Total assets by asset class
Position Name of parent organisation Main country of domicileTotal AuM
(USD million)Asset Class
526 Europa Capital United Kingdom 254.67 Illiquid Credit
527 BMO Global Asset Management United Kingdom 248.70 Funds of Hedge Funds
528 West Face Capital Canada 248.00 Illiquid Credit
529 Credit Suisse Asset Management Switzerland 242.54 Direct Private Equity Funds
530 Nuveen (1) United States 229.57 Direct Hedge Funds
531 Equilibrium United States 200.00 Direct Infrastructure Funds
532 Wellington Management United States 196.00 Real Estate Strategies
533 Deutsche Asset Management Germany 179.00 Funds of Hedge Funds
534 QIC Australia 174.13 Direct Hedge Funds
535 Ardian France 166.00 Real Estate Strategies
536 Impax Asset Management United Kingdom 161.00 Direct Infrastructure Funds
537 Stafford Capital Partners Australia 159.60 Direct Infrastructure Funds
538 Union Investment Germany 142.50 Direct Infrastructure Funds
539 Intermediate Capital Group United Kingdom 139.00 Direct Hedge Funds
540 DDJ Capital Management United States 137.79 Illiquid Credit
541 Whitehelm Capital Australia 128.84 Real Estate Strategies
542 Neuberger Berman United States 105.00 Direct Commodities Funds
543 Fengate Real Asset Investments Canada 104.00 Direct Private Equity Funds
544 Spinnaker Capital United Kingdom 103.72 Illiquid Credit
545 Schroders Investment Management United Kingdom 98.00 Natural Resources
546 IFM Investors Australia 93.00 Direct Private Equity Funds
547 Henderson Global Investors United Kingdom 84.00 Direct Private Equity Funds
548 Cohen & Steers Capital Management United States 83.00 Natural Resources
549 Aalto Invest United Kingdom 81.40 Direct Hedge Funds
550 Gunn Agri Partners Australia 80.00 Natural Resources
(1) Nuveen is the investment management arm of TIAA

Alternative Asset Managers Ranking
© 2017 Willis Towers Watson. All rights reserved. Proprietary and Confidential. For Willis Towers Watson and Willis Towers Watson client use only. 93
Total assets by asset class
Position Name of parent organisation Main country of domicileTotal AuM
(USD million)Asset Class
551 Lombard Odier Investment Managers Switzerland 79.90 Insurance-Linked Investments
552 Whitehelm Capital Australia 76.19 Private Equity FoF
553 Allianz Global Investors Germany 67.00 Direct Commodities Funds
554 Whitehelm Capital Australia 61.41 Direct Private Equity Funds
555 Impax Asset Management United Kingdom 56.55 Real Estate Strategies
556 Henderson Global Investors United Kingdom 53.00 Funds of Hedge Funds
557 Fulcrum Asset Management United Kingdom 53.00 Direct Commodities Funds
558 BMO Global Asset Management United Kingdom 50.60 Natural Resources
559 Blue Sky Alternative Investments Australia 42.00 Direct Hedge Funds
560 First Quadrant United States 41.00 Direct Commodities Funds
561 OFI Global Asset Management United States 32.92 Insurance-Linked Investments
562 Barings United Kingdom 29.59 Insurance-Linked Investments
Total 6,487,116.59
Alternative Asset Managers

Survey statistics
© 2017 Willis Towers Watson. All rights reserved. Proprietary and Confidential. For Willis Towers Watson and Willis Towers Watson client use only. 94
Manager participation varies from year to year, and one data point from a large asset manager may
significantly affect the survey results.
We have not accounted for the potential overlap between Fund of Funds and Direct Funds,
particularly for the Hedge Funds and Private Equity categories, which may affect AuM figures.

Glossary
© 2017 Willis Towers Watson. All rights reserved. Proprietary and Confidential. For Willis Towers Watson and Willis Towers Watson client use only. 95
Funds of Hedge Funds: A Hedge Fund of Funds is an investment structure that pools capital from investors within a commingled vehicle that allocates it to Hedge Funds, instead of investing directly into opportunities.
Direct Hedge Funds: Hedge Funds are private, offshore domiciled investment vehicles seeking to generate absolute returns regardless of the performance of overall markets. To achieve that, hedge funds can take advantage of a broad spectrum of tools including leverage and short selling and they are typically not subject to any formal investment restrictions. Hedge Funds are usually at the more liquid end of the investment spectrum.
Private Equity Funds of Funds: A Private Equity Fund of Funds is an investment structure that pools capital from investors and commits it to direct private equity funds, this includes secondary managers.
Direct Private Equity Funds: Private Equity is equity capital that is not quoted on a public exchange. It consists of investors and funds that make investments directly into private companies or conduct buyouts of public companies that result in a delisting of public equity.
Real Estate Strategies: Real estate strategies are those targeting investment directly or indirectly in buildings or land. This would include both listed and unlisted real estate securities, and unlisted real estate debt investments in real estate. We would exclude securities debt from our definition (e.g. RMBS or CMBS).
Direct Commodities Funds: Commodities are a distinct asset used in the production of good and services. Price is determined by supply and demand dynamicsrather than future cash flows, which implies that traditional valuation methods do not apply. Participants in this market include commodity producers and speculators. Producers trade mostly physical assets, but use derivatives to hedge against price movement, whilst speculators trade mostly derivatives given the costs associated with storage. Some examples of commodities include coffee, oil and gold.
Direct Infrastructure Funds: Infrastructure assets are the facilities and structures essential for the orderly operations of an economy. Infrastructure assets generally also demonstrate monopolistic characteristics and high barriers to entry for competitors. Examples of infrastructure assets include transportation networks, health and education facilities, communications networks, water and energy distribution systems provide essential services to communities.
Natural Resources (eg agriculture, timber, water): Natural Resources strategies include a wide range of investment opportunities, ie in agriculture/farmland, timberland, water (including water rights), natural resources, etc. The distinctive characteristic of real asset is tangible underlying asset and its connection to food and resource scarcity theme. The strategies may be focused either on delivering cash yield to investors (limited exposure to operational business) or on capital appreciation (significant exposure to operational business).
Illiquid Credit: Illiquid credit strategies encompass private debt opportunities, for example real estate debt, infrastructure debt, direct lending, mezzanine etc, as well as other private equity style funds with a predominant focus on illiquid and/or distressed debt-biased strategies (for example non-performing loans). CLOs are excluded from this definition.
Insurance-Linked Investments: An Insurance-Linked Investment product is an investment fund that offers investors exposure to insurance-related premium, predominantly related to P&C risk (mainly property catastrophe risk).
Pension funds: Includes public pension funds, private sector pension funds and superannuation schemes.
Wealth managers: Includes high net worth individuals, family offices, asset managers, corporate investors, private companies and investment companies.

Limitations of reliance – Willis Towers Watson
Willis Towers Watson has prepared this material for general information purposes only and it should not be considered a substitute for specific professional
advice. In particular, its contents are not intended by Willis Towers Watson to be construed as the provision of investment, legal, accounting, tax or other
professional advice or recommendations of any kind, or to form the basis of any decision to do or to refrain from doing anything. As such, this material
should not be relied upon for investment or other financial decisions and no such decisions should be taken on the basis of its contents without seeking
specific advice.
This material is based on information available to Willis Towers Watson at the date of this material and takes no account of subsequent developments after
that date. Additionally, material developments may occur subsequent to this presentation rendering it incomplete and inaccurate. Willis Towers Watson
assumes no obligation to advise you of any such developments or to update the presentation to reflect such developments. In preparing this material we
may have relied upon data supplied to us by third parties. In such cases, whilst reasonable care has been taken to gauge the reliability of this data, we
provide no guarantee as to the accuracy or completeness of this data and Willis Towers Watson and its affiliates and their respective directors, officers and
employees accept no responsibility and will not be liable for any errors or misrepresentations in the data made by any third party.
The assumptions used in this material have been derived by Willis Towers Watson using a blend of economic theory, historical analysis and opinions
provided by investment managers. They inevitably contain an element of subjective judgement. Any opinions or return forecasts on asset classes
contained in this material are not intended to imply, nor should they be interpreted as conveying, any form of guarantee or assurance by Willis Towers
Watson of the future performance of the asset classes in question. The Willis Towers Watson Investment Model is designed to illustrate the likely future
range of long-term returns from different asset classes and their inter-relationship. No economic model can be expected to capture perfectly future
uncertainty, particularly the risk of extreme events.
This material may not be reproduced or distributed to any other party, whether in whole or in part, without Willis Towers Watson’s prior written permission,
except as may be required by law. In the absence of our express written agreement to the contrary, Willis Towers Watson and its affiliates and their
respective directors, officers and employees accept no responsibility and will not be liable for any consequences howsoever arising from any use of or
reliance on this material or the opinions we have expressed.
Nicolas Cichevski
+598 2626 2547
Contact Details and Limitations of reliance
96