global. connected. sustainable. · 2019-10-29 · global. connected. sustainable. digital realty to...
TRANSCRIPT

Digital Realty the trusted foundation | powering your digital ambitions
Global. Connected. Sustainable.
DIGITAL REALTY TO COMBINE WITH INTERXIONStrategic Transaction to Position Combined Company as Leading Global Providerof Data Center Solutions with Enhanced Presence in Major European Metro Areas
OCTOBER 2019

DIGITAL REALTY TO COMBINE WITH INTERXION | OCTOBER 2019 | 2
Selling GLOBALLY…Supporting LOCALLY
GLOBAL provider dedicated to the full customer spectrum from ENTERPRISE colocation to HYPERSCALE
COLOCATION SCALE HYPERSCALEINTERCONNECTION
275+DATA CENTERS (1)
AMERICAS EMEA APAC
2,000+Digital Realty CUSTOMERS
2,000+Interxion
CUSTOMERS
~135kTOTAL
CROSS-CONNECTS
~80kDigital Realty
~55kInterxion
Note: Data as of September 30, 2019 for Digital Realty and as of June 30, 2019 for Interxion, unless otherwise noted.1) Includes unconsolidated joint venture and held-for-sale data centers. Excludes development assets that are not
currently in the operating portfolio and does not reflect recently announced Mapletree transaction.

Strategic Transaction to Position Combined Company as Leading Global Provider of Data Center Solutions
| 3DIGITAL REALTY TO COMBINE WITH INTERXION | OCTOBER 2019
Complementary European Footprint and Product Offering
Globally Expanding Connected Communities of Interest
Enhances Ability to Serve Multinational Customers on a Global Scale
Creates Substantial Anticipated Cost Efficiencies and Financial Benefits
Combined Development Capacity Provides Significant Embedded Growth Potential
HIGHLY STRATEGIC ANDCOMPLEMENTARY COMBINATION
• 100% stock-for-stock acquisition
• 0.7067x fixed exchange ratio• Combined ownership: ~80% Digital Realty / ~20% Interxion(1)
• Expect Interxion debt to be refinanced with investment grade corporate bonds and proceeds from other financings(2)
• Combined company to benefit from access to lower cost of capital
PRUDENTLY FINANCED
LEADERSHIP AND CORPORATE GOVERNANCE
• Digital Realty CEO A. William Stein will serve as CEO of the combined company
• Digital Realty CFO Andrew P. Power will serve as CFO of the combined company
• Interxion CEO David Ruberg will serve as the Chief Executive of the combined company’s Europe, Middle East & Africa (EMEA) business, which will be branded “Interxion, a Digital Realty company” at the close of the transaction
• Mr. Ruberg will lead the combined company’s effort to organize and execute a program to identify and develop high-value communities of interest across the combined company’s platform
• He will play a leadership role on certain of the combined company’s key global customer accounts, bringing to bear his longstanding relationships and thought leadership
1) Based on assumed combined share count of 272.7 million, which is 217.7 million fully diluted shares outstanding for Digital Realty plus 54.9 million shares to be issued to Interxion shareholders (based on 77.7 million fully diluted shares outstanding, including the acceleration of equity awards, at a 0.7067x exchange ratio).
2) This presentation is not an offer to sell or solicitation to buy securities of Digital Realty Trust, Inc. or Digital Realty Trust, L.P.
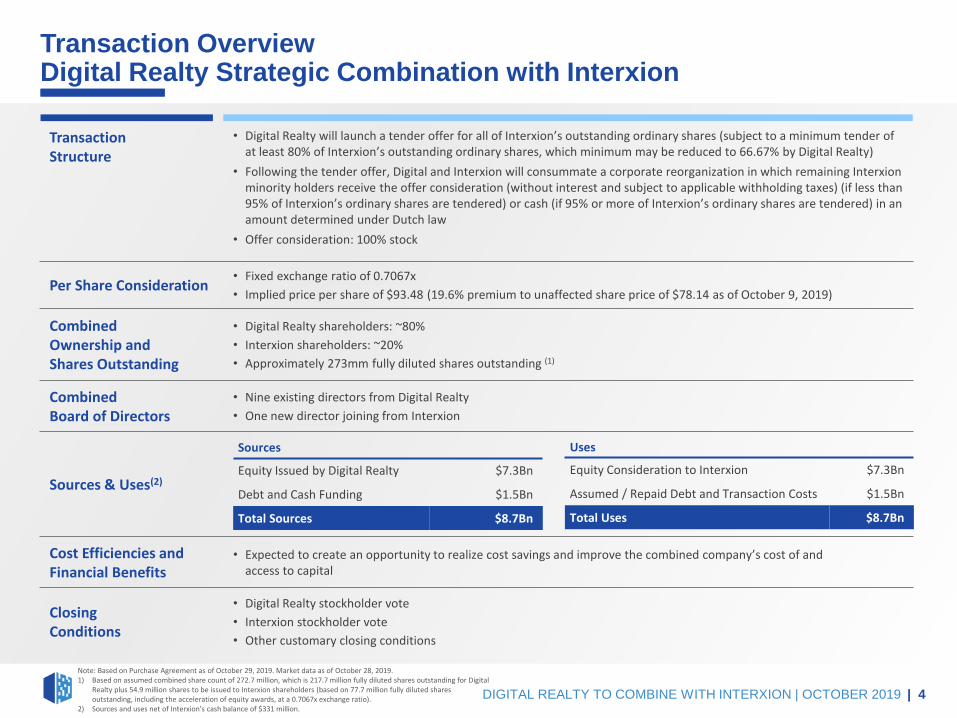
Transaction OverviewDigital Realty Strategic Combination with Interxion
| 4
TransactionStructure
• Digital Realty will launch a tender offer for all of Interxion’s outstanding ordinary shares (subject to a minimum tender of at least 80% of Interxion’s outstanding ordinary shares, which minimum may be reduced to 66.67% by Digital Realty)
• Following the tender offer, Digital and Interxion will consummate a corporate reorganization in which remaining Interxion minority holders receive the offer consideration (without interest and subject to applicable withholding taxes) (if less than95% of Interxion’s ordinary shares are tendered) or cash (if 95% or more of Interxion’s ordinary shares are tendered) in an amount determined under Dutch law
• Offer consideration: 100% stock
Per Share Consideration• Fixed exchange ratio of 0.7067x
• Implied price per share of $93.48 (19.6% premium to unaffected share price of $78.14 as of October 9, 2019)
CombinedOwnership and Shares Outstanding
• Digital Realty shareholders: ~80%
• Interxion shareholders: ~20%
• Approximately 273mm fully diluted shares outstanding (1)
Combined Board of Directors
• Nine existing directors from Digital Realty
• One new director joining from Interxion
Sources & Uses(2)
Cost Efficiencies and Financial Benefits
• Expected to create an opportunity to realize cost savings and improve the combined company’s cost of and access to capital
Closing Conditions
• Digital Realty stockholder vote
• Interxion stockholder vote
• Other customary closing conditions
Note: Based on Purchase Agreement as of October 29, 2019. Market data as of October 28, 2019.1) Based on assumed combined share count of 272.7 million, which is 217.7 million fully diluted shares outstanding for Digital
Realty plus 54.9 million shares to be issued to Interxion shareholders (based on 77.7 million fully diluted shares outstanding, including the acceleration of equity awards, at a 0.7067x exchange ratio).
2) Sources and uses net of Interxion’s cash balance of $331 million.
DIGITAL REALTY TO COMBINE WITH INTERXION | OCTOBER 2019
Sources
Equity Issued by Digital Realty $7.3Bn
Debt and Cash Funding $1.5Bn
Total Sources $8.7Bn
Uses
Equity Consideration to Interxion $7.3Bn
Assumed / Repaid Debt and Transaction Costs $1.5Bn
Total Uses $8.7Bn
UK
Sweden
DenmarkGermany
Ireland
France
SwitzerlandAustria
Spain
Belgium
Italy
Poland
Russia
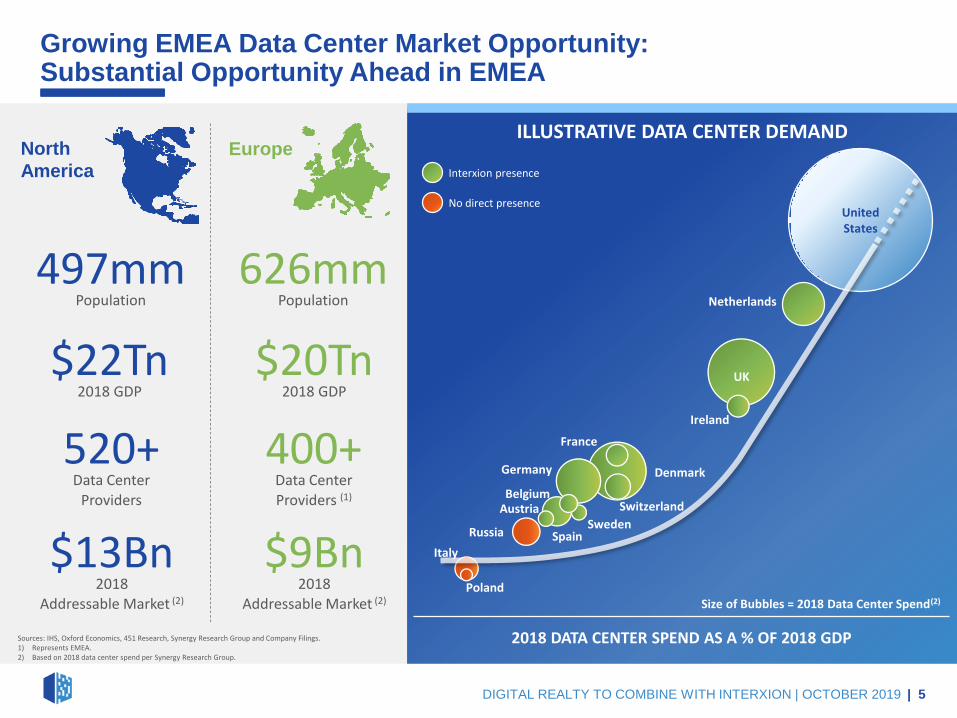
Growing EMEA Data Center Market Opportunity:Substantial Opportunity Ahead in EMEA
DIGITAL REALTY TO COMBINE WITH INTERXION | OCTOBER 2019 | 5
Interxion presence
No direct presence
2018 DATA CENTER SPEND AS A % OF 2018 GDP
ILLUSTRATIVE DATA CENTER DEMAND
Size of Bubbles = 2018 Data Center Spend(2)
497mmPopulation
626mmPopulation
$22Tn2018 GDP
$20Tn2018 GDP
520+Data Center
Providers
400+Data CenterProviders (1)
$13Bn2018
Addressable Market (2)
$9Bn2018
Addressable Market (2)
North
America
Europe
Sources: IHS, Oxford Economics, 451 Research, Synergy Research Group and Company Filings.1) Represents EMEA.2) Based on 2018 data center spend per Synergy Research Group.
United States
Netherlands
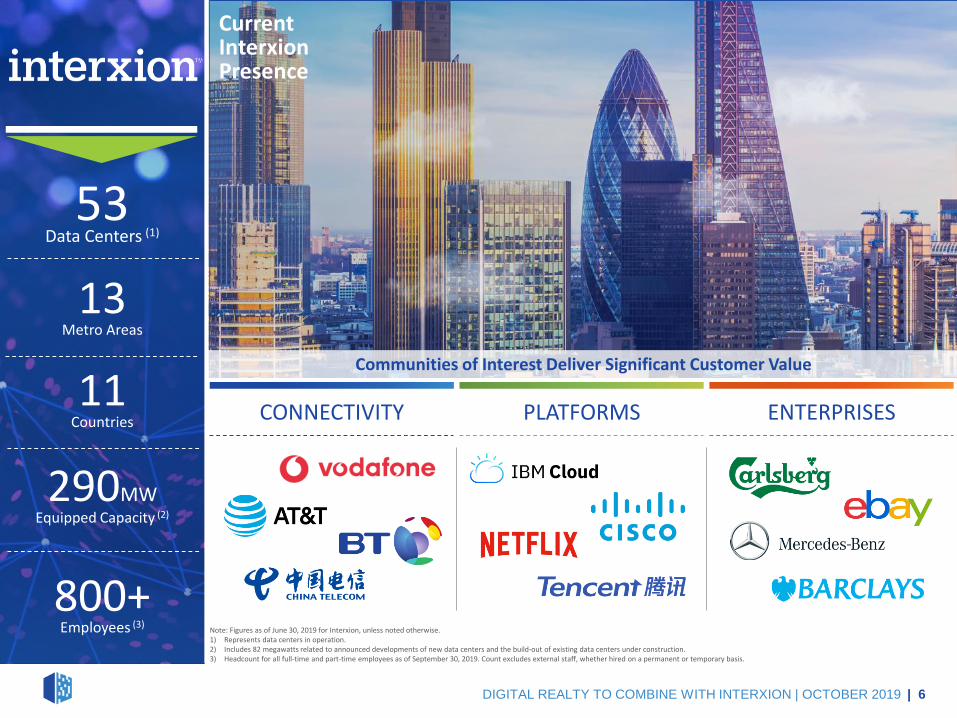
DIGITAL REALTY TO COMBINE WITH INTERXION | OCTOBER 2019 | 6
CONNECTIVITY PLATFORMS ENTERPRISES
53Data Centers (1)
13Metro Areas
290MWEquipped Capacity (2)
800+Employees (3)
11Countries
CurrentInterxionPresence
Note: Figures as of June 30, 2019 for Interxion, unless noted otherwise.1) Represents data centers in operation.2) Includes 82 megawatts related to announced developments of new data centers and the build-out of existing data centers under construction.3) Headcount for all full-time and part-time employees as of September 30, 2019. Count excludes external staff, whether hired on a permanent or temporary basis.
Communities of Interest Deliver Significant Customer Value

26%
20%
16%
13%
25%
DIGITAL REALTY TO COMBINE WITH INTERXION | OCTOBER 2019 | 7
93Data Centers (1)
15Metro Areas
~440MWEquipped Capacity (2)
67%
16%
6%
2%9%
Indicates presence of one or more cloud on-rampsNote: MW shown reflects equipped capacity
Stockholm| 12MW
Dusseldorf| 4MW
Copenhagen| 8MW
Amsterdam| 100MW
Frankfurt| 90MW
Vienna| 25MW
Zurich| 13MW
Geneva| 59k NRSF
Madrid| 11MW
Marseille| 22MW
Paris| 23MW
Brussels| 7MW
London| 108MW
Dublin| 17MW
Manchester| 38k NRSF
London Netherlands Germany France Other
26%
17%
15%
8%
33%
STRENGTH INLondon
Balanced Across
Portfolio
~1,100Employees (3)
11Countries
Combined EMEAPresence
Note: Data as of 3Q19 for Digital Realty and 2Q19 for Interxion. Based on EUR / USD exchange rate of 1.109x as of October 28, 2019.1) Represents data centers in operation.2) Includes 82 megawatts related to announced developments of new data centers and the build-out of existing data centers under construction.3) Headcount for all full-time and part-time employees as of September 30, 2019. Count excludes external staff, whether hired on a permanent or temporary basis.4) Based on annual recurring revenue. Figures as of 3Q19 for Digital Realty and 2Q19 for Interxion.
30+ CLOUD
ON-RAMPS
STRENGTH INMainland
Europe
(4) (4) (4)
Growing Markets:Dublin, Madrid, Stockholm, Vienna, Zurich
Complementary European Footprint

Globally Expanding Connected Communities of Interest
| 8DIGITAL REALTY TO COMBINE WITH INTERXION | OCTOBER 2019
MARSEILLE
150 11CDNs & Content
PlatformsCarriers
LIVE EVENTS
CLOUDGAMING
Note: Data as of October 2019. Marseille and Frankfurt represent Interxion data centers and Amsterdam and London represent Digital Realty data centers.
CONTENT HUB
SUBSEA CABLES
FRANKFURT
600+Carriers /
ISPs
DE-CIXInternet
Exchange
CLOUDHUB
HYBRID CLOUD ACCESS
LONDON
120+ 85+Network Providers
Enterprises
FINANCIALHUB
FINANCIAL TRADING PLATFORM
TRADING PARTNERS
CONNECTIVITYCLOUD
AMSTERDAM
120Network Providers
AMS-IXInternet
Exchange
TELECOMS
DIGITAL AGENCIESWEB HOSTING
COMMS HUB
SATELLITE COMMS
IT SERVICE PROVIDERS
CLOUDENTERPRISES

DIGITAL REALTY TO COMBINE WITH INTERXION | OCTOBER 2019 | 9
Enhances Ability to Serve Multinational Customers on a Global Scale
2,000+Digital Realty Customers
2,000+Interxion Customers
Enhanced capabilities to solve the public- and hybrid-cloud requirements of a global customer base
Note: Data as of September 30, 2019 for Digital Realty Trust and as of June 30, 2019 for Interxion.

DIGITAL REALTY TO COMBINE WITH INTERXION | OCTOBER 2019 | 10
Combined Development Capacity Provides Significant Embedded Growth Potential
9,000
45,000
UnderConstruction
FutureCapacity
France
57,000
177,000
UnderConstruction
FutureCapacity
Total EMEA
25,000
50,000
UnderConstruction
FutureCapacity
Germany
11,000 14,000
UnderConstruction
FutureCapacity
Netherlands
4,000
10,000
UnderConstruction
FutureCapacity
United Kingdom
8,000
58,000
UnderConstruction
FutureCapacity
Rest of Europe
DEVELOPMENT CAPACITY BY SQUARE METERS(1)Digital Realty Interxion
Note: Figures as of 3Q19 for Digital Realty and 2Q19 for Interxion, unless noted otherwise. Figures based on sellable square meters.1) Represents sellable square meters. Future capacity includes shell and land parcels under control, either owned, leased
or optioned. Sellable square meters estimated per Digital Realty management based on net rentable square feet.2) Pre-leased percentage based on IT load.3) Includes the announced build-out of five new data centers and the announced build-out of existing data centers.
39MW
IT Load
~40%
Pre-Leased(2)
82MW
IT Load(3)
~45%
Pre-Leased(2)(3)
2xExisting
Footprint

44 52
16 13 8
DLR + INXN EQIX QTS CONE CORE
$50 $58
$11 $7 $5
DLR + INXN EQIX CONE COR QTS
Diverse and Global PlatformBenefits of Size and Scale on Display
| 11DIGITAL REALTY TO COMBINE WITH INTERXION | OCTOBER 2019
SIZE AND ADJUSTED EBITDA MARGIN (1)
Margin % (1)
TOTAL ENTERPRISE VALUE (3)
DLR + INXN EQIX CONE QTS COR
Number of Data Centers
($ in Billions)
Shading Denotes % of Revenue Outside North America
Most comprehensive product suite at the most efficient cost structure with 30% of revenue outside the Americas
276 (2)
Americas
EMEA
APAC
Americas
EMEA
APAC
203
GLOBAL REACH
20 24 4 15
Metro Areas Countries
Note: Market data as of October 28, 2019. Portfolio and balance sheet data as of September 30, 2019 for DLR and June 30, 2019 for INXN
and peers, per public filings.
1) Based on most recent reported quarterly Adjusted EBITDA as a percent of total operating revenues (3Q 2019 for DLR, 2Q 2019 for
INXN and peers). Companies may define Adjusted EBITDA and total operating revenue differently. Accordingly, such data for these
companies and DLR may not be comparable.
2) Includes investments in unconsolidated joint ventures and properties held-for-sale. Excludes development assets that are not currently
in the operating portfolio and does not reflect recently announced Mapletree transaction.
3) TEV defined as the sum of the market value of equity, debt, the liquidation value of preferred stock, and minority interest, minus cash
and cash equivalents; adjusted for subsequent events. Debt includes pro rata share of unconsolidated joint venture debt.

Strong Combined Capitalization and Balance SheetEnhanced Access to and Overall Cost of Capital
DIGITAL REALTY TO COMBINE WITH INTERXION | OCTOBER 2019 | 12
Accretive to long-term growth and expected to further improve balance sheet strength
Note: USD in millions except per share figures. Balance sheet figures as of September 30, 2019 for DLR and June 30, 2019 for INXN (most recent public filings).1) Interxion figures reflect EUR / USD exchange rate of 1.109x, as of October 28, 2019. 2) Incremental 54.9 million shares to be issued to Interxion shareholders (based on 77.7 million fully diluted shares outstanding, including the acceleration of equity awards, at a 0.7067x exchange ratio).3) Interxion debt includes $1,331mm of senior notes, $56mm of mortgages, $56mm of financial lease liabilities and $331mm of cash and cash equivalents. Digital Realty debt includes $10,924mm of consolidated debt, $169mm of capital leases, $591mm of pro rata JV debt and $7mm of
cash and cash equivalents.4) Calculated as total debt at balance sheet carrying value, plus finance lease obligations (finance lease liabilities shown for Interxion), plus share of unconsolidated JV debt, less unrestricted cash and cash equivalents divided by the product of Adjusted EBITDA (including our share of joint
venture EBITDA) multiplied by four. Last quarter annualized Adjusted EBITDA represents 3Q 2019 for Digital Realty and 2Q 2019 for Interxion (adjusted for Interxion to exclude stock-based compensation and cash rent expense, to provide comparable leverage metric). Estimated combined metrics do not account for potential synergies. Net Debt and Adjusted EBITDA are non-GAAP financial measures. For a description of Net Debt and Adjusted EBITDA and the calculation of these ratios, see the Appendix. Interxion Net Debt and LQA Adjusted EBITDA figures are calculated under Digital Realty’s methodology and assuming Interxion financial information comprising such calculations was prepared under GAAP on the same basis as Digital Realty. Interxion information is based on estimates and is for illustrative purposes only. Any IFRS conversion of Interxion financial information to GAAP may result in material differences.
5) Digital Realty figures pro forma for Mapletree transaction and forward equity offering. Reflects expected proceeds of $1.1Bn from full physical settlement of the forward equity offering, $1.4Bn from the Mapletree transaction, and an $86 million adjustment to LQA Adjusted EBITDA.
Summary CapitalizationOffer Price (1) Current Price
EstimatedCombined
Stock Price (As of 10/28/2019) $93.48 $132.28 $132.28
x Fully-Diluted Shares Outstanding (mm) (2) 78 218 273
Equity Market Capitalization $7,266 $28,801 $36,067
+ Net Debt (Incl. JV Debt at Pro-Rata Share) (3) $1,111 11,676 $13,140
+ Preferred Stock (at Liquidation Preference) – 1,111 1,111
+ Non-OP Noncontrolling Interests – 41 41
Total Enterprise Value $8,377 $41,630 $50,359
Net Debt / Total Enterprise Value 13.3% 28.0% 26.1%
Net Debt / LQA Adjusted EBITDA (4) 3.8x 6.1x 5.9x
Pro Forma Net Debt / LQA Adjusted EBITDA (4)(5) 3.8x 5.0x 5.0x
Credit Rating (Moody's / S&P) B1/BB Baa2/BBB

Financial Results
DIGITAL REALTY TO COMBINE WITH INTERXION | OCTOBER 2019 | 13

Lumpy But HealthyComprehensive Solutions Support Diverse Customer Base
Note: Darker shading represents interconnection bookings. Third quarter bookings are highlighted in lighter blue. Totals may not be exact due to rounding differences. 1) GAAP rental revenues include total rent for new leases and expansions. The timing between lease signing and lease commencement (and receipt of rents) may be significant. 2) Includes signings for new and re-leased space.
3Q19 BOOKINGS BY PRODUCT(1)(2)
$52.7 mmTURN-KEY
FLEX®
$0.1 mmPOWERED BASE
BUILDING®
$7.4 mmCOLOCATION
$0.4 mmNON-TECHNICAL
$8.0 mmINTERCONNECTION
$68.6 mmTOTAL BOOKINGS
HISTORICAL BOOKINGS ANNUALIZED GAAP BASE RENT(1)(2)
$ in millions
2009 2010 2011 2012 2013 2014 2015 2016 2017 2018 2019
DIGITAL REALTY TO COMBINE WITH INTERXION | OCTOBER 2019 | 14
#1
$0
$25
$50
$75
$100
Space & Power Interconnection
#3#2

Communities of InterestAttracting New Logos
64 New LogosAll-Time High
Global Base
Social Media Applications
Big Data & Analytics
DIGITAL REALTY TO COMBINE WITH INTERXION | OCTOBER 2019 | 15
EMEA and APAC-based CustomersJoining our Global Platform
$8mmInterconnection Signings
Biotechnology

Top-Line Step FunctionHealthy Backlog Sets a Solid Foundation
DIGITAL REALTY TO COMBINE WITH INTERXION | OCTOBER 2019 | 16
Note: Totals may not add up due to rounding. 1) Amounts shown represent GAAP annualized base rent from leases signed.2) Amounts shown represent GAAP annualized base rent from leases signed, but not yet commenced, and are based on current estimates of future lease commencement timing. Actual results may vary from current estimates. The lag
between lease signing and lease commencement (and receipt of rents) may be significant. Reflects expected commencement date at time of signing.
BACKLOG ROLL-FORWARD(1)
$ in millions
COMMENCEMENT TIMING(2)
$ in millions
Digital Realty Backlog Unconsolidated Joint Venture Backlog Digital Realty Backlog Unconsolidated Joint Venture Backlog
$91
$52
$72
$71
$36
$9$15
$28
2Q19 Backlog Sign Commence 3Q19 Backlog
$18
$41
$11
$71
$7
$13
$8
$28
2019 2020 2021 Totals

Holistic Approach to Customer Relationship ManagementLeveraging Multiple Touch Points to Maximize Relationship Value
1) Total represents Turn-Key Flex®, Powered Base Building®, Colocation, and Non-Tech leases signed during the quarter ended September 30, 2019. 2) Annualized GAAP represents monthly contractual base rent (defined as cash base rent before abatements) under renewed leases, adjusted for straight-line rents in accordance with GAAP, multiplied by 12.3) Annualized base rent represents monthly contractual base rent (defined as cash base rent before abatements) under existing leases as of September 30, 2019, multiplied by 12.
3Q19 RE-LEASING SPREADS
TURN-KEY FLEX® POWERED BASE BUILDING® COLOCATION TOTAL (1)
RENTAL RATE CHANGE
11.1%CASH
11.4%GAAP
RENTAL RATE CHANGE
3.0%CASH
22.0%GAAP
RENTAL RATE CHANGE
1.9%CASH
1.9%GAAP
RENTAL RATE CHANGE
7.2%CASH
10.1%GAAP
DIGITAL REALTY TO COMBINE WITH INTERXION | OCTOBER 2019 | 17
$61
$138
$116$125
$152
3Q18 4Q18 1Q19 2Q19 3Q19
22.5%19.6%
15.1%
9.8%
4.3%
3Q18 4Q18 1Q19 2Q19 3Q19
RENEWAL VOLUME (ANNUALIZED GAAP) (2) 2019 LEASE EXPIRATIONS (% OF TOTAL ABR) (3)
$ in millions
#1#2 #3#4

Constant-Currency GrowthFX Represents ~ 75 bps Drag on Reported Results
Note: Constant-currency, Adjusted EBITDA, same-capital (stabilized) cash NOI and core FFO are non-GAAP financial measures. For a description of these measures, see the Appendix. 1) Net income for the for the quarter ended September 30, 2019 was $68 million. Net income for the quarter ended September 30, 2018 was $90 million.
4.9%
3.5%
(3.7%)
2.4%
5.7%
4.6%
(3.0%)
3.3%
As Reported Constant-Currency
3Q18 / 3Q19 Revenue Growth
3Q18 / 3Q19 Adjusted EBITDA Growth (1)
3Q18 / 3Q19 Stabilized Cash NOI Growth (1)
3Q18 / 3Q19 Core FFO per Share Growth (1)
DIGITAL REALTY TO COMBINE WITH INTERXION | OCTOBER 2019 | 18

Putting Exposure in PerspectiveBenefits of Scale and Diversification on Display
Source: FactSet. 1) Based on the midpoint of 2019 core FFO per share guidance of $6.55 – $6.65. Core FFO is a non-GAAP financial measure. For a definition of core FFO and a reconciliation to its nearest GAAP equivalent, see the Appendix. 2) Based on average exchange rates for the quarter ended September 30, 2019 compared to average exchange rates for the quarter ended September 30, 2018.
5.7%INCREASE
4.6%INCREASE
U.S. DOLLAR INDEX3Q18 3Q19
0.1%
BENCHMARK RATES
+/- 100 bps
Midpoint of Guidance
$6.55 – $6.65(1)
EXPOSURE BY REVENUE
80%
1% 8%
4%
0%
4%
0%
1%
USD CAD GBP EURO JPY HKD SGD AUD
0.1%GBP
+/- 10%
2019 CORE FFO/SHARE EXPOSURE
0.0%EUR
+/- 10%
EXCHANGE RATES(2)
U.S. DOLLAR /BRITISH POUND
U.S. DOLLAR /EURO
DIGITAL REALTY TO COMBINE WITH INTERXION | OCTOBER 2019 | 19

Four Quarter Two-StepBeat, Dip, Shuffle, Bounce
Note: Based on management estimates; actual performance may differ materially. Core FFO and NOI are non-GAAP financial measures. For descriptions and reconciliations to the closest GAAP equivalents, see the Appendix.
2019E CORE FFO PER SHARE
DIGITAL REALTY TO COMBINE WITH INTERXION | OCTOBER 2019 | 20
1Q19 2Q19 3Q19 NOI Growth 4Q19Financings
MapletreeTransactions
4Q19
Portfolio Sale
Joint Venture

Prudently Financed Transaction Enhances Credit ProfileReflecting a Full-Quarter Contribution
1) Calculated as total debt at balance sheet carrying value, plus capital lease obligations, plus our share of unconsolidated JV debt, less unrestricted cash and cash equivalents divided by the product of Adjusted EBITDA (including our share of joint venture EBITDA) multiplied by four. Adjusted EBITDA is a non-GAAP financial measure. For a description of Adjusted EBITDA and the calculation of these ratios, see the Appendix.
2) Fixed charge coverage ratio is Adjusted EBITDA divided by total fixed charges. Total fixed charges include interest expenses, capitalized interest, scheduled debt principal payments and preferred dividends for the quarter ended September 30, 2019. Adjusted EBITDA is a non-GAAP financial measure. For a description of Adjusted EBITDA and the calculation of these ratios, see the Appendix.
3) Pro Forma for the full physical settlement of the $1.1 billion forward equity offering; and the consummation of the sale and joint venture transactions with Mapletree; and the proceeds therefrom repaying borrowings under our global revolving credit facilities.
1.1x
6.1x
5.0x
3Q19Reported
Pro Forma for ForwardEquity and Mapletree
3Q19As Adjusted
Net Debt to Adjusted EBITDA
(3)
(1) (2)
(3)
18%Floating Rate
Debt
4%Floating Rate
Debt(3)
0.1x 4.3x 4.4x
3Q19Reported
Pro Forma for ForwardEquity and Mapletree
3Q19As Adjusted
Fixed Charge Coverage Ratio
DIGITAL REALTY TO COMBINE WITH INTERXION | OCTOBER 2019 | 21
(3)(3)

$0.7
$0.0 $0.0 $0.0
$0.8
$1.6
$3.3
$0.9 $1.2 $1.1
$0.7
$1.3
2019 2020 2021 2022 2023 2024 2025 2026 2027 2028 2029 2030
Pro Rata Share of JV Debt Secured Mortgage Debt Unsecured Senior Notes
Unsecured Term Loan Unsecured Credit Facilities Unsecured Green Bonds
¥
Matching the Duration of Assets and LiabilitiesClear Runway on the Left, No Bar Too Tall on the Right
Note: As of September 30, 2019. 1) Includes Digital Realty’s pro rata share of six unconsolidated joint venture loans and debt securities. 2) Assumes exercise of extension options. 3) Includes Yen Facility.
DEBT MATURITY SCHEDULE AS OF SEPTEMBER 30, 2019(1)(2)
(U.S. $ in billions)
99%Unsecured
Unsecured
Secured
Fixed
Floating
USD
GBP
Euro
Other
82%Fixed
50%USD
€
£ £
£
£
(3)
6.1 YEARSWeighted Avg. Maturity(1)(2)
3.2%Weighted Avg.
Coupon(1)
DEBT PROFILE
€ £
DIGITAL REALTY TO COMBINE WITH INTERXION | OCTOBER 2019 | 22

Creating Sustainable Growth for Customers and Shareholders
DIGITAL REALTY TO COMBINE WITH INTERXION | OCTOBER 2019 | 23
▪ Globally Expanding Connected Communities of Interest
▪ Complementary European Footprint and Product Offering
▪ Enhances Ability to Serve Multinational Customers on a Global Scale
▪ Combined Development Capacity Provides Significant Embedded Growth Potential
▪ Creates Substantial Anticipated Cost Efficiencies and Financial Benefits

Appendix
DIGITAL REALTY TO COMBINE WITH INTERXION | OCTOBER 2019 | 24

Robust Long-Term Demand, Lumpy Near-Term SigningsDiverse Customer Base + Product Offerings
1) GAAP rental revenues include total rent for new leases and expansions. The timing between lease signing and lease commencement (and receipt of rents) may be significant.2) Includes signings for new and re-leased space.
HISTORICAL BOOKINGS TRAILING FOUR-QUARTER AVERAGEANNUALIZED GAAP BASE RENT(1)(2)
$ in millions
3Q19 TRAILING FOUR-QUARTER AVERAGE BOOKINGS BY PRODUCT(1)(2)
$36.1 mmTURN-KEY
FLEX®
$3.4 mmPOWERED BASE
BUILDING®
$8.3 mmCOLOCATION
$0.4 mmNON-TECHNICAL
$7.7 mmINTERCONNECTION
$56.0 mmTOTAL BOOKINGS
2009 2010 2011 2012 2013 2014 2015 2016 2017 2018 2019
DIGITAL REALTY TO COMBINE WITH INTERXION | OCTOBER 2019 | 25
$0
$20
$40
$60
$80 Space & Power Interconnection

AppendixAdditional Information
DIGITAL REALTY TO COMBINE WITH INTERXION | OCTOBER 2019 | 26
Additional Information and Where to Find It
This communication is for information purposes only and does not constitute an offer to sell or the solicitation of an offer to buy any securities or a solicitation of any proxy, vote or approval with respect to the proposed transaction or otherwise, nor shall there be any sale of securities in any jurisdiction in which such offer, solicitation or sale would be unlawful prior to registration or qualification under the securities laws of any such jurisdiction. In connection with the proposed transactions, Digital Realty intends to file a Registration Statement on Form S-4 with the U.S. Securities and Exchange Commission (the “SEC”), that will include a proxy statement of Digital Realty, which also constitutes a prospectus of Digital Realty. After the registration statement is declared effective by the SEC, Digital Realty intends to mail a definitive proxy statement/prospectus to shareholders of Digital Realty and Digital Realty intends to cause its subsidiary to file a Tender Offer Statement on Schedule TO (the “Schedule TO”) with the SEC and soon thereafter Interxion intends to file a Solicitation/Recommendation Statement on Schedule 14D-9 (the “Schedule 14D-9”) with respect to the tender offer. The tender offer for the outstanding common stock of Interxion referred to in this document has not yet commenced. The solicitation and offer to purchase shares of Interxion’s common stock will only be made pursuant to the Schedule TO and related offer to purchase. This material is not a substitute for the proxy statement/prospectus, the Schedule TO, the Schedule 14D-9 or the Registration Statement or for any other document that Digital Realty or Interxion may file with the SEC and send to Digital Realty’s or Interxion’s shareholders in connection with the proposed transactions.
BEFORE MAKING ANY VOTING OR INVESTMENT DECISION OR DECISION WITH RESPECT TO THE TENDER OFFER, WE URGE INVESTORS OF DIGITAL REALTY AND INTERXION TO READ THE REGISTRATION STATEMENT, PROXY STATEMENT/PROSPECTUS, SCHEDULE TO (INCLUDING AN OFFER TO PURCHASE, RELATED LETTER OF TRANSMITTAL AND OTHER OFFER DOCUMENTS) AND SCHEDULE 14D-9, AS EACH MAY BE AMENDED OR SUPPLEMENTED FROM TIME TO TIME, AND OTHER RELEVANT DOCUMENTS FILED BY DIGITAL REALTY AND INTERXION WITH THE SEC CAREFULLY WHEN THEY BECOME AVAILABLE BECAUSE THEY WILL CONTAIN IMPORTANT INFORMATION ABOUT DIGITAL REALTY, INTERXION AND THE PROPOSED TRANSACTIONS.
Investors will be able to obtain free copies of the Registration Statement, proxy statement/prospectus, Schedule TO and Schedule 14D-9, as each may be amended from time to time, and other relevant documents filed by Digital Realty and Interxion with the SEC (when they become available) at http://www.sec.gov, the SEC’s website, or free of charge from Digital Realty’s website (https://www.digitalrealty.com) or by contacting Digital Realty’s Investor Relations Department at (415) 848-9311. These documents are also available free of charge from Interxion’s website (https://www.interxion.com) or by contacting Interxion’s Investor Relations Department at (813) 644-9399.
Participants in the Solicitation
Digital Realty, Interxion and their respective directors and certain of their executive officers and employees may be deemed, under SEC rules, to be participants in the solicitation of proxies from Digital Realty’s and Interxion’s shareholders in connection with the proposed transactions. Information regarding the officers and directors of Digital Realty is included in its definitive proxy statement for its 2019 annual meeting filed with the SEC on April 1, 2019. Information regarding the officers and directors of Interxion and their ownership of Interxion ordinary shares is set forth in Interxion’s Annual Report on Form 20-F, which was filed with the SEC on April 30, 2019. Additional information regarding the persons who may be deemed participants and their interests will be set forth in the Registration Statement and proxy statement/prospectus and other materials when they are filed with SEC in connection with the proposed transactions. Free copies of these documents may be obtained as described in the paragraphs above.

AppendixAdditional Information
DIGITAL REALTY TO COMBINE WITH INTERXION | OCTOBER 2019 | 27
Note Regarding Forward-Looking Statements
Digital Realty and Interxion caution that statements in this communication that are forward-looking, and provide other than historical information, involve risks, contingencies and uncertainties that may impact actual results of operations of Digital Realty, Interxion and the combined company. These forward-looking statements include, among other things, statements about anticipated satisfaction of closing conditions and completion of the proposed transactions contemplated by the purchase agreement between them. Although we believe that the expectations reflected in those forward-looking statements are reasonable, we can give no assurance that those expectations will prove to have been correct. Those statements are made by using various underlying assumptions and are subject to numerous risks, contingencies and uncertainties, including, among others: the ability of Digital Realty and Interxion to obtain the regulatory and shareholder approvals necessary to complete the anticipated combination, on the anticipated timeline or at all; the risk that a condition to the closing of the anticipated combination may not be satisfied, on the anticipated timeline or at all or that the anticipated combination may fail to close; the outcome of any legal proceedings, regulatory proceedings or enforcement matters that may be instituted relating to the anticipated combination; the costs incurred to consummate the anticipated combination; the possibility that the expected synergies from the anticipated combination will not be realized, or will not be realized within the expected time period; difficulties related to the integration of the two companies; disruption from the anticipated combination making it more difficult to maintain relationships with customers, employees, regulators or suppliers; the diversion of management time and attention on the anticipated combination; adverse changes in the markets in which Digital Realty and Interxion operate or credit markets; and changes in the terms, scope or timing of contracts, contract cancellations, and other modifications and actions by customers and other business counterparties of Digital Realty and Interxion. If one or more of these risks materialize, or if underlying assumptions prove incorrect, actual results may vary materially from those expected. You should not place undue reliance on forward looking statements. For a more complete discussion of these and other risk factors, please see (i) Digital Realty’s filings with the SEC, including its annual report on Form 10-K for the year ended December 31, 2018 and subsequent quarterly reports on Form 10-Q and (ii) Interxion’s filings with the SEC, including its annual report on Form 20-F for the year ended December 31, 2018 and its subsequent reports on Form 6-K. This communication reflects the views of Digital Realty’s and Interxion’s management as of the date hereof. Except to the extent required by applicable law, Digital Realty and Interxion undertake no obligation to update or revise any forward-looking statement.

AppendixManagement Statements on Non-GAAP Measures
DIGITAL REALTY TO COMBINE WITH INTERXION | OCTOBER 2019 | 28
The information included in this presentation contains certain non-GAAP financial measures that management believes are helpful in understanding our business, as further described below. Our definition and calculation of non-GAAP financial measures may differ from those of other REITs, and, therefore, may not be comparable. The non-GAAP financial measures should not be considered an alternative to net income or any other GAAP measurement of performance and should not be considered an alternative to cash flows from operating, investing or financing activities as a measure of liquidity.
Funds From Operations (FFO):We calculate funds from operations, or FFO, in accordance with the standards established by the National Association of Real Estate Investment Trusts, or NAREIT, in the NAREIT Funds From Operations White Paper - 2018 Restatement. FFO represents net income (loss) (computed in accordance with GAAP), excluding gains (or losses) from real estate transactions, impairment of investment in real estate, real estate related depreciation and amortization (excluding amortization of deferred financing costs), unconsolidated JV real estate related depreciation & amortization, non-controlling interests in operating partnership and after adjustments for unconsolidated partnerships and joint ventures. Management uses FFO as a supplemental performance measure because, in excluding real estate related depreciation and amortization and gains and losses from property dispositions and after adjustments for unconsolidated partnerships and joint ventures, it provides a performance measure that, when compared year over year, captures trends in occupancy rates, rental rates and operating costs. We also believe that, as a widely recognized measure of the performance of REITs, FFO will be used by investors as a basis to compare our operating performance with that of other REITs. However, because FFO excludes depreciation and amortization and captures neither the changes in the value of our data centers that result from use or market conditions, nor the level of capital expenditures and capitalized leasing commissions necessary to maintain the operating performance of our data centers, all of which have real economic effect and could materially impact our financial condition and results from operations, the utility of FFO as a measure of our performance is limited. Other REITs may not calculate FFO in accordance with the NAREIT definition and, accordingly, our FFO may not be comparable to other REITs’ FFO. FFO should be considered only as a supplement to net income computed in accordance with GAAP as a measure of our performance.
Core Funds from Operations (Core FFO):We present core funds from operations, or core FFO, as a supplemental operating measure because, in excluding certain items that do not reflect core revenue or expense streams, it provides a performance measure that, when compared year over year, captures trends in our core business operating performance. We calculate core FFO by adding to or subtracting from FFO (i) termination fees and other non-core revenues, (ii) transaction and integration expenses, (iii) loss from early extinguishment of debt, (iv) issuance costs associated with redeemed preferred stock, (v) severance, equity acceleration, and legal expenses, (vi) gain/loss on FX revaluation, (vii) gain on contribution to unconsolidated joint venture, net of related tax, and (viii) other non-core expense adjustments. Because certain of these adjustments have a real economic impact on our financial condition and results from operations, the utility of core FFO as a measure of our performance is limited. Other REITs may calculate core FFO differently than we do and accordingly, our core FFO may not be comparable to other REITs' core FFO. Core FFO should be considered only as a supplement to net income computed in accordance with GAAP as a measure of our performance.
Adjusted Funds from Operations (AFFO): We present adjusted funds from operations, or AFFO, as a supplemental operating measure because, when compared year over year, it assesses our ability to fund dividend and distribution requirements from our operating activities. We also believe that, as a widely recognized measure of the operations of REITs, AFFO will be used by investors as a basis to assess our ability to fund dividend payments in comparison to other REITs, including on a per share and unit basis. We calculate AFFO by adding to or subtracting from core FFO (i) non-real estate depreciation, (ii) amortization of deferred financing costs, (iii) amortization of debt discount/premium, (iv) non-cash stock-based compensation expense, (v) straight-line rental revenue, (vi) straight-line rental expense, (vii) above- and below-market rent amortization, (viii) deferred tax expense, (ix) leasing compensation and internal lease commissions, and (x) recurring capital expenditures. Other REITs may calculate AFFO differently than we do and accordingly, our AFFO may not be comparable to other REITs’ AFFO. AFFO should be considered only as a supplement to net income computed in accordance with GAAP as a measure of our performance.

AppendixManagement Statements on Non-GAAP Measures
DIGITAL REALTY TO COMBINE WITH INTERXION | OCTOBER 2019 | 29
EBITDA and Adjusted EBITDA:
We believe that earnings before interest, loss from early extinguishment of debt, income taxes, depreciation and amortization, or EBITDA, and Adjusted EBITDA (as defined below), are useful supplemental performance measures because they allow investors to view our performance without the impact of non-cash depreciation and amortization or the cost of debt and, with respect to Adjusted EBITDA, severance, equity acceleration, and legal expenses, transaction and integration expenses, gain on real estate transactions, equity in earnings adjustment for non-core items, other non-core adjustments, net, noncontrolling interests, preferred stock dividends, including undeclared dividends, and issuance costs associated with redeemed preferred stock. Adjusted EBITDA is EBITDA excluding unconsolidated joint venture real estate related depreciation & amortization, severance, equity acceleration, and legal expenses, transaction and integration expenses, (gain) on sale, impairment of investments in real estate, other non-core adjustments, net, non-controlling interests, and preferred stock dividends, including undeclared dividends. In addition, we believe EBITDA and Adjusted EBITDA are frequently used by securities analysts, investors and other interested parties in the evaluation of REITs. Because EBITDA and Adjusted EBITDA are calculated before recurring cash charges including interest expense and income taxes, exclude capitalized costs, such as leasing commissions, and are not adjusted for capital expenditures or other recurring cash requirements of our business, their utility as a measure of our performance is limited. Other REITs may calculate EBITDA and Adjusted EBITDA differently than we do and accordingly, our EBITDA and Adjusted EBITDA may not be comparable to other REITs’ EBITDA and Adjusted EBITDA. Accordingly, EBITDA and Adjusted EBITDA should be considered only as supplements to net income computed in accordance with GAAP as a measure of our financial performance.
Net Operating Income (NOI) and Cash NOI:
Net operating income, or NOI, represents rental revenue, tenant reimbursement revenue and interconnection revenue less utilities expense, rental property operating expenses, property taxes and insurance expenses (as reflected in the statement of operations). NOI is commonly used by stockholders, company management and industry analysts as a measurement of operating performance of the company’s rental portfolio. Cash NOI is NOI less straight-line rents and above- and below-market rent amortization. Cash NOI is commonly used by stockholders, company management and industry analysts as a measure of property operating performance on a cash basis. However, because NOI and cash NOI exclude depreciation and amortization and capture neither the changes in the value of our data centers that result from use or market conditions, nor the level of capital expenditures and capitalized leasing commissions necessary to maintain the operating performance of our data centers, all of which have real economic effect and could materially impact our results from operations, the utility of NOI and cash NOI as measures of our performance is limited. Other REITs may calculate NOI and cash NOI differently than we do and, accordingly, our NOI and cash NOI may not be comparable to other REITs’ NOI and cash NOI. NOI and cash NOI should be considered only as supplements to net income computed in accordance with GAAP as measures of our performance.

Reconciliation of Non-GAAP ItemsTo Their Closest GAAP Equivalent
DIGITAL REALTY TO COMBINE WITH INTERXION | OCTOBER 2019 | 30
Digital Realty Trust, Inc. and Subsidiaries
Reconciliation of Net Income Available to Common Stockholders to Funds From Operations (FFO)
(in thousands, except per share and unit data)
(unaudited)
September 30, 2019 September 30, 2018
Net (loss) income available to common stockholders 49,827$ 67,268$
Adjustments:
Noncontrolling interests in operating partnership 2,300 2,700
Real estate related depreciation and amortization (1) 283,090 290,757
Real estate related depreciation and amortization related to investment in
unconsolidated joint ventures 13,612 3,775
Impairment of investments in real estate - -
(Gain) loss on sale of properties - (26,577)
FFO available to common stockholders and unitholders 348,829$ 337,923$
Basic FFO per share and unit 1.60$ 1.58$
Diluted FFO per share and unit 1.59$ 1.57$
Weighted average common stock and units outstanding
Basic 217,375 214,289
Diluted 218,755 214,937
(1) Real estate related depreciation and amortization was computed as follows:
Depreciation and amortization per income statement 286,718 293,957
Non-real estate depreciation (3,628) (3,200) 283,090$ 290,757$
Three Months Ended
Digital Realty Trust, Inc. and Subsidiaries
Reconciliation of Funds From Operations (FFO) to Core Funds From Operations (CFFO)
(in thousands, except per share and unit data)
(unaudited)
September 30, 2019 September 30, 2018
FFO available to common stockholders and unitholders -- diluted 348,829$ 337,923$
Termination fees and other non-core revenues (1) (16,792) (518)
Transaction and integration expenses 4,115 9,626
Loss from early extinguishment of debt 5,366 -
Loss on FX revaluation 23,136 -
Gain on contribution to unconsolidated joint venture, net of related tax - -
Severance accrual and equity acceleration (2) 123 645
Issuance costs associated with redeemed preferred stock - -
Other non-core expense adjustments 92 2,269
CFFO available to common stockholders and unitholders -- diluted 364,869$ 349,945$
Diluted CFFO per share and unit 1.67$ 1.63$
(1) Includes one-time fees, proceeds and certain other adjustments that are not core to our business.
(2) Relates to severance and other charges related to the departure of company executives and integration-related severance.
Three Months Ended
Digital Realty Trust, Inc. and Subsidiaries
Reconciliation of Same Capital Cash Net Operating Income
(in thousands)
(unaudited)
September 30, 2019 September 30, 2018
Rental revenues 431,175$ 438,033$
Tenant reimbursements - Util ities 89,924 90,653
Tenant reimbursements - Other 43,447 47,104
Interconnection and other 59,085 57,125
Total Revenue 623,631 632,915
Util ities 106,214 108,623
Rental property operating 95,554 93,269
Property taxes 28,184 27,116
Insurance 2,541 2,355
Total Expenses 232,493 231,363
Net Operating Income 391,138$ 401,552$
Less:
Stabilized straight-line rent 421$ (907)$ Above and below market rent (3,645) (7,191)
Cash Net Operating Income 394,362$ 409,650$
Three Months Ended
Digital Realty Trust, Inc. and Subsidiaries
Reconciliation of Net Income Available to Common Stockholders to Earnings Before Interest, Taxes, Depreciation and Amortization (EBITDA) and Adjusted EBITDA
(in thousands)
(unaudited)
September 30, 2019 September 30, 2018
Net (loss) income available to common stockholders 49,827$ 67,268$
Interest 84,574 80,851
(Gain) loss from early extinguishment of debt 5,366 -
Tax expense 4,826 2,432
Depreciation and amortization 286,718 293,957
EBITDA 431,311 444,508
Unconsolidated JV real estate related depreciation & amortization 13,612 3,775
Severance accrual and equity acceleration 123 645
Transaction and integration expenses 4,115 9,626
(Gain) on sale / deconsolidation - (26,577)
Impairment of investments in real estate - -
Other non-core adjustments, net 6,436 2,269
Noncontrolling interests 1,077 2,667
Preferred stock dividends, including undeclared dividends 16,670 20,329
Issuance costs associated with redeemed preferred stock - -
Adjusted EBITDA 473,344$ 457,242$
Three Months Ended

Reconciliation of Non-GAAP ItemsTo Their Closest GAAP Equivalent
DIGITAL REALTY TO COMBINE WITH INTERXION | OCTOBER 2019 | 31
QE 09/30/19
Total GAAP interest expense 84,574
Add: Capitalized interest 9,936
GAAP interest expense plus capitalized interest 94,510
Debt Service Ratio 5.0x
Debt Service Ratio (LQA Adjusted EBITDA/GAAP interest expense plus capitalized
interest and less bridge facility fees)
Total Debt/Total Enterprise Value
Market value of common equity(i) 28,263,171$
Liquidation value of preferred equity(ii) 1,111,250
Total debt at balance sheet carrying value 10,924,035
Total Enterprise Value 40,298,456$
Total debt / total enterprise value 27.1%
Debt-plus-preferred-to-total-enterprise-value 29.9%
(i) Market Value of Common Equity
Common shares outstanding 208,583
Common units outstanding 9,144
Total Shares and Partnership Units 217,727
Stock price as of September 30, 2019 129.81$
Market value of common equity 28,263,171$
(ii) Liquidation value of preferred equity ($25.00 per share)
Shares O/S
Liquidation
Value
Series C Preferred 8,050 201,250
Series G Preferred 10,000 250,000
Series I Preferred 10,000 250,000
Series J Preferred 8,000 200,000
Series K Preferred 8,400 210,000
1,111,250 (iv)
Net Debt/LQA Adjusted EBITDA
QE 09/30/19
Total debt at balance sheet carrying value 10,924,035$
Add: DLR share of unconsolidated joint venture debt 590,846
Add: Capital lease obligations 168,677
Less: Unrestricted cash (7,190)
Net Debt as of September 30, 2019 11,676,368$
Net Debt / LQA Adjusted EBITDA(iii) 6.1x
(iii) Adjusted EBITDA
Net income available to common stockholders 49,827$
Interest expense 84,574
Loss from early extinguishment of debt 5,366
DLR share of unconsolidated joint venture interest expense 8,330
Taxes 4,826
Depreciation and amortization 286,718
EBITDA 439,641
Unconsolidated JV real estate related depreciation & amortization 13,612
Severance accrual and equity acceleration and legal expenses 123
Transaction and integration expenses 4,115
Other non-core adjustments, net 6,436
Noncontrolling interests 1,077
Preferred stock dividends, including undeclared dividends 16,670
Adjusted EBITDA 481,674$
LQA Adjusted EBITDA (Adjusted EBITDA x 4) 1,926,696$
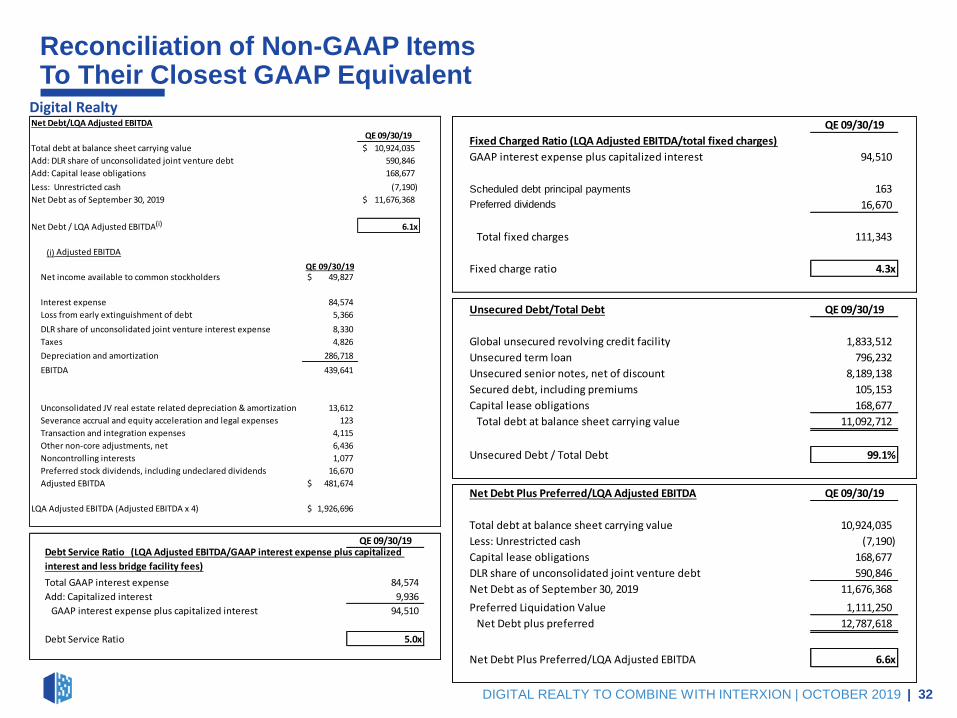
Reconciliation of Non-GAAP ItemsTo Their Closest GAAP Equivalent
DIGITAL REALTY TO COMBINE WITH INTERXION | OCTOBER 2019 | 32
Net Debt Plus Preferred/LQA Adjusted EBITDA QE 09/30/19
Total debt at balance sheet carrying value 10,924,035
Less: Unrestricted cash (7,190)
Capital lease obligations 168,677
DLR share of unconsolidated joint venture debt 590,846
Net Debt as of September 30, 2019 11,676,368
Preferred Liquidation Value (iv) 1,111,250
Net Debt plus preferred 12,787,618
Net Debt Plus Preferred/LQA Adjusted EBITDA (iii) 6.6x
Unsecured Debt/Total Debt QE 09/30/19
Global unsecured revolving credit facility 1,833,512
Unsecured term loan 796,232
Unsecured senior notes, net of discount 8,189,138
Secured debt, including premiums 105,153
Capital lease obligations 168,677
Total debt at balance sheet carrying value 11,092,712
Unsecured Debt / Total Debt 99.1%
QE 09/30/19
Fixed Charged Ratio (LQA Adjusted EBITDA/total fixed charges)
GAAP interest expense plus capitalized interest 94,510
Scheduled debt principal payments 163
Preferred dividends 16,670
Total fixed charges 111,343
Fixed charge ratio 4.3x
Net Debt/LQA Adjusted EBITDA
QE 09/30/19
Total debt at balance sheet carrying value 10,924,035$
Add: DLR share of unconsolidated joint venture debt 590,846
Add: Capital lease obligations 168,677
Less: Unrestricted cash (7,190)
Net Debt as of September 30, 2019 11,676,368$
Net Debt / LQA Adjusted EBITDA(iii) 6.1x
(iii) Adjusted EBITDA
Net income available to common stockholders 49,827$
Interest expense 84,574
Loss from early extinguishment of debt 5,366
DLR share of unconsolidated joint venture interest expense 8,330
Taxes 4,826
Depreciation and amortization 286,718
EBITDA 439,641
Unconsolidated JV real estate related depreciation & amortization 13,612
Severance accrual and equity acceleration and legal expenses 123
Transaction and integration expenses 4,115
Other non-core adjustments, net 6,436
Noncontrolling interests 1,077
Preferred stock dividends, including undeclared dividends 16,670
Adjusted EBITDA 481,674$
LQA Adjusted EBITDA (Adjusted EBITDA x 4) 1,926,696$
QE 09/30/19
Total GAAP interest expense 84,574
Add: Capitalized interest 9,936
GAAP interest expense plus capitalized interest 94,510
Debt Service Ratio 5.0x
Debt Service Ratio (LQA Adjusted EBITDA/GAAP interest expense plus capitalized
interest and less bridge facility fees)
(i)
(i)
QE 09/30/19
Digital Realty
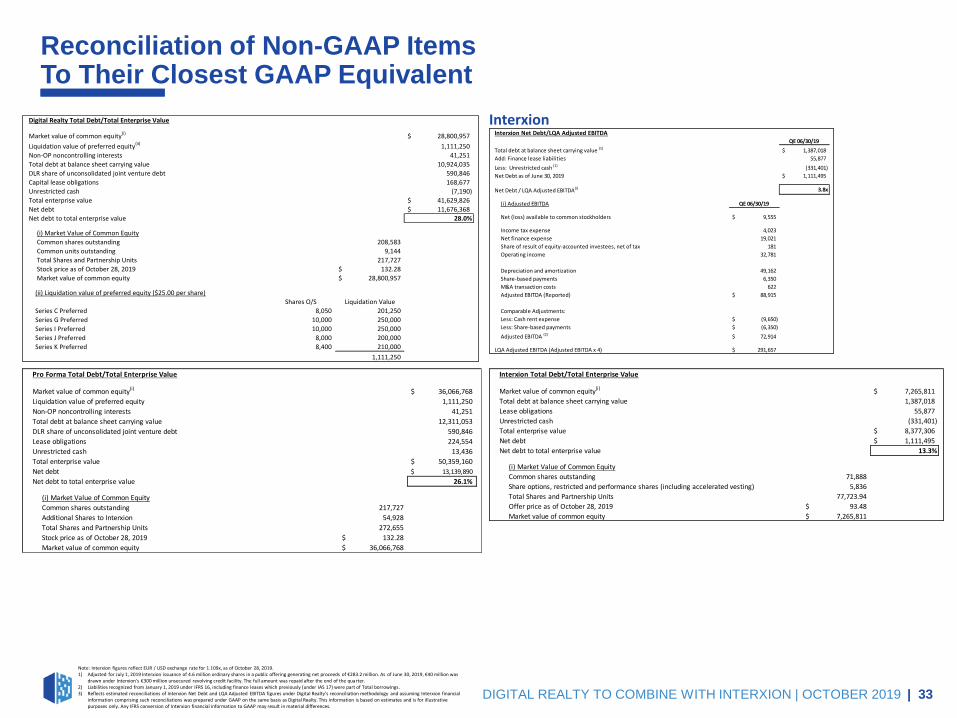
Digital Realty Total Debt/Total Enterprise Value
Market value of common equity(i)28,800,957$
Liquidation value of preferred equity(ii)1,111,250
Non-OP noncontrolling interests 41,251
Total debt at balance sheet carrying value 10,924,035
DLR share of unconsolidated joint venture debt 590,846
Capital lease obligations 168,677
Unrestricted cash (7,190)
Total enterprise value 41,629,826$
Net debt 11,676,368$
Net debt to total enterprise value 28.0%
(i) Market Value of Common Equity
Common shares outstanding 208,583
Common units outstanding 9,144
Total Shares and Partnership Units 217,727
Stock price as of October 28, 2019 132.28$
Market value of common equity 28,800,957$
(ii) Liquidation value of preferred equity ($25.00 per share)
Shares O/S Liquidation Value
Series C Preferred 8,050 201,250
Series G Preferred 10,000 250,000
Series I Preferred 10,000 250,000
Series J Preferred 8,000 200,000
Series K Preferred 8,400 210,000
1,111,250
Reconciliation of Non-GAAP ItemsTo Their Closest GAAP Equivalent
DIGITAL REALTY TO COMBINE WITH INTERXION | OCTOBER 2019 | 33
Note: Interxion figures reflect EUR / USD exchange rate for 1.109x, as of October 28, 2019.1) Adjusted for July 1, 2019 Interxion issuance of 4.6 million ordinary shares in a public offering generating net proceeds of €283.2 million. As of June 30, 2019, €40 million was
drawn under Interxion’s €300 million unsecured revolving credit facility. The full amount was repaid after the end of the quarter.2) Liabilities recognized from January 1, 2019 under IFRS 16, including finance leases which previously (under IAS 17) were part of Total borrowings.3) Reflects estimated reconciliations of Interxion Net Debt and LQA Adjusted EBITDA figures under Digital Realty’s reconciliation methodology and assuming Interxion financial
information comprising such reconciliations was prepared under GAAP on the same basis as Digital Realty. This information is based on estimates and is for illustrative purposes only. Any IFRS conversion of Interxion financial information to GAAP may result in material differences.
InterxionInterxion Net Debt/LQA Adjusted EBITDA
QE 06/30/19
Total debt at balance sheet carrying value (1) 1,387,018$
Add: Finance lease liabilities 55,877
Less: Unrestricted cash (1) (331,401)
Net Debt as of June 30, 2019 1,111,495$
Net Debt / LQA Adjusted EBITDA(i) 3.8x
(i) Adjusted EBITDA QE 06/30/19
Net (loss) available to common stockholders 9,555$
Income tax expense 4,023
Net finance expense 19,021
Share of result of equity-accounted investees, net of tax 181
Operating income 32,781
Depreciation and amortization 49,162
Share-based payments 6,350
M&A transaction costs 622
Adjusted EBITDA (Reported) 88,915$
Comparable Adjustments:
Less: Cash rent expense (9,650)$
Less: Share-based payments (6,350)$
Adjusted EBITDA (2) 72,914$
LQA Adjusted EBITDA (Adjusted EBITDA x 4) 291,657$
Interxion Total Debt/Total Enterprise Value
Market value of common equity(i)
7,265,811$
Total debt at balance sheet carrying value 1,387,018
Lease obligations 55,877
Unrestricted cash (331,401)
Total enterprise value 8,377,306$
Net debt 1,111,495$
Net debt to total enterprise value 13.3%
(i) Market Value of Common Equity
Common shares outstanding 71,888
Share options, restricted and performance shares (including accelerated vesting) 5,836
Total Shares and Partnership Units 77,723.94
Offer price as of October 28, 2019 93.48$
Market value of common equity 7,265,811$
Pro Forma Total Debt/Total Enterprise Value
Market value of common equity(i) 36,066,768$
Liquidation value of preferred equity 1,111,250
Non-OP noncontrolling interests 41,251
Total debt at balance sheet carrying value 12,311,053
DLR share of unconsolidated joint venture debt 590,846
Lease obligations 224,554
Unrestricted cash 13,436
Total enterprise value 50,359,160$
Net debt 13,139,890$
Net debt to total enterprise value 26.1%
(i) Market Value of Common Equity
Common shares outstanding 217,727
Additional Shares to Interxion 54,928
Total Shares and Partnership Units 272,655
Stock price as of October 28, 2019 132.28$
Market value of common equity 36,066,768$