global entrepreneurship monitor - esbri · global entrepreneurship monitor 2002 executive report...
TRANSCRIPT

Paul D.Reynolds • William D.Bygrave • Erkko Autio • Larry W.Cox • Michael Hay
2002 Executive Report
G L O B A L E N T R E P R E N E U R S H I P M O N I T O R
Global Entrepreneurship Monitor
2 0 0 2 E x e c u t i v e R e p o r t
Paul D. Reynolds, William D. Bygrave, Erkko Autio, Larry W. Cox, Michael Hay
Babson College
Ewing Marion Kauffman Foundation
London Business School
© 2002 Paul D. Reynolds, William D. Bygrave, Erkko Autio, Michael Hay, and the Ewing Marion Kauffman Foundation. All rights reserved.

The Global Entrepreneurship Monitor (GEM) is a unique, unprecedented effort to describe and analyze
entrepreneurial processes within a wide range of nations. By so doing, GEM focuses on one of the most fundamental
forces driving and carrying economic change, one that has until now remained elusive for researchers and policymakers
due to lack of reliable, internationally comparable data. Even though many influential economists have, for more than a
century, maintained that entrepreneurship is one of the most important dynamic forces shaping the economic landscape,
the causes and impacts of the phenomenon are still only poorly understood. Consequently, policymakers have lacked the
means of shaping effective and appropriate policies to nurture this phenomenon for national economic benefit.
The distinctive benefits of the GEM measures are that they are the only ones in existence to provide a direct
measure of individual-level, grassroots entrepreneurial processes. This represents a revolutionary development in data
collection because individual persons are the primary agents of entrepreneurial activity. No other measure exists that
could be used as a basis for reliable international comparisons. No other measure can be used to determine and analyze
the motivations driving individual economic agents. No other measure can be used to inform policymakers on how to
foster the development of entrepreneurial human capital.
This is the fourth annual GEM cross-national assessment of the level of entrepreneurship. The program has
expanded from 10 countries in 1999, 20 in 2000, 28 in 2001, to 37 for 2002. National teams are operating in 34 of these
countries; their host institutions, membership and sponsors are listed starting on page 2. Another 10 national teams are
expected to join the GEM consortium for 2003.
GEM is a collaborative effort in every sense of the word, in terms of financial resources (national teams provide
60 percent of the funding), intellectual resources, as well as design and analysis. A GEM-wide assessment and planning
meeting is held early in January of each year. The 10-person coordination team is assisted by more than 150 scholars
from 34 countries. The primary data collection associated with the adult population surveys is done by survey research
firms in each country, which this year involved 37 more sets of trained professionals.
The research program would not have developed without the support and encouragement of the three institutions
that have played a key role from the beginning. Babson College and London Business School have provided an optimal
context for a complex research project emphasizing entrepreneurship. The Ewing Marion Kauffman Foundation has
provided substantial start-up funding and continues to be a major source of financial support and strategic advice.
As GEM expands and improves it should continue to provide new insights into the scope and significance of the
entrepreneurial processes and how public policy can facilitate entrepreneurial contributions to national economic well-
being. New developments, and all national reports, can be found at www.gemconsortium.org.
Paul Reynolds
Coordinating Principal Investigator

Table of Contents
List of Tables ............................................................................................................................................... 1
List of Figures ............................................................................................................................................. 1
GEM 2002 Coordination Team, National Teams and Sponsors .............................................................. 2
Executive Summary .................................................................................................................................... 5
Scope of Entrepreneurial Activity .............................................................................................................. 8
Cross-National Differences in Entrepreneurial Activity ......................................................................... 10
Changes in Entrepreneurial Activity Over Time ...................................................................................... 13
Motivations and Types of Entrepreneurial Behavior .............................................................................. 16
Science, Technology and High Potential Entrepreneurship ................................................................... 20
Association of Entrepreneurial Activity and Economic Growth ............................................................ 23
National Context and Entrepreneurial Activity........................................................................................ 25
Special Topics ........................................................................................................................................... 28
Women and Entrepreneurship .................................................................................................. 28
Entrepreneurial Finance ............................................................................................................. 32
Family-Sponsored Entrepreneurship ......................................................................................... 34
Conclusions ............................................................................................................................................... 37
Appendix A: The GEM Conceptual Model ............................................................................................. 40
Appendix B: Data Collection ................................................................................................................... 42
End Notes ................................................................................................................................................. 44

1
List of Tables
Table 1 Total Entrepreneurial Activity (TEA) Index and Estimated Counts by Country
Table 2 Aggregate Changes in Total Entrepreneurial Activity (TEA) Over Time
Table 3 Change in Percent Growth in GDP and Total Entrepreneurial Activity (TEA) from 2000 to 2002
Table 4 Opportunity- and Necessity-Based Entrepreneurial Activity and Business Expectations
Table 5 Correlations Between High Potential Entrepreneurial Activity and National Entrepreneurial FrameworkCondition Indices
Table 6 Correlations Between Entrepreneurial Activity and National Economic Growth with Time Lags
Table 7 Correlations Between Entrepreneurial Activity and National Entrepreneurial Framework Condition Indices
Table 8 Correlations Between Entrepreneurial Activity and Selected Factors Believed to Affect Women’sParticipation in Entrepreneurship
Table 9 Total Entrepreneurial Activity (TEA) and Family-Sponsored Entrepreneurship for Selected Countries
Table B-1 Survey Research Firms and Sample Size by Country
Table E-1 Correlations Between the TEA Index and Other Measures of Entrepreneurial Activity
Table E-2 Correlations Between Year-to-Year Changes in Entrepreneurial Activity
List of Figures
Figure 1 Total Entrepreneurial Activity (TEA) by Country
Figure 2 Total Entrepreneurial Activity (TEA) by Global Region
Figure 3 Global Distribution of Total Entrepreneurial Activity (TEA) and Labor Force
Figure 4 Opportunity-Based Entrepreneurial Activity by Country
Figure 5 Necessity-Based Entrepreneurial Activity by Country
Figure 6 Total Entrepreneurial Activity (TEA) and Subsequent Growth in GDP
Figure 7 Entrepreneurial Activity by Gender and Age
Figure 8 Entrepreneurial Activity by Gender and Country
Figure 9 Domestic Classic Venture Capital Investment as a Percent of GDP (1999-2001)
Figure 10 Domestic Capital Investment as a Percent of GDP (Informal Investment Plus Classic Venture Capital)
Figure A-1 The GEM Conceptual Model

2
Unit
GEM ProjectDirectors
GEM ProjectCoordinator
GEM CoordinationTeam
Family BusinessSpecial Topic
Team
Argentina
Australia
Belgium
Brazil
Canada
Chile
China
Croatia
Institution
Babson College London Business School Babson College London Business School Babson College
London Business School
Alfred UniversityOregon State University
Institution
Center for EntrepreneurshipIAE Management and Business SchoolUniversidad AustralAustralian Graduate School of
EntrepreneurshipSwinburne University of TechnologyVlerick Leuven Gent Management
SchoolUniversiteit Gent
IBQP – Instituto Brasileiro daQualidade e Productividade noParaná
York University École des Hautes Études Commerciales
de Montréal (HEC – Montréal)
ESE – Universidad de Los Andes
Tsinghua University
SME’s Policy Centre – CEPOR Zagreb and Faculty of Economics
University of J. J. Strossmayer, Osijek
Members
William D. Bygrave Michael Hay Paul D. Reynolds
Paul D. Reynolds William D. BygraveMarcia Cole Paul D. Reynolds Erkko AutioMarc CowlingMichael HaySteven Hunt Isabelle Servais Natalie De BonoMichelle Hale Kola AzeezVeronica Ayi-BonteMatthew FreegardAnwen GarstonRuth LaneShu Lyn Emily Ng Thomas BailyCarol WittmeyerMark Green
Members
Silvia Torres CarbonellHector RochaFlorencia PaoliniKevin HindleSusan RushworthDeborah JonesSophie ManigartBart ClarysseHans CrijnsDirk De Clercq Nico Vermeiren Frank VerzeleFulgêncio Torres ViruelMarcos Mueller SchlemmSimara Maria S. S. GrecoJoana Paula Machado Nerio Aparecido CardosoDaniele de LaraMaria José R. PontoniRein PetersonNathaly RiverinRobert Kleiman
Alfredo Enrione Jon Martinez Alvaro Pezoa Gerardo Marti Nicolas BesaFernando SuarezJian GaoZhiqiang ChenYuan ChengRobert EengYanfu JiangBiao JiaTan LiFang LiuQung QuiZhenglei TangJianfei WangJun YangHenjun XuSlavica Singer Sanja Pfeifer Natasa Sarlija Suncica Oberman
Financial Sponsor
Ewing Marion Kauffman Foundation
The Laing Family Charitable Settlement
David Potter Foundation
Anonymous Foundation Fellow
Raymond Family Business Institute
Financial Sponsor
IAE Management and Business SchoolHSBC Private Equity Latin America
Sensis Pty Ltd
Vlerick Leuven Gent Management SchoolSteunpunt Ondernemerschap, Ondernemingen en
Innovatie (Vlaamse Gemeenschap)
IBQP – Instituto Brasileiro da Qualidade eProductividade no Paraná
SEBRAE – Serviço Brasileiro de Apoio às Micro ePequenas Empresas
Développement Économique Canada, Québec Industry Canada, Small Business Policy Branch Anne & Max Tanenbaum Chair, Schulich School of
Business, York UniversityChaire d'entrepreneurship Maclean Hunters, HEC
MontréalESE Business School – Universidad de Los Andes
ADIMARK ING GroupPriceWaterhouseCoopersBanco de Crédito e Inversiones
National Entrepreneurship Research Center of TsinghuaUniversity
Asian Institute of Babson College
Faculty of Economics, University of J.J. StrossmayerOsijek Open Society InstituteCroatia Ministry of Crafts, Small and Medium
Enterprises, Zagreb SME‘s Policy Centre – CEPOR Zagreb
GEM 2002 Coordination Team, NationalTeams and Sponsors

3
Denmark
Finland
France
Germany
Hong Kong
Hungary
Iceland
India
Ireland
Israel
Italy
Japan
Korea
Mexico
New Zealand
Norway
Singapore
Slovenia
University of Southern DenmarkCentre for Small Business Studies
Helsinki University of Technology
EM Lyon
University of Cologne
The Chinese University of Hong Kong
University of PécsUniversity of Baltimore (USA)
Reykjavik University
Indian Institute of Management,Bangalore
University College, Dublin
Tel Aviv University
Babson College (USA)
Keio UniversityUniversity of Marketing & Distribution
SciencesSoongsil Unversity
ITESM-EGADE
New Zealand Centre for Innovation &Entrepreneurship
UNITEC Institute of Technology
Bodø Graduate School of Business
National University of Singapore
Institute for Entrepreneurship andSmall Business Management,Faculty of Economics & Business,University of Maribor
Mick HancockTorben BagerLone Toftild
Erkko AutioPia AreniusAnne KovalainenDaniel Evans Isabele Servais Aurélien EminetLoic MaheraultRolf SternbergHeiko BergmannBee-Leng Chua David Ahlstrom Kevin Au Cheung-Kwok Law Chee-Keong Low Shige Makino Hugh ThomasLászló SzerbZoltán AcsAttila VargaJózsef UlbertÉva BodorAgnar Hansson Ludvik Eliasson Gu∂rún Mjöll Sigur∂ardóttir Halla Tomasdottir Gylfi ZoegaRognvaldur SaemundssonMathew J. ManimalaMalathi V. Gopal Mukesh SudRitesh DharPaula FitzsimonsColm O'GormanFrank RocheMiri LernerYehushua Hendeles
Maria Minniti
Tsuneo YahagiTakehiko Isobe
Yun Jae Park Hyun Duck Yoon Young Soo KimMarcia CamposElvira E. Naranjo Priego
Howard FrederickPeter CarswellHelen MitchellElla Henry Andy Pivac Paul Woodfield Judy Campbell Vance Walker
Lars KolvereidErland BullvågSvenn Are JenssenEirik PedersenElin OftedalPoh Kam Wong Finna WongLena LeeMiroslav Rebernik Matej Rus Dijana Mocnik Karin Sirec-Rantasa Polona Tominc Miroslav Glas Viljem Psenicny
Erherva-og Boligstyrelsen Ernst & Young (Denmark) Karl Petersen og Hustrus Industrifond Danfoss VækstfondenMinistry of Trade and Industry
Chaire Rodolphe Mérieux Entreprendre
Deutsche Ausgleichsbank (DtA)Ernst & YoungTrade and Industry Department, SME Development
Fund, Hong Kong Government SAR Asia Pacific Institute of Business The Chinese University of Hong Kong Chinese Executives Club Hong Kong Management Association
University of PécsMinistry of Economic AffairsUniversity of Baltimore (USA)REORG Gazdasagi es Penzugyi Rt
Reykjavik UniversityCentral Bank of IcelandThe Confederation of Icelandic Employers New Business Venture FundPrime Minister’s Office
N.S Raghavan Centre for Entrepreneurial Learning, IIMBangalore
Enterprise Ireland
HTMS – The High-Tech School at the Faculty ofManagement, Tel-Aviv University
Robert Faktor The Evens FoundationW. Glavin Center for Entrepreneurial Leadership at
Babson CollegeMonitor Company
BK21 Ensb Program
EGADEITESM Graduate School of Business Administration and
LeadershipMinistry of Economic Development Venture Taranaki Enterprise Waitakere Manukau City Council Te Puni Kokiri / Ministry of Maori Development North Shore CityEnterprise North ShoreEspy Magazine – The Entrepreneur’s BibleUNITEC School of Management & EntrepreneurshipBartercard New Zealand Ltd.Ministry of Trade and Industry Bodø Graduate School of Business Kunnskapsparken AS Bodø, Center for Innovation and
Entrepreneurship
Economic Development Board of Singapore
Ministry of Education, Science and Sports Ministry of the Economy Small Business Development Center Finance – Slovenian Business Daily
Team Members Institution Financial Sponsor

4
South Africa
Spain
Sweden
Switzerland
Taiwan (Chinese Taipei)
Thailand
The Netherlands
United Kingdom
United Kingdom, Scotland Unit
United Kingdom,Wales Unit
United States
Graduate School of Business,University of Cape Town
Instituto de Empresa
ESBRI Entrepreneurship and SmallBusiness Research Institute
HEC-Lausanne Switzerland IMD CERN-GenevaSt. Gallen University
National Taiwan University
College of Management MahidolUniversity (CMMU)
EIM Business & Policy Research
London Business School
University of StrathclydeHeriot Watt University
University of Glamorgan University of Wales, BangorBabson College
Mike Herrington Mary-Lyn Foxcroft Jacqui Kew Nick Segal Eric WoodAlicia Coduras MartinezRachida JustoJulio DeCastroJoseph PistruiMagnus AronssonHelene Thorgrimsson
Bernard Surlemont Benoit Leleux Georges Haour Erkko Autio Thierry VoleryChen-en KoJennifer Hui-ju Chen Hsiu-te Sung Chien-chi TsengBrian Hunt Suphannee Leardviriyasak Thanaphol Virasa Sirin Chachitsophon Rossukhon NumdengSander WennekersNiels BosmaArnoud MuizerRo BraaksmaHeleen StigterRoy ThurikRebecca Harding Niels BillouMichael Hay
Jonathan LevieColin MasonWendy Mason Laura GallowayDavid BrooksbankDylan Jones-EvansHeidi NeckAndrew ZacharakisWilliam D. BygravePaul D. Reynolds
Liberty Group Standard Bank South African Breweries Khula Enterprise Finance Ntsika Enterprise Promotion AgencyNAJETI Chair of Entrepreneurship and Family Business
Confederation of Swedish Enterprise Ministry of Industry, Employment and Communications Swedish Business Development AgencySwedish Institute for Growth Policy Studies, ITPSChambre Vaudoise de Commerce et dl'Industrie (CVCI) Renaissance PME Réseau Suisse d'Innovation (RSI-SNI)
Small and Medium Enterprise Administration, Ministryof Economic Affairs
College of Management Mahidol University
Dutch Ministry of Economic Affairs
Small Business Service Barclays Bank The Work Foundation South East of England Development Agency One North East InvestNI Entrepreneurial Working Party Ernst & YoungHunter Centre for Entrepreneurship
Welsh Development Agency
Ewing Marion Kauffman Foundation
Team Members Institution Financial Sponsor

5
Executive Summary
The Global Entrepreneurship Monitor (GEM), in its fourth year of assessing entrepreneurial activity worldwide,
estimates that more than 460 million adults around the globe were engaged in entrepreneurial activity in 2002. This
dramatic and unexpected conclusion is extrapolated from an extensive survey of 37 countries containing more than
three-fifths of the world’s population and 92 percent of its gross domestic product (GDP). According to GEM 2002, these
countries currently have around 286 million adults active in entrepreneurship. The other two-fifths of the world’s
population probably contain an additional 174 million individuals who are entrepreneurially active. Clearly then, the
GEM initiative has blossomed into a global assessment of a truly global phenomenon.
From its inception, the major objectives of the GEM research program have been to:
■ measure differences in the level of entrepreneurial activity between countries,
■ probe for a systematic relationship between entrepreneurship and national economic growth,
■ uncover factors that lead to higher levels of entrepreneurship, and
■ suggest policies that may enhance the national level of entrepreneurial activity.
This report focuses on the first two objectives. It also expands on previous GEM analysis with insights gained as
the result of tracking changes in entrepreneurial activity over time, and delving more deeply into the motivations and
outcomes of entrepreneurial behavior. Further, it introduces three topics of particular interest in entrepreneurship:
patterns of female participation, sources of financial support and the prevalence of family-sponsored ventures. The
latter two objectives are only partially addressed in this report but will be at the center of a series of special topic
reports to be released in the spring of 2003.
Based on the conceptual model summarized in Appendix A, four types of data collection formed the basis of the
GEM 2002 assessment. First, representative samples of 1,000 to 15,000 randomly selected adults were surveyed in
each country in order to provide a harmonized measure of the prevalence of entrepreneurial activity — the “total
entrepreneurial activity” (TEA) index1 (i.e., that percent of the labor force that is either actively involved in starting a new
venture or the owner/manager of a business that is less than 42 months old2). Second, each GEM national team
performed up to 50 face-to-face interviews with experts in their country, chosen to represent nine entrepreneurial
framework features. Third, these same experts were asked to complete a standardized questionnaire in order to obtain
a precise measure of their judgments about their country as a suitable context for entrepreneurial activity. Finally,
standardized national data were obtained from international data sources such as the World Bank, International
Monetary Fund, United Nations, and the like. A longer summary of the GEM research methodology appears in
Appendix B, and technical details are available in an operations manual available upon request.

6
In general, the GEM 2002 report provides answers to the following questions:
How much entrepreneurial activity was there in 2002?
About 286 million individuals, or 12 percent of 2.4 billion adults 18 to 64 years of age in the 37 GEM 2002
countries, were either actively engaged in the start-up process or managing a business less than 42 months old in the
spring of 2002. Since these countries represent 62 percent of the world population, this would suggest that about 460
million persons are involved in entrepreneurship worldwide.
Does the level of entrepreneurial activity vary between countries?
Yes, there is substantial variation. While less than 3 percent of adults 18 to 64 years of age are involved in
entrepreneurial endeavors in Japan, Russia and Belgium, more than 18 percent are so engaged in India and Thailand.
The level of entrepreneurial activity was lowest in the developed Asian countries (Japan, Hong Kong, Chinese Taipei and
Singapore) and Central Europe (Russia, Croatia, Poland, Slovenia and Hungary), slightly higher in EU Europe plus Israel,
substantially higher in the former British Empire Anglo countries (Australia, Canada, New Zealand, South Africa, and the
United States), higher still in Latin America (Argentina, Brazil, Chile and Mexico), and highest in the developing Asian
countries (China, Korea, India, and Thailand).
Does the level of entrepreneurial activity change over time?
Yes. Entrepreneurial activity dropped 25 percent between 2001 and 2002 among the countries that participated in
GEM 2001. This is important given the fact that there was little change between 2000 and 2001. These findings appear
to reflect global stability in economic growth from 2000 to 2001 but a universal decline from 2001 to 2002. However,
despite the recent drop in entrepreneurship, the relative rankings between countries remains quite stable over time.
Why do people become entrepreneurs?
About two-thirds of the entrepreneurially active adults in the GEM 2002 countries are voluntarily pursuing an
attractive business opportunity. About one-third, on the other hand, are engaged in entrepreneurship out of necessity
— that is, they can find no other suitable work. Opportunity-motivated entrepreneurs are dominant in developed
countries, while necessity-motivated entrepreneurs comprise up to half of those involved in entrepreneurship in
developing countries.
Who are the entrepreneurs?
Age and gender have a very stable relationship to entrepreneurial activity. Men are twice as likely to be involved
as women, and those 25 to 44 years of age are most likely to be involved with all types of entrepreneurial activity. The
processes that lead to women being involved in entrepreneurial activity may be different than for men. In developed
countries women are more involved where there is equality in career opportunities; in developing countries women’s
participation may reflect the lack of jobs and an inadequate education.
7
What types of businesses are being created?
All economic sectors are reflected in the types of new businesses that are being developed. However, 93 percent
of entrepreneurially active adults consider their business to be a replication of an existing business activity. A small
minority (7 percent) expect their new firms to create a significant new market niche or economic sector, and a very small
proportion of these expect to create new market niches, provide 20 or more jobs in five years, and have exports outside
their own country. Most of these “high potential” new ventures reflect the pursuit of opportunity, though many
necessity entrepreneurs also believe that their firms will have high impact.
What is the relationship between entrepreneurship and economic growth?
Evidence continues to accumulate that the national level of entrepreneurial activity has a statistically significant
association with subsequent levels of economic growth. However, it is important to view these findings with caution
since several more years of data are necessary in order for the causal mechanisms to be determined.
How do national experts assess the entrepreneurial climate in their own countries?
Three of nine entrepreneurial framework conditions — government policies, cultural and social norms, and
education and training — are among the aspects generally acknowledged as both national strengths and weaknesses.
The availability of financial support for start-ups is typically given intermediate weight as either a strength or weakness.
National experts seem to be working with and well informed about similar opportunity-motivated sectors — even
between countries possessing quite different levels of development. None of the national experts seemed well
informed about the necessity-motivated entrepreneurship in their country.
How important is venture capital and informal finance?
The aggregate amount of venture capital allocated for start-up activities in 2001 was US$59 billion for the 37
countries included in the GEM 2002. Informal funding provided to new firms was six times greater — US$298 billion.
Further, formal venture capital was provided to less than one in 10,000 start-ups and there was substantial variation in the
average amount invested per firm — from US$400,000 to US$12 million. Informal funding, on the other hand, was
provided by 1 to 7 percent of the adult populations to literally tens of millions of individuals involved in the start-up process.
However, it was invested in very small amounts per firm, averaging from US$100 on the low end to US$60,000 on the high
end. The majority of new firms appear to be implemented with substantial support from the immediate family.

8
Scope of Entrepreneurial Activity
Of the 2.4 billion persons comprising the labor force represented in the 37 countries of the GEM 2002 study, 12
percent (286 million) are either actively involved in a starting a business or are the owner/manager of a business that is
less than 42 months old. Each country’s portion of this entrepreneurial activity is shown in Table 1. The total population
is provided in the first column, the number of individuals 18 to 64 years old3 (i.e., those eligible for the labor force) in the
second column, and the TEA rate in the third. The fourth column provides the estimated number of entrepreneurially
active individuals in each country. The last three columns indicate whether or not a country was involved in previous
GEM assessments.
Table 1: Total Entrepreneurial Activity (TEA) Index and Estimated Counts by Country
Total Population Total Labor TEA Index Count of TEA GEM GEM GEM 2002 Force 2002 2002 Participants 1999 2000 2001
CountryIndia 1,046,000,000 591,466,000 17.9 105,872,000 x xChina 1,284,000,000 814,470,000 12.3 100,179,000United States 280,000,000 173,911,000 10.5 18,260,000 x x xBrazil 176,029,000 106,442,000 13.5 14,369,000 x xThailand 62,354,000 40,435,000 18.9 7,642,000Mexico 103,400,000 58,331,000 12.4 7,233,000 xKorea 48,324,000 32,117,000 14.5 4,656,000 x xArgentina 37,812,000 21,987,000 14.2 3,122,000 x xGermany 83,251,000 53,458,000 5.2 2,779,000 x x xRussia 144,978,000 94,330,000 2.5 2,358,000 xItaly 57,715,000 37,102,000 5.9 2,189,000 x x xUnited Kingdom 59,778,000 36,927,000 5.4 1,994,000 x x xCanada 31,902,000 20,565,000 8.8 1,809,000 x x xSouth Africa 43,647,000 24,886,000 6.5 1,617,000 xChile 15,498,000 9,388,000 15.7 1,473,000Japan 126,974,000 81,290,000 1.8 1,463,000 x x xSpain 40,077,000 25,886,000 4.6 1,190,000 xFrance 59,765,000 36,682,000 3.2 1,173,000 x x xPoland 38,625,000 24,899,000 4.4 1,095,000 xAustralia 19,546,000 12,273,000 8.7 1,067,000 x xChinese Taipei (Taiwan) 22,548,000 14,708,000 4.3 632,000The Netherlands 16,067,000 10,348,000 4.6 476,000 xHungary 10,075,000 6,557,000 6.6 432,000 xNew Zealand 3,908,000 2,432,000 14.0 340,000 xSwitzerland 7,301,000 4,696,000 7.1 333,000Israel 6,029,000 3,485,000 7.1 247,000 x x xNorway 4,525,000 2,781,000 8.7 241,000 x xDenmark 5,368,000 3,397,000 6.5 220,000 x x xSweden 8,876,000 5,433,000 4.0 215,000 x xIreland 3,883,000 2,289,000 9.1 208,000 x xBelgium 10,274,000 6,376,000 3.0 191,000 x xSingapore 4,452,000 3,191,000 5.9 188,000 x xHong Kong 7,303,000 4,955,000 3.4 168,000Finland 5,183,000 3,274,000 4.6 150,000 x x xCroatia 4,390,000 2,739,000 3.6 98,000Slovenia 1,932,000 1,278,000 4.6 58,000Iceland 279,000 172,000 11.3 19,000Sum 3,882,068,000 2,374,956,000 285,756,000 10 20 28Country Average 8.0Total Population Average 12.0
NOTE: Portugal was involved in the GEM 2001 assessment, but was not able to be part of GEM 2002.

9
The TEA index average across countries — which gives equal weight to each country regardless of size — is
8 percent. However, when the size of the labor force in each of the GEM countries is taken into account, the prevalence
rate climbs to 12 percent. This reflects the impact of the 1.4 billion persons in the labor force in China and India, half
the population represented by the sample. Further, dividing the total count of TEA participants, 286 million, by the
proportion of the world population included in the GEM 2002 countries (62 percent) yields a global estimate of 460
million. This number may in fact underestimate the scope of entrepreneurial activity worldwide because most countries
not yet included in the GEM assessment are developing nations with massive populations. Heavily populated countries
such as Egypt, Indonesia, Iran, Nigeria, Malaysia, Pakistan, Philippines, Turkey and Vietnam may exhibit higher TEA rates
than the more developed nations already represented in the GEM analysis.
What is to be made of this? One basis of comparison might be the human birth rate. For 2002 the estimated human
birth rate for the world is 2.2 births per year per 100 in the population, or 135 million births for a global population of 6.1
billion. The total estimate of the global count of those entrepreneurially active at 460 million is more than three times
that number! Participating in business start-ups is clearly a major feature of the work lives of many individuals —
affecting many of their family members and friends — thus deserving more systematic attention in its own right.

10
Cross-National Differences inEntrepreneurial Activity
The level of entrepreneurial activity among the 37 countries in GEM 2002 is presented in Figure 1. As this chart
illustrates, the TEA rate varies from about 2 percent for Japan (1 in 50) to 19 percent for Thailand (1 in 5). The vertical
bars display the 95 percent confidence intervals — sometimes referred to as the margins of error — and indicate the
precision of these estimates. In those situations where the vertical bars overlap, there is no statistically significant
difference between the countries under consideration. Hence, Thailand, India and perhaps Chile would be considered to
have equivalent levels of entrepreneurial activity at the high end, with Japan, Russia, Belgium, France and Hong Kong at
a comparable level on the low end. The length of the bars is a reflection of differences in sample size, from wide
vertical bars for samples of 1,000 in Mexico and Thailand to narrow bars for Germany and the United Kingdom, where
samples exceeded 15,000.
Figure 1: Total Entrepreneurial Activity (TEA) by Country
– Upper
– Average
– Lower
Japa
nRu
ssia
Belg
ium
Fran
ceHo
ng K
ong
Croa
tiaSw
eden
Chin
ese
Taip
eiPo
land
Finl
and
The
Net
herla
nds
Slov
enia
Spai
nGe
rman
yUn
ited
King
dom
Italy
Sing
apor
eDe
nmar
kSo
uth
Afric
aHu
ngar
yIs
rael
Switz
erla
ndAu
stra
liaN
orw
ayCa
nada
Irela
ndUn
ited
Stat
esIc
elan
dCh
ina
Mex
ico
Braz
ilN
ew Z
eala
ndAr
gent
ina
Kore
aCh
ileIn
dia
Thai
land
ALL
Coun
tries
25.00
20.00
15.00
10.00
5.00
0.00
Pers
ons
per 1
00 A
dults
, 18-
64 Y
rs O
ld (9
5% C
onfid
ence
Inte
rval)
It is clear from this analysis that entrepreneurship is not uniformly distributed around the world. However, it is also
obvious that certain geographical/cultural clusters demonstrate remarkable similarity in terms of the level and nature of
entrepreneurial activity occurring within their borders. For the sake of comparison, the GEM 2002 countries have been

11
reordered into the following six groupings: (1) Eleven members of the European Union (EU) plus Iceland, Israel, Norway
and Switzerland; (2) five countries from Eastern Europe; (3) four Latin American countries; (4) five former British Empire
Anglo countries (Australia, Canada, New Zealand, South Africa and the United States); (5) four developed Asian
countries; and (6) four developing Asian countries. As Figure 2 illustrates, entrepreneurial activity is uniformly low in the
Developed Asian and Eastern European groups, as well as within most of the members of the EU. By contrast, the
former British Empire Anglo nations have a relatively higher level of activity, and the Latin American countries are higher
still. Yet, it is the Developing Asian countries that have the highest TEA rates. Paradoxically, many of the most and
least entrepreneurial countries are located in Asia where they often share the same cultural background and, in some
cases, contiguous borders. A more complete understanding of the diversity in this part of the world will be a major focus
of future GEM research.
Figure 3 presents each of the six regions’ percentage of the total labor force in comparison to its proportion of all
those who are entrepreneurially active. The massive populations residing in countries like India and China explain why
the Developing Asian countries (with 63 percent of the labor force) are hosting such a large portion (77 percent) of
entrepreneurial activity. Latin American and former British Empire Anglo countries contain about the same percent of
both labor force and entrepreneurially active individuals. In contrast, the EU, Eastern Europe and the Developed Asian
countries possess about 19 percent of the labor force but only 6 percent of those who are involved in entrepreneurship.
Both the levels of participation and the consequences, in terms of the numbers of active individuals, vary considerably
from region to region.
Figure 2: Total Entrepreneurial Activity (TEA) by Global Region
–
verage
25.00
20.00
15.00
10.00
5.00
0.00
Pers
ons
per 1
00 A
dults
, 18-
64 Y
rs O
ld (9
5% C
onfid
ence
Inte
rval)
Japa
nHo
ng K
ong
Chin
ese
Taip
eiTT
Sing
apor
eGr
oup
Aver
age
Russ
iaCr
oatia
Pola
ndSl
oven
iaHu
ngar
yGr
oup
Aver
age
Belg
ium
Fran
ceSw
eden
Finl
and
The
Net
herla
nds
Spai
nGe
rman
yUn
ited
King
dom
Italy
Denm
ark
Isra
elSw
itzer
land
Nor
way
Irela
ndIc
elan
dGr
oup
Aver
age
Sout
h Af
rica
Aust
ralia
Cana
daUn
ited
Stat
esN
ew Z
eala
ndGr
oup
Aver
age
Mex
ico
Braz
ilAr
gent
ina
Chile
Grou
p Av
erag
e
Chin
aKo
rea
Indi
aTh
aila
ndGr
oup
Aver
age
Asia Asia(Developed)(Developed)
Former British Empire (Anglo)
European Union +4 Latin America
Asia (Developing)
Eastern Europe

12
Figure 3: Global Distribution of Total Entrepreneurial Activity (TEA) and Labor Force
– GEM 2002 Labor Force
– GEM 2002 Entrepreneurial Activity
Perc
ent o
f Per
sons
18-
64 Y
rs O
ld
4%1%
77%
10%
5%
63%
European Union +4
Eastern Europe Asia (Developing)0%
10%
20%
30%
40%
50%
60%
70%
80%
9%8%
Latin America
8%10%
Former British Empire (Anglo)
1%4%
Asia (Developed)

13
Changes in Entrepreneurial Activity Over Time
The global level of entrepreneurship has certainly changed over the past three years. As seen in Table 2, for
example, the number of entrepreneurially active adults among the 20 countries included in GEM 2000 increased from 123
to 133 million between 2000 and 2001, and then to 161 million in 2002. A similar pattern was found among the 28
countries in GEM 2001. It is interesting to note, however, that these increases occurred despite the fact that the average
participation rate per country fell during this period. The explanation is that growth in the human population and
entrepreneurial activity of large developing countries more than offset the decline in entrepreneurship evidenced among
the developed countries, mostly in Western Europe. Indeed, among the G-7 countries, while the population and labor
force grew from 689 to 699 million, and 416 to 440 million, respectively, between 2000 and 2002, the number of
entrepreneurially active individuals declined from 45 to 30 million. While the United States and Canada experienced only
small declines, the other G-7 nations underwent major shifts, especially between 2001 and 2002.
Table 2: Aggregate Changes in Total Entrepreneurial Activity (TEA) Over Time
Data collection year 2000 2001 2002Number of countries in project 20 28 37GEM 2002 CountriesTEA index (average across countries) 8.0%TEA Index (based on total labor force) 12.0%Lowest TEA level of activity 1.8%Highest TEA level of activity 18.9%Total population, all ages (thousands) 3,882,000Total labor force: 18-64 yrs. (thousands) 2,375,000Total active in entrepreneurial process (thousands) 286,000
GEM 2001 Countries*TEA index (average across countries) 9.6% 7.6%TEA index (based on total labor force) 10.8% 11.8%Lowest TEA level of activity 4.5% 1.8%Highest TEA level of activity 20.7% 17.9%Total population, all ages (thousands) 2,453,000 2,476,000Total labor force: 18-64 yrs. (thousands) 1,462,000 1,482,000Total active in entrepreneurial process (thousands) 158,000 175,000
GEM 2000 Countries**TEA index (average across countries) 9.5% 9.2% 7.7%TEA index (based on total labor force) 10.8% 10.7% 12.8%Lowest TEA level of activity 4.2% 4.5% 1.8%Highest TEA level of activity 21.4% 15.5% 17.9%Total population, all ages (thousands) 2,044,000 2,089,000 2,112,000Total labor force: 18-64 yrs. (thousands) 1,132,000 1,239,000 1,258,000Total active in entrepreneurial process (thousands) 123,000 133,000 161,000
G-7 Countries***TEA index (average across countries) 8.9% 8.7% 5.8%TEA index (based on total labor force) 10.8% 8.3% 6.7%Lowest TEA level of activity 5.6% 5.2% 1.8%Highest TEA level of activity 16.6% 11.6% 10.5%Total population, all ages (thousands) 689,000.00 696,000 699,000Total labor force: 18-64 yrs. (thousands) 416,000.00 438,000 440,000Total active in entrepreneurial process (thousands) 45,000.00 40,000 30,000*Portugal not in project for 2002, not included for 2001 comparison, **Ireland data for 2000 was not usable, dropped for 2001, 2002 comparisons, ***Canada, France, Germany, Italy, Japan,
United Kingdom, and United States.

14
Yet, while Table 2 describes where entrepreneurship has flourished and floundered over the past few years, it
doesn’t explain why entrepreneurial activity should increase or decrease in the first place. Traditionally, two major
factors have been proffered as critical to the prevalence of entrepreneurial endeavors within a given nation: (a) current
macroeconomic conditions, and (b) enduring cultural/social norms and national institutions. Yet prior to the GEM
research program, the precise impact of either factor had not been scientifically observed or established. Theoretically,
if the state of the economy were the primary determinant of the level of entrepreneurship, then year-to-year variation in
entrepreneurial activity would be expected. If, on the other hand, cultural/social norms and national institutions were
the overriding causal mechanisms, relatively stable year-to-year levels of entrepreneurship would be anticipated. Most
of the factors previously shown through GEM research to have stable and significant relationships with the level of
entrepreneurial activity have been elements that change rather slowly over time.4 Therefore, it has been assumed that
deeply embedded cultural and institutional characteristics are the primary drivers of national entrepreneurial activity
above and beyond the more transient economic components of the environment. Yet the generally positive economy
that enveloped the world from 1999 to early 2001 may have masked the true influence of variations in the general
macroeconomic climate.
Evidence for year-to-year stability — entrepreneurial activity reflecting slow-to-change cultural/social norms and
institutions — was found in the GEM 2001 assessment. As seen in Table 3, changes in the TEA index between 2000
and 2001 for 17 of the GEM 2000 countries were not statistically significant. That is, for all intents and purposes, they
remained unchanged from one year to the next. There was a statistically significant drop for only three countries during
this period (Brazil, Norway and the United States). However, the situation changed dramatically between 2001 and
2002. Over this time period, there was a statistically significant drop for 17 of the GEM 2001 countries, no change for
nine, and a significant increase for two — Argentina and India.5
Significantly, this pattern of change in the TEA index appears to mirror variations in the growth of GDP.6 Among the
20 countries in the GEM 2000, the average change in GDP growth from 1998-1999 to 1999-2000 was essentially zero
(i.e., 0.82 percent). That is, just as there was no perceptible change in the TEA rate (-0.37), there was no statistically
significant change in the annual growth rate for this period. Yet in the following period, from 1999-2000 to 2000-2001,
there was in fact a systematic decline in both the TEA rate (-2.29) and the annual rate of growth among every GEM
2001 country (-3.28)7. This suggests that the worldwide decline in entrepreneurial activity detected by GEM researchers
is associated with the recent drop in national economic growth.
Two phenomena illuminate how changes in national growth rates might affect the level of entrepreneurial activity.
First, about two-thirds of entrepreneurial activity reflects a desire to take advantage of a business opportunity. Second,
three-fourths or more of this opportunity-based entrepreneurship involves replication of existing business activity, thus
resulting in the creation of few (if any) new markets. Since the primary “opportunity” in most entrepreneurial efforts is
an unmet demand for goods and services, such unsatisfied demands are likely to increase with general growth in a
national economy. If, on the other hand, the national growth rate declines, there is likely to be a reduction in the
demand for goods and services and hence, less opportunity for market replication new businesses. Indeed, the

15
connection between the slowing economy and a reduction in entrepreneurial activity was most evident in those
countries — about half of the group — where a large portion of the entrepreneurship centers around opportunity-
motivated entrepreneurship.
However, the relative year-to-year rank order of the countries in GEM remains very stable. Country-by-country
comparisons of the 2000, 2001 and 2002 TEA rates yields statistically significant correlations that range from 0.61 to
0.81.8 Therefore, it is possible to conclude that this natural experiment — a universal drop in national economic growth
rates — provides evidence that both macroeconomic conditions and enduring national characteristics have an impact on
the level of entrepreneurial activity. A uniform drop in economic growth followed immediately by an almost universal
drop in entrepreneurial activity suggests that macroeconomic conditions have an effect. On the other hand, the relative
stability in the rank order of the countries suggests that stable national characteristics also play a part. As the GEM
research program continues it may be possible to provide more precise evidence about the relative impact of these
disparate sources of influence.
Table 3: Change in Percent Growth in GDP and Total Entrepreneurial Activity (TEA) from 2000 to 2002
Change from Total Entrepreneurial Change from % Growth in GDP Previous Year Activity (TEA) Previous Year
Country 1999 2000 2001 1999-2000 2000-2001 2000 2001 2002 2000-2001 2001-2002India 6.71 5.36 4.08 -1.35 -1.28 8.97 11.55 17.88 2.59 6.32*Argentina -3.39 -0.79 -4.41 2.60 -3.62 9.22 11.11 14.15 1.89 3.05*Israel 2.64 7.44 -0.85 4.80 -8.30 7.14 5.67 7.06 -1.47 1.39Brazil 0.81 4.36 1.51 3.55 -2.85 21.44 12.74 13.53 -8.69* 0.78Norway 2.10 2.40 1.40 0.30 -1.00 11.86 8.78 8.69 -3.08* -0.08Korea 10.89 9.33 3.03 -1.57 -6.30 16.34 14.89 14.52 -1.45 -0.37Singapore 6.93 10.26 -2.04 3.32 -12.30 4.22 6.58 5.91 2.36 -0.67United States 4.11 3.75 0.25 -0.36 -3.50 16.58 11.61 10.51 -4.97* -1.10Denmark 2.31 3.02 0.95 0.71 -2.07 7.17 8.01 6.53 0.85 -1.48Belgium 3.03 4.02 1.01 1.00 -3.01 4.80 4.54 2.99 -0.27 -1.54*The Netherlands 1.22 -2.14 4.62 -1.82Canada 5.39 4.53 1.50 -0.86 -3.03 12.22 10.98 8.82 -1.24 -2.16United Kingdom 2.41 3.08 1.93 0.67 -1.15 6.91 7.80 5.37 0.89 -2.43*Sweden 4.51 3.61 1.21 -0.90 -2.40 6.67 6.68 4.00 0.01 -2.68*Germany 2.05 2.86 0.57 0.81 -2.28 7.45 7.99 5.16 0.54 -2.83*South Africa 2.22 -1.14 6.54 -2.90*Ireland 5.85 -5.61 9.14 -3.09*Finland 4.05 5.59 0.74 1.53 -4.85 8.12 7.66 4.56 -0.46 -3.10*Japan 0.80 2.40 -0.29 1.60 -2.69 6.38 5.19 1.81 -1.19 -3.38*Spain 4.20 4.18 2.67 -0.01 -1.51 6.85 8.16 4.59 1.31 -3.58*New Zealand 2.51 -1.33 14.01 -4.06*France 3.19 4.17 1.80 0.98 -2.36 5.62 7.37 3.20 1.76 -4.17*Italy 1.59 2.87 1.78 1.27 -1.09 7.33 10.16 5.90 2.83 -4.26*Russia 5.05 -3.99 2.52 -4.41*Hungary 3.80 -1.44 6.64 -4.79*Poland 1.00 -3.00 4.44 -5.53*Australia 4.76 3.13 2.55 -1.63 -0.58 15.18 15.50 8.68 0.32 -6.83*Mexico -0.28 -6.91 12.40 -8.33*Column Averages 3.46 4.28 1.46 0.82 -3.28 9.52 9.15 7.65 -0.37 -2.29*Statistically significant change, p<0.05

16
The distribution of necessity entrepreneurship depicted in Figure 5 demonstrates even greater variation. For
instance, there are virtually no necessity entrepreneurs in either France or Spain, while up to 7 percent of the labor force
is pursuing necessity entrepreneurship in Chile, China, Brazil and Argentina. In 17 of 37 countries the level is below
Motivations and Types ofEntrepreneurial Behavior
There are two major reasons that individuals participate in entrepreneurial activities: (a) they perceive a business
opportunity (i.e., they elect to start a business as one of several possible career options), or (b) they see
entrepreneurship as their last resort (i.e., they feel compelled to start their own business because all other options for
work are either absent or unsatisfactory). Using this categorization, then, it is possible to label more than 97 percent of
those who are entrepreneurially active as either “opportunity” or “necessity” entrepreneurs. Indeed, according to the
GEM 2002 research, three in five (61 percent) of those involved in entrepreneurial endeavors across the world indicate
that they are attempting to take advantage of a business opportunity, while 2 in 5 (37 percent) state that they are doing
so because they have no other viable option. Still, great variability exists between the 37 countries in terms of the mix
of the two motivations. For example, Figure 4 indicates that only about 1 percent of Japan’s labor force is currently
pursuing opportunity-based endeavors, while in India and Thailand, 12 and 15 percent, respectively, are so engaged.
Figure 4: Opportunity-Based Entrepreneurial Activity by Country
– Upper
verage
– Lower
20.00
18.00
16.00
14.00
12.00
10.00
8.00
6.00
4.00
2.00
0.00
Pers
ons
per 1
00 A
dults
, 18-
64 Y
rs O
ld (9
5% C
onfid
ence
Inte
rval
Japa
nRu
ssia
Belg
ium
Croa
tiaHo
ng K
ong
Fran
cePo
land
Swed
enCh
ines
e Ta
ipei
Italy
Slov
enia
Sout
h Af
rica
Spai
nFi
nlan
dGe
rman
yHu
ngar
yTh
e N
ethe
rland
sUn
ited
King
dom
Sing
apor
eIs
rael
Chin
aBr
azil
Denm
ark
Switz
erla
ndAu
stra
liaAr
gent
ina
Cana
daN
orw
ayIre
land
Mex
ico
Chile
Icel
and
Kore
aUn
ited
Stat
esN
ew Z
eala
ndIn
dia
Thai
land
ALL
Coun
tries

17
1 percent, and in six it is below 0.5 percent. In other words, in the lower ranking nations, less than 1 in 200 persons in
the labor force participates “involuntarily” in entrepreneurship.
An issue of some consequence to this research is the extent to which the types of business associated with
opportunity and necessity entrepreneurship are systematically different from one another. Phrased as a question, it asks,
“Is the potential for a business to provide a major contribution to the economy affected by the entrepreneur’s motivation
for initiating that business in the first place?” Are necessity entrepreneurs, for example, only associated with small
scale, unsophisticated efforts that provide little more than self-employment for the founder-owner? Are opportunity
entrepreneurs, therefore, the sole source of innovative, “high impact” ventures?
In order to address this important subject, the GEM 2002 research team compared the two motivations to each other
along four dimensions widely presumed to contribute to national economic vitality: (1) expectations of job creation,
(2) projections for out-of-country exports, (3) intention to replicate existing business activity or create a new niche, and
(4) participation in one of four business sectors.
As noted in Table 4, about two-thirds of all entrepreneurial efforts reflect the pursuit of a perceived opportunity
while the other third are born of necessity. In the absence of any other information, and starting from the assumption
that motivation does not matter, one would expect these same proportions to apply to other aspects of business
development. For example, it would be expected that two-thirds of nascent and new entrepreneurs would intend to
export their goods or create a new market niche. However, this is not supported by the GEM 2002 research. Rather, it
is clear from this study that the motivation of the entrepreneur does in fact influence the direction and nature of the
existing or proposed business entity.
Figure 5: Necessity-Based Entrepreneurial Activity by Country
10.00
9.00
8.00
7.00
6.00
5.00
4.00
3.00
2.00
1.00
0.00
Pers
ons
per 1
00 A
dults
, 18-
64 Y
rs O
ld (9
5% C
onfid
ence
Inte
rval
)
Fran
ceSp
ain
Belg
ium
Finl
and
Denm
ark
Nor
way
Italy
Japa
nTh
e N
ethe
rland
sRu
ssia
Chin
ese
Taip
eiSw
eden
Unite
d Ki
ngdo
mCr
oatia
Icel
and
Sing
apor
eSw
itzer
land
Cana
daGe
rman
yUn
ited
Stat
esHo
ng K
ong
Pola
ndIre
land
Isra
elSl
oven
iaAu
stra
liaHu
ngar
yN
ew Z
eala
ndSo
uth
Afric
aM
exic
oTh
aila
ndKo
rea
Indi
aCh
ileCh
ina
Arge
ntin
aBr
azil
ALL
Coun
tries
– Upper
– Average
– Lower

18
The entrepreneurially active respondents to the GEM 2002 adult population survey were asked about their
expectations for job creation. If they were in the process of starting a business, they were asked to project how many
jobs they will have created five years after their start-up. If they were the owner/manager of a business less than 42
months old, they were asked to project how many jobs their venture will have created in the next five years. About 1 in
5 (20 percent) reported that they expect to provide no jobs, and about 53 percent of these individuals were necessity
entrepreneurs. On the other hand, more than 1 in 4 entrepreneurially active adults expected to provide more than 20
jobs in five years, and about 70 percent of these persons were motivated by opportunity.
The prevalence and nature of out-of-country exportation varies dramatically by the size of the country. In nations
with large internal markets (e.g., Brazil, China, India and the United States) new ventures can survive quite well without
exports. However, in smaller countries (e.g., Denmark, Iceland and Singapore) entrepreneurial ventures may have
trouble sustaining themselves apart from exports. Nonetheless, this measure provides some indication of a country’s
capacity to increase national wealth through international trade. In this study, only 22 percent of the entrepreneurially
active adults expected to export goods or services. At the other end of the spectrum, only 6 percent anticipated that
Table 4: Opportunity- and Necessity-Based Entrepreneurial Activity and Business Expectations
All Opportunity Necessity Other Row TotalsNumber of Cases* 9,129 5,541 3,356 232
61% 36% 3% 100%
No jobs in 5 yrs. 20% 44% 53% 3% 100%1-5 jobs in 5 yrs. 39% 59% 39% 2% 100%6-19 jobs in 5 yrs. 12% 77% 21% 2% 100%20+ jobs in 5 yrs. 28% 68% 29% 3% 100%
100%
No export sales 78% 60% 37% 3% 100%1-25% export sales 16% 74% 23% 3% 100%26-50% exports 2% 73% 24% 3% 100%51-100% exports 4% 88% 10% 2% 100%
100%
No market niche creation 73% 60% 37% 3% 100%Little market niche creation 20% 63% 34% 3% 100%Some market niche creation 6% 71% 25% 4% 100%Maximum market niche creation 1% 80% 15% 5% 100%
100%
Agriculture, forestry, fishing 4% 4% 6% 2%Mining, construction 3% 4% 2% 2%Manufacturing 11% 11% 10% 28%Transportation, communication, utilities 4% 4% 3% 2%Wholesale, motor vehicle sales and service 10% 12% 8% 6%Retail, hotel, restaurants 50% 45% 58% 41%Financial, insurance, and real estate 2% 3% 1% 1%Business services 8% 9% 4% 7%Health, education, and social services 4% 4% 4% 5%Consumer service 4% 4% 4% 6%
100% 100% 100% 100%* Weighted to represent global population of those who are entrepreneurially active. “Other” motivations are less than 3% of the sample included in the “All” column.
All differences between opportunity- and necessity-based entrepreneurial activity and business processes statistically significant at 0.0000 or better.

19
their export sales would reach a level greater than 26 percent of total sales (or turnover). The vast majority of export-
oriented entrepreneurs were opportunity-driven. Still, between 10 and 20 percent of those expecting to export more
than 25 percent of their goods were necessity entrepreneurs.
In an attempt to determine the extent to which the creation of new firms leads to the development of entirely new
markets or services, all those involved in start-ups, new firms or existing businesses were asked three questions: (a)
“Will customers be familiar with the product or service to be provided?” (b) “What is the extent of competition in this
market?” and (c) “Was the critical technology available 12 months before the interview?”9 If the individual claimed that
the customers were uninformed about the product, that there were no existing competitors, and that the critical
technology was less than one year old, their business was considered a “new market venture,” referring to its potential
for creating a new niche or expanding the market. However, 70 percent of the entrepreneurial respondents stated that
their customers would be very familiar with their product or service, that there was already considerable competition,
and that the critical technology had been available for more than a year. In fact, only about 1 percent provided strong
evidence that a new market niche or economic sector would be created if the business were successful, while 7 percent
provided some indication of market expansion. It can be concluded, from this, that the vast majority of new businesses
are basically replications of existing business activity — in a new form, at a new location, using new procedures or
with a new price structure, but decidedly not producing radical departures from the status quo. Also, while the creation
of new market niches is uncommon, most (80 percent or more) appear to be provided by those pursuing opportunities.
Or phrased differently, 9 percent of opportunity entrepreneurs expect to create either a modestly or radically new
market, compared to 5 percent of necessity entrepreneurs.
All business activity was coded centrally using the four-digit International Standard Industry Coding procedure
supported by the United Nations (about 250 categories).10 These have been reduced to 10 categories, as presented at
the bottom of Table 4. The distribution of type of business activity is similar for opportunity and necessity
entrepreneurship and all firms. There are only a few obvious shifts in emphasis: (a) more “wholesale, motor vehicle
sales and service,” and “business services” among opportunity start-ups, and (b) more “agricultural, forestry and
fishing,” and “retail, hotels and restaurants” among necessity start-ups. The biggest sector differences are found among
the 3 percent in the “other” (or mixed motivation) category, with a larger emphasis on manufacturing. All types of
business activity are pursued by both opportunity and necessity entrepreneurs.
In conclusion, it seems clear that a substantial number of high-growth, export-oriented, new-market-creation
businesses are implemented by both opportunity and necessity entrepreneurs, although those pursuing opportunity are
more frequently expecting to provide somewhat greater job growth, exports and more of the rare new market niches.
However, the aggregate impact may be considerable. If just 5 percent of India and China’s necessity entrepreneurs
anticipate providing a new market niche (broadly defined) this will translate into a combined total of 3 million “new
market ventures.”
20
Science, Technology and High PotentialEntrepreneurship 11
High potential, innovative ventures are relatively rare and difficult to distinguish from their less ambitious kin. This
makes them extremely difficult to identify for the purpose of examination. As a result, the GEM 2002 researchers added
several new questions to the GEM protocol in order to isolate those ventures widely believed to have the greatest
possibility for having a substantial impact on the economy. As reviewed above, three new items were utilized to locate
those ventures with potential to create new markets — absence of competition, low product awareness among
customers and use of new technology. Two additional criteria were added to further distinguish those new ventures
with the potential to make a major contribution to the national economy: (1) the expectation of 20 or more jobs created
within five years and (2) the intention to export goods or services. Of the 9,615 start-ups and new firms identified in the
37 countries, only 926 met all of these criteria.
The prevalence of high potential ventures varies from 0 to 4 percent of the labor force across the 37 GEM 2002
countries. Preliminary regression analyses suggest that a model including the quality of the intellectual property
protection regime, population-level skills and background for starting a new business, and the prevalence rate of
informal investors may explain up to 45 percent of the variance in the existence of these critical, but elusive businesses.
These 926 “high potential new ventures” are likely to be based on new technology, as the individuals all indicated
that they were (or would be) utilizing technology that was not available more than a year ago. Compared to those
involved in all other new ventures, they are also more likely to be men (71 percent versus 59 percent), 63 percent are
younger than 35 years old, and 85 percent (versus 59 percent) pursue opportunities. In addition, 50 percent of those
associated with high potential new ventures had college or graduate experience (compared to 23 percent of all other
new ventures), two-thirds came from the upper third of their countries’ household income distribution (compared to one-
third), and 5 percent did not have full or part time work (compared to 13 percent). High potential ventures were
concentrated in manufacturing, wholesale and business service sectors. All these differences are statistically significant.
The GEM index for high potential ventures has a relatively low correlation with the overall TEA index (0.34). It also
has a modest correlation with the TEA opportunity prevalence rate (0.40) and a comparable relationship with the
prevalence rate for “new market ventures.” On the other hand, the correlation with the necessity entrepreneurship is
essentially zero. This would suggest that high potential new ventures result from processes that may have a low
interrelationship with the normal mechanisms involved in start-up attempts represented in the TEA index.
Several efforts have attempted to track national potential for firm growth, particularly in technology-intensive
sectors. These include the World Competitiveness Yearbook12 index for overall national competitiveness, government
efficiency and business efficiency; and the Global Competitiveness Report13 indices for national competitiveness,
national technological capacity, efficiency of public institutions, and information and communication technology. While
the prevalence rate of high potential ventures has a moderate, positive and statistically significant relationship with all
seven of the above measures, opportunity entrepreneurship does not appear to be related to any of them. However,
both the overall TEA and necessity indices have a negative and statistically significant relationship with these measures

21
of national competitiveness. This suggests that the GEM index for high potential ventures reflects many features that
are also captured by these other general indices for national competitiveness.
Several aspects of the national science and technology base were also compared to the GEM 2002 indices of
entrepreneurial activity. As shown in Table 5, the strongest positive correlations were found with the enrollment rate in
higher education, the number of computers per capita, computing capacity in relation to GDP and the proportion of
Internet users per capita. These positive relationships suggest that the GEM index for high potential ventures is
capturing a unique and more sophisticated set of new firm activities than those that are being represented by the
overall TEA measure.
Table 5: Correlations Between High Potential Entrepreneurial Activity and NationalEntrepreneurial Framework Condition Indices
CorrelationEducation System IndicatorsEnrollment in primary education 1997 (per capita) -0.21Enrollment in secondary education 1997 (per capita) 0.17Enrollment in tertiary education 1997 (per capita) 0.38*
Internet and Information Communication Technology IndicatorsComputers per capita 2001 0.36*MIPS per GDP 1998 0.39*Internet users per capita 2000 0.40*Mobile phones per capita 2001 0.15
National Wealth IndicatorsGDP (ppp) per person employed 2000 0.15
Indicators from GEM 2002 National Expert InterviewsFinance: Availability of debt funding -0.05Finance: Availability of equity funding 0.04Government policy emphasis on entrepreneurship 0.14Government regulations favor entrepreneurship 0.31†
Government support program index 0.18Primary and secondary education support for entrepreneurship 0.32†
Post-secondary education support for entrepreneurship 0.04R&D and technology transfer index 0.20Commercial services index 0.19Market dynamics and change -0.06Market openness for entrepreneurial firms 0.50**Physical infrastructure index 0.24National culture: Entrepreneurial orientation 0.25Entrepreneurial opportunity next 12 months 0.16Population entrepreneurial capacity index 0.35*Population entrepreneurial motivation index 0.07IPR protection index 0.41*Support for women entrepreneurship 0.33†
Indicators from GEM 2002 Adult Population SurveyGEM business angel prevalence index 2002 0.56**Respondent’s job involves start-up activity 0.39*Respondent personally knows an entrepreneur 0.50**Respondent thinks possesses skills for start-up 0.36*Respondent thinks there will be good opportunities for new start-up in next 6 months 0.26
Sources of data for top sections: GEM 2002; World Competitiveness Yearbook 2001 and 2002; Global Competitiveness Report 2001; OECD ; U.S. Patent Office.Sources of data for bottom sections: GEM 2002 National Expert Interviews, GEM 2002 Adult Population Survey.
Bivariate correlation coefficients, two-tailed tests. *** = p <0.001; ** = p < 0.01; * = p < 0.05; † = p < 0.1.

22
The GEM index for high potential new ventures was also compared to the GEM 2002 national expert data and GEM
2002 adult population survey data. Table 5 shows that the index for high potential ventures has a statistically significant
association with several of the national entrepreneurial framework conditions including: (1) market openness (i.e., an
entrepreneurial firm’s access to markets and the quality of anti-trust legislation), (2) primary and secondary education’s
support for entrepreneurial attitudes, (3) population-level capacity and skills for entrepreneurial ventures, (4) quality of
intellectual property protection regime, (5) quality of national support programs for entrepreneurial companies, and
(6) support for female entrepreneurship. These statistically significant positive correlations stand in stark contrast with
the lack of association with the overall TEA, as well as the opportunity and necessity entrepreneurship subsets. Again,
this suggests that high potential ventures represent a distinct facet of entrepreneurial activity.

23
Association of Entrepreneurial Activityand Economic Growth
One of the central objectives for the GEM research program is to determine whether or not entrepreneurial activity
is associated with economic development. However, the factors that affect national economic growth are quite complex
and multifaceted, and precise assessments require large samples with multiple years of data. Unfortunately, the GEM
measure of entrepreneurial activity, the TEA index, is currently available for only 20 countries from the year 2000, 29
countries from 2001 and 37 countries from 2002. For this analysis then, data from the three years had to be “pooled”
(i.e., with 37 GEM 2002 countries appearing once, 10 GEM 2001 countries appearing twice, and 20 GEM 2000 countries
appearing three times) to form a sample large enough to allow the examination of the differences that result from
various time lags. Correlations were then calculated for the two years prior to, and the three years following a focal
year, as well as for the focal year itself.
Table 6: Correlations between Entrepreneurial Activity and National Economic Growth with Time Lags
Time-2 Time-1 Time0 Time+1 Time+2 Time+3TEA 2000 97/98 98/99 99/00 00/01 01/02 02/03TEA 2001 98/99 99/00 00/01 01/02 02/03TEA 2002 99/00 00/01 01/02 02/03
TEA All -0.03 0.20 0.19 0.22* 0.42** 0.32TEA All (without high traders)*** -0.01 0.23* 0.25* 0.23* 0.47** 0.42
TEA Opportunity 0.06 0.16 0.20 0.22 0.26TEA Opportunity (without high traders)*** 0.13 0.16 0.21 0.24* 0.29
TEA Necessity 0.02 0.15 0.23 0.35** 0.49**TEA Necessity (without high traders)*** 0.07 0.16 0.23 0.37** 0.52**
* Statistically significant, <0.05; ** <0.01, ***without Hong Kong and Singapore.
It appears that entrepreneurial activity this year is only slightly the result of last year’s economy but highly likely to
indicate economic growth one and two years hence. As indicated in Table 6, the correlation between the overall TEA
index and economic growth14 is essentially zero two years before the year of focus (time-2). It is low but nearing
statistical significance for the prior year (time-1) and the concurrent year (time0). However, it is statistically significant
and moderately positive for the following year (time+1), and more strongly present for the second following year (time+2).
The correlation is a positive but not statistically significant in the third following year (time+3), most likely due to the fact
that there were only 10 cases in this assessment.
Yet national economic growth can come from several sources: (a) internal enhancements to the economic structure
(i.e., business formation), or (b) successful participation in the global economy (i.e., exporting). While high levels of
entrepreneurship would be expected to contribute to economic growth, some countries have followed an alternative
strategy of serving as a major trading platform in the world economy. For example, both Hong Kong and Singapore have
a total import and export trade that is several times their GDP. National growth in such countries is more likely to reflect
international trading conditions than internal entrepreneurship. Indeed, if these two countries are removed from the
analysis, the correlations between total entrepreneurial activity and growth in GDP universally increase. This suggests
that there may in fact be several paths to successfully promoting national growth.15

24
The correlation with a two-year lag, which combines data from GEM 2000 and 2001 TEA measures, is presented
graphically in Figure 6. All data points are shown, as well as the best-fit correlation line without the high export trading
countries (i.e., Hong Kong and Singapore). This presentation makes it clear that the correlation is reduced by countries
with high levels of national growth and low levels of entrepreneurship (such as Belgium, Israel and Singapore), and that
there are no countries with high levels of entrepreneurial activity and low levels of national economic growth. If such
countries existed, they would be found in the upper left corner of Figure 6.
Figure 6: Total Entrepreneurial Activity (TEA) and Subsequent Growth in GDP(Two Year Time Lag, Data pooled from GEM 2000 and GEM 2001; excludes Hong Kong and Singapore)
TEA
at T
ime 0
25.00
20.00
15.00
10.00
5.00
0.00
-2.0
0
-1.0
0
0.00
1.00
2.00
3.00
4.00
5.00
6.00
7.00
Percent Growth in GDP at Time+2
r = 0.47
This analysis does not suggest that entrepreneurial activity is by itself a source of economic growth. It does,
however, indicate that changes in the economic structure and market processes within a country leading to economic
growth may occur more quickly when an active entrepreneurial sector is available to implement such changes.
Resolving the complex interrelations between basic enhancements to factor conditions, entrepreneurial activity and
national economic growth will require an analysis of more countries over a longer period of time.

25
National Context and Entrepreneurial Activity
The history, institutional structure and cultural/social systems of the 37 countries in GEM 2002 are quite diverse
and may have an impact on the patterns of entrepreneurial activity observed in this year’s study. In order to “flesh out”
such differences, GEM national teams in 34 of the GEM 200216 countries collected two types of data from national
experts:17 (a) narrative answers to semi-structured face-to-face interviews,18 and (b) quantitative responses to a 10-page
questionnaire.19 Drawing from the conceptual model presented in Appendix A, national experts were chosen by GEM
national teams to represent the following nine entrepreneurial framework conditions: (1) presence of financial support,
(2) government policies, (3) government programs, (4) education and training, (5) research and development transfer,
(6) commercial and professional infrastructure, (7) internal market openness, (8) access to physical infrastructure, and
(9) cultural and social norms related to entrepreneurship.
During the course of the face-to-face interviews, each national expert was asked to articulate the strengths and
weaknesses of the entrepreneurship support structure in his or her particular country. Their opinions provide an
interesting general impression of the relative importance of each of the nine framework conditions. For example, across
the 1,000 experts contacted for GEM 2002, cultural and social norms were clearly given emphasis as the leading
strength — about 25 percent of all comments were related to this topic — or the second most important weakness.
Two other areas were also strongly considered to be either a major strength or significant weakness: government
policies, and education and training. With few exceptions (e.g., Singapore considered financial support to be its top
strength), these three domains were consistently considered to be the leading national issues around the support of
entrepreneurship.
Correlations between the nine framework conditions (as measured in the expert questionnaire) and the overall TEA
index, as well as opportunity- and necessity-based entrepreneurial activity, are provided in Table 7.
The results are quite striking. Most of the correlations associated with overall TEA or opportunity-based
entrepreneurial activity are not statistically significant. There is, however, a significant positive relationship between
these items and the capacity of the people in the country to implement and manage new firms. There is also a positive
correlation between opportunity-based entrepreneurial activity and the perceived presence of business opportunities. On
the other hand, strong protection for intellectual property is negatively associated with all three measures of
entrepreneurial activity. This may be a reflection of the fact that the level of entrepreneurial activity is highest in
developing countries where protection for intellectual property is yet emerging.
It is the relationships to necessity-based entrepreneurial activity that are the most dramatic feature of this portion
of the analysis. All seven statistically significant correlations are negative in direction. Specifically, in those countries
where the experts consider the presence of financial support, government policies and programs, mechanisms for
transferring research and development to new firms, the presence of commercial and professional infrastructures and
the protection of intellectual property rights to be disadvantageous for new and growth firms, there are higher levels of
necessity entrepreneurship.

26
The consistently negative relationship between the quality of the infrastructure and the level of necessity
entrepreneurship, as well as the lack of relationship between framework conditions and opportunity entrepreneurship,
may be a reflection of three phenomena. First, necessity entrepreneurship is most prevalent in developing countries such
as Thailand, India, Korea, Brazil, China and Mexico, where financial support, education and training and physical
infrastructure are clearly absent. Second, entrepreneurship-enhancing programs and policies implemented by a large
number of developed countries, principally in the European Union, have only resulted in modest levels of activity so far.
Third, the well-educated, highly experienced experts contacted by the GEM national teams may only be focusing on the
entrepreneurial sector and issues they confront on a daily basis. That is, they may not be familiar with the conditions
supporting (or needed to support) necessity entrepreneurship. Therefore, through no fault of their own, the experts may
share — with their colleagues around the world — a lack of contact with and information about necessity-based
entrepreneurial activity.
Overall, the opinions of the national experts add considerable information to our understanding of the relationship
between national context and entrepreneurial activity. First, their responses make it clear that there is substantial
uniformity across the GEM countries with regard to the concepts, language and judgments utilized by national experts.
Second, they highlight the fact that this uniformity is especially prominent among the more developed nations, which
may have evolved very similar infrastructures in support of entrepreneurial activity. Finally, their views raise the issue
that necessity entrepreneurship (i.e., the initiation of new firms by those who are unable to participate in the economy
as employees) may not be affected by the entrepreneurial framework conditions in the same manner as opportunity
entrepreneurship (i.e., the initiation of new firms by those who have choices regarding their participation in the
economy). Therefore, the current programs designed to facilitate entrepreneurship may reflect a bias toward
Table 7: Correlations Between Entrepreneurial Activity and National Entrepreneurial Framework Condition Indices
TEA Overall TEA Opportunity TEA NecessityDimension LabelFinance: Availability of debt funding -0.31* -0.07 -0.52**Finance: Availability of equity funding -0.15 0.11 -0.46**Government policy emphasis on entrepreneurship -0.17 0.03 -0.40**Government regulations favor entrepreneurship -0.06 0.08 -0.23†
Government support program index -0.25 -0.02 -0.45**Primary and secondary education support for entrepreneurship 0.06 0.20 -0.15Post-secondary education support for entrepreneurship 0.01 0.07 -0.08R&D and technology transfer index -0.20 -0.05 -0.33*Commercial services index -0.01 0.16 -0.24†
Market dynamics and change 0.10 0.00 0.19Market openness for entrepreneurial firms -0.01 0.12 -0.18Physical infrastructure index -0.10 0.02 -0.20National culture: Entrepreneurial orientation 0.19 0.26† 0.00Entrepreneurial opportunity next 12 months -0.40** -0.20 -0.54**Population entrepreneurial capacity index 0.10 0.27† -0.18Population entrepreneurial motivation index 0.25# 0.31* 0.03IPR protection index 0.20 0.18 0.16Support for women entrepreneurship 0.07 0.20 -0.09
One-tailed statistical significance: † <0.10; *<0.05;**<0.01.

27
opportunity-motivated rather than necessity-motivated entrepreneurs. This would suggest that government and non-
government institutions may need to develop a different set of processes and policies for the support of necessity
entrepreneurship.

28
SPECIAL TOPICS
GEM research provides rich insights into the patterns of entrepreneurial activity around the world. Indeed, as this
program has broadened and the knowledge base accumulated, it has become obvious that a single annual report is no
longer an adequate vehicle for expressing its many findings. Consequently, special units within the GEM research team
have been commissioned to develop reports around several topics of particular interest to the domain of
entrepreneurship. The following three sections provide glimpses into GEM findings around three of these special areas:
women and entrepreneurship, entrepreneurial finance and family-sponsored entrepreneurship. A more complete
analysis of these topics, as well as a discussion of policy implications suggested by these results, will be forthcoming in
the spring of 2003.
Women and Entrepreneurship20
Both gender and age play a major role in predicting participation in entrepreneurial activity. Their joint impact is
illustrated in Figure 7 for the entire GEM sample. While this is weighted to represent the labor force population of
Figure 7: Entrepreneurial Activity by Gender and Age
Number Numberper 100 Women Men per 100
TEA All18-24 yrs. 7.7 13.225-34 yrs. 12.8 19.735-44 yrs. 10.2 14.645-54 yrs. 6.2 11.255-64 yrs. 5.0 6.8
TEA Opportunity18-24 yrs. 5.6 10.825-34 yrs. 7.6 13.335-44 yrs. 5.2 9.845-54 yrs. 3.2 7.155-64 yrs. 2.5 3.7
TEA Necessity18-24 yrs. 1.9 1.825-34 yrs. 5.0 6.035-44 yrs. 4.8 4.345-54 yrs. 3.0 4.155-64 yrs. 2.4 2.8
Nascent Firms18-24 yrs. 4.1 8.125-34 yrs. 7.3 10.635-44 yrs. 6.0 7.945-54 yrs. 3.7 6.255-64 yrs. 3.0 3.8
New Firms18-24 yrs. 3.7 6.125-34 yrs. 6.1 10.335-44 yrs. 4.7 7.045-54 yrs. 2.8 5.355-64 yrs. 2.2 3.3
14 12 10 8 6 4 2 0 2 4 6 8 10 12 14 16 18 20

29
2.4 billion, the patterns within world regions and specific countries were quite similar.21 The exhibit presents the
prevalence rate for the overall TEA index, opportunity- and necessity-based entrepreneurship, as well those pursuing
nascent firms and those who are owner/managers of new firms. With women represented on the left and men to the
right, the prevalence rates for five age groups are presented for each type of entrepreneurial activity. All differences in
Figure 7 are highly statistically significant — that is, these patterns occur with predictable regularity.
Overall, men are about 50 percent more likely to be involved in entrepreneurial activity than women (13.9 percent
to 8.9 percent). This ratio is even greater for opportunity-based entrepreneurship (9.3 percent to 4.9 percent), but
becomes more equal with necessity entrepreneurship (4.2 percent for men and 3.8 percent for women). For both men
and women involved in all types of entrepreneurial activity, the prevalence rates peak at 25 to 34 years of age. The next
most active age groups are those who are 18 to 24 and 35 to 44 years of age. Participation is generally lowest for those
55 and older. Although not shown, entrepreneurial activity is almost non-existent among those 65 years of age and older.
As illustrated in Figure 8, there is no country where women are more active than men, but there are a number
where the difference is not statistically significant. This occurs most often in countries where the prevalence rates are
quite low and the dearth of activity leads to small sample sizes and large standard errors. While, in general, men are
about twice as likely to be involved as women, there is substantial variation from country to country. The participation is
almost equal in a number of developing countries (e.g., Thailand, China, South Africa and Mexico) but the ratio exceeds
3 to 1 in some European and developed Asian countries (e.g., Croatia, Singapore, Israel and Japan).
Figure 8: Entrepreneurial Activity by Gender and Country
– Men
– Women
Thai
land
Chin
a
Sout
h Af
rica
Mex
ico
Braz
il
Arge
ntin
a
Indi
a
Chin
ese
Taip
ei
The
Net
herla
nds
Unite
d St
ates
Finl
and
New
Zea
land
Pola
nd
Icel
and
Italy
Cana
da
Switz
erla
nd
Hong
Kon
g
Hung
ary
Germ
any
Fran
ce
Swed
en
Aust
ralia
Denm
ark
Russ
ia
Slov
enia
Unite
d Ki
ngdo
m
Irela
nd
Chile
Kore
a
Spai
n
Nor
way
Belg
ium
Croa
tia
Sing
apor
e
Isra
el
Japa
n
ALL
Coun
tries
Pers
ons
per 1
00 A
dults
, 18-
64 Y
rs O
ld (9
5% C
onfid
ence
Inte
rval
) 25.00
20.00
15.00
10.00
5.00
0.00
Men/Women5.00
2.19
2.93
2.05
2.00
3.00
2.08
1.58
1.83
1.60
1.58
2.21
2.54
2.03
2.24
1.90
3.44
2.10
1.26
2.02
3.55
1.96
2.09
2.
681.
952.
251.
591.
871.
241.
421.
441.
641.
462.
362.
311.
521.
04
1.80

30
There is a substantial range of participation by women in entrepreneurship across the 37 GEM 2002 countries.
Figure 8 indicates that female entrepreneurship varies from 0.6 percent (6 per 1,000) in Japan to 18.5 percent (185 per
1,000) in Thailand. It is worth considering at least three general questions associated with the participation of women.
First, are the factors that affect the level of female participation in entrepreneurship different than those that affect
males? Second, are the factors that affect the mix of opportunity versus necessity entrepreneurship different for
women? Third, do the factors and processes that specifically affect the entrepreneurial activity of females vary among
countries according to their stage of development? A preliminary assessment of these three issues is presented in
Table 8.
Table 8: Correlations Between Entrepreneurial Activity and Selected Factors Believedto Affect Women’s Participation in Entrepreneurship
Women TEA Women TEA Women TEA Men TEA Men TEA Men TEAOverall Opportunity Necessity Overall Opportunity Necessity
High Per Capita Income Countries (More than $18,000/yr)Population growth: 1996-2002 0.06 0.09 0.21 0.25 0.22 0.46*
Unofficial economy as % of GDP -0.19 -0.38 0.16 -0.14 -0.22 -0.30Social security as % of GDP -0.46* -0.49* -0.32 -0.50* -0.50* -0.54*
Female/male labor force participation ratio: 0.12 0.22 -0.42* 0.04 0.11 -0.29% Women in public agency management 0.37 0.43* 0.04 0.15 0.24 -0.10% Women in private management 0.52** 0.31 0.51** 0.39 0.32 -0.24
% Women work in agriculture -0.09 -0.23 -0.14 -0.14 -0.20 -0.28% Women work in industry -0.42* -0.50* 0.12 -0.27 -0.40 -0.14% Women work in services 0.42* 0.52* -0.02 0.32 0.37 0.28
Female current unemployment -0.11 -0.24 -0.01 -0.24 -0.31 -0.42*Female long term unemployment -0.3 -0.47* 0.07 -0.34 -0.44* -0.38
Female illiteracy rate n/a n/a n/a n/a n/a n/a
Low Per Capita Income Countries (Less than $18,000/yr)Population growth: 1996-2002 0.63** 0.50** 0.49** 0.77*** 0.76*** 0.49*
Unofficial economy as % of GDP 0.18 0.17 0.11 0.17 0.11 0.18Social security as % of GDP -0.42* -0.42* -0.19 -0.47* -0.56* -0.14
Female/male labor force participation ratio: -0.34 -0.05 -0.54* -0.47* -0.32 -0.55*% Women in public agency management -0.2 -0.23 -0.07 -0.13 -0.15 -0.02% Women in private management -0.36 -0.22 -0.42 -0.58* -0.46 -0.56*
% Women work in agriculture 0.52* 0.68* 0.04 0.15 0.25 -0.06% Women work in industry -0.47* -0.29 -0.56* -0.55* -0.46 -0.52*% Women work in services -0.28 -0.49* 0.2 0.09 -0.03 0.27
Female current unemployment -0.58* -0.51* -0.35 -0.56* -0.57* -0.31Female long term unemployment -0.64* -0.55 -0.72* -0.58 -0.55 -0.48
Female illiteracy rate 0.49* 0.34 0.49* 0.45* 0.51* 0.24Stat sign: * <0.05, ** <0.01, ***<0.001.

31
Correlations between several national characteristics believed to impact the status of women, and overall,
opportunity and necessity entrepreneurship are presented in Table 8 in such a way as to facilitate two comparisons:
(1) women with men, and (2) high per capita income countries with low per capita income countries.22 Reviewing this
table, it is immediately apparent that there is a substantial difference between the two types of country. Clearly, there
are more statistically significant correlations in the nations with low per capita income and the patterns of correlations
differ between the two:
■ Population growth is associated with more female entrepreneurship only in developing countries.
■ Unregistered (i.e., “black market”) economic activity is associated with less entrepreneurship in high per capita
income countries and more entrepreneurship in low income per capita countries.
■ Greater economic security is associated with less entrepreneurship in all countries for both men and women.
■ Higher female-to-male participation in the labor force is associated with reduced participation in
entrepreneurship, particularly in developing countries.
■ More female participation in public or private administrative roles is associated with more entrepreneurship in
high income countries, but less in low income countries.
■ A higher proportion of women working in industry (manufacturing, wholesale and construction) is associated
with less entrepreneurship. More women working in agriculture is positively correlated with more
entrepreneurship in low income countries. Greater numbers of women working in services is related to higher
levels of entrepreneurial activity in high income countries.
■ Female unemployment, short and long term, is associated with less entrepreneurship in low income countries.
■ Illiteracy in low income countries seems to be associated with higher levels of entrepreneurial activity.
There are a number of instances where the correlations are different for opportunity-motivated females than they
are for those motivated by necessity, including: (a) in the face of higher female/male labor force participation ratios,
(b) in sectors in which women are employed, and (c) with high female illiteracy rates. This suggests that dissimilar
processes lead to opportunity and necessity entrepreneurship among women — a finding that holds for men as well.
In addition to the clear differences in many factors associated with the level of national per capita income, there
are a number of differences associated with gender. In particular, there are differential impacts between males and
females related to: (a) population growth, (b) women in management and administrative positions, and (c) the types of
sectors where women are working. However, the impact on men and women is largely uniform with regard to:
(a) female/male labor force participation rate, (b) presence of unofficial economic activities, (c) social security payments,
(d) unemployment, and (e) female illiteracy.
In sum, women make up a substantial proportion of those pursuing entrepreneurship. However, the process of
involvement appears to differ significantly in comparison to the processes that affect men. Particularly in countries
where there is a shortage of entrepreneurs, the overall participation of women should be especially encouraged. This

32
research demonstrates that any national effort to be more inclusive may be greatly facilitated by a more complete
understanding of the unique experience of entrepreneurial females. As noted above, continuing analysis of the GEM
2002 findings and further investigation into the female side of the entrepreneurship phenomenon is currently slated for
release in the spring of 2003.
Entrepreneurial Finance
Most new firms receive their initial financial support from informal investments made by family, friends, business
associates and other personal contacts. An extremely small proportion of the most promising firms (perhaps 1 in 10,000)
receive funding from venture capital firms — a specialized form of formal investment. The GEM research provides
national assessments of the magnitude of both forms of financial support.
Informal flows were estimated by asking all those in the adult population surveys if they had made a personal
investment in a new firm (not their own) in the past three years. If so, they were asked about the total magnitude of
their support, the nature of the businesses they sponsored and their relationship with the recipient. This information
was then used to estimate the total annual support provided to new firms in most countries. Data on venture capital
support for all European countries, except Croatia, were obtained from the European Venture Capital Association. In
other countries these were obtained from national sources, generally a national venture capital association and often
with help from the GEM national teams. Unlike the estimates based on the adult population samples, the data on
venture capital investments are a complete survey of all “deals” made in the previous year. The informal investments
are for the previous three years (1999 to 2002) and the venture capital data for the prior year (2001) for this, the 2002
assessment. Both estimates reflect the same time period.
Venture Capital Flows in 2001
The amount of venture capital invested as a percent of GDP for each GEM nation where venture capital statistics
are available is shown in Figure 9. For all the GEM nations combined, the amount of venture capital fell from 0.5
percent of GDP in 2000 to 0.2 percent of GDP in 2001. The biggest year-to-year declines were in the United Kingdom
and South Africa (-66 percent each), France (-61 percent) and the United States (-60 percent). Only four nations enjoyed
year-to-year increases: Korea (133 percent), Denmark (114 percent), Sweden (101 percent) and Spain (9 percent).
Granted, the amounts of venture capital invested in most nations fell from their peaks in 2000, but 2001 was still a very
good year by historical measures. For most nations, the amount invested in 2001 was either greater than or comparable
with the amount invested in 1999. Only in Belgium, the United Kingdom and the United States was the amount
significantly lower in 2001 than in 1999.
For the GEM nations where there was data for both the year 2000 and 2001, the number of companies receiving
venture capital declined from 19,569 to 18,247 — a drop of 1,300. The biggest decline in total number of companies
was in the United States, but in terms of percent, the largest drops were in Portugal (-60 percent), Australia
(-51 percent), France (-47 percent), Poland (-43 percent) and Germany (-37 percent). The biggest increases were in Korea
(169 percent), South Africa (47 percent), Denmark (24 percent) and Finland (17 percent).

33
For the GEM nations where there was comparable data for both 2000 and 2001, the total amount of venture capital
declined by 53 percent, although the actual number of companies that received a venture capital investment fell by only
7 percent. The explanation for this is that the average amount invested per company declined noticeably from
US$6,389,000 in 2000 to US$3,144,000 in 2001. The steepest percentage drops were in the United Kingdom, the United
States and Canada, and the biggest percentage gains were in Sweden and Korea. The surprise was Hong Kong where
the average amount was US$7,067,000. The average amount invested per company in the United States was
US$10.7 million versus US$1.2 million for companies in the other GEM countries. True, the amount invested per
company in the United States declined from US$19.2 million in 2000, but, with the exception of Hong Kong, it still
towers over the amount invested in other nations.
Informal Investments
In 2001, informal investments in all 37 GEM nations totaled US$298 billion compared with US$59 billion of venture
capital. Not only is the amount of informal capital impressive, so too is its extent. The total amount of informal
investment in the GEM nations in 2001 was almost 1 percent of their combined GDPs, while the prevalence of informal
investors among those 37 nations was 2.9 percent of the population 18 years of age and older.
Prevalence rates in 2002 ranged from 7.4 percent in Iceland to 1 percent in Japan. The overall prevalence rate fell
from 3.4 percent in 2000 to 2.9 percent in 2001. For the nations where prevalence rates are available for 2000 and 2001,
the year-to-year rate decreased in 16, increased in 7, and held steady in 2.
Figure 9: Domestic Classic Venture Capital Investment as a Percent of GDP (1999-2001)
Chin
a
Croa
tia
Slov
enia
Pola
nd
Switz
erla
nd
Japa
n
New
Zea
land
Portu
gal
Hung
ary
Belg
ium
Sout
h Af
rica
Italy
Fran
ce
Germ
any
Unite
d Ki
ngdo
m
Irela
nd
Aust
ralia
Nor
way
Finl
and
Spai
n
Icel
and
Denm
ark
The
Net
herla
nds
Chile
Hong
Kon
g
Swed
en
Sing
apor
e
Unite
d St
ates
Cana
da
Isra
el
Kore
a
– 1999
– 2000
– 2001
Dom
estic
Cla
ssic
Ven
ture
Cap
ital I
nves
tmen
ts a
s a
Perc
ent o
f GDP
0. 0
0. 2
0. 4
0. 6
0. 8
1. 0
1. 2
1. 4

34
The significance of informal investments relative to venture capital is clearly shown in Figure 10. In this
presentation, the total amount of capital investment (i.e., classic venture capital plus informal financial support) is
shown for 2001 as a percent of GDP. Venture capital exceeded informal investment in only one of the GEM nations,
Israel. In all other nations it ranges from 0.3 percent (China) to 39 percent (Canada).
Informal investment is a crucial component of the entrepreneurial process. For instance, according to an analysis of
the Inc. 500, “America’s fastest growing private companies” in 2000, 16 percent started with less than $1,000, 42
percent with $10,000 or less, and 58 percent with $20,000 or less (Inc., 2000) whereas fewer than 5 percent started
with venture capital. Hence, small investments primarily by family and friends are crucial in funding not only micro-
companies but also future superstars. In comparison, formal venture capital is very rare at the seed stage of a new
venture. For example, more than 10 million in the United States are nascent entrepreneurs attempting to start new
ventures. In a typical year, however, less than 1,000 of them have formal venture capital in hand when they launch their
businesses.
Family-Sponsored Entrepreneurship23
A large proportion of all businesses are owned and managed by families or groups of relatives. This may be
particularly true of new and growing businesses. Therefore, it would seem that any global effort to understand
entrepreneurial processes would be enhanced if it also considered the impact of family sponsorship. This would properly
begin with procedures that could identify family-owned businesses among the start-ups, new firms and established
Figure 10: Domestic Capital Investment as a Percent of GDP
Finl
and
Belg
ium
Hung
ary
Nor
way
Irela
nd
Unite
d Ki
ngdo
m
Denm
ark
Aust
ralia
Swed
en
Isra
el
Cana
da
Hong
Kon
g
Germ
any
Switz
erla
nd
The
Net
herla
nds
Sout
h Af
rica
Unite
d St
ates
Icel
and
Spai
n
Sing
apor
e
New
Zea
land
Chile
Chin
a
Kore
a
– Informal Investment
– Classic Venture Capital
Perc
ent o
f GDP
0
1
2
3
4
5
6
7
8
(Informal Investment Plus Classic Venture Capital)

35
firms located in the GEM adult population surveys. Indeed, with the support of the Raymond Family Business Institute a
pretest of such procedures was completed in 10 of the GEM 2002 countries: Australia, Brazil, Hungary, Israel, New
Zealand, Singapore, Spain, Sweden, the United Kingdom and the United States. Countries were chosen for this pretest
to maximize regional diversity and probe for the impact of different levels in national development.
Two discriminating questions were asked of all entrepreneurially active adults in the GEM 2002 adult population
survey: (1) “Is 50 percent or more of the firm currently owned by family members?” or (2) “Is majority family ownership
expected within five years?”24 The assessment was organized in relation to whether the firm had one principal owner
or two or more owners. Based on the responses of the individuals reporting on the business entities, there was more
than 50 percent family ownership for more than one-third of the entities: 40 percent among start-ups, 37 percent among
new firms, 36 percent among established firms and 38 percent of those in the TEA index.
A recurrent dilemma in such analysis is how to treat one-person firms. Many would argue that family support is so
critical that any one-person firm should be considered a family business. This involves adding all one-person businesses
to the total of multiple owner businesses with a majority of family ownership. With this modification, about three-
fourths of all businesses were family owned: 74 percent of start-ups, 84 percent of new firms, 88 percent of established
firms and 78 percent of those in the TEA index.25 While the use of this measure suggests that older firms are more
likely to have family ownership, this probably reflects an increase in the proportion of one-person firms among older
companies.
Variation across countries in the proportion of family firms using this classification technique is presented in
columns 4 and 5 of Table 9. Using the reduced definition of a family business, the range is from 24 percent to 51
percent. With the expanded definition, the range is from 52 percent to 86 percent.
Table 9: Total Entrepreneurial Activity (TEA) and Family-Sponsored Entrepreneurship for Selected Countries
Total Population % Family % Family Family TEA Family TEA Count of Family Count of Family Count ofPopulation: 18-64 Yrs Ownership of Ownership of (Low (High TEA Participants TEA Participants All TEA
2002 Old: 2002 TEA entities TEA entities Estimate) Estimate) (Low Estimate) (High Estimate) Participants(Low Estimate) (High Estimate)
Country Total Total Total United States 280,000,000 173,911,000 32% 75% 3.2% 7.5% 5,565,000 12,973,000 18,260,000Brazil 176,029,000 106,442,000 50% 86% 6.0% 10.2% 6,386,000 10,899,000 14,369,000United Kingdom 59,778,000 36,927,000 26% 78% 1.3% 3.8% 480,000 1,399,000 1,994,000Australia 19,546,000 12,273,000 34% 77% 2.5% 5.6% 306,000 688,000 1,067,000Spain 40,077,000 25,886,000 24% 56% 1.1% 2.5% 284,000 654,000 1,190,000Hungary 10,075,000 6,557,000 29% 80% 1.6% 4.3% 104,000 282,000 432,00New Zealand 3,908,000 2,432,000 51% 75% 4.9% 7.1% 119,000 173,000 340,000Israel 6,029,000 3,485,000 36% 76% 2.1% 4.4% 73,000 154,000 247,000Singapore 4,452,000 3,191,000 38% 65% 2.0% 3.3% 62,000 106,000 188,000Sweden 8,876,000 5,433,000 26% 52% 0.7% 1.5% 40,000 79,000 215,000Sum 608,770,000 376,537,000 13,419,000 27,407,000 38,302,000Average 34% 76% 2.5% 5.0%

36
How many family-owned start-ups and new firms are involved in the entrepreneurial process? Two sets of
estimates, based on whether or not the one-principal entities are universally counted as family firms, are provided in
Table 9. For comparison, the total number of participants is presented in the far right column. For these 10 countries the
number of those involved in a family-owned business varies from 13 million to 27 million, which is one-third to three-
fourths of the 38 million participants involved in these 10 countries. The estimates are based on a total of 376 million
individuals 18 to 64 years of age from a total population of 609 million. From this analysis, it is clear that a substantial
proportion of those involved in the entrepreneurial process are doing so with family-supported new ventures.

37
Conclusions
It is obvious from GEM 2002 that a tremendous number of people are engaged in entrepreneurial endeavors around
the globe. Based on this year’s sample of 37 countries representing 62 percent of the world’s population and 92 percent
of its GDP, GEM researchers were able to conservatively estimate that, at present, 460 million individuals worldwide are
either starting a new business or managing a young business of which they are an owner. They are also able to
demonstrate once again that entrepreneurial activity is not evenly spread between regions or countries, and that the
motivation behind the entrepreneurial effort affects its processes and outcomes. Further, based on GEM 2002, it may be
concluded that:
■ The national level of entrepreneurial activity appears to reflect general macroeconomic conditions — moving up
and down with changes in the national GDP — as well as enduring cultural, social and institutional factors —
maintaining the general rank order of GEM countries from year to year.
■ Only about 7 percent of start-up efforts are likely to expand the range of goods or services by creating new
sectors or market niches. Further, while market creation is more pronounced among opportunity-based new
firms, it is found among necessity-based start-ups as well.
■ Consistent with previous GEM studies, national economic growth is associated with heightened levels of
entrepreneurship. Specifically, correlations between entrepreneurial activity in one year and growth in GDP two
years later were significant and positive. Though the exact causal mechanisms have not been established,
future research should reveal just how the two are connected. Additional study will also focus on why
correlations are higher for necessity than for opportunity entrepreneurship.
■ Women participate in the entrepreneurial process at about half the rate of men. While they are influenced by
many factors and processes that also affect men, there are some significant differences. In addition, the factors
that affect females take different forms in highly developed countries compared to developing countries. For
example, more participation in the labor force in developed countries is associated with greater female
entrepreneurship, while in developing countries the reverse occurs — job opportunities for women appear to
reduce their participation in the start-up process.
■ Entrepreneur-friendly cultural and social norms, government policies, and education and training are major
strengths for most GEM countries. However, these same factors along with financial support are often cited as
weaknesses as well. National experts show considerable agreement on the types of factors considered positive
and negative for entrepreneurship in their own country, and tend to share the same perspectives and frameworks
in reviewing their country’s situation.
■ Informal financial support for start-ups is five times that of domestic venture capital support (US$300 billion
versus US$60 billion) among the 37 GEM 2002 countries. This mirrors findings from previous GEM assessments.
Venture capital support declined significantly between 2000 and 2001 as the potential for successful initial
public offerings diminished. However, informal support was more consistent, reflecting greater stability at the
grassroots level of entrepreneurial activity.

38
■ High potential new firms — that is, those using new technology, expecting to create new market niches,
anticipating high job creation and planning to export — comprise a small proportion of all start-up activity and
seem to operate under a different set of factors than do typical start-up businesses. As would be expected, they
are more prevalent in “R&D rich” countries.
■ Most of the businesses in the world are either owned by a single family group or by an individual with strong
family connections. This appears to be true for start-ups as well. This has implications with regard to the
processes by which individuals assemble the resources and talent necessary to put a new business in place.
Implications for Policymakers
The GEM 2002 report was designed to present a timely description of the major variations and features of
entrepreneurship around the globe. This, in turn, was intended to spark discussions with regard to the policy
implications indicated by these findings. As a result, this report does not offer suggestions for specific national policies
or guidelines. That task is better left to the GEM national teams who, because of their immersion in the local context,
are better able to articulate the implications for their corner of the world. Nevertheless, a few broad observations and
policy issues may be entered into the debate from this vantage point:
■ Perhaps the most significant general implication proffered by this research is related to the overall scope of the
phenomenon itself. Even in the less entrepreneurial countries, tens of thousands, if not millions, of the citizenry
are pursing entrepreneurship as a career option. Therefore, it would seem that it is incumbent on each
government to make an effort to understand, if not encourage, this pervasive socio-economic phenomenon.
■ GEM research continues to show a positive association between entrepreneurship and national economic
growth. In developing countries, the link appears to be strongest with necessity entrepreneurship. However,
few policymakers (even experts in entrepreneurship) seem to appreciate or understand this mechanism, though it
has considerable potential. In certain parts of the earth, it may be particularly vital to the economic well-being of
the nation to ensure that all educational programs prepare all adults for an entrepreneurial career.
■ The formal venture capital industry — an important source of funding for some firms in some emerging
economic sectors — currently receives the bulk of attention from governments as a mechanism for providing
new firm financing. While venture capital is certainly an important component of the overall picture, the GEM
2002 research shows that the financial support provided by informal sources is 10 to 20 times more prevalent.
It is, in fact, the fuel that is propelling the vast majority of new firms. Therefore, at the very least, governments
should look for unobtrusive ways to identify and track the informal, personal financial flows that occur within
their borders. They might also want to consider the development of policies that further encourage such flows.
■ The GEM 2002 report presents preliminary evidence that the mechanisms leading to “high potential” R&D based
start-ups may be quite different from those leading to the more “typical” variety. Government investment in
understanding the differences between the two would seem like a sound bet. Infrastructure designed to support
one may not be useful, or worse, might inhibit the development of the other. Both could eventually contribute to
economic vitality, though through different processes.

39
Finally, it is clear that entrepreneurship is a major mechanism leading to economic growth and adaptation in all
economies whether developed, in transition, or developing. Only a very few countries have developed strategies that
allow them to grow without high levels of entrepreneurial activity — Belgium, Hong Kong, The Netherlands and
Singapore. It is also obvious that national differences in the level of activity — as represented by a relatively persistent
rank order among countries — may reflect considerable institutional, social and cultural factors that may be quite
difficult to change in the short run. The reports prepared by the GEM national teams highlight both the processes
common among all countries and the unique features of each country, drawing on the assessments of national experts.
The fact that many national governments have implemented a wide range of programs and procedures to facilitate or
enhance entrepreneurial activity with little evidence of short-term impact is not evidence that the programs are
necessarily wrong, only that major shifts in the phenomena may take time.

40
Appendix A: The GEM Conceptual Model
The GEM research program is based on an underlying conceptual model of the major causal mechanisms affecting
national economic growth. This model has three primary features. First, it focuses entirely on explaining why some
national economies are growing more rapidly than others. Second, it assumes that all economic processes take place in
a relative stable political, social and historical context. Finally, and perhaps most unique to GEM, it considers two
distinct but complementary mechanisms to be the primary sources of national economic progress (Figure A-1).
Figure A-1: The GEM Conceptual Model
Social, Cultural,Political Context
Business Churning
NationalEconomic Growth(GDP, Jobs)PP
MajorEstablished Firms(Primary Economy)
Micro, Small andMedium Firms(Secondary Economy)
General National
• Trade)
• Financial Markets
• TT , R&D
• Infrastructure (Physical)•• Labor Markets (Flexible)
(Unbiased, Rule of Law)
EntrepreneurialConditions
• Financial
s•• R ransfer•
Infrastructures
• Access to Physical
• Cultural, Social Norms
EntrepreneurialOpportunities
EntrepreneurialCapacity• Skills• Motivation
The first major mechanism, as illustrated in the top portion of Figure A-1, reflects the role of large established firms
that provide national representation in international trade. The assumption behind this part of the model is that if the
general national conditions are appropriately developed, the international competitive posture of large firms will be
enhanced. Then, as these firms mature and expand, they will create significant demand for goods and services in their
host national economies. This increase in demand will, in turn, produce market opportunities for many micro, small and
medium-sized firms. This scenario is particularly robust when international exchanges are restricted to stable
commodities with little change in markets or production technology.
The second primary mechanism driving economic growth, as illustrated in the lower portion of Figure A-1,
emphasizes the role of entrepreneurship in the creation and growth of new firms. According to this portion of the
model, another set of contextual factors, referred to as “Entrepreneurial Framework Conditions,” intervenes between the
social/cultural context and the emergence and expansion of new firms. In addition, two critical features in the
entrepreneurial process are specified: (1) the emergence or presence of market opportunities and (2) the capacity (i.e.,
motivation and skill) of the people to initiate new firms in pursuit of those opportunities. The entrepreneurial process is
41
particularly robust in dynamic market settings where success is dictated by higher levels of creativity, innovation and
speed to market.
Perhaps the greatest value in the GEM model is its focus on the complementary nature of the underlying
mechanisms, both of which have been empirically linked to national economic growth. Indeed, large established firms,
through technology spillovers, spin offs and increasing demand for goods and services, often provide opportunities for
new business initiatives. Entrepreneurial firms, on the other hand, provide a competitive advantage for established
firms — their major customers — in global arenas, through lower costs and accelerated technology development.
Though previous GEM findings have supported this complementary perspective, it is also clear that these processes are
extremely complex. The GEM model will continue to be adjusted to reflect insights derived from the research in an
effort to better understand the impact of these mechanisms on economic growth.
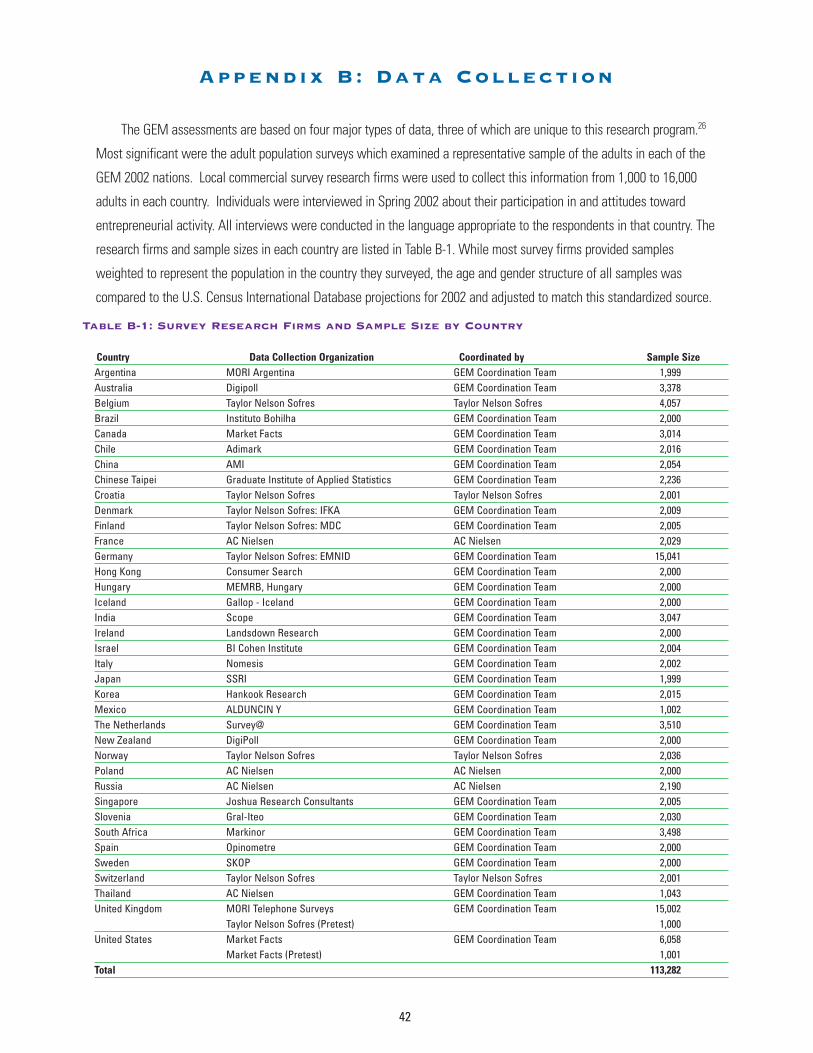
42
Appendix B: Data Collection
The GEM assessments are based on four major types of data, three of which are unique to this research program.26
Most significant were the adult population surveys which examined a representative sample of the adults in each of the
GEM 2002 nations. Local commercial survey research firms were used to collect this information from 1,000 to 16,000
adults in each country. Individuals were interviewed in Spring 2002 about their participation in and attitudes toward
entrepreneurial activity. All interviews were conducted in the language appropriate to the respondents in that country. The
research firms and sample sizes in each country are listed in Table B-1. While most survey firms provided samples
weighted to represent the population in the country they surveyed, the age and gender structure of all samples was
compared to the U.S. Census International Database projections for 2002 and adjusted to match this standardized source.
Table B-1: Survey Research Firms and Sample Size by Country
Country Data Collection Organization Coordinated by Sample SizeArgentina MORI Argentina GEM Coordination Team 1,999Australia Digipoll GEM Coordination Team 3,378Belgium Taylor Nelson Sofres Taylor Nelson Sofres 4,057Brazil Instituto Bohilha GEM Coordination Team 2,000Canada Market Facts GEM Coordination Team 3,014Chile Adimark GEM Coordination Team 2,016China AMI GEM Coordination Team 2,054Chinese Taipei Graduate Institute of Applied Statistics GEM Coordination Team 2,236Croatia Taylor Nelson Sofres Taylor Nelson Sofres 2,001Denmark Taylor Nelson Sofres: IFKA GEM Coordination Team 2,009Finland Taylor Nelson Sofres: MDC GEM Coordination Team 2,005France AC Nielsen AC Nielsen 2,029Germany Taylor Nelson Sofres: EMNID GEM Coordination Team 15,041Hong Kong Consumer Search GEM Coordination Team 2,000Hungary MEMRB, Hungary GEM Coordination Team 2,000Iceland Gallop - Iceland GEM Coordination Team 2,000India Scope GEM Coordination Team 3,047Ireland Landsdown Research GEM Coordination Team 2,000Israel BI Cohen Institute GEM Coordination Team 2,004Italy Nomesis GEM Coordination Team 2,002Japan SSRI GEM Coordination Team 1,999Korea Hankook Research GEM Coordination Team 2,015Mexico ALDUNCIN Y GEM Coordination Team 1,002The Netherlands Survey@ GEM Coordination Team 3,510New Zealand DigiPoll GEM Coordination Team 2,000Norway Taylor Nelson Sofres Taylor Nelson Sofres 2,036Poland AC Nielsen AC Nielsen 2,000Russia AC Nielsen AC Nielsen 2,190Singapore Joshua Research Consultants GEM Coordination Team 2,005Slovenia Gral-Iteo GEM Coordination Team 2,030South Africa Markinor GEM Coordination Team 3,498Spain Opinometre GEM Coordination Team 2,000Sweden SKOP GEM Coordination Team 2,000Switzerland Taylor Nelson Sofres Taylor Nelson Sofres 2,001Thailand AC Nielsen GEM Coordination Team 1,043United Kingdom MORI Telephone Surveys GEM Coordination Team 15,002
Taylor Nelson Sofres (Pretest) 1,000United States Market Facts GEM Coordination Team 6,058
Market Facts (Pretest) 1,001Total 113,282

43
From the 113,000 individuals surveyed in 2002, over 7,000 (unweighted) were actively involved in a business start-
up or a new firm up to 42 months old. The information they provided about their entrepreneurial activity as well as their
personal background and situation were critical sources for the national descriptions of entrepreneurial activity and for
the cross-national comparisons.
Another type of data was provided by personal interviews conducted with 20 to 70 national experts in each GEM
2002 country — about 1,000 interviews in all. The experts provided their own personal assessments of the unique
features of their country’s situation to national team members. Again, the conversations were in the language of the
country. One-page summaries of these interviews, in English, were provided to the coordination team, where the
material was standardized and coded using common procedures for all countries.
The third source of data was a 10-page standardized questionnaire completed by these same experts at the
completion of the interview — also in the language of the country. These questionnaires were the source of more than
a dozen highly reliable scales used to assess and compare features of the national situation that cannot be measured in
any other way.
The final source of data was assembled from standard international sources to provide a harmonized description of
a wide range of basic features — economic growth, population structure, educational attainment, institutional and
technical infrastructure and the like. A special effort was made to assemble data on the activities of the venture capital
sector in each country.

44
End Notes
1 This one measure appears to capture all types of entrepreneurial activity within a country as evidenced in
Table E-1. Based on the responses of a representative sample of adults across the 37 GEM 2002 countries,
“total entrepreneurial activity” (TEA) is significantly correlated with: (a) starting a new venture,
(b) owning/managing a young firm (less than 42 months old), (c) entrepreneurial activity motivated by
opportunity, (d) entrepreneurial activity motivated by necessity, (e) male entrepreneurship, (f) female
entrepreneurship, (g) entrepreneurial efforts that expect to create new market niches, (h) entrepreneurial
efforts that expect to create 20 or more jobs in five years, (i) entrepreneurial efforts that expect to export
goods and services outside the country, (j) entrepreneurial efforts that expect to both create new market
niches and 20 or more jobs in five years, and (k) “high potential ventures” — entrepreneurial efforts that
expect to create new niches, produce new jobs, and export goods or services. In sum, the TEA index reflects
the prevalence rate of all of these activities which seem to be present — or absent — together.
2 An individual may be considered a “nascent entrepreneur” under three conditions: first, if he or she has done
something — taken some action — to create a new business in the past year; second, if he or she expects
to share ownership of the new firm; and, third, if the firm has not yet paid salaries or wages for more than
three months. In cases where the firm has paid salaries and wages for more than three months but for less
than 42 months, it is classified as a “new business.” Those 5 percent who qualify as both a “nascent
entrepreneur” and a “new business” are counted only once. GEM 2002 also collected data on a large
number of individuals who are owner/managers of firms more than 42 months old. However, the analysis of
these “established businesses” is not reported in this summary.
3 The source of standardized annual population structure estimates was the U.S. Census Bureau International
Database http://www.census.gov/ipc/www/didbnew.html. The 18 to 64 age range is covered by all samples in
all countries and approximates the ages for which individuals are expected to be active in the labor force.
Table E-1: Correlations Between the TEA Index and Other Measures of Entrepreneurial Activity
Measure of Entrepreneurial Activity Correlation with TEA OverallStart-up (nascent) firm prevalence rate 0.94***New business (up to 42 months old) prevalence rate 0.91***TEA opportunity 0.91***TEA necessity 0.75***TEA index for males: 18-64 yrs. old 0.98***TEA index for females: 18-64 yrs. old 0.96***TEA index for firms expecting any market expansion 0.83***TEA index for firms expecting more than 19 jobs in five years. 0.69***TEA index for firms expecting to export 50% or more of sales 0.33*TEA index for high-potential firms expecting major job growth and market creation 0.82***TEA index for high-potential firms expecting major job growth, market creation, and any exports 0.34*
One tailed test of statistical significance; * < 0.05; ** <0.01; *** <0.001

45
4 See Reynolds, Paul D., et al. 2001. Global Entrepreneurship Monitor: 2001 Summary Report, available at
www.gemconsortium.org.
5 While a change in survey firms in India and an expansion of the sample may be the source of the variability in
that country, the increase in Argentina is due to a dramatic surge in that country’s necessity entrepreneurship.
In the past year, and most likely as a result of the crisis in Argentine financial institutions, the prevalence of
necessity-driven entrepreneurship has doubled. This, then, has more than offset a decline in Argentina’s more
opportunity-motivated entrepreneurial activity.
6 The most recent IMF projections (as of September 25, 2002) were used in this assessment and are available
at www.imf.org/external/pubs/B/WEO/2002/02.
7 Only four of these 27 countries had an absolute decline in GDP — Argentina, Japan, Israel and Mexico.
8 Refer to the following table:
9 These questions were based in part on the assessment of Swedish nascent entrepreneurs discussed in
Samuelsson, Mikael (2001) “Modeling the Nascent Venture Opportunity Exploitation Process Across Time.”
Jonkoping, Sweden: Babson-Kauffman Entrepreneurial Research Conference.
10 United Nations, Statistical Office, Department of Economic and Social Affairs (1990), International Standard
Classification of All Economic Activities: Revsion 3. New York City, United Nations.
http://esa.un.org/unsd/cr/registry/regist2.asp.
11 Professor Erkko Autio, of Helsinki University of Technology and CERN in Geneva, Switzerland, is the leader of
the team doing special assessments related to the development of technology- and science-based new firms.
12 The World Competitiveness Yearbook: 2002. Lusanne, Switzerland: International Institute for Management
Development.
13 Schwab, K., M. Porter, and J. Sachs. (2002) The Global Competitiveness Report: 2001-2002. Oxford, UK:
Oxford U. Press.
14 Data regarding economic growth were obtained from the International Monetary Fund World Economic
Outlook which provides a continuous record of national economic growth, adjusted for inflation and
differences in national purchasing power. It is updated three times a year and the September 2002 data were
Table E-2: Correlations Between Year-to-Year Changes in Entrepreneurial Activity
Correlations (number of countries) 1999 and 2000 2000 and 2001 2001 and 2002Business start-up rate 0.81 (10) 0.61 (20) 0.74 (28)
TEA overall index 0.81 (20) 0.74 (28)TEA opportunity 0.60 (28)TEA necessity 0.74 (28)
NOTE: All statistically significant at 0.001, one tailed test.
Correlations Between TEA Rates for:

46
used to determine the national growth in GDP for a number of one-year periods. This analysis included the
use of projections for 2003 to compute national economic growth in the 2002 to 2003 period. The
International Monetary Fund World Economic Outlook is located at www.imf.org/external/pubs/B/WEO/2002/02.
15 It is interesting to note that the correlations before the focal year (i.e., at time–1) were about the same for
opportunity and necessity entrepreneurship. However, concurrent and following correlations (i.e., at time0,
time1, and time2) were uniformly higher for necessity entrepreneurship. This is consistent with analysis
completed as part of the GEM 2001 report, when this distinction was first made. Thus, necessity
entrepreneurship appears to be associated with higher levels of subsequent national economic growth.
16 No national teams were present in Italy, Poland or Russia.
17 The national experts were a distinctive group in a number of ways: (a) 82 percent were men, (b) 90 percent
were over 35 years of age, (c) 95 percent had college/university degrees, (d) 69 percent had post-
college/university educational experiences, (e) 57 percent had more than 10 years of work experience, and
(f) they were evenly divided across the nine entrepreneurial framework conditions in terms of their respective
areas of expertise. Surprisingly, compared to the typical adults in these 34 countries, the experts — most of
whom had full time jobs in established government agencies or business organizations — were three to five
times more likely to report a current or expected involvement in an entrepreneurial activity.
18 The material provided by the experts during the face-to-face interviews initially focused on their respective
areas of expertise. It then shifted to other relevant topics chosen by the expert. At the conclusion of the
discussion, the expert was asked to provide three major strengths supporting entrepreneurship in their
country, three major weaknesses, and three policy suggestions. These were translated into English as one-
page summaries and submitted to the GEM coordination team for review, standardization, coding and
classification into the nine general entrepreneurial framework conditions. This procedure was developed by
Isabel Servais and implemented by Natalie De Bono with the use of the QSR NUD*IST program and
substantial technical assistance from United Kingdom consultant Dr. Clare Tagg.
19 To develop reliable measures of these factors, the national experts were asked to complete a 10-page
questionnaire. The majority of the items were factual statements about the situation in their country, such as,
“In my country, people working for government agencies are competent and effective in supporting new and
growing firms.” Answers were provided on a five-point scale: “completely true,” “somewhat true,” “neither
true nor false,” “somewhat false,” and “completely false.” The questionnaire — developed in English — was
translated into the appropriate language for each GEM country by its respective national team.
Based on responses in these self-administered questionnaires, 18 different aspects of the national
entrepreneurial context were measured with multi-item indices. Most were closely related to the GEM model,
representing various entrepreneurial framework conditions, the presence of opportunities within the country,
and two aspects of the capacity of the people for entrepreneurial activity — skills and motivation. This
reflects the initial focus of the research program on opportunity-based entrepreneurship. Additional sets of

47
items were added to measure the national protection for intellectual property rights (IPR) as well as the
presence of support for women to engage in entrepreneurship.
Multi-item indices provide more reliable assessments, ensuring the same result on repeated applications. The
high reliabilities (eight were 0.80 or above, and only two are below 0.70) reflect the constant adjustment and
improvement to the questionnaire since 1999. The 2002 version was the fourth generation and represented a
substantial technical achievement. As a result, there is great confidence that individuals in different countries
are responding to the items in the same way, and it is therefore appropriate to use the results to compare
countries.
20 The GEM special team working on the topic of women and entrepreneurship is comprised of: Pia Arenius,
Helsinki University of Technology; Anne Kovalainen, Turku School of Economics; Maria Minniti, Babson
College; and Susan Rushworth, Swinburne University of Technology.
21 These sampling ratios vary from 1 in 90 in Iceland to 1 in 300,000 in China. Weighting by the sampling ratio
substantially increases the impact of those engaged in necessity entrepreneurship on the descriptive patterns.
22 The break at US$18,000 per year (in 1999) was justified by the observation of a major gap in the distribution
of per capital annual income between US$15,860 and US$19,160. Those 19 countries with per capita income
in excess of US$18,000 per year in 1999 include Australia, Belgium, Canada, Denmark, Finland, France,
Germany, Hong Kong, Iceland, Ireland, Italy, Japan, Netherlands, Norway, Singapore, Sweden, Switzerland,
the United Kingdom and the United States. Those 18 countries with per capita income below US$18,000 per
year in 1999 include Argentina, Brazil, Chile, China, Chinese Taipei (Taiwan), Croatia, India, Israel, Korea,
Hungary, Mexico, New Zealand, Poland, Russia, Slovenia, South Africa, Spain and Thailand.
23 This section was prepared on behalf of the GEM family team, chaired by Dr. Carol Wittmeyer and sponsored
by the Raymond Family Business Institute.
24 This is the first and most critical of six criteria that may be used in an assessment of whether or not a firm is
considered a “family business.” Others that may be used include family representation in management, more
than 50 percent of managers from the same family, family members determining the firm strategy, plans to
transfer the firm to future family generations, and perception of the family managers that this was, indeed, a
family business. Uhlaner, Lorraine M. (2002). The Use of the Guttman Scale in Development of a Family
Business Index. Zootermeer, NL: EIM Research Report H200203, September 2002.
25 Similar proportions of family-owned businesses have been found in other samples reflecting the United
Kingdom and European countries (Westhead, P, and Cowling M. (1998) Family Firm Research: The Need for a
Methodological Rethink. Entrepreneurship Theory and Practice, 23(1):31-56.
26 Details of all procedures are contained in the Operations Manual, which is available upon request.