global environment - universidade nova de...
TRANSCRIPT
Global Environment
Francesco Franco
Nova SBE
September 26, 2014
Francesco Franco Global Environment 1/36

The roots of the analytical toolsOccidental philosophy
• Greece, polis, republic, slaves, relatively equal.• Speculative natural philosophy based on observation and
reason.• Anthropocentric. know yourself.
Francesco Franco Global Environment 2/36

The roots of the analytical toolsOccidental philosophy
• Judeo-Christian. Independent of the state and hostile to it.• Space between Church and Emperor: local powers, charters.
Italy.• Back to anthropocentrism, speculative thought. Pico,
Machiavelli, Bacon, Hobbes and Locke.• Natural rights. Scientific method. Mathematics.
Francesco Franco Global Environment 3/36
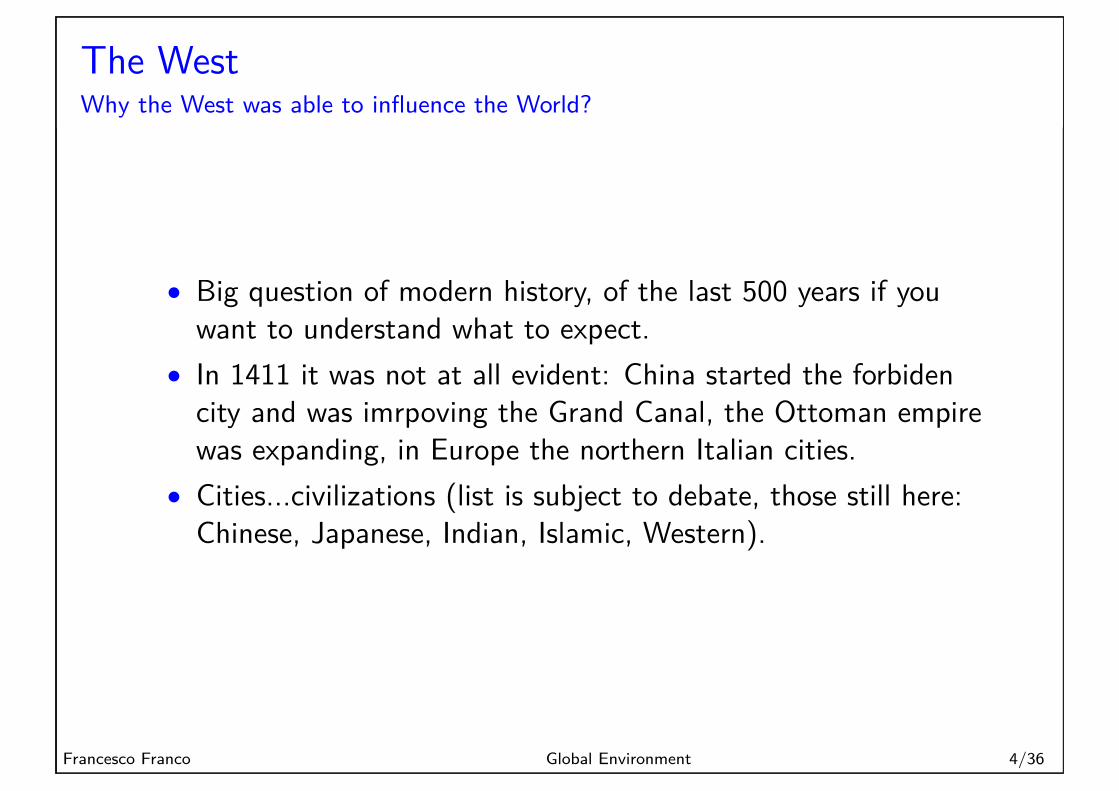
The WestWhy the West was able to influence the World?
• Big question of modern history, of the last 500 years if youwant to understand what to expect.
• In 1411 it was not at all evident: China started the forbidencity and was imrpoving the Grand Canal, the Ottoman empirewas expanding, in Europe the northern Italian cities.
• Cities...civilizations (list is subject to debate, those still here:Chinese, Japanese, Indian, Islamic, Western).
Francesco Franco Global Environment 4/36

The WestIs it imperialism?
Figure : The expansion of the West
Francesco Franco Global Environment 5/36

A World HistoryOr Fergusson 6 killer apps?
Six institutions:1 Competition2 Science3 Property rights4 Medicine5 The consumer society6 The work ethic
Francesco Franco Global Environment 6/36
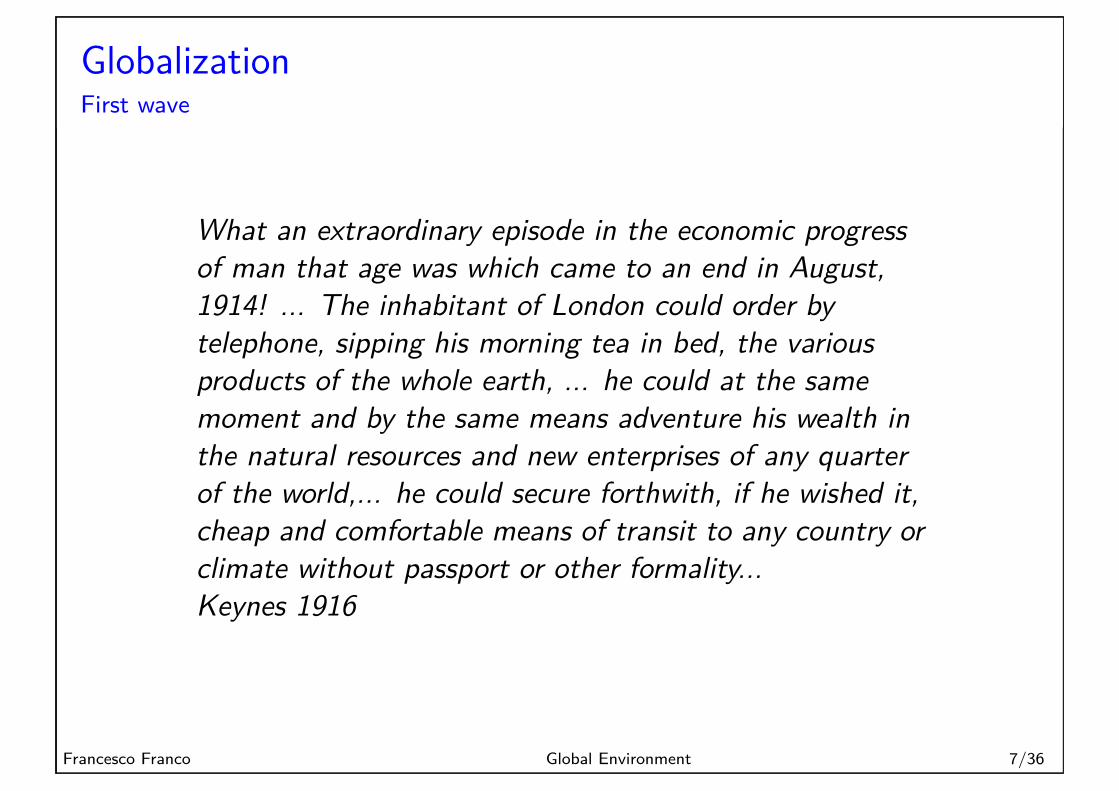
GlobalizationFirst wave
What an extraordinary episode in the economic progressof man that age was which came to an end in August,1914! ... The inhabitant of London could order bytelephone, sipping his morning tea in bed, the variousproducts of the whole earth, ... he could at the samemoment and by the same means adventure his wealth inthe natural resources and new enterprises of any quarterof the world,... he could secure forthwith, if he wished it,cheap and comfortable means of transit to any country orclimate without passport or other formality...Keynes 1916
Francesco Franco Global Environment 7/36
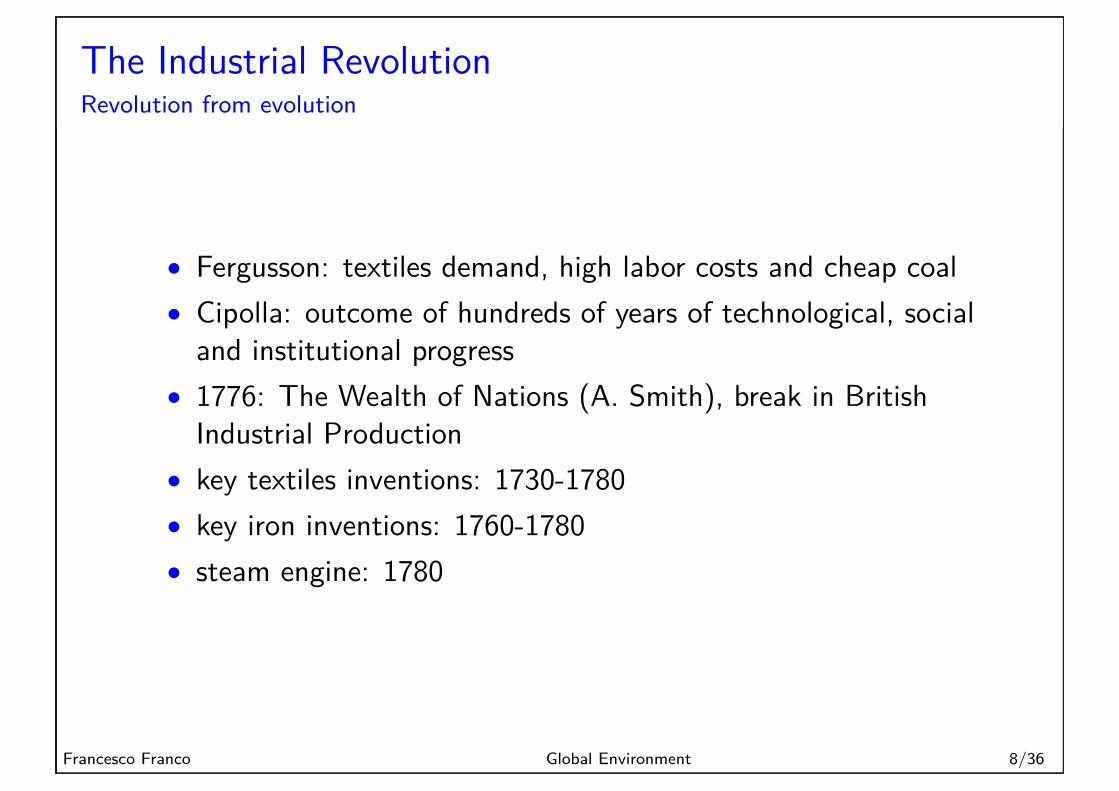
The Industrial RevolutionRevolution from evolution
• Fergusson: textiles demand, high labor costs and cheap coal• Cipolla: outcome of hundreds of years of technological, social
and institutional progress• 1776: The Wealth of Nations (A. Smith), break in British
Industrial Production• key textiles inventions: 1730-1780• key iron inventions: 1760-1780• steam engine: 1780
Francesco Franco Global Environment 8/36

The Industrial RevolutionTransportation and comunication
• internal market improvement: canals and later rail-raods(1820-1850)
• external markets: steam ships (1830-1870)• 1871, le Frigorifique, chilled beaf from Argentina to France• 1880, frozen butter from New Zealand• Financial intermediation helped development and financed
first transatlantic telegraph cable (1866)
Francesco Franco Global Environment 9/36

The Industrial RevolutionUK
• share of workers in industry: 19% (1700), 24% (1760), 30%(1800), 47% (1840), 50% (1870).
• In the same periods population shifted to cities, 2/3 in urbanareas
• UK became food importer and exporter of industrial goods
Francesco Franco Global Environment 10/36
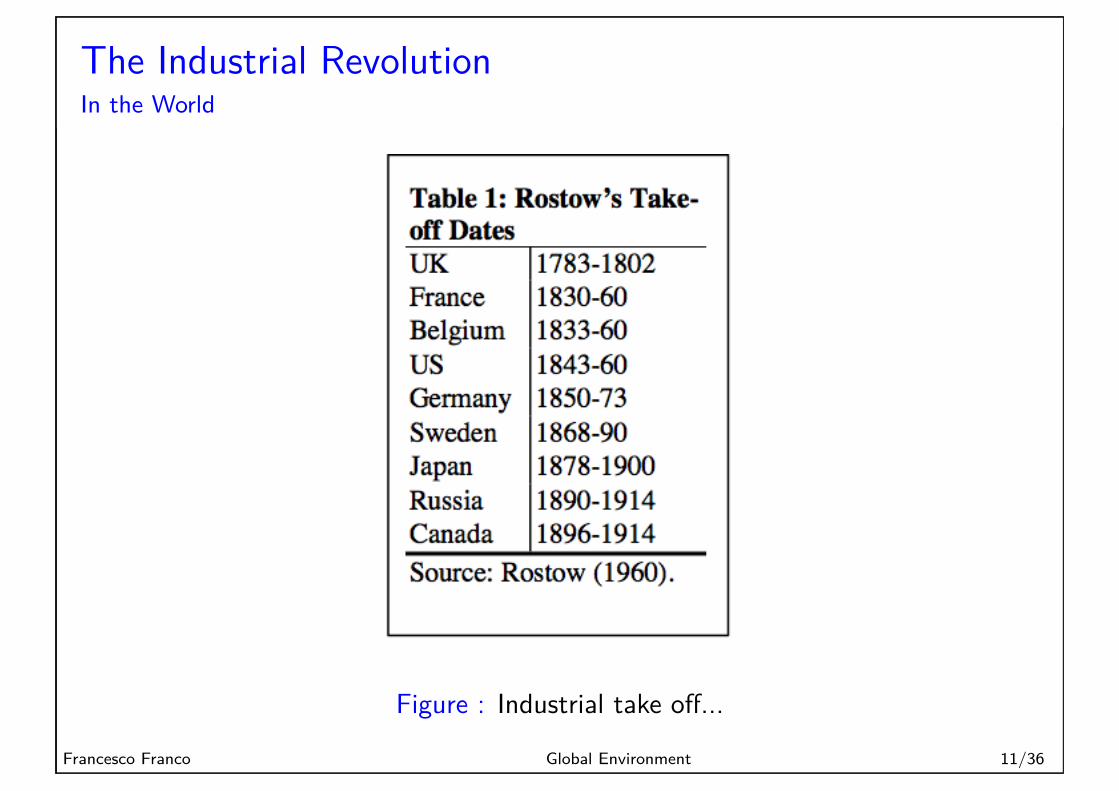
The Industrial RevolutionIn the World
Figure : Industrial take o�...
Francesco Franco Global Environment 11/36

De-industrialisationThird World
• Contrary to Fergusson, Kuznets and Braudel believed that theEast was more developed before the 19th century
• Indian cotton textile industry, China silk and porcelain, in the18th century
• By end of 19th century the East becomes a net importer oftextiles, iron and manufactured goods
• De-industrialisation: 73% of world manufacturing (1750),7.5% (1913)
Francesco Franco Global Environment 12/36

De-industrialisationThird World
Figure : Industrial divergenceFrancesco Franco Global Environment 13/36

GlobalisationSecond wave: gains from de-industrialisation
4
“There seems little doubt that de-industrialisation in the South was the result of a massive inflow ofEuropean manufactured imports. This was particularly true of textile and clothing industries, where freetrade exposed the local artisanal and craft producers to the destructive competitive gale of more capitalintensive, high productivity Northern producers” (Kozul-Wright and Bairoch 1996:16).
Table 2 shows the evolution of per capita industrialisation and de-industrialisation. Note that all nationsand regions started at similar levels. In 1750, all European nations were at a level between 6 and 10 (with
UK’s level in 1900 being 100); all non-European nations were at 7 or 8, except the US, which was at 4.China and India are the chief nations represented in the Third World and they follow very similar pathsdropping from something like 8 to about 3. We also see the UK’s spectacular performance and thesubsequent catch up of the US. Japan’s industrialisation path mimics that of the world average.
Of course, the basic equality of the per capita levelcombined with Europe’s small population meant that the ThirdWorld ‘industry’ dominated world production in the 18th
century (Bairoch 1982 Table 10). For instance, in 1750 theThird World accounted for 73% of world manufacturingoutput and it continued to account for over half even as late as1830. By 1913, however, the Third World share had droppedto a mere 7.5%.
This colonial-era de-industrialisation helps explain whymany Third World countries were distrustful of unfetteredinternational trade until very recently.
2.1.3 20th Century Industrialisation/De-Industrialisation
While the income gains of frontrunners in the 1st
globalisation wave were clearly based on industrialisation, theopposite seems to hold for the 2nd wave. Indeed, apart from thehandful of newly industrialised nations (NICs), convergence
Table 2: Per Capita Industrialisation Levels, 1750-1913.(UK in 1900 = 100) 1750 1800 1830 1860 1880 1900 1913Developed Countries 8 8 11 16 24 35 55Europe 8 8 11 17 23 33 45Europe (ex-UK) 7 8 9 14 21 36 57Austria-Hungary 7 7 8 11 15 23 32Belgium 9 10 14 28 43 56 88France 9 9 12 20 28 39 59Germany 8 8 9 15 25 52 85Italy 8 8 8 10 12 17 26Russia 6 6 7 8 10 15 20Spain 7 7 8 11 14 19 22Sweden 7 8 9 15 24 41 67Switzerland 7 10 16 26 39 67 87UK 10 16 25 64 87 100 115Outside Europe 7 7 11 17 33 63 116Canada 5 6 7 10 24 46USA 4 9 14 21 38 69 126Japan 7 7 8 7 9 12 20Third World 7 6 6 4 3 2 2China 8 6 6 4 4 3 3India-Pakistan 7 6 6 3 2 1 2Brazil 4 4 5 7Mexico 5 4 5 7World 7 6 7 7 9 14 21Source: Table 9, Bairoch (1982).
Table 3: Industry’s EmploymentShare, OECD nations, 1950-1990.% of workforce 1950 1980 1990Australia 36 32 26US 36 31 28Canada 33 33 25Austria 35 41 37Belgium 47 35 28Denmark 33 31 28Finland 28 35 31France 35 35 29Germany 43 45 38Italy 29 38 32Netherlands 40 31 26Norway 33 29 25Sweden 41 32 naSwitzerland 46 39 35UK 47 38 29Japan 23 35 34Sources: Maddison (1989) Table C-10, World Bank (1997) Table 4.
Figure : Tertiarisation
Francesco Franco Global Environment 14/36
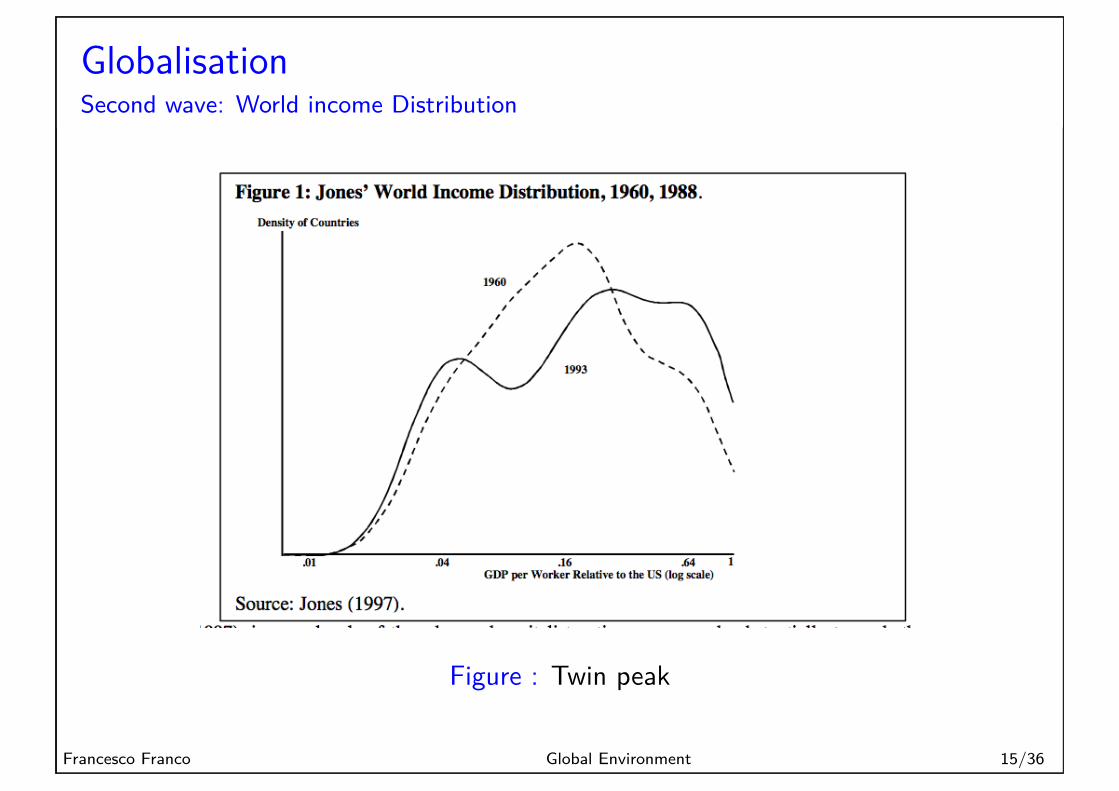
GlobalisationSecond wave: World income Distribution
Figure : Twin peak
Francesco Franco Global Environment 15/36

GlobalisationSecond wave: World income Distribution
Figure : China and India are equalisingFrancesco Franco Global Environment 16/36
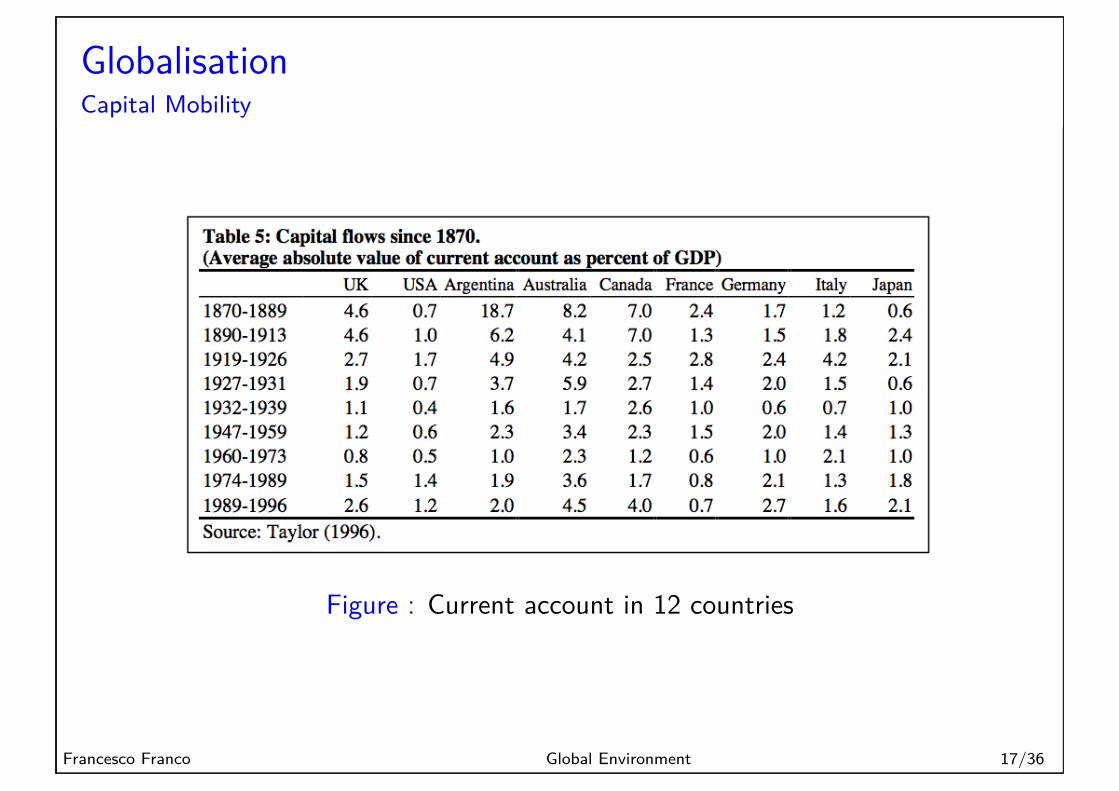
GlobalisationCapital Mobility
Figure : Current account in 12 countries
Francesco Franco Global Environment 17/36

GlobalisationCapital Mobility
Figure : Industrial take o�...
Francesco Franco Global Environment 18/36

GlobalisationCapital Mobility
Figure : and more recently
Francesco Franco Global Environment 19/36
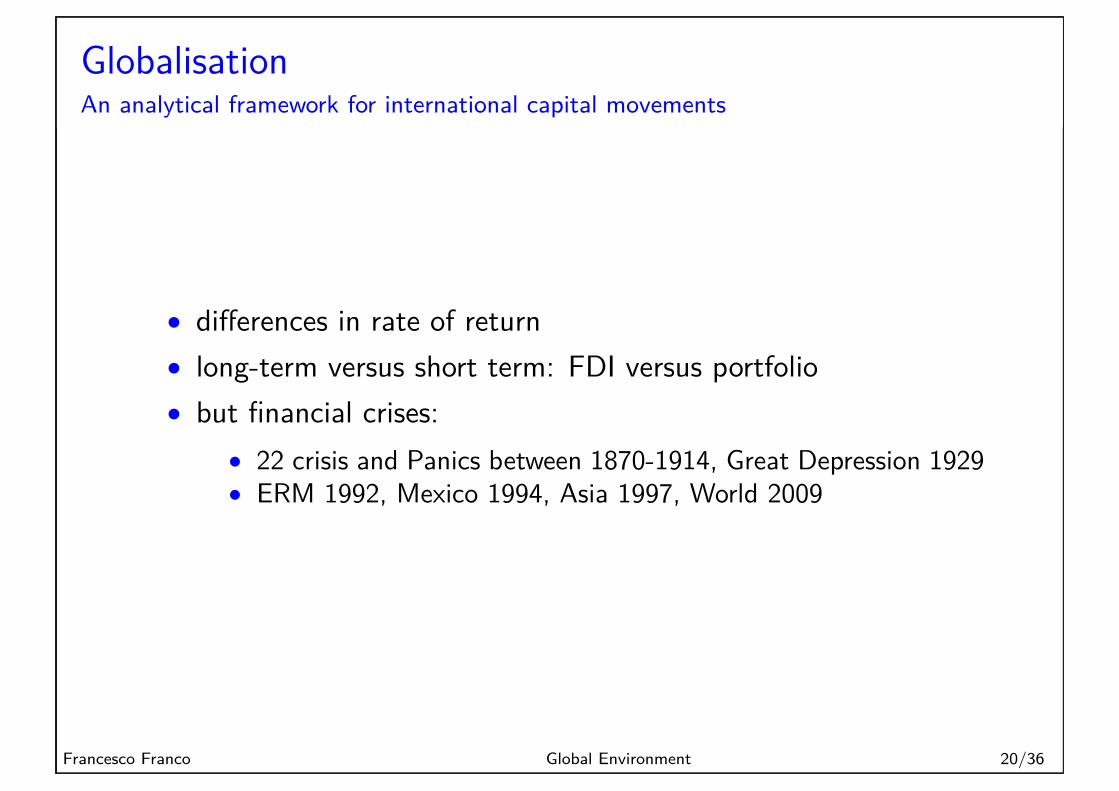
GlobalisationAn analytical framework for international capital movements
• di�erences in rate of return• long-term versus short term: FDI versus portfolio• but financial crises:
• 22 crisis and Panics between 1870-1914, Great Depression 1929• ERM 1992, Mexico 1994, Asia 1997, World 2009
Francesco Franco Global Environment 20/36

GlobalisationAn analytical framework for trade
• transport costs (Demand, Supply, t, shifters)• when transports costs have su�ciently decreased, Ricardian,
Hecsher-Olihn, Agglomeration forces• North-South divergence apperas naturally• the di�usion of technology: South industralises, North invests
in tertiary
Francesco Franco Global Environment 21/36

GlobalisationTrade Barriers: transportation costs
Figure : Declining costs
Francesco Franco Global Environment 22/36

GlobalisationTrade Barriers: Tari�s
15
open; about as open as the most liberal European nations were in the 1870s. The table also shows that theworld’s remaining protection (at least the easily quantified forms of protection) is limited to two basic twocategories, industrial goods in developing nationsand agricultural goods in developed nations.
Table 10 provide a long-term view of the US’stariff policies. These plainly show how the UnitedStates’ free trade stance is a very recent event byhistorical standards (apart from short-lived burstsof liberalism in the 1850s and the 1920s. Thefigures also clearly show the inter-war rise inprotection in the US.
4.1.2 Trade Flows Trade-to-GDP Ratios
Table 11 shows the ratios of total trade(imports plus exports) to GDP for 11 developednations in 1870, 1910, 1950 and 1995 (actualdates for the first three columns vary slightlyamong nations according to data availability). Thefirst two columns show that most nations experienced increased openness during the first wave ofglobalisation. The increases for Japan, Sweden and Denmark were quite spectacular, while those of othernations were more mild. The UK and Germany, for instance, had already done most of their opening up by1860. Shares for the US, Australia and Canada actually fell during this period. A part of this stems fromrelative price changes between their exports (mainly primary goods, especially wheat) and domesticproduction but a large part is dueto the fact that they neversubstantially liberalised theirtariffs. These nations wereprofoundly changed by the firstwave of globalisation but forthem, international flows ofpeople, capital and technologywere far more important thantrade (more on this below).
All countries apart fromCanada saw their openness ratiosdrop significantly between 1910and 1950. Moreover, all of them,except Japan, have regained orsurpassed their earlier levels oftrade. Thus at this level ofaggregation there is very littlenew about the 2nd wave of globalisation at a superficial level. However, as Lindbeck (1973) noted, thedenominators in the 19th century consisted primarily of private economic activity. In modern times,however, governments account for between 30% and 50% of GDP, so the fraction of private economicactivity exposed to international competition is now much greater than it was in the Victorian-eraglobalisation wave.
Figure 5 presents a more detailed time series for the US and the UK. The figure shows that the US isstill no more open than the UK was in 1850. It also shows that the UK’s burst of openness preceded thefirst wave of globalisation and that the US bucked the openness trend, becoming progressively more closedduring the 1870-1910 period. Since WWII, however, the US has opened up remarkably. This may helpexplain why the ‘globalisation is unprecedented’ school-of-thought is so strong in the US.
Figure 5: US and UK Openness Ratios, 1797-Present.Total Trade to GNP ratio, 1797 to 1995, US and UK,%
0
10
20
30
40
50
60
1797
1810
1821
1833
1843
1854
1866
1877
1888
1899
1910
1920
1931
1941
1951
1962
1975
1988
UKUS
Source: Bairoch (1989).
Table 11: Total Trade to GDP, 1870, 1910, 1950and 1995, Various Developed Nations. (%)
c.1870 c.1910 c.1950 1995UK 41 44 30 57France 33 35 23 43Germany 37 38 27 46Italy 21 28 21 49Denmark 52 69 53 64Norway 56 69 77 71Sweden 28 40 30 77USA 14 11 9 24Canada 30 30 37 71Australia 40 39 37 40Japan 10 30 19 17Notes: Exact dates vary, see Kuznets (1967).
Figure : Volumes
Francesco Franco Global Environment 23/36
GlobalisationTrade Barriers: Tari�s
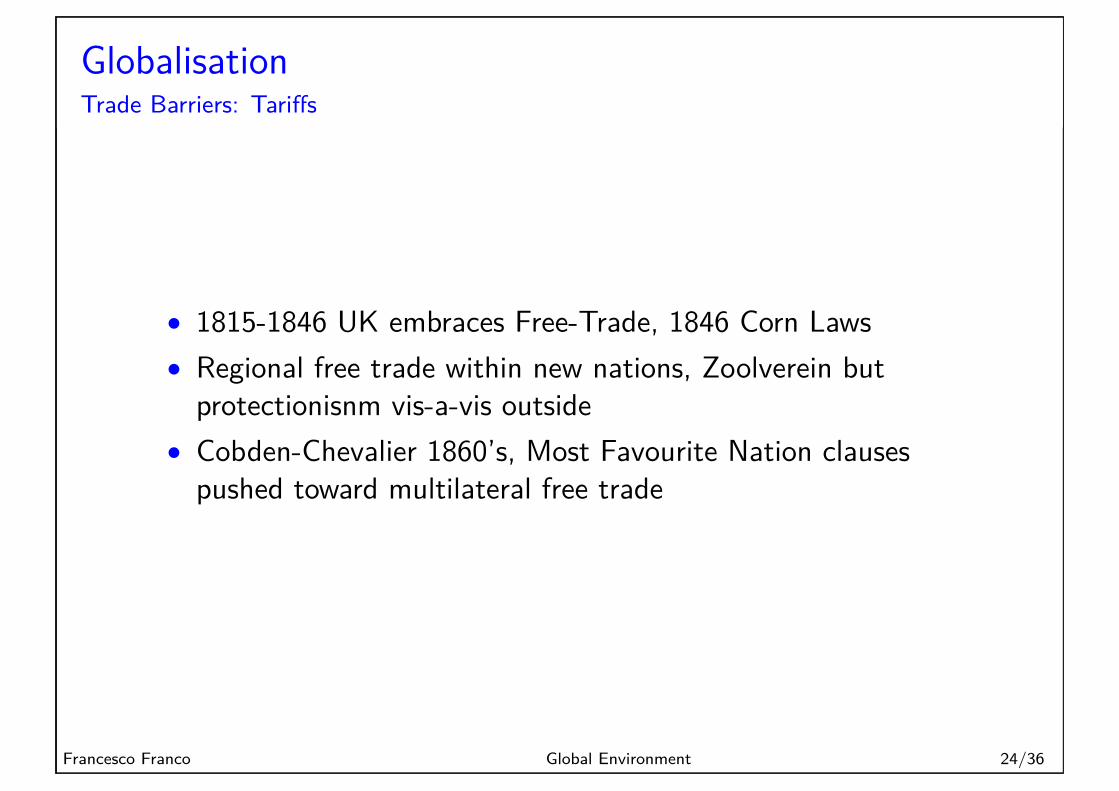
• 1815-1846 UK embraces Free-Trade, 1846 Corn Laws• Regional free trade within new nations, Zoolverein but
protectionisnm vis-a-vis outside• Cobden-Chevalier 1860’s, Most Favourite Nation clauses
pushed toward multilateral free trade
Francesco Franco Global Environment 24/36

GlobalisationTrade Barriers: Tari�s not a smooth process
14
protectionism.9 Bairoch (1989) and Harley (1996) distinguish four periods: the rise of British liberalism(1815-1846), the spread of European free trade (1846-1860), the liberal period (1860-1879), and theContinent’s return to protection while Britain remained open (1879-1914). Apart from brief flirtations withfree trade, non-European advanced nations, especially the US, remained protectionist until after WWII.Colonial nations that were not self-ruling had liberal policies (at least with their ‘mother’ countries)throughout much of this period (Bairoch 1989).
The period from 1815 and 1846 saw the establishment of Great Britain’s economic supremacy and itsembrace of free trade; the liberalisation of wheat imports (repeal of the Corn Laws) was the climatic eventin 1846. Other European powers also moved towards freer trade during this period. This, however,essentially entailed a shiftfrom strict mercantilism andfragmented internal marketsto modern protectionism.Germany established andfreed internal trade in itsZollverein but raisedexternal tariffs. Austria-Hungary, France, Russia andothers generally loweredinternal customs and exporttaxes, and shifted fromprohibitions onmanufactured imports tovery high tariffs.
Free trade policiesdiffused slowly andsporadically to theContinental economies from1846 to 1860. After 1860,liberal trade policies inEurope spread rapidly via a system of bilateral treaties (the so-called Cobden-Chevalier treaties). Sincethese generally included most favoured nations (MFN) clauses, they established multilateral free trade inEurope. These liberal policies, which lasted up to the end of the 1870s, were distinctly amplified by‘natural’ liberalisation, i.e. sharply lower transport cost (as discussed above).
Protectionism returned to Continental Europe after 1878 (more on this in Section 5.2). For farmers, therenewed protection just offset the sharp drop in wheat prices due to transport costs reductions (Bairoch1989:57). For industrial goods, by contrast, the new tariffs sharply reduced or prevented increases in
industrial imports, especially from Great Britain.Table 8 shows puts some numbers to these trends, showing that although trade barriers of the late 19th
century were lower than those of the early part of the century, the 1875-1914 period was marked by high orrising barriers everywhere except the UK and the Benelux countries.
The more recent globalisation wave is also marked by tariff liberalisation. Since the signing of theGATT in the late 1940s, all developed nations have progressively liberalised tariffs and other bordermeasures on industrial goods. Table 9 shows that except for clothing and a few sectors where specialprotection is important (mainly anti-dumping duties on chemicals and steel), the rich nations are quite 9 This section draws heavily on the masterful account of global trade policy in Bairoch (1989).
Table 9: Post-Uruguay Round Protection Levels.(Tariff equivalentsby commodity,%) Nafta EU Jpn
Med&ME
SubSAfrica
S.Amer Asia
Grains 2 71 184 18 20 2 17Other ag. 38 52 39 6 6 3 20Processed food 5 13 73 6 5 2 17Forestry 1 0 0 17 10 7 5Fishery 1 5 3 42 8 19 11Mining 1 0 0 17 10 4 4Textiles 8 7 5 35 16 15 29Clothing 19 10 9 39 20 23 21Lumber, pulp, paper 1 0 1 24 12 9 9Processed petro. Gds 1 1 1 17 5 12 12Chemicals, plastics, 7 12 2 20 8 13 12Primary steel 7 3 1 17 12 11 9Nonferrous metals 3 1 1 24 14 7 9Metal products 6 2 1 30 13 16 19Transport equipment 3 5 0 25 10 19 23Other machinery 13 7 0 24 6 19 11Other manufactures 5 3 6 28 14 18 17Source: Global Trade Analysis Project dataset, version 3, 1996.
Table 10: US Tariffs, 1823-1988.1823 1829 1842 1857 1867 1891 1908 1914 1923 1931 1935
% total imports 43.4 50.8 25.3 16.3 44.3 22.9 20.1 14.9 14.1 19% dutiable imports 45.8 54.4 31.9 20.6 46.7 48.9 41.3 37.6 37.7 55.3Source: Bairoch (1993) Tab. 3.1.
Figure : US Tari�s
Francesco Franco Global Environment 25/36

GlobalisationTrade Barriers: Gatt Rounds
Figure : Uruguay round
Francesco Franco Global Environment 26/36

GlobalisationTrade Flows
15
open; about as open as the most liberal European nations were in the 1870s. The table also shows that theworld’s remaining protection (at least the easily quantified forms of protection) is limited to two basic twocategories, industrial goods in developing nationsand agricultural goods in developed nations.
Table 10 provide a long-term view of the US’stariff policies. These plainly show how the UnitedStates’ free trade stance is a very recent event byhistorical standards (apart from short-lived burstsof liberalism in the 1850s and the 1920s. Thefigures also clearly show the inter-war rise inprotection in the US.
4.1.2 Trade Flows Trade-to-GDP Ratios
Table 11 shows the ratios of total trade(imports plus exports) to GDP for 11 developednations in 1870, 1910, 1950 and 1995 (actualdates for the first three columns vary slightlyamong nations according to data availability). Thefirst two columns show that most nations experienced increased openness during the first wave ofglobalisation. The increases for Japan, Sweden and Denmark were quite spectacular, while those of othernations were more mild. The UK and Germany, for instance, had already done most of their opening up by1860. Shares for the US, Australia and Canada actually fell during this period. A part of this stems fromrelative price changes between their exports (mainly primary goods, especially wheat) and domesticproduction but a large part is dueto the fact that they neversubstantially liberalised theirtariffs. These nations wereprofoundly changed by the firstwave of globalisation but forthem, international flows ofpeople, capital and technologywere far more important thantrade (more on this below).
All countries apart fromCanada saw their openness ratiosdrop significantly between 1910and 1950. Moreover, all of them,except Japan, have regained orsurpassed their earlier levels oftrade. Thus at this level ofaggregation there is very littlenew about the 2nd wave of globalisation at a superficial level. However, as Lindbeck (1973) noted, thedenominators in the 19th century consisted primarily of private economic activity. In modern times,however, governments account for between 30% and 50% of GDP, so the fraction of private economicactivity exposed to international competition is now much greater than it was in the Victorian-eraglobalisation wave.
Figure 5 presents a more detailed time series for the US and the UK. The figure shows that the US isstill no more open than the UK was in 1850. It also shows that the UK’s burst of openness preceded thefirst wave of globalisation and that the US bucked the openness trend, becoming progressively more closedduring the 1870-1910 period. Since WWII, however, the US has opened up remarkably. This may helpexplain why the ‘globalisation is unprecedented’ school-of-thought is so strong in the US.
Figure 5: US and UK Openness Ratios, 1797-Present.Total Trade to GNP ratio, 1797 to 1995, US and UK,%
0
10
20
30
40
50
60
1797
1810
1821
1833
1843
1854
1866
1877
1888
1899
1910
1920
1931
1941
1951
1962
1975
1988
UKUS
Source: Bairoch (1989).
Table 11: Total Trade to GDP, 1870, 1910, 1950and 1995, Various Developed Nations. (%)
c.1870 c.1910 c.1950 1995UK 41 44 30 57France 33 35 23 43Germany 37 38 27 46Italy 21 28 21 49Denmark 52 69 53 64Norway 56 69 77 71Sweden 28 40 30 77USA 14 11 9 24Canada 30 30 37 71Australia 40 39 37 40Japan 10 30 19 17Notes: Exact dates vary, see Kuznets (1967).
Figure : Volumes
Francesco Franco Global Environment 27/36
GlobalisationComposition of trade
Composition of merchandise tradehttp://www.wto.org/english/res_e/statis_e/world_commodity_profiles10_e.pdfComposition of trade in merchandisehttp://www.wto.org/english/res_e/statis_e/its2011_e/its11_world_maps_merchandise_e.pdf
Francesco Franco Global Environment 28/36

GlobalisationServices
Composition of trade in serviceshttp://www.wto.org/english/res_e/statis_e/its2011_e/its11_world_maps_serv_e.pdf
Francesco Franco Global Environment 29/36

Globalisation2010
Snapshot 2010 of tradehttp://www.wto.org/english/res_e/statis_e/its2011_e/its11_highlights1_e.pdf
Francesco Franco Global Environment 30/36
GlobalisationFDI
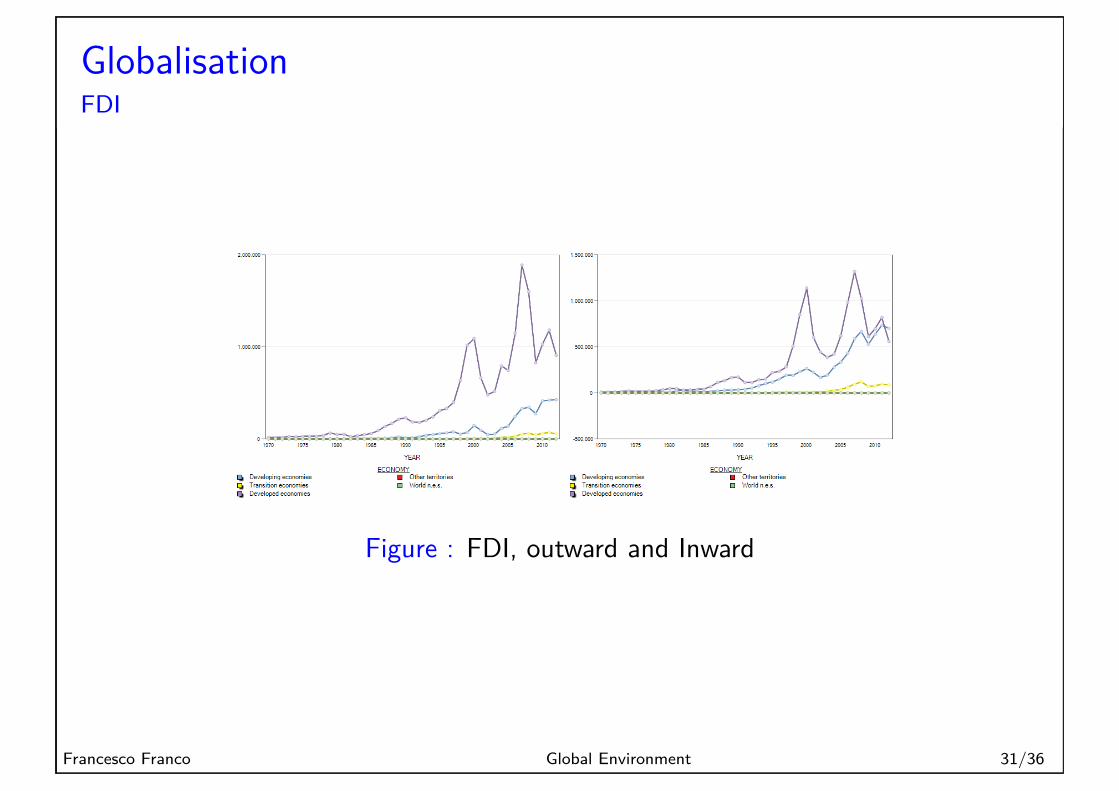
Figure : FDI, outward and Inward
Francesco Franco Global Environment 31/36
GlobalisationMigration
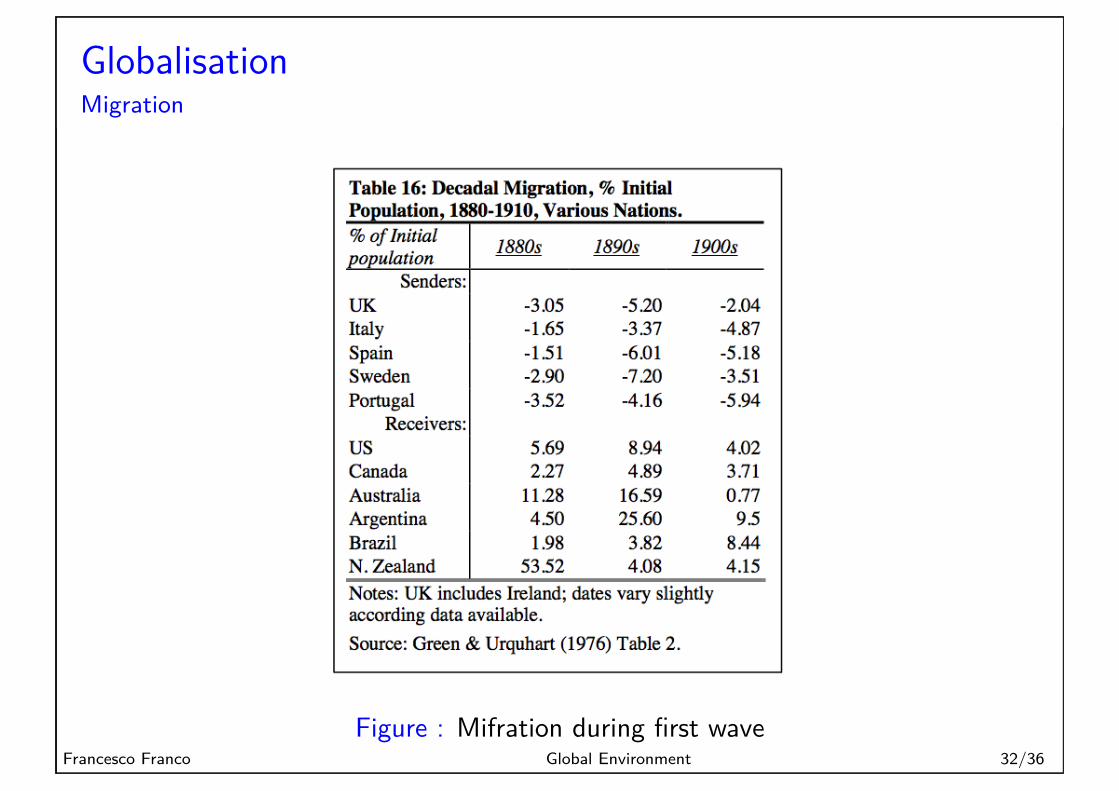
Figure : Mifration during first waveFrancesco Franco Global Environment 32/36

The futurewhere do we go? growth prospects
GDP per capita Y /N is equal to labor productivity Y /H per H/Nhours per capita
YN =
YH
HN
andHN =
HE
EL
LN
hours per capita is equal to hours per employed times employmentrate times participation rate.
Francesco Franco Global Environment 33/36

The futureheadwinds
1 Demography2 Education3 Inequality4 Repaying Debt
Francesco Franco Global Environment 34/36

The futurefuture growth?
Figure : gloomy
Francesco Franco Global Environment 35/36

Readings
**Ferguson Niall. Civilization. The West and the rest. PenguinBooks 2011.*Richard E. Baldwin, Philippe Martin. Two Waves ofGlobalisation: Superficial Similarities, Fundamental Di�erencesNBER Working Paper No. 6904 Issued in January 1999The Demise of U.S. Economic Growth: Restatement,Rebuttal, and Reflections Robert J. Gordon NBER WorkingPaper No. 19895 Issued in February 2014.
Francesco Franco Global Environment 36/36