global industry analysis and the quest for comparability philadelphia, pa december 2, 2003 andrew b....
TRANSCRIPT

GLOBAL INDUSTRY ANALYSIS AND THE
QUEST FOR COMPARABILITY
Philadelphia, PADecember 2, 2003
Andrew B. Williams, CFA PresidentPhiladelphia International Advisors, LP

2
Total Return Analysis - MSCI EAFE Value Versus MSCI EAFE
(December 31, 1974 through September 30, 2003)
Since 1974, a valuation based approach has provided alpha in international markets
Cumulative Total Return
(December 1974=$100)
$4,450
$2,599
$1,413
$0
$1,000
$2,000
$3,000
$4,000
$5,000
$6,000
74 76 78 80 82 84 86 88 90 92 94 96 98 00 02
MSCI EAFE Value MSCI EAFE MSCI EAFE Growth
Historical 12-Month Returns
MSCIEAFEValue
MSCIEAFE
MSCIEAFE
GrowthAnnualized Return 14.1% 12.0% 9.6%Maximum Return 109.1% 103.7% 100.2%Minimum Return -24.2% -28.3% -37.9%
Standard Deviation 22.4% 22.5% 23.3%Negative Return Frequency 24.0% 26.9% 29.9%Average Negative Return -9.1% -10.6% -12.7%
Avg Return/St Dev 0.63 0.53 0.41

3
Historically, international value stocks have outperformed growth stocks 73% of the time.
Relative 12-Month Total Returns(December 31, 1975 through September 30, 2003)
Sources: FactSet, MSCI EAFE (based on monthly US dollar equivalent returns), and PIA Investment Research
4.0%
4.3%
-40%
-30%
-20%
-10%
0%
10%
20%
30%
40%
19751977197919811983198519871989199119931995199719992001
Rela
tive
12
-Mon
th R
etu
rn
25/75 Percentiles10/90 Percentiles5/95 Percentiles
Median
Historical International Value versus Growth Analysis

4
International Equity ResearchStandard Analysis Options
Restate all figures to some comparable basis - US GAPP or local GAAP
Focus on cash flow and create DCF based valuation comparisons
Analyze valuations locally, ignoring the differences between countries

5

6
Non-synchronized economies
Capital market disparities - inflation, interest rates, valuation, tax
Accounting standards - earnings and balance sheet distortions
– Goodwill/acquisition accounting– Depreciation - term and rates vary– Inventory valuation - LIFO/FIFO– Forex gains/losses– R&D treatment– Asset revaluation– Pension liability disclosure– Special expenses & revenue
Non-uniform disclosure (annuals vs interim's)
It’s a big job - EAFE has 1000 companies and MSCI All World ex US has 1700!
Alternative #1
Global Sector Equity Analysis

7
Alternative #2
DCF-Based Approach
Where: FCF Yr1: Free cash flow year 1, etc. R: WACC TY: Terminal year of forecasting period G: Free cash flow growth rate in perpetuity
Advantages:
Conceptually accurate
Eliminates accounting issues: Free cash flow is free cash flow
Firm Value = FCF Yr1 + FCF Yr2 + FCF Yr3…..(FCF TY+1)/(R - G) (1+R)^1 (1+R)^2 (1+R)^3 (1+R)^TY
8
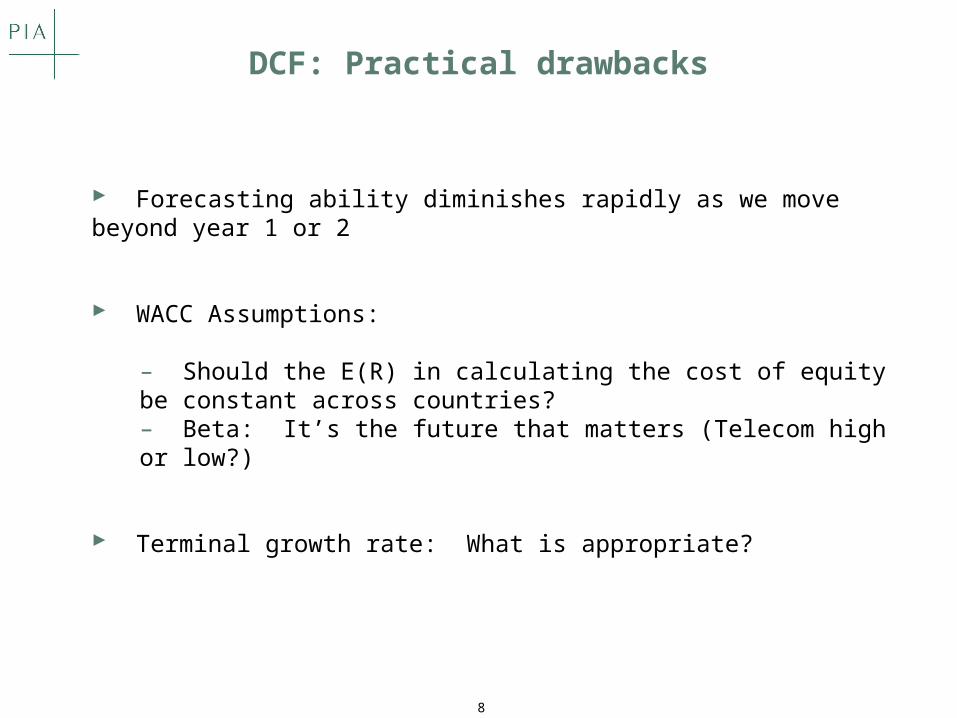
DCF: Practical drawbacks
Forecasting ability diminishes rapidly as we move beyond year 1 or 2
WACC Assumptions:
– Should the E(R) in calculating the cost of equity be constant across countries?– Beta: It’s the future that matters (Telecom high or low?)
Terminal growth rate: What is appropriate?
9
Alternative #3
Control variables utilizing country based analysis
Identify attractive stocks within markets
Allocate portfolio between countries

10
Top Quintile Versus Average Stock Performance
Monthly Returns From September 1991 through September 2003
MSCI EAFE
AverageExc/Def Return/Return St Dev Risk
Dividend Yield 0.73 2.43 0.30Price to Earnings 0.63 2.70 0.23Price to Book Value 0.66 3.22 0.21Price to Cash Flow 0.65 2.43 0.27Price to Sales 0.40 2.25 0.18
EV/EBITDA 0.46 2.07 0.22EAFE Equal Weighted 0.82 2.41 0.34
Sources: PIA Investment Research and FactSet (Alphatesting with MSCI EAFE constituents)
Within EAFE, all valuation metrics have identified investment opportunities

11
Valuation Factor Performance
Top Quintile* Versus Average Stock
1992 through September 2003 YTD
1992 1993 1994 1995 1996 1997 1998 1999 2000 2001 2002 2003ytd
Highest P/E P/B P/B P/E Div Yld EV/EBITDA P/S EAFE P/E Div Yld Multifactor P/B
0.2% 73.0% 20.3% 20.7% 27.2% 6.7% 26.8% 27.3% 13.7% 8.8% 11.6% 57.2%
Div Yld P/E P/S Div Yld P/E Multifactor P/CF Div Yld Div Yld Multifactor P/E P/S
-1.1% 66.4% 20.0% 18.8% 27.0% 4.3% 23.8% 21.5% 13.2% 2.4% 10.0% 52.6%
EV/EBITDA Div Yld P/CF P/CF Multifactor EAFE EAFE P/B Multifactor P/E Div Yld Multifactor
-1.3% 59.0% 13.7% 15.6% 22.9% 2.1% 20.3% 21.1% 12.7% -2.4% 8.9% 46.2%
Multifactor P/CF Multifactor Multifactor EV/EBITDA P/CF P/B Multifactor P/CF P/B P/CF P/CF
-4.0% 58.2% 13.6% 15.5% 20.9% -1.8% 18.0% 21.1% 11.0% -3.2% 6.3% 46.1%
P/B P/S EV/EBITDA P/B P/B Div Yld Avg Stock P/CF P/B EV/EBITDA EV/EBITDA P/E
-5.1% 57.7% 12.6% 14.7% 16.3% -2.3% 15.2% 19.1% 11.0% -3.5% 4.9% 39.2%
Avg Stock Multifactor Avg Stock EAFE P/CF P/E Multifactor P/E P/S P/CF P/B EV/EBITDA
-6.2% 57.3% 10.4% 11.6% 16.2% -12.5% 15.0% 18.7% 6.9% -6.7% 2.3% 37.7%
P/S Avg Stock EAFE EV/EBITDA P/S P/S EV/EBITDA Avg Stock EV/EBITDA P/S P/S Div Yld
-9.4% 50.4% 8.1% 10.3% 9.0% -14.9% 13.9% 18.7% 1.9% -7.0% -4.2% 36.6%
P/CF EV/EBITDA P/E Avg Stock Avg Stock Avg Stock Div Yld EV/EBITDA Avg Stock Avg Stock Avg Stock Avg Stock
-10.4% 45.2% 6.6% 9.5% 9.0% -15.3% 10.7% 16.2% -2.8% -14.0% -9.2% 34.8%
EAFE EAFE Div Yld P/S EAFE P/B P/E P/S EAFE EAFE EAFE EAFE
Lowest -11.8% 32.9% 2.9% 8.0% 6.4% -25.0% 1.6% 15.0% -14.0% -21.2% -15.7% 18.8%
*Top Quintile returns are based on the equally-weighted total returns of the most attractively ranked stocks (top 20%) for each factor within a given year.
Source: FactSet (Alphatesting - MSCI EAFE Universe, monthly rebalancing, no transaction costs assumed)
Some value factors don’t work every yearMultifactor valuation models smooth out performance over time

12
Valuation Based Approach Effective in Individual Markets
Historical12-Month Returns Value Growth Difference Value Growth Difference Value Growth Difference Value Growth Difference Value Growth Difference
Average 13.6% 12.1% 1.5% 16.8% 14.3% 2.6% 11.4% 7.9% 3.5% 12.6% 6.1% 6.5% 10.6% 6.4% 4.2%
Maximum 57.8% 62.5% -4.6% 122.7% 112.9% 9.8% 163.1% 173.3% -10.1% 150.5% 151.5% -1.1% 108.4% 150.4% -42.0%Minimum -19.1% -41.2% 22.1% -31.0% -35.9% 5.0% -28.1% -52.6% 24.5% -37.4% -47.8% 10.5% -35.2% -75.7% 40.6%
Standard Deviation 13.9% 19.1% -5.1% 22.5% 21.4% 1.1% 27.1% 31.8% -4.7% 31.8% 34.7% -2.9% 20.5% 31.7% -11.3%Negative Frequency 13.4% 19.2% -5.8% 21.7% 20.8% 1.0% 28.8% 35.9% -7.1% 31.0% 43.9% -12.9% 28.8% 34.4% -5.5%Average Negative -5.9% -13.7% 7.8% -8.2% -11.1% 3.0% -11.3% -14.6% 3.4% -15.1% -17.2% 2.1% -10.3% -16.4% 6.1%
Avg Return/ St Dev 0.98 0.64 0.34 0.75 0.67 0.08 0.42 0.25 0.17 0.40 0.18 0.22 0.52 0.20 0.32
Sources: Glenmede/ PIA Investment Research, based on monthly returns (US dollar equivalent) per FactSet and MSCI Value and Growth Indices
United States CanadaJapanGermanyUnited Kingdom
13.6%12.1%
Value Growth
16.8%
14.3%
Value Growth
11.4%
7.9%
Value Growth
12.6%
6.1%
Value Growth
10.6%
6.4%
Value Growth
1975 to 2002

13
Sources: PIA Investment Research and FactSet (Alphatesting with MSCI EAFE constituents)
Top Quintile Versus Average Stock PerformanceMonthly Returns From September 1991 through September 2003
JapanUnited Kingdom
AverageExc/Def Return/Return St Dev Risk
AverageExc/DefReturn St Dev
Return/Risk
Dividend Yield 0.71 2.98 0.24 Dividend Yield 0.52 2.50 0.21Price to Earnings 1.08 2.66 0.41 Price to Earnings 0.51 2.18 0.23Price to Book Value 0.42 2.79 0.15 Price to Book Value 0.73 3.23 0.23Price to Cash Flow 0.88 2.84 0.31 Price to Cash Flow 0.65 2.25 0.29Price to Sales 0.49 3.36 0.15 Price to Sales 0.32 3.39 0.10
EV/EBITDA 0.65 2.51 0.26 EV/EBITDA 0.41 2.31 0.18UK Equal Weighted 0.95 2.67 0.36 Japan Equal Weighted 0.74 2.25 0.33
Germany France
Average AverageExc/Def Return/ Exc/Def Return/Return St Dev Risk Return St Dev Risk
Dividend Yield 0.94 3.04 0.31 Dividend Yield 0.32 3.00 0.11Price to Earnings 0.57 3.47 0.17 Price to Earnings 0.36 2.62 0.14Price to Book Value 0.63 4.09 0.15 Price to Book Value 0.66 4.17 0.16Price to Cash Flow 0.34 3.76 0.09 Price to Cash Flow 0.48 3.23 0.15Price to Sales 0.40 3.99 0.10 Price to Sales 0.75 3.79 0.20
EV/EBITDA -0.04 3.66 -0.01 EV/EBITDA 0.15 2.83 0.05Germany Equal Weighted0.55 3.59 0.15 France Equal Weighted0.61 3.21 0.19
Valuation factor efficacy varies across markets

14
Cash Flow/Price RatioHistorical Factor Analysis
Alternative Holding Period Returns September 1991 to September 2003
Information RatioAverage Excess/(Deficit) Return Positive Frequency
Highest Quintile versus Average
12.57%
16.91%
.65%1.87%
3.46%
6.65%
%
2%
4%
6%
8%
10%
12%
14%
16%
18%
1-M 3-M 6-M 12-M 24-M 36-M
Exc
ess/
(Def
icit
) R
etu
rn
Highest Quintile versus Average
0.0
0.1
0.2
0.3
0.4
0.5
0.6
0.7
0.8
0.9
1.0
1-M 3-M 6-M 12-M 24-M 36-M
Info
rmat
ion
Rat
io
Highest Quintile versus Average
84% 85%
75%71%69%
64%
%
10%
20%
30%
40%
50%
60%
70%
80%
90%
100%
1-M 3-M 6-M 12-M 24-M 36-M
Pos
itiv
e F
req
uen
cy
Data Source: FactSet
Information RatioAverage Excess/(Deficit) Return Positive Frequency
Lowest Quintile versus Average
(.51)%(1.47)%
(2.90)%
(5.63)%
(15.15)%
(11.70)%
-16.0%
-14.0%
-12.0%
-10.0%
-8.0%
-6.0%
-4.0%
-2.0%
.0%
1-M 3-M 6-M 12-M 24-M 36-M
Exc
ess/
(Def
icit
) R
etu
rn
Lowest Quintile versus Average
(0.23)
(0.35)(0.47)
(0.63)
(1.05)(1.00)
(1.2)
(1.0)
(0.8)
(0.6)
(0.4)
(0.2)
0.0
1-M 3-M 6-M 12-M 24-M 36-M
Info
rmat
ion
Rat
io
Lowest Quintile versus Average
40%34% 31%
22%
12% 15%
%
10%
20%
30%
40%
50%
60%
70%
80%
90%
100%
1-M 3-M 6-M 12-M 24-M 36-MP
osit
ive
Fre
que
ncy
Like good wines, value factor returns improve with age

15
January 1979 - December 2002
Data Source: FactSet and MSCI
Average 12-Month Return and Standard Deviation
8%
9%
10%
11%
12%
13%
14%
15%
16%
17%
10% 15% 20% 25% 30%
Standard Deviation
Ave
rag
e 1
2-M
on
th R
etu
rn
Average Excess Return and Information Ratio
-1%
0%
1%
2%
3%
4%
5%
6%
7%
(0.2) (0.1) 0.0 0.1 0.2 0.3 0.4 0.5
Information RatioA
vera
ge E
xcess
Retu
rn
Maximize IR
Equal-Weight
MSCI EAFE
P/E
P/CE
P/B
Yield
Rel P/E
Rel P/CE
Rel P/B
Rel Yield
Inexpensively Valued Markets Outperform

16

17
Alternative #3A“Belt and Suspenders”
Utilize country rankings
Evaluate equities within a regional sector basis
Blend inputs from country/sector analysis
Check behind the numbers

18
*Based on International Stocks of over $1 Billion Market Capitalization (US$ as of October 2003) in the MSCI EAFE Index
MSCI EAFE Large Cap Stocks*Average R-Squared for Country, Sectors and Macro
International Stock Prices continue to reflect Higher Correlations to Country Factors!
(Rolling 30-Month Stock Price Changes)
Sources: Philadelphia International Advisors with monthly stock prices from FactSet.
16.0%
6.7%
22.6%
0%
10%
20%
30%
40%
50%
10/034/0310/024/0210/014/0110/004/0010/994/9910/984/9810/974/9710/96R-S
qu
are
d (
Roll
ing
30
-Mon
th)
Country Sector Macro
Country Versus Sector Correlation Analysis

19
MSCI EAFE Large Cap Stocks*Average R-Squared for Country and Economic Sectors
(Rolling 30-Month Stock Price Changes)
Country Versus Sector Correlation Analysis
*Based on International Stocks of over $1 Billion Market Capitalization (US$ as of October 2003) in the MSCI EAFE Index
United Kingdom Germany
Japan Ireland
Sources: Philadelphia International Advisors with monthly stock prices from FactSet.
6.0%7.0%
0%
10%
20%
10/0310/0210/0110/0010/9910/9810/9710/96
R-S
qu
are
d (
Roll
ing
30
-Mon
th)
Country Sector
19.0%
7.0%
0%
10%
20%
30%
10/0310/0210/0110/0010/9910/9810/9710/96
R-S
qu
are
d (
Roll
ing
30
-Mon
th)
Country Sector
14.7%
10.7%
0%
10%
20%
30%
10/0310/0210/0110/0010/9910/9810/9710/96
R-S
qu
are
d (
Roll
ing
30
-Mon
th)
Country Sector
12.6%
2.8%0%
10%
20%
30%
10/0310/0210/0110/0010/9910/9810/9710/96
R-S
qu
are
d (
Roll
ing
30
-Mon
th)
Country Sector

20
Country Versus Sector Correlation Analysis
MSCI EAFE Large Cap Stocks*Average R-Squared for Country and Economic Sectors
(Rolling 30-Month Stock Price Changes)
*Based on International Stocks of over $1 Billion Market Capitalization (US$ as of October 2003) in the MSCI EAFE Index
Consumer Staples Industrials
Sources: Philadelphia International Advisors with monthly stock prices from FactSet.
Energy Technology
8.9%
24.0%
0%
10%
20%
30%
10/0310/0210/0110/0010/9910/9810/9710/96
R-S
qu
are
d (
Roll
ing
30
-Mon
th)
Country Sector
17.7%
2.1%0%
10%
20%
30%
10/0310/0210/0110/0010/9910/9810/9710/96
R-S
qu
are
d (
Roll
ing
30
-Mon
th)
Country Sector
17.6%
13.3%
0%
10%
20%
30%
10/0310/0210/0110/0010/9910/9810/9710/96
R-S
qu
are
d (
Roll
ing
30
-Mon
th)
Country Sector
10.8%
23.2%
0%
10%
20%
30%
10/0310/0210/0110/0010/9910/9810/9710/96
R-S
qu
are
d (
Roll
ing
30
-Mon
th)
Country Sector

21
Japanese Sector - Selected Valuation FactorsTop Quintile Versus Average Stock Performance
Monthly Returns From August 1996 through September 2003
Average AverageExc/Def Return/ Exc/Def Return/Return St Dev Risk Return St Dev Risk
Price to Earnings 0.67 3.67 0.18 Price to Earnings 0.83 3.45 0.24Price to Book 0.55 3.36 0.16 Price to Book 0.87 5.03 0.17
Price to Cash Flow 0.80 3.62 0.22 Price to Cash Flow 0.92 4.23 0.22Dividend Yield 0.30 3.54 0.09 Dividend Yield 1.02 4.28 0.24EV to EBITDA 0.69 3.19 0.22 EV to EBITDA 0.23 3.57 0.06
Price to Sales 0.26 4.51 0.06 Price to Sales 0.70 4.73 0.15
Equal Weighted Mix 1.10 2.89 0.38 Equal Weighted Mix 1.14 3.43 0.33
Average AverageExc/Def Return/ Exc/Def Return/Return St Dev Risk Return St Dev Risk
Price to Earnings 0.48 3.58 0.13 Price to Earnings 0.90 4.38 0.21Price to Book 0.71 4.59 0.15 Price to Book 0.59 3.91 0.15
Price to Cash Flow 1.10 2.65 0.42 Price to Cash Flow 0.28 5.99 0.05Dividend Yield 0.68 4.02 0.17 Dividend Yield 1.28 4.13 0.31EV to EBITDA 0.17 2.95 0.06 EV to EBITDA 0.47 3.62 0.13
Price to Sales 0.28 5.77 0.05 Price to Sales 0.12 6.06 0.02Equal Weighted Mix 0.98 3.02 0.32 Equal Weighted Mix 0.84 3.76 0.22
Sources: PIA Investment Research and FactSet (Alphatesting with MSCI EAFE constituents)
Discretionary Sector Materials Sector
Industrials Sector Staples Sector

22
Average AverageExc/Def Return/ Exc/Def Return/Return St Dev Risk Return St Dev Risk
Price to Earnings 1.10 3.62 0.30 Price to Earnings 0.89 2.44 0.36Price to Book 0.72 3.20 0.23 Price to Book 1.03 3.38 0.30
Price to Cash Flow 0.85 3.25 0.26 Price to Cash Flow 0.64 2.76 0.23
Dividend Yield 0.88 3.16 0.28 Dividend Yield 0.91 2.99 0.30EV to EBITDA 0.76 3.44 0.22 EV to EBITDA 0.44 2.43 0.18
Price to Sales 0.72 3.62 0.20 Price to Sales 1.00 3.26 0.31
Equal Weighted Mix 1.00 3.17 0.32 Equal Weighted Mix 1.08 2.63 0.41
Average AverageExc/Def Return/ Exc/Def Return/Return St Dev Risk Return St Dev Risk
Price to Earnings 1.04 2.57 0.41 Price to Earnings 0.77 3.41 0.23Price to Book 0.54 2.89 0.19 Price to Book 0.41 3.49 0.12
Price to Cash Flow 0.29 3.36 0.09 Price to Cash Flow 0.86 4.52 0.19Dividend Yield 0.90 2.78 0.32 Dividend Yield 1.32 2.51 0.52EV to EBITDA 0.54 2.35 0.23 EV to EBITDA 0.30 3.39 0.09
Price to Sales 0.12 3.36 0.04 Price to Sales 0.23 3.75 0.06
Equal Weighted Mix 0.99 2.89 0.34 Equal Weighted Mix 0.78 3.64 0.21
Sources: PIA Investment Research and FactSet (Alphatesting with MSCI EAFE constituents)
Industrials Sector Staples Sector
Monthly Returns From August 1996 through September 2003
Discretionary Sector Materials Sector
European Sector - Selected Valuation FactorsTop Quintile Versus Average Stock Performance

23
Country Versus Sector Correlation Analysis
October 2003
SectorMaterials
Consumer DiscretionaryConsumer StaplesIndustrialsTechnologyEnergyFinancialsHealth CareCommunicationsUtilities
*Based on International Stocks of over $1 Billion Market Capitalization (US$ as of October 2003) in the MSCI EAFE Index
Source: PIA Investment Research (Based on rolling 30-month sector and country r-squareds from monthly stock prices from FactSet)
CountrySector CountrySector CountrySector CountrySector
51% 49% 72% 28% 69% 31% 77% 23% 70% 30% 85% 15% 84% 16% 88% 12% 20% 80% 38% 62% 35% 65% 44% 56% 74% 26% 88% 12% 86% 14% 90% 10% 31% 69% 52% 48% 49% 51% 59% 41% 20% 80% 39% 61% 36% 64% 45% 55% 67% 33% 83% 17% 81% 19% 86% 14% 38% 62% 61% 39% 58% 42% 67% 33% 19% 81% 37% 63% 34% 66% 43% 57% 16% 84% 32% 68% 29% 71% 37% 63%
United Kingdom Germany Spain Japan

24

25
P/E Calculated on Stated Earnings
#1
#2
#3
Heineken Interbrew Asahi
Net Sales 9011 6992 1375267Cost of Goods Sold * 4196 3403 956827Depreciation & Amortization 486 5.4% 641 9.2% 51545 3.7%Gross Profit 4329 2948 366895SG & A 3047 2171 297551Operating Profit 1282 777 69344Interest Expense-Net 146 147 4172Extraordinary Charges 0 -96 -25072non-Operating Inc/ Exp 85 131 7614Pre-Tax Income 1221 665 32486Tax 364 162 21197Minority Interest 62 36 3468Other Income 0 0 0Net Income 795 467 14757
EPS 2.03 1.08 28.91
Trailing 2002 P/ E, excluding special charges 15.5x 16.1x 12.0x
Interbrew looks relatively expensive - but what about depreciation?

26
P/E Calculated on Adjusted Earnings
Heineken Interbrew Asahi
Net Sales 9011 6992 1375267Cost of Goods Sold * 4196 3403 956827Depreciation & Amortization 486 5.4% 377 5.4% 74264 5.4%Gross Profit 4329 3212 344176SG & A 3047 2171 297551Operating Profit 1282 1041 46625Interest Expense-Net 146 147 4172Extraordinary Charges 0 -96 -25072non-Operating Inc/ Exp 85 131 7614Pre-Tax Income 1221 1025 9767Tax 364 30% 275 27% 3613 37%Minority Interest 62 36 3468Other Income 0 0 0Net Income 795 714 9622
EPS 2.03 1.66 18.87
Trailing 2002 P/ E, excluding special charges 15.5x 12.7x 18.8x#3
#2
#1
Interbrew is cheapest after adjustments

27
Coming soon…….IASInternational Accounting Standards Board
Mandates convergence of various standards closer to U.S. GAAP, but differences will remain.
Investor friendly reforms will facilitate global sector analysis and company comparisons.
European Union adoption 1/1/05.
Accounting Standards Board of Japan (ASBJ) has not agreed to converge.
To state compliance with IAS standards, a company must comply with all provisions.

28
Summary
Fundamental valuation analysis can exploit pricing inefficiencies in international stocks
Multi factor approach raises return, lowers risk
Country and sector based approaches are both effective
Effectiveness of country and sector models varies across regions and sectors
Further “hands-on” analysis can add insight beyond database
IAS will facilitate cross border analysis, but issues remain

29