global markets institute the power of the purse: gender ... · pdf filethe power of the purse:...
TRANSCRIPT

August 5, 2009 Global Markets Institute
Goldman Sachs Global Investment Research 1
August 5, 2009
Global Markets Institute
The Power of the Purse: Gender Equality and Middle-Class Spending
Gender equality is improving In the BRICs and N-11 countries, gender gaps in education, employment,
health and political representation are narrowing. At the same time, laws
and social norms that have discriminated against women are shifting in
some countries. Together, these factors are giving women greater
influence and decision-making power within households and markets.
Women’s spending priorities are differentWomen’s spending priorities differ from men’s, with women notably more
likely to buy goods and services that improve the family’s welfare. Thus, as
women gain decision-making power, household spending patterns are
likely to shift. Household savings rates are also likely to rise. Sectors likely
to benefit from women’s expanding buying power include food,
healthcare, education, childcare, apparel, consumer durables and financial
services. Our equity research analysts identify a list of companies with
exposure to these global opportunities.
Identifying the “sweet spot”: gender equality meets the global middle class Improving gender equality coincides with the rapid growth of the “global
middle class” (those with annual incomes between $6,000 and $30,000 in
PPP terms). From about 1.7 billion people today, this middle class is
expected to reach approximately 3.6 billion by 2030, of whom about 85%
will live in the BRICs and N-11 countries.
Over the next five years, the combined impact of growing gender equality
and the emerging middle class will be seen most clearly in China and
Russia, and to a lesser extent in Vietnam, Mexico, Brazil and Indonesia. In
the subsequent decade (2015-2025), these dynamics are likely to remain
strong in Mexico and Russia, and to continue to strengthen in China,
Indonesia, Vietnam, India and Philippines. India’s middle class will see
rapid growth off a very low base, but the shifts in spending that we outline
are likely to remain constrained by women’s relatively low status, at least
for the next 10-15 years.
Income and equality: a virtuous circle Spending driven by women should support the development of human
capital, which will fuel economic growth in the years ahead. At the same
time, economic growth should continue to bolster gender equality.
Sandra Lawson
(212) 902-6821 | [email protected] Goldman, Sachs & Co.
Douglas B. Gilman
(212) 902-3132 | [email protected] Goldman, Sachs & Co.
The Global Markets Institute is the public policy research unit of Goldman Sachs Global Investment Research. Its mission is to provide research and high-level advisory services to policymakers, regulators and investors around the world. The Institute leverages the expertise of Research and other Goldman Sachs professionals, as well as highly-regarded thought leaders outside the firm, to offer written analyses and host discussion forums.
The Goldman Sachs Group, Inc. Global Investment Research

August 5, 2009 Global Markets Institute
Goldman Sachs Global Investment Research 2
Table of contents
Introduction 3
Gender inequality persists, but women’s roles are changing 4
Women are gaining bargaining power 10
What will women buy? 14
The global middle class: countries to watch 16
Gender and income: the “sweet spot” for shifts in spending 19
The virtuous circle: gender equality and economic growth 21
Selected bibliography 23
Disclosures 24
Thanks to Dominic Wilson, Raluca Dragusanu, and Alex Kelston.

August 5, 2009 Global Markets Institute
Goldman Sachs Global Investment Research 3
Introduction
In our earlier work on women,1 we described the Chinese proverb that “women hold up
half the sky” as more aspiration than fact in much of the world. Yet, although gender
inequality persists in developed and developing countries alike, women in the BRICs and
N-11 countries2 have made significant gains over the past two decades in education, health,
employment and political representation.
Growing gender equality has important economic implications. In our previous work, we
focused on the macroeconomic impact of women’s education, assessing its contribution to
economic growth and demographic change. In this new paper, we look both more broadly,
across a range of indicators of women’s status, and more narrowly, focusing on the
impact of gender equality and women’s increased bargaining power on household
spending.
We find that, as women gain more household bargaining power and influence over
savings and spending decisions:
• Household spending patterns change, with purchases increasingly directed toward the
health, education and welfare of the household. This spending bolsters the
development of human capital, which fuels economic growth in the years ahead.
• Household savings rates generally rise, augmenting the savings available to finance
future growth.
Growing gender equality and the shift in household spending power towards women
coincide with a period of rising incomes and rapid growth of the global middle class – what
Goldman Sachs economists have deemed “the expanding middle”. Putting these two
developments together suggests that households are likely not only to spend more, but
will also spend differently.
• Over the next five years, we expect to see the impact of rising incomes and improving
gender equality play out most clearly in China and Russia, and to a lesser extent in
Vietnam, Mexico, Brazil and Indonesia.
• In the subsequent decade (2015-2025), these dynamics should remain strong in Mexico
and Russia, continue to strengthen in China, Indonesia and Vietnam, and develop in
Philippines and India.
• Beyond 2025, India will be the most interesting country to watch; we anticipate that
nearly 90% of India’s population will be “middle class” by 2040. During this time, the
women’s spending dynamic will also remain strong in Indonesia and Vietnam, where
will the middle class share will peak above 80% around 2040.
Middle-class women are likely to spend their household funds on goods and services
that improve the welfare of the household, including food, education, healthcare,
financial products and services, apparel, consumer durables and childcare. Goldman
Sachs equity research analysts have identified a number of companies with exposure to
the simultaneous rise in gender equality and growth of the global middle class (listed in
Exhibit 11 on page 15).
1 Sandra Lawson, “Women Hold Up Half the Sky”, Global Economics Paper 164, March 4, 2008.
2 The BRICs are Brazil, Russia, India and China. The N-11 (“Next-11”) countries are Bangladesh, Egypt,
Indonesia, Iran, (South) Korea, Mexico, Nigeria, Pakistan, Philippines, Turkey and Vietnam.

August 5, 2009 Global Markets Institute
Goldman Sachs Global Investment Research 4
Gender inequality persists, but women’s roles are changing
Improvements in gender equality can be measured along many lines, including education,
employment, income, health, political participation and social norms. Gains in one field
typically fuel gains in others, making gender equality a self-reinforcing phenomenon. This
can be seen, for example, in the fact that countries that have made large gains in girls’
primary and secondary education are the same countries where women’s gains in the
labor force have been most significant. Here, we flag some of the most prominent gains
that women have made over the past two decades.
Education
Among adults, literacy rates for women lag rates for men by as much as 15-30ppt. But
young women (aged 15-24) are notably more literate than adult women, with continued
improvement even over the past decade, as Exhibits 1 and 2 show. As a result, the literacy
gap between younger women and men is almost universally in the single digits.
Exhibit 1: Literacy among young women is notably
higher than among adult women
Exhibit 2: Continued gains in literacy among young
women, even since early 1990s
40
48
54 58
64
81 77
89 91 90 90
58
73 77
82 85
94 96 96 98 99 99
0
20
40
60
80
100
120
Pak
ista
n
Ban
glad
esh
Indi
a
Egy
pt
Nig
eria
Turk
ey Iran
Indo
nesi
a
Mex
ico
Bra
zil
Chi
na
Female literacy (%)
Women ages 15+ Women ages 15-24
38
49
62
67
81
91 88
95
73 77
85 82
96 99
94 98
0
20
40
60
80
100
120B
angl
ades
h
Indi
a
Nig
eria
Egy
pt
Iran
Chi
na
Turk
ey
Mex
ico
Literacy rate, youth (% aged 15-24),
female
1990/1991 2006/2007
Countries are arranged in order of percent improvement.
Data for Egypt are 1996 vs. 2006.
Source: World Bank.
Source: World Bank.
Across many of the BRICs and N-11 countries, girls now fare nearly as well as boys in
primary and secondary school enrollment, with large gains over the past decade,
particularly in Iran, India, Egypt and China. See Exhibit 3. Generally speaking, the
remaining gender gap is smaller in primary and secondary education than at the
university level. Here too, however, women have made dramatic gains since the early
1990s, particularly in China (from roughly twice as many men as women to near parity
today) and Iran (from more than twice as many men to more women than men today).
There has also been substantial narrowing of the gender gap in tertiary education in
Bangladesh, India, Pakistan and Turkey.

August 5, 2009 Global Markets Institute
Goldman Sachs Global Investment Research 5
Exhibit 3: Gender parity is improving in primary and secondary education
93
77 81
87
81
70
85
98
84 90
100
95 91
114
0
20
40
60
80
100
120
140
Indo
nesi
a
Nig
eria
Turk
ey
Chi
na
Egy
pt
Indi
a
Iran
Ratio of female to male enrollment in
primary and secondary education
1991 2006/2007
Countries are arranged in order of percent improvement since 1991, from lowest to highest.
Most recent available year for Egypt is 2004.
Source: World Bank.
Employment
More women are in the labor force in some countries today, though there has been
slippage elsewhere. At one end of the spectrum, labor-force participation rates for women
in China and Vietnam are roughly 70%. At the other end, fewer than 40% of women work in
Iran, India and Nigeria; fewer than 25% of women work in Pakistan, Egypt and Turkey.
Since the early 1990s, change has come in both directions. Participation rates have risen
sharply in Pakistan (from a low of 11% in 1990), Brazil and Iran, and have also climbed in
Mexico, Philippines, Korea and Nigeria, while in other countries (namely Turkey and
Bangladesh), women’s participation has declined substantially. Interestingly, men’s labor-
force participation rates have declined almost across the board since 1990, even in
countries where women’s participation has also fallen. See Exhibit 4.
Women’s employment tends to be clustered in lower-paying and less productive sectors,
including subsistence-level agriculture and unpaid family work. Agriculture remains the
primary source of livelihood for many women. Yet there are signs of change here too:
agriculture accounted for three-quarters of women’s employment in Turkey in 1990 but just
half in 2005, and fell from 85% to under 60% in Bangladesh over roughly the same period.

August 5, 2009 Global Markets Institute
Goldman Sachs Global Investment Research 6
Exhibit 4: Women’s labor-force participation varies widely
34
62
74
60
73
35
50
24
37
47 47
34
22
39
11
24
57
69
57
71
34
50
24
39
49 50
41
32
60
21
0102030405060708090
Turk
ey
Ban
glad
esh
Vie
tnam
Rus
sia
Chi
na
Indi
a
Indo
nesi
a
Egy
pt
Nig
eria
Kor
ea
Phi
lippi
nes
Mex
ico
Iran
Bra
zil
Pak
ista
n
Labor force participation rate,
female (% females ages 15-64)
1990 2007
Countries are arranged in order of percent improvement since 1990, from lowest to highest.
Source: World Bank.
Gender wage gaps. As a whole, women in the BRICs and N-11 earn roughly half of what
men earn (48 cents on the dollar). As in developed countries, the wage gap varies
significantly: women earn 71% of what men in earn in Vietnam, but just 23% in Egypt. See
Exhibit 5.
Exhibit 5: Men out-earn women everywhere, by as much as four-to-one
23¢29¢ 31¢
35¢ 38¢ 39¢ 41¢45¢ 46¢ 46¢
57¢ 60¢ 62¢ 64¢71¢
0
10
20
30
40
50
60
70
80
90
100
Egy
pt
Pak
ista
n
Indi
a
Turk
ey
Iran
Mex
ico
Nig
eria
Indo
nesi
a
Ban
glad
esh
Kore
a
Bra
zil
Phi
lippi
nes
Rus
sia
Chi
na
Vie
tnam
Women's earnings as a share of men's
earnings (¢/$1), 2008
Source: OECD.

August 5, 2009 Global Markets Institute
Goldman Sachs Global Investment Research 7
Health
Women’s life expectancy, the best single indicator of their overall health, has improved
dramatically over the past 20 years. In Bangladesh, Egypt and Indonesia, women born
today can expect to live about 10 years longer than women born in the same country in
1990. See Exhibit 6. Increasingly, women are receiving prenatal care and relying on skilled
medical care during childbirth, as well as benefitting from higher public expenditures on
health and higher numbers of physicians in many countries.
Exhibit 6: Women’s life expectancy has risen in most of the BRICs and N-11 since 1990
49
74 74 70 7060
68 68 60 6676
68 6455
64
4 5 6
66 6
67
78 9
1010
(10)0
102030405060708090
Nig
eria
Rus
sia
Mex
ico
Chi
na
Bra
zil
Pak
ista
n
Turk
ey
Phi
lippi
nes
Indi
a
Iran
Kor
ea
Vie
tnam
Indo
nesi
a
Ban
glad
esh
Egy
pt
Women's life expectancy at birth,
years (1990 vs 2007)
1990 change since 1990 (incremental years)
Countries are arranged in order of improvement since 1990 (in years), from lowest to highest.
Source: World Bank.
In line with growing life expectancy and higher levels of female education, fertility rates
have tumbled, as Exhibit 7 shows. The average number of children born per woman has
declined by nearly 60% since 1990 in the most dramatic case of Iran, and by 30% or more in
many other countries.
Exhibit 7: Fertility rates tumble as the BRICs and N-11 move through the demographic
transition
2.1
2.8
6.7
1.6
4.3
1.9
3.0 3.1
4.3
4.0 4.
3
6.1
3.4 3.6
4.8
1.7 2.
2
5.3
1.3
3.2
1.4
2.2
2.2
2.9
2.7 2.8
3.9
2.1
2.1
2.0
0.0
1.0
2.0
3.0
4.0
5.0
6.0
7.0
8.0
Chi
na
Bra
zil
Nig
eria
Kor
ea
Phi
lippi
nes
Rus
sia
Turk
ey
Indo
nesi
a
Egy
pt
Indi
a
Ban
glad
esh
Pak
ista
n
Mex
ico
Vie
tnam Ira
n
Fertility rate, total (births per woman)
1990 2007
Countries are arranged in order of percent decline since 1990, from lowest to highest.
Source: World Bank.

August 5, 2009 Global Markets Institute
Goldman Sachs Global Investment Research 8
Across a range of indicators, the principal laggards in women’s health are Bangladesh,
Pakistan and Nigeria (where women’s life expectancy has actually fallen since 1990), as
well as Russia, where health has worsened dramatically for both women and (especially)
men since the breakup of the Soviet Union.
Politics
Women are sharply underrepresented in national politics in most countries, not only in
the BRICs and N-11 but also around the world. Yet there has been some significant
progress since the early 1990s. At the high end, 20% or more of parliamentary seats are
now held by women in Vietnam, Mexico, Pakistan, China and Philippines – more than in
the United States and considerably more than in Japan. See Exhibit 8. Women tend to be
better represented at the state or provincial and local levels, where they benefit, in some
cases, from national policies requiring a certain share of local positions to be held by
women. And a handful of countries, including countries that score relatively low on other
indicators of gender equality (among them Bangladesh, India and Pakistan), have elected
female prime ministers or presidents.
Exhibit 8: Women remain under-represented in national parliaments –
despite improvements in the past two decades
4
12
21
2
18
10
5 5
12
10 9
2 12
12
21
3
26
15
9 9
23 23
21
14
9
0
5
10
15
20
25
30
Egy
pt
Indo
nesi
a
Chi
na Iran
Vie
tnam
Ban
glad
esh
Bra
zil
Indi
a
Mex
ico
Pak
ista
n
Phi
lippi
nes
Kor
ea
Turk
ey
Share of women in national parliament
(%)
1990 2008
Countries are arranged in order of percent improvement since 1990, from lowest to highest. Most recent data for Bangladesh are 2007.
Source: World Bank.
Law and customs
Gender equality cannot be measured by a string of statistics alone. Social norms, laws and
institutions can, separately or together, reinforce inequality by limiting women’s options.
Legal obstacles include inheritance laws that favor sons, property rights that fail to protect
women’s ownership, divorce laws that assign assets and/or child custody to the husband,
and formal restrictions on women’s access to credit. Women may also be constrained by
social preferences such as early marriage, dowries and the stigma of divorce, as well as by
informal restrictions on political participation or access to credit.
August 5, 2009 Global Markets Institute
Goldman Sachs Global Investment Research 9
Yet there are a number of encouraging trends on this front:
• Legal obstacles are eroding, as women’s standing improves in areas such as property
and inheritance laws, divorce rights and access to capital. A number of countries have
introduced national legislation to promote gender equality and to prevent domestic
and sexual violence against women. These have included changes to divorce and
inheritance laws and higher minimum ages for marriage.
• Age at first marriage is rising, particularly among more educated women. In India, the
median age at first marriage among young women today is 18, compared to 16 among
women two decades older; in Turkey the median age is 21, against 19 for older
women. Women who delay marriage are more likely to continue their education and,
later, to have more control over the number and spacing of children.
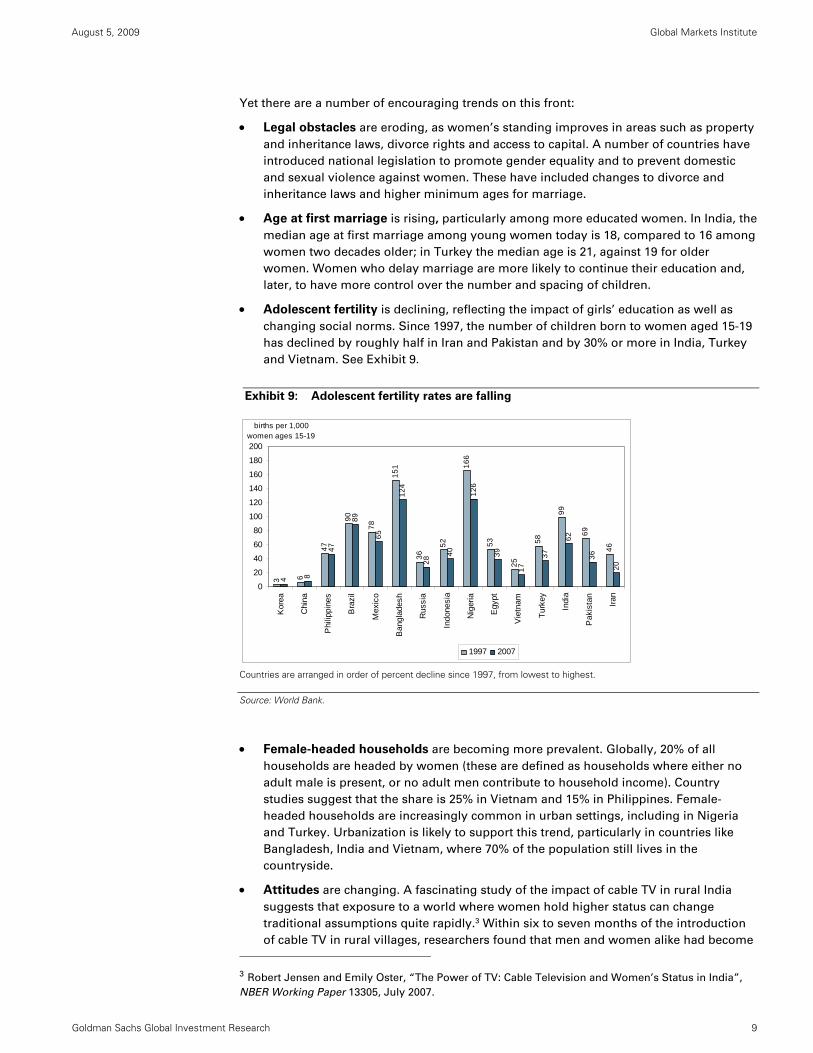
• Adolescent fertility is declining, reflecting the impact of girls’ education as well as
changing social norms. Since 1997, the number of children born to women aged 15-19
has declined by roughly half in Iran and Pakistan and by 30% or more in India, Turkey
and Vietnam. See Exhibit 9.
Exhibit 9: Adolescent fertility rates are falling
3 6
47
90
78
151
36
52
166
53
25
58
99
69
46
4 8
47
89
65
124
28
40
126
39
17
37
62
36
20
0
20
40
60
80
100
120
140
160
180
200
Kor
ea
Chi
na
Phi
lippi
nes
Bra
zil
Mex
ico
Ban
glad
esh
Rus
sia
Indo
nesi
a
Nig
eria
Egy
pt
Vie
tnam
Turk
ey
Indi
a
Pak
ista
n
Iran
births per 1,000 women ages 15-19
1997 2007
Countries are arranged in order of percent decline since 1997, from lowest to highest.
Source: World Bank.
• Female-headed households are becoming more prevalent. Globally, 20% of all
households are headed by women (these are defined as households where either no
adult male is present, or no adult men contribute to household income). Country
studies suggest that the share is 25% in Vietnam and 15% in Philippines. Female-
headed households are increasingly common in urban settings, including in Nigeria
and Turkey. Urbanization is likely to support this trend, particularly in countries like
Bangladesh, India and Vietnam, where 70% of the population still lives in the
countryside.
• Attitudes are changing. A fascinating study of the impact of cable TV in rural India
suggests that exposure to a world where women hold higher status can change
traditional assumptions quite rapidly.3 Within six to seven months of the introduction
of cable TV in rural villages, researchers found that men and women alike had become
3 Robert Jensen and Emily Oster, “The Power of TV: Cable Television and Women’s Status in India”,
NBER Working Paper 13305, July 2007.

August 5, 2009 Global Markets Institute
Goldman Sachs Global Investment Research 10
significantly more open to women’s autonomy and more accepting of female
participation in household decision-making about large purchases. Related research
indicates that exposure to female political leaders weakens gender stereotypes among
men, undermines biases against women as leaders, and boosts women’s political
participation.
Women are gaining bargaining power
In “Women Hold Up Half the Sky”, we analyzed the channels through which female
education affects economic growth. The list is long and wide-ranging, including:
• Higher wages and better jobs, along with an increased propensity to work outside the
household;
• Lower fertility rates; lower maternal, infant and child mortality rates; and better health
for women and their families;
• More productive agriculture, evidently because educated women are more open to the
spread of new technologies and techniques;
• Higher economy-wide productivity, because educating girls raises the overall quality of
the aggregate workforce;
• Higher returns to investment, typically found in countries with higher levels of human
capital; and
• The “demographic transition”, a period in which the working-age share of the
population grows more quickly than the overall population, supporting higher savings
and per capita income.
While many of these channels operate over the long term, the economic impact of
women’s education is increasingly evident today. In fact, the effects of women’s
growing power can be seen in household decisions on spending, savings, education,
health and time allocation.
Bargaining power
As women gain education, enter the workforce in greater numbers and earn more income,
their options increase and their positions within the household and local community
improve. Women’s options outside of marriage – their “fallback positions” – also improve.
Changes in laws and social norms help to consolidate the impact of narrowing gender
gaps.
Previous research has tended to treat “the household” as a single unit with a single set of
preferences and a uniform budget constraint. More recent empirical work has shown that
preferences and resources can and do differ between spouses, and that the
bargaining power of each spouse does affect household decision-making.

August 5, 2009 Global Markets Institute
Goldman Sachs Global Investment Research 11
Critical variables of bargaining power include wages and other income, along with the
assets that husbands and wives each bring to the marriage. This is visible in several ways:4
• Studies of developed economies find that decision-making power depends
significantly on relative household earnings, with relative average lifetime earnings
being more important than current earnings. Being self-employed also strengthens
decision-making power.
• Households spend a larger share of their budget on food and on private goods for
women in years when the production of crops cultivated by women is higher;
conversely, households spend a larger share of the budget on alcohol, tobacco and
goods consumed by men in years when the production of crops cultivated by men is
higher.
• A number of studies show that when women, rather than men, are the direct
beneficiaries of credit, the impact of credit on various measures of household welfare
(such as children’s health and education) is greater.
• Non-financial variables affect women’s status as well. For instance, research finds that
having children (especially children under the age of 18) reduces a husband’s reported
bargaining power considerably. And wives seem to gain more influence as they, as
well as their husbands, age.
This is not to say that traditional norms of household decision-making have
disappeared. Social restrictions on women’s roles and power within the household
certainly do persist, and decision-making power remains concentrated among men in
many countries. For instance, the share of women who say their husbands alone make
major household decisions is considerably higher in Africa than in East Asia, in line with
data on the relative status of women. Nonetheless, these norms can be – and are being
– eroded by factors including women’s education, urbanization, greater mobility and
the spread of technology.
As a result of women’s increased bargaining power:
Patterns of household spending shift
Women and men have notably different preferences in household purchases.
Numerous studies show that men spend more of their income on items for their own
consumption, including alcohol, cigarettes, high-status consumer goods and even “female
companionship”. Women are more likely to purchase goods for their household and
specifically for their children, including food, healthcare, education, clothing and
personal-care products.
This is true in developed and developing countries alike. In the United Kingdom, for
example, women are responsible for more than three-quarters of household expenditures
on childcare, food and education, but less than half of spending on tobacco and about one-
quarter on alcohol. Similar dynamics exist across the OECD (see Exhibit 10).
4 The conclusions about household decision-making and the impact of women’s improved bargaining
power draw on a wide range of academic research, including country studies and cross-country
analyses. We have listed some of the most important sources in a bibliography at the end of the paper.

August 5, 2009 Global Markets Institute
Goldman Sachs Global Investment Research 12
Exhibit 10: Women control much of the household spending in the United Kingdom
Percentage of total household spending controlled by women
Women's clothes 90Children's clothes 85Food 80Child care / school expenses 78Medical / dental expenses 59Household goods 51Tobacco 43Recreation 42Men's clothes 40Holidays 36Gambling 35Meals out 34Repairs to house 33Motor vehicles 31Alcohol 27
Source: UK Office for National Statistics, Family Expenditure Survey.
Household surveys in a range of countries show that an increase in the share of assets held
by women in urban households increases the share of the budget spent on food. Among
both rural and urban women, the share of assets held by women has a positive effect on
spending on education and a negative effect on expenditures on alcohol, tobacco and
recreation.
In one study, which introduced formal savings accounts for women in rural Kenya, the
private daily expenditures of women with these accounts were roughly 40% higher than
other women’s, and their average daily food expenditures were 15%-30% higher. This
suggests not only that higher investment leads to higher income, but also that women are
likely to spend their income on products that benefit their children.
Human capital improves
As women’s bargaining power increases alongside their earnings power, women become
more able to influence household decisions that benefit children, improving human capital
and promoting economic growth. Both health and education can be seen as investments in
the family’s future earnings power. Though an increase in either women’s or men’s
income helps children, the benefits are greater when women are the source of the
increase.
This is visible through multiple channels, as many studies have demonstrated:
• As women’s share of unearned income rises, children enter school earlier, their
weight-for-height and weight-for-age ratios improve, and they live longer. The shares
of the household budget devoted to education, especially for girls, and healthcare also
rise in many countries.
• Nutrition improves. Pensions received by women translate into better nutrition for
girls, while pensions received by men have no such effect for either girls or boys. Child
nutrition is better in households run by women compared to those run by men, even
when the women’s families are poorer. Income managed by women has a five-fold
impact on food expenditures (compared to when income is managed by men), and
women tend to invest in food associated with better health.
• Mothers spend more on healthcare, including primary care and vaccinations, than
do fathers. The probability of child survival is 20 times more sensitive to an increase in
women’s unearned income than to an increase in men’s unearned income. Overall
health improves in households where women earn more than half of family income
and have greater control over the family’s resources.

August 5, 2009 Global Markets Institute
Goldman Sachs Global Investment Research 13
Priorities for physical investment may change
The impact of women’s decision-making power is also increasingly evident outside of the
household. As women gain political influence (and office), there is likely to be a shift
in local government spending to support issues of particular concern to women.
This is not to say that women and men have starkly different political priorities. But
women’s priorities tend to reflect their distinct roles and responsibilities within the
household. As an example, drinking water is likely to be of greater concern to women,
who are often responsible for obtaining it, than to men. Women are also likely to be more
concerned with healthcare, since that too is principally their responsibility.
Thus we would expect to see greater public investment in areas like drinking water,
sanitation and healthcare. Roads are also a major priority for women (and for men as well),
because they expand access to markets and to education.
Household savings rates rise
Women tend to save more than men do, with this reliance on precautionary savings
attributable, in part, to their higher economic vulnerability. Information from 20 semi-
industrialized countries suggests that for every one percentage point increase in the share
of household income generated by women, aggregate domestic savings increase by
roughly 15 bp. And a one percentage point increase in women’s share of household wages
boosts aggregate savings by 25 bp.
There is also evidence to suggest that women would save more money in formal savings
vehicles than they do currently, if they had the opportunity. Formal savings are attractive
because they lower the risk that funds will be diverted or stolen, and because they increase
women’s control over their own (and household) funds. The Kenyan study cited above
shows that access to savings accounts (even non-interest-bearing accounts carrying high
transaction costs) has a strongly positive impact on business investment among women
(though not among men), raising it by 40% on average in just four to six months.
Women’s growing decision-making power may also result in more conservative savings
and investment decisions. Studies across a range of countries indicate that women are
more risk-averse than men, particularly in the context of savings and household
investment.
Savings at the household level is important for, among many things, funding education
and obtaining access to medical care. Women’s greater proclivity to save complements
their focus on household welfare and their inclination to focus the use of resources on their
children. It is also worth noting that offering women more access to savings products has
the potential to steer assets into the formal financial system and thus to support
investment.

August 5, 2009 Global Markets Institute
Goldman Sachs Global Investment Research 14
What will women buy?
What will increasingly empowered women buy? How will they spend and invest their
earnings and household income? Research already indicates that, globally, women drive
three-quarters of all spending in consumer markets.5 Among the BRICs and N-11
countries, women’s growing spending autonomy is likely to drive incremental growth
on top of the increased demand that is attributable to rising income alone. Critical
sectors that are likely to benefit include:
• Food, especially higher-quality and protein-intensive food. Higher incomes are already
raising the demand for meat and poultry. For instance, over the past decade, Brazil’s
per capita poultry consumption has risen by two-thirds, while China’s pork
consumption has risen by nearly one-quarter and its milk consumption nearly four-
fold.
• Healthcare, including pharmaceuticals, preventive vaccinations for children, elective
vaccinations for adults, diagnostic technology and therapy equipment, along with
hospital care and general health services. The market for private health insurance
should also see significant growth among the emerging middle class in countries with
weak public health systems.
• Financial products. As we discussed above, there appears to be significant unmet
demand among women for savings and investment vehicles held outside of the
household and thus more directly (and safely) under women’s control. In countries
with limited banking systems, like India, roughly half of all household assets are held
as physical assets like land, equipment and jewelry. Simple financial savings products
are thus likely to be attractive, as should life insurance. Demand for credit is likely to
rise, fueling the nascent credit card market in the wealthier countries among the BRICs
and N-11.
• Education, especially for children but also for women themselves. This could include
“prep” classes for high school and college entrance exams, private English-language
instruction, and vocational and business training. In most cases, this is likely to be
provided by for-profit companies. Publishers of textbooks and other educational aids
should benefit as well.
• Childcare. Two separate, though related, phenomena are likely to drive demand for
paid childcare. First, demand is likely to grow most rapidly in the richer countries
where female labor-force participation rates are increasing. Second, demand is also
likely to grow in countries undergoing rapid urbanization, which tends to weaken
traditional patterns of intergenerational childcare. Paid childcare enables more women
to work outside the household; it is also an investment in the family’s older children,
especially girls, who might otherwise miss educational and training opportunities in
order to care for younger siblings.
• Consumer durables, such as dishwashers and washing machines, and apparel. While
these are goods that the emerging middle class buys in any case, they may move
higher on the list of priorities as women exercise more control over household
earnings and spending.
As household priorities shift, other categories of goods and services will be more
negatively affected. Rising incomes will continue to drive demand for alcohol and tobacco
(particularly brand-label goods in both categories), as well as other “male-oriented” goods
5 Euromonitor, Who Buys What: Identifying International Spending Patterns, February 2007. This study
analyzed expenditure by gender, age, wealth and education in 35 countries and more than 70 market
sectors.

August 5, 2009 Global Markets Institute
Goldman Sachs Global Investment Research 15
and services. In countries where women’s spending power is strongest, however, gains in
these sectors may lag growth in more household-friendly goods and services.
A number of companies have exposure to the simultaneous rise in gender equality
and growth of the global middle class. Our Equity Research analysts have identified an
illustrative list of such companies, shown in Exhibit 11.
Exhibit 11: Companies with exposure to the convergence of rising incomes and growing gender equality
Alliance Data Systems (ADS) USA Belle International Holdings Limited HK Abbott Laboratories USABanco Santander ESP Cadbury plc UK Allergan, Inc. USAErste Group Bank AG AUT Casas Bahia Private Baxter International Inc. USAHDFC Bank Limited IND CBD Companhia Brasileira de Distribuição BRA Becton, Dickinson & Co. USAHSBC UK, HK China Mengniu Dairy Company Limited HK Bristol Myers Squibb Co. USAMahindra & Mahindra Financial Services Ltd. IND China Yurun Food Group Limited HK Coloplast A/S DNKMapfre SA ESP CJ O Shopping Co., Ltd. KOR GlaxoSmithKline plc USAMasterCard Inc. USA Diageo plc UK Haemonetics Corporation USAPrudential plc USA, UK Drogasil SA BRA Hologic, Inc. USARaiffeisen International AUT GS Home Shopping Inc. KOR iKang PrivateStandard Chartered PLC UK, HK Hypermarcas SA BRA Johnson & Johnson USAVienna Insurance Group AUT Inditex SA ESP Joincare Pharmaceutical Group Industry Co., Ltd. CHNVisa Inc. USA Kingfisher plc UK Medial Saúde SA BRA
Lojas Renner SA BRA Merck & Co. Inc. USAMagazine Luiza Private Mylan Inc. USANatura Cosmeticos SA BRA Novartis AG CHE, USANestle SA CHE Odontoprev SA BRASadia - Perdigão (pending merger, to become Brasil Foods)
BRA Pfizer Incorporated Qiagen NV
USAUSA, GER
Tesco plc UK Sanofi-Aventis SA NYSE EuronextUnilever UK, Euronext Shandong Dong-E E-Jiao Co., Ltd. CHNWal-Mart USA Shanghai Jiaoda Onlly Co., Ltd. CHN
Sonova Holding AG CHETeva Pharmaceutical Industries Ltd. USA, ISRWatson Pharmaceuticals, Inc. USAWilliam Demant Holding A/S DNKZydus Cadila Healthcare Limited IND
AFI Development plc UK Kroton Educacional SA BRAAgile Property Holdings Limited HK Megastudy Co., Ltd. KORBR Malls Participacoes SA BRA New Oriental Education & Tech. Group Inc. USAMultiplan Empreendimentos Imobiliarios SA BRA Sistema Educational Brasileiro S.A. (SEB) BRAShimao Property Holdings Limited HK Unip Private
Education
Financial services HealthcareHousehold durable goods / Personal care / Food
Real estate
Source: Companies identified by Goldman Sachs Equity Research analysts as having exposure to the convergence of rising incomes and growing gender equality.

August 5, 2009 Global Markets Institute
Goldman Sachs Global Investment Research 16
The global middle class: countries to watch
The “expanding middle”
Women’s social and economic gains coincide with an ongoing and unprecedented
explosion in what we can call a “global middle class.” As Goldman Sachs economists
Dominic Wilson and Raluca Dragusanu have discussed in detail,6 some 1.7 billion people
today can be considered middle class – with incomes between $6,000 and $30,000 in
PPP terms – and this figure is likely to reach 3.6 billion by 2030. Close to 85% of the
global middle class will live in the BRICs and N-11 countries by then. See Exhibit 12.
Exhibit 12: Tracking the rise of the middle class across the BRICs and N-11
Share of population with incomes between $6,000 and $30,000 (PPP terms)
% Brazil Russia India China Korea Bangladesh Egypt Indonesia Iran Mexico Nigeria Pakistan Philippines Turkey Vietnam2009 46 71 6 37 67 0 39 16 70 61 6 9 15 79 72015 52 71 16 59 46 1 57 29 77 65 9 13 23 81 202025 59 56 46 75 23 5 84 57 73 65 18 22 40 70 512040 57 29 89 53 7 38 82 87 41 49 42 49 69 35 84
Source: Goldman Sachs projections. In countries where the middle-class share declines over time (Russia, Korea, Iran, Mexico and Turkey), this reflects a shift into the higher-income category.
The next five years
Over the next five years, to 2015, the middle class story is set to play out most vividly in a
handful of countries (see Exhibit 13):
• In China, rapid income growth means that nearly 60% of the population will be
considered middle class by 2015, up from 37% today. In relative (as well as absolute)
terms, China’s middle class could be larger than Brazil’s before 2015 (when Brazil’s
share reaches 52%). In Russia, nearly three-quarters of the population is already
“middle class,” and by 2015 more than 20% will have incomes above $30,000.7
• Among the N-11, the highest middle-class shares today are to be found in Turkey
(79%), Iran (70%) and Mexico (61%). These shares will remain relatively constant over
the next five years.
• Growth rates of the middle-class share will be highest in India and Vietnam,
averaging nearly 20% per year, and in Indonesia, averaging about 10%. In these three
countries, rapid growth would be from an extremely low starting point: less than 10%
of the population in both India and Vietnam, and less than 20% in Indonesia, is
considered “middle class” today.
6 These income-distribution projections are based on our long-term growth projections for the BRICs
and N-11. See Dominic Wilson and Raluca Dragusanu, “The Expanding Middle: The Exploding World
Middle Class and Falling Global Inequality”, Global Economics Paper 170, July 7, 2008.
7 The middle-class story has largely played out in Korea, where more than one-third of the population
is already in the higher income bracket (above $30,000); we expect that this share will rise to more than
half by 2015 and more than three-quarters by 2025.

August 5, 2009 Global Markets Institute
Goldman Sachs Global Investment Research 17
Exhibit 13: Middle class peak: yesterday in Korea, today in Russia, far in the future in
India
Share of population with incomes between $6,000 and $30,000 (PPP terms)
0
10
20
30
40
50
60
70
80
90
100
2000 2005 2010 2015 2020 2025 2030 2035 2040 2045 2050
'middle class' share of population (%)
Brazil China India Korea Russia
Source: Goldman Sachs projections.
2015-2025:
In the subsequent decade (2015-2025), we anticipate several major developments (see
Exhibits 14-15):
• Three-quarters of China’s population should achieve middle class income levels, as
should nearly half of India’s population. Among the N-11, the middle class shares
would stay flat in Mexico and decline slightly in Iran and Turkey, as growth in the
“higher income” bracket offsets the falling “low income” share.
• Only two countries will see the middle class share grow by more than 10% per year:
India and Vietnam. Over that decade, the middle class share in both countries could
rise by more than 30ppt (to 46% in India and 51% in Vietnam).
• Elsewhere in the N-11, large share gains could also be seen in Egypt and Indonesia
(each of nearly 30ppt), while growth rates will average above 5% per year in
Indonesia, Nigeria, Pakistan and Philippines.

August 5, 2009 Global Markets Institute
Goldman Sachs Global Investment Research 18
Exhibit 14: In the richer N-11 countries, the middle class share will peak in 5-15 years,
then decline as the higher-income segment grows
Share of population with incomes between $6,000 and $30,000 (PPP terms)
0
10
20
30
40
50
60
70
80
90
100
2000 2005 2010 2015 2020 2025 2030 2035 2040 2045 2050
'middle class' share of population (%)
Iran Mexico Turkey
Source: Goldman Sachs projections.
Beyond 2025:
After 2025, the growth of the higher-income category ($30,000 and above) will be the
principal story for three of the four BRICs (except India) and several of the N-11 countries
(namely Turkey, Mexico, Iran and Korea). But the middle class story will continue to play
out elsewhere (see Exhibit 15).
• By 2040, the middle class share should peak at 80%-90% of the population in India,
Indonesia, Vietnam and Egypt and at 70% in Philippines.
• But about half the population in Pakistan, Nigeria and Bangladesh is likely to remain
“lower income” (with incomes below $6,000) in 2040. Accordingly, the middle-class
growth story in those countries will still be playing out several decades into the future.

August 5, 2009 Global Markets Institute
Goldman Sachs Global Investment Research 19
Exhibit 15: Elsewhere in the N-11, the middle class share will peak after 2030
Share of population with incomes between $6,000 and $30,000 (PPP terms)
0
10
20
30
40
50
60
70
80
90
100
2000 2005 2010 2015 2020 2025 2030 2035 2040 2045 2050
'middle class' share of population (%)
Bangladesh Egypt Indonesia Nigeria Pakistan Philippines Vietnam
Source: Goldman Sachs projections.
Gender and income: the “sweet spot” for shifts in spending
We are most interested in identifying countries where the middle class is growing at
the same time that gender equality is improving. Taken together, more income – and
more income in the hands of women – will significantly affect consumer demand.
In addition to the research on gender equality that we discussed above, there are several
formal measures of gender equality that can help us to identify the “sweet spot” of
changing consumer demand. Chief among these are:
• The UN’s Gender-Related Development Index (GDI), which measures human
development while adjusting for gender inequality. It is an unweighted measure of
gender differences in life expectancy at birth, school enrollment and literacy, and
earned income.
• The UN’s Gender Empowerment Measure (GEM), which assesses women’s position in
society, including political and economic participation and decision-making power; and
• The OECD’s Gender, Institutions and Development Index (GID), which evaluates
discrimination in social institutions, looking in particular at laws, customs and family
traditions.
Measures for each of these indicators are listed in Exhibit 16. These indicators show the
mutually reinforcing relationship between gender equality and growth. They also echo the
conclusions from the data presented in the first part of this paper, which are summarized in
Exhibit 17.

August 5, 2009 Global Markets Institute
Goldman Sachs Global Investment Research 20
Exhibit 16: Formal indicators echo the link between gender equality and income
GDP per capita,
2008, US$
Gender, Institutions and Development Index
(GID)
Women's earnings as a share of men's
earnings (¢/$)
Value Rank Value Rank Value 2008Korea 21,214 0.910 26 0.510 64 0.021 46Mexico 8,823 0.820 51 0.589 46 0.025 39Russia 9,791 0.801 58 0.489 71 0.078 62Brazil 7,129 0.798 59 0.490 70 0.059 57China 2,768 0.776 72 0.534 57 0.184 64Philippines 1,719 0.768 76 0.590 45 0.043 60Turkey 9,352 0.763 78 0.298 90 0.108 35Iran 4,463 0.750 83 0.347 87 0.440 38Vietnam 882 0.732 90 0.561 52 0.253 71Indonesia 1,972 0.721 93 .. 0.170 45India 1,010 0.600 112 .. 0.499 31Bangladesh 484 0.539 120 0.379 81 0.495 46Pakistan 912 0.525 124 0.377 82 0.733 29Nigeria 1,178 0.456 138 .. 0.567 41Egypt 1,770 .. .. 0.263 91 0.456 23
Gender-related Development Index
(GDI)
Gender Empowerment Measure
(GEM)
For the GDI and GEM (both UN measures), a value of 1.0 denotes high equality.
For the GID (from the OECD), a value of 1.0 denotes high inequality.
Source: OECD, United Nations, Goldman Sachs Research.
Exhibit 17: Snapshot of standing and progress in selected gender equality indicators, BRICs and N-11
Country 1990 2007 change (years) Country 1991 2006-07 change
(ppt) Country 1990 2007 change (ppt) Country 2008 Country 1990 2008 change
(ppt)Egypt 63.6 73.6 10.0 Iran 84.7 113.6 28.9 Brazil 38.7 59.5 20.8 Vietnam 71 Pakistan 10.0 22.5 12.5 Bangladesh 55.1 65.0 9.9 India 70.3 90.6 20.3 Iran 21.5 31.8 10.3 China 64 Korea 2.0 13.7 11.7 Indonesia 63.5 72.7 9.1 Egypt 81.4 94.7 13.3 Pakistan 11.2 20.8 9.6 Russia 62 Philippines 9.0 20.5 11.5 Vietnam 67.7 76.2 8.5 China 86.9 99.9 13.0 Mexico 34.4 41.2 6.8 Philippines 60 Mexico 12.0 23.2 11.2 Korea 75.5 82.4 6.9 BRICs/N11 avg 83.3 95.8 12.5 Philippines 47.4 49.8 2.4 Brazil 57 Turkey 1.0 9.1 8.1 Iran 65.9 72.6 6.7 Turkey 80.8 90.1 9.3 Korea 47 49.3 2.3 BRICs/N11 avg 48 Vietnam 18.0 25.8 7.8 India 60.0 66.4 6.4 Nigeria 77.2 84.0 6.8 Nigeria 37.3 38.7 1.4 Korea 46 Bangladesh 10.0 15.1 5.1 Philippines 67.8 73.9 6.2 Indonesia 93.3 97.9 4.5 Egypt 23.8 23.8 0.0 Bangladesh 46 India 5.0 9.1 4.1 Turkey 68.3 74.2 5.9 Philippines 100.4 102.5 2.1 Indonesia 50.3 49.6 (0.7) Indonesia 45 Brazil 5.0 9.0 4.0 Pakistan 60.1 65.8 5.7 Mexico 97.0 98.9 1.9 India 35.1 34.2 (0.9) Nigeria 41 BRICs/N11 avg 12.3 14.9 2.6 Brazil 70.4 76.1 5.6 Korea 98.9 95.5 (3.4) BRICs/N11 avg 51.8 50.6 (1.2) Mexico 39 Iran 2.0 2.8 0.8 BRICs/N11 avg 65.5 70.7 5.2 Russia 103.8 98.7 (5.2) China 73.2 70.6 (2.6) Iran 38 China 21.0 21.3 0.3 China 69.7 74.8 5.1 Bangladesh .. 103.5 .. Russia 60.2 57.1 (3.1) Turkey 35 Indonesia 12.0 11.6 (0.4)Mexico 73.8 77.4 3.5 Brazil .. 102.9 .. Vietnam 74 69.3 (4.7) India 31 Egypt 4.0 1.8 (2.2)Russia 74.3 74.0 (0.3) Pakistan .. 77.9 .. Bangladesh 62 57.2 (4.8) Pakistan 29 Nigeria .. 7.0 ..Nigeria 48.6 47.3 (1.2) Vietnam .. .. .. Turkey 34.4 24.4 (10.0) Egypt 23 Russia .. 14.0 ..
Female life expectancy at birth (years)
Ratio of female to male enrollment in primary and secondary education
Labor force participation rate (% of female pop. ages 15-64)
Women's earnings as a share of men's earnings (¢/$)
Female share, seats in parliament (%)
Countries are arranged in order of change since 1990 (in years, or ppt, as indicated), from highest to lowest.
For earnings ratios, countries are arranged from most to least equal (2008).
For enrollment data, the most recent available year for Egypt and Bangladesh is 2004, and for Brazil is 2005.
For parliamentary representation, the most recent available year for Bangladesh is 2007.
Source: All data are World Bank, except for earnings data (OECD).

August 5, 2009 Global Markets Institute
Goldman Sachs Global Investment Research 21
Drawing on all of these measures, we can flag the most promising countries for the growth
in women’s spending power.
• Until 2015, the gender-income story should play out most vividly in China, where
women’s status is already high and where the middle class share could rise at an
average rate of 9% per year. Women are also likely to drive much of the household
spending in Korea, Russia and Brazil, although the middle-class income gains will be
smaller, particularly in already-wealthy Korea and Russia.
• We also anticipate that women will increasingly drive purchasing decisions in
Vietnam, Mexico and Indonesia over the next few years. Despite a large middle
class in Egypt, Iran and Turkey, women’s relatively weaker status in those countries is
likely to slow the bargaining-power gains that we expect elsewhere. And although the
middle class will grow rapidly in India, women are unlikely to gain significantly more
power within the household over this short timeframe.
• From 2015-2025, the women’s spending story will continue to strengthen in
countries where the middle class share grows significantly, namely China,
Indonesia and Vietnam. The story will also remain strong in Mexico and Russia,
and develop in Philippines and India. Growth of the middle class will be especially
strong in India, where we may see women assume important household decision-
making power, especially in urban areas and especially as younger, more educated
women move into their prime spending years.
The virtuous circle: gender equality and economic growth
Economic growth and gender equality form a virtuous cycle, in which gender equality
supports economic growth and growth reinforces gender equality gains.
Gender equality fuels growth, by bringing women into the labor force and by raising the
overall level of human capital, productivity and wages. It also fuels growth by paving the
way to a “demographic transition” that is more conducive to long-term gains in GDP per
capita.
Growth bolsters gender equality by raising the returns to women’s work outside the
household; this in turn underscores the importance of girls’ education and health, and
strengthens the case for women to play a meaningful role in local and national politics.
As gender equality improves, it often does so across a range of measures in education,
labor markets, health and political representation. The mutually reinforcing link between
gender equality and growth will not play out uniformly or neatly in all countries. For
example, the role of women in the labor force and politics is curtailed even in relatively
wealthy and well-educated countries like Iran. But on the whole, we anticipate that
women’s equality will continue to support the growth of the middle class, which itself is a
key driver of economic growth. See Exhibit 18.

August 5, 2009 Global Markets Institute
Goldman Sachs Global Investment Research 22
Exhibit 18: Gender and per capita GDP across the BRICs and N-11
Country Per capita GDP of $6,000 (2007 US$) realized in the year …
GDI Value (2007)
Korea 1988 0.910Mexico 1993 0.820Turkey 2005 0.763Russia 2006 0.801Brazil 2007 0.798Iran 2013 0.750China 2016 0.776Indonesia 2029 0.721Philippines 2030 0.768Egypt 2032 ..Vietnam 2033 0.732India 2034 0.600Nigeria 2038 0.456Pakistan 2048 0.525Bangladesh 2050 0.539
Source: OECD, Goldman Sachs Research.

August 5, 2009 Global Markets Institute
Goldman Sachs Global Investment Research 23
Selected bibliography
Anna Aizer, “Wages, Violence and Health in the Household”, NBER Working Paper 13494,
October 2007.
Lori Beaman, et al., “Powerful Women: Does Exposure Reduce Bias?” NBER Working Paper
14198, July 2008.
Alison Booth and Patrick Nolen, “Gender Differences in Risk Behaviour: Does Nurture
Matter?”, Discussion Paper Series No. 7198, Centre for Economic Policy Research, March
2009.
Niels-Hugo Blunch and Maitreyi Bordia Das, “Changing Norms about Gender Inequality in
Education: Evidence from Bangladesh”, Policy Research Working Paper 4404, World Bank,
November 2007.
Lex Borghans, Bart H.H. Golsteyn, James J. Heckman and Huub Meijers, “Gender
Differences in Risk Aversion and Ambiguity Aversion”, NBER Working Paper 14713,
February 2009.
Raghabendra Chattopadhyay and Esther Duflo, “Women as Policymakers: Evidence from a
India-wide Randomized Policy Experiment”, NBER Working Paper 8615, December 2001.
David Dollar and Roberta Gatti, “Gender Inequality, Income, and Growth: Are Good Times
Food for Women”, Policy Research Report on Gender and Development, Working Paper
Series No. 1, World Bank May 1999.
Esther Duflo, “Gender Equality in Development”, MIT, December 2005.
Pascaline Dupas and Jonathan Robinson, “Savings Constraints and Microenterprise
Development: Evidence from a Field Experiment in Kenya”, NBER Working Paper 14693,
January 2009.
Maria Sagrario Floro and Stephanie Seguino, “Gender Effects on Aggregate Saving: A
Theoretical and Empirical Analysis”, Working Paper Series No. 23, World Bank, 2002.
Leora Friedberg and Anthony Webb, “Determinants and Consequences of Bargaining
Power in Households”, NBER Working Paper 12367, July 2006.
Kirrin Gill, Rohini Pande, and Anju Malhotra, “Women Deliver for Development”, ICRW,
October 2007.
International Labour Organization, “Global Employment Trends for Women”, March 2009.
Robert Jensen and Emily Oster, “The Power of TV: Cable Television and Women’s Status
in India”, NBER Working Paper 13305, July 2007.
Kathleen M. Kurz and Charlotte Johnson-Welch, “Enhancing Nutrition Results: The Case
for a Women’s Resources Approach”, International Center for Research on Women (ICRW),
March 2000.
Andrew Morrison, Dhushyanth Raju and Nistha Sinha, “Gender Equality, Poverty and
Economic Growth”, Policy Research Working Paper 4349, World Bank, September 2007.
OECD, “Gender and Sustainable Development: Maximising the Economic, Social and
Environmental Role of Women”, OECD, 2008.
Lisa Smith, et al., “The Importance of Women’s Status for Child Nutrition in Developing
Countries”, Research Report 131, International Food Policy Research Institute, 2003.
Mercy Tembon and Lucia Fort (eds.), “Girls’ Education in the 21st Century: Gender Equality,
Empowerment and Economic Growth”, World Bank, 2008.

August 5, 2009 Global Markets Institute
Goldman Sachs Global Investment Research 24
Disclosures
This report has been prepared by the Global Markets Institute, the public policy research unit of the Global Investment Research Division of The
Goldman Sachs Group, Inc. (“Goldman Sachs”). As public policy research, this report, while in preparation, may have been discussed with or
reviewed by persons outside of the Global Investment Research Division, both within and outside Goldman Sachs, and all or a portion of this report
may have been written by policy experts not employed by Goldman Sachs.
While this report may discuss implications of legislative, regulatory and economic policy developments for industry sectors, it does not attempt to
distinguish among the prospects or performance of, or provide analysis of, individual companies and does not recommend any individual security or
an investment in any individual company and should not be relied upon in making investment decisions with respect to individual companies or
securities.
Distributing entities
This research is disseminated in Australia by Goldman Sachs JBWere Pty Ltd (ABN 21 006 797 897) on behalf of Goldman Sachs; in Canada by
Goldman Sachs Canada Inc. regarding Canadian equities and by Goldman Sachs & Co. (all other research); in Germany by Goldman Sachs & Co. oHG;
in Hong Kong by Goldman Sachs (Asia) L.L.C.; in India by Goldman Sachs (India) Securities Private Ltd.; in Japan by Goldman Sachs Japan Co., Ltd.; in
the Republic of Korea by Goldman Sachs (Asia) L.L.C., Seoul Branch; in New Zealand by Goldman Sachs JBWere (NZ) Limited on behalf of Goldman
Sachs; in Singapore by Goldman Sachs (Singapore) Pte. (Company Number: 198602165W); and in the United States of America by Goldman, Sachs &
Co. Goldman Sachs International has approved this research in connection with its distribution in the United Kingdom and European Union.
European Union: Goldman Sachs International, authorised and regulated by the Financial Services Authority, has approved this research in
connection with its distribution in the European Union and United Kingdom; Goldman, Sachs & Co. oHG, regulated by the Bundesanstalt für
Finanzdienstleistungsaufsicht, may also be distributing research in Germany.
General disclosures in addition to specific disclosures required by certain jurisdictions
Goldman Sachs conducts a global full-service, integrated investment banking, investment management and brokerage business. It has investment
banking and other business relationships with governments and companies around the world, and publishes equity, fixed income, commodities and
economic research about, and with implications for, those governments and companies that may be inconsistent with the views expressed in this
report. In addition, its trading and investment businesses and asset management operations may take positions and make decisions without regard to
the views expressed in this report.
Copyright 2009 The Goldman Sachs Group, Inc.
No part of this material may be (i) copied, photocopied or duplicated in any form by any means or (ii) redistributed without the prior written consent
of The Goldman Sachs Group, Inc.

August 5, 2009 Global Markets Institute
Goldman Sachs Global Investment Research 25
President
Abby Joseph Cohen, CFA +1-212-902-4095 (US)
Chair
Esta E. Stecher +1-212-902-3490 (US)
Robert D. Hormats +1-212-902-5347 (US)
Sandra Lawson +1-212-902-6821 (US)
Michael A. Moran, CFA +1-212-357-3512 (US)
Douglas B. Gilman +1-212-902-3132 (US)
Amy C. Semaya +1-212-902-7009 (US)
Recent Publications
The hidden crisis of multiemployer pension plans
July 13, 2009
Alternative Energy: Prospects for policy, finance,
and technology
June 22, 2009
Big balance sheet clean-up to be spurred by FASB
rule changes
June 15, 2009
Pension Review 2009: Fallout from funded status
decline just beginning
June 4, 2009
Effective Regulation Part III: Helping Restore
Transparency
June 4, 2009
Recent Events
AE4: Goldman Sachs Fourth Annual Alternative
Energy Conference
New York / May 20-21, 2009
Top Five Risks: Critical Perspectives on the Global
Economy
London / June 4, 2008
Goldman Sachs Research personnel may be contacted by electronic mail
through the Internet at [email protected]
Goldman Sachs Global Investment Research
Cert no. SW-COC-001941