global oil and gas_seasonal drop in lng prices_barclays_apr 2014
TRANSCRIPT

Equity Research29 April 2014
Barclays Capital Inc. and/or one of its affiliates does and seeks to do business with companies covered in its research reports. As a result, investors should be aware that the firm may have a conflict of interest that could affect the objectivity of this report.
Investors should consider this report as only a single factor in making their investment decision.
This research report has been prepared in whole or in part by equity research analysts based outside the US who are not registered/qualified as research analysts with FINRA.
PLEASE SEE ANALYST CERTIFICATION(S) AND IMPORTANT DISCLOSURES BEGINNING ON PAGE 48.
Global Oil & Gas Weekly Seasonal drop in LNG prices Over the past 12 weeks, North East Asia LNG prices have dropped 34% from $19.7/mBtu to $14.7/mBtu currently. This should not, in our opinion, be viewed as a sudden glut in supply in the LNG market but more a reflection of normal seasonality – prices are virtually unchanged y/y and so far during 2014 LNG prices in Asia have averaged $17.6/ mBtu, 2% higher than at this point in 2013. Post the seasonal lull over 2Q and 3Q we would expect to see a sharp recovery in LNG prices towards the end of the year. Demand remains robust particularly in China and Japan and supply additions, at least short term, are limited. The rate of new LNG projects coming on stream accelerates from 2015 onwards, particularly in Australia and the US, and this is likely to limit upside in prices later in the decade but there also remains risk to the performance of the existing LNG stock. We estimate that over 20% of the current LNG production capacity is over 25 years old and as a result may become more susceptible to declines – as has been the case in 2014 with Eni and BG’s Egyptian LNG assets. Of the Global Integrateds, BG (EW, PT 1250p), Shell (OW, PT 2660p), Total (OW, PT EUR55) and Chevron (EW, PT $130) have the most material exposure to the LNG market.
Demand-supply dynamics support near-term LNG prices: We see limited new LNG supply additions in 2014 and with the 5% increase in demand we forecast, pricing is likely to remain robust in 2014. Beyond 2016, there are several large LNG projects scheduled to come on stream, which could put some pressure on spot prices later in the decade. However, it should be noted that the majority of new start-ups that are expected to come on stream typically have volumes that are committed under long- term agreements which are still linked to oil prices. Our long-run LNG price assumption in Asia remains $14/mbtu.
Movement in Asian LNG prices
Source: Energy Intelligence, Barclays Research
5
10
15
20
Jan-12 Jul-12 Jan-13 Jul-13 Jan-14
$/mBtu
European Integrated Oil Lydia Rainforth, CFA +44 (0)20 3134 6669 [email protected] Barclays, London
Joshua Stone +44 (0)20 3134 6694 [email protected] Barclays, London
Americas Integrated Oil Paul Y. Cheng, CFA 1.212.526.1884 [email protected] BCI, New York
European Oil Services & Drilling Mick Pickup +44 (0)20 3134 6695 [email protected] Barclays, London
European Oil & Gas: E&P Alessandro Pozzi +44 (0)20 7773 4745 [email protected] Barclays, London
CEEMEA Oil & Gas Matthew Thomas +44 (0)20 7773 3640 [email protected] Barclays, London
Caroline Learmonth +27 11 895 6080 [email protected] Absa Capital, Johannesburg
Asia ex-Japan Oil & Gas Somshankar Sinha +91 22 6719 6031 [email protected] BSIPL, Mumbai
Barclays | Global Oil & Gas Weekly
29 April 2014 2
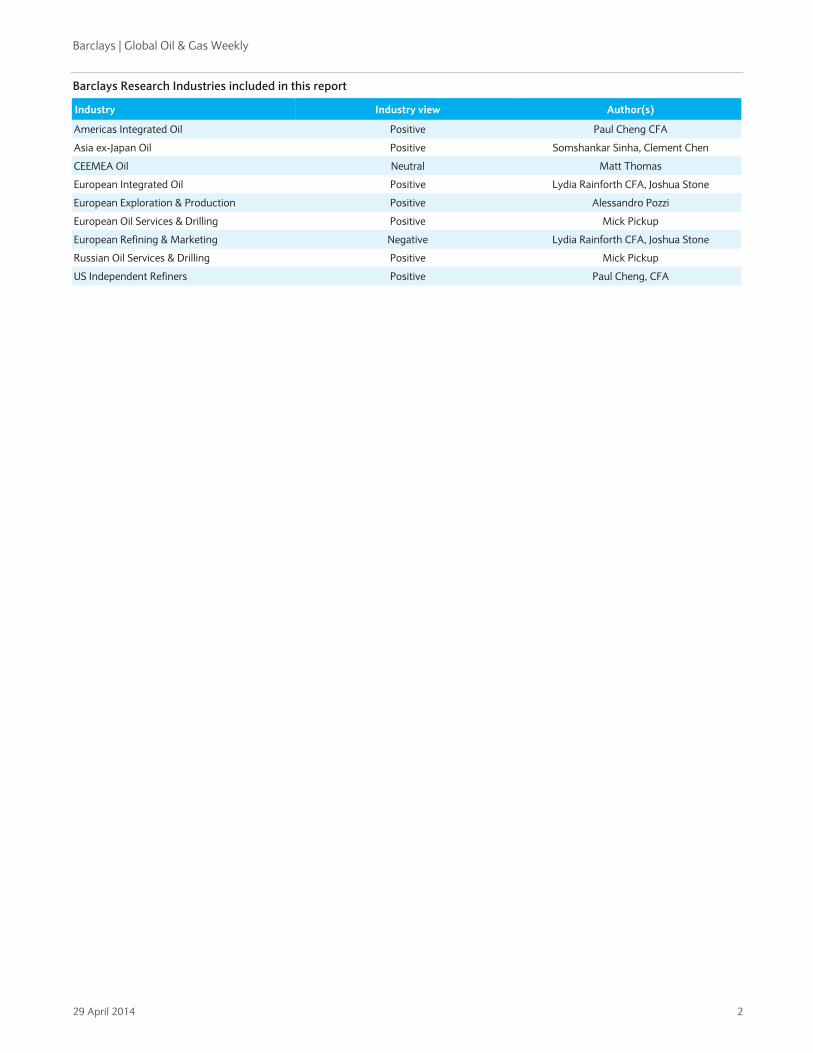
Barclays Research Industries included in this report
Industry Industry view Author(s)
Americas Integrated Oil Positive Paul Cheng CFA
Asia ex-Japan Oil Positive Somshankar Sinha, Clement Chen
CEEMEA Oil Neutral Matt Thomas
European Integrated Oil Positive Lydia Rainforth CFA, Joshua Stone
European Exploration & Production Positive Alessandro Pozzi
European Oil Services & Drilling Positive Mick Pickup
European Refining & Marketing Negative Lydia Rainforth CFA, Joshua Stone
Russian Oil Services & Drilling Positive Mick Pickup
US Independent Refiners Positive Paul Cheng, CFA

Barclays | Global Oil & Gas Weekly
29 April 2014 3
CONTENTS
CRUDE OIL AND NATURAL GAS PRICES ................................ 4
REFINING AND MARKETING MARGINS .................................. 5
TANKER AND EXCHANGE RATES ............................................ 6
INVENTORIES ................................................................................ 7
CRACK SPREADS .......................................................................... 8
SHARE PRICE PERFORMANCE .................................................. 9
INTEGRATEDS ............................................................................. 10 Valuations........................................................................................................................ 11 Share price performance .............................................................................................. 13
REFINERS ...................................................................................... 17 Valuations........................................................................................................................ 18 Share price performance .............................................................................................. 20
SERVICES ...................................................................................... 24 Valuations........................................................................................................................ 25 Share price performance .............................................................................................. 27
E&PS ............................................................................................... 32 Valuations........................................................................................................................ 33 Share price performance .............................................................................................. 35
GLOBAL EMERGING MARKET OILS ....................................... 41 Valuations........................................................................................................................ 42 Share price performance .............................................................................................. 44 The data source for all charts and tables is “Company data, Barclays Research”, unless otherwise stated. Share prices are as of 25 April 2014 at market close, unless otherwise stated.
Source: Bloomberg, Barclays Research
Corporate Calendar
2014
April
29 BP Q1 2014 Earnings ReleaseEni Q1 2014 Earnings ReleaseGalp Q1 2014 Earnings ReleaseStatoil Q1 2014 Earnings Release
30 Aker Solutions Q1 2014 Earnings ReleaseShell Q1 2014 Earnings ReleaseSubsea 7 Q1 2014 Earnings ReleaseTotal Q1 2014 Earnings Release
May
01 BG Group Q1 2014 Earnings Release
07 CGG Q1 2014 Earnings ReleaseMaire Tecnimont Q1 2014 Earnings Release
08 MOL Q1 2014 Earnings ReleaseRepsol Q1 2014 Earnings ReleasePGS AGM
09 PGS Q1 2014 Earnings ReleaseSBM Offshore Q1 2014 Earnings Release
13 OMV Q1 2014 Earnings Release
14 Polarcus Q1 2014 Earnings ReleaseWood Group Q1 2014 Earnings Release

Barclays | Global Oil & Gas Weekly
29 April 2014 4
Crude oil and natural gas prices
Henry Hub Rockies Russia UK-NBP Zee NE Asia LNG
Date Brent WTI ANS Kern River Dubai OPEC WTI-Maya Brent-Urals $/mBtu $/mBtu $/kcf p/therm p/therm $/mBtu
21-Apr-14 109.6 102.3 109.3 103.7 106.0 105.2 8.2 1.6 4.76 4.60 - 48.88 47.86 14.70
14-Apr-14 109.1 104.0 109.5 105.6 105.6 105.4 9.3 1.2 4.62 4.49 - 51.71 51.34 14.80
07-Apr-14 106.6 102.7 108.3 105.1 103.7 103.5 9.2 0.8 4.60 4.47 - 51.60 50.59 15.50
01-Apr-14 105.3 100.5 106.6 103.3 103.2 102.7 9.8 0.7 4.42 4.42 - 49.38 48.81 15.70
Apr-14 107.7 102.4 108.4 104.4 104.6 104.2 9.1 1.1 4.60 4.49 - 50.39 49.65 15.18
Mar-14 107.3 100.5 107.5 104.0 103.9 103.9 10.2 0.9 4.48 4.91 10.94 56.93 55.85 16.75
Feb-14 108.8 100.8 106.6 106.4 104.9 105.3 9.7 1.1 5.96 7.41 11.08 58.97 57.64 19.58
Jan-14 107.4 94.9 103.9 102.8 104.3 105.1 8.2 0.6 4.67 4.70 11.15 65.22 63.61 18.86
2Q 2014 107.7 102.4 108.4 104.4 104.6 104.2 9.1 1.1 4.60 4.49 - 50.39 49.65 15.18
1Q 2014 107.8 98.5 105.9 104.3 104.4 104.9 9.3 0.7 5.04 5.67 11.06 60.37 59.03 18.40
4Q 2013 109.4 97.1 105.0 100.7 106.8 106.5 8.0 0.9 3.85 3.93 11.21 67.89 66.52 18.07
3Q 2013 110.0 105.6 111.0 109.8 106.0 106.7 6.5 (0.1) 3.81 3.40 11.22 65.06 64.96 15.65
2Q 2013 103.0 94.1 104.3 104.7 100.8 101.0 (3.8) 0.9 4.00 3.81 11.72 65.53 67.00 14.69
1Q 2013 112.8 94.3 110.4 113.9 108.0 109.4 (8.4) 2.1 3.50 3.50 12.30 74.27 71.44 17.95
2014 107.8 99.4 106.5 104.3 104.5 104.7 9.3 0.8 4.93 5.38 11.06 57.88 56.69 17.59
2013 108.8 97.9 107.8 107.4 105.4 105.9 0.6 0.9 3.72 3.66 11.61 68.19 67.48 16.59
2012 112.1 94.3 110.9 111.9 109.1 109.6 (5.5) 1.7 2.75 2.68 12.87 59.56 59.32 15.14
2011 111.0 95.1 109.6 112.4 106.1 107.6 (3.6) 1.7 3.94 3.79 11.80 56.84 57.56 13.77
2010 79.7 79.5 78.9 82.8 78.1 77.5 9.2 1.4 4.37 3.94 9.77 42.52 43.06 11.13
2009 62.2 62.1 61.1 64.6 62.1 61.1 5.8 0.6 3.94 3.17 8.21 30.81 31.20 8.91
2008 97.2 99.1 97.9 91.5 93.2 93.5 15.5 3.3 8.82 6.30 10.98 58.11 58.99 11.42
2007 72.7 72.3 71.7 62.3 68.4 68.8 12.5 3.2 6.94 4.10 7.92 29.85 30.38 6.96
2006 65.8 66.2 63.6 55.1 61.6 61.0 15.1 4.9 6.75 5.27 7.19 40.20 43.33 6.46
2005 55.0 56.6 53.7 45.0 49.4 50.7 11.4 4.5 8.91 7.15 5.68 38.30 40.94 5.60
Source: Bloomberg, Datastream Source: Bloomberg, Natural Gas Week, European Gas Markets Source: WGI
Crude - $/blNatural gas
Barclays | Global Oil & Gas Weekly
29 April 2014 5
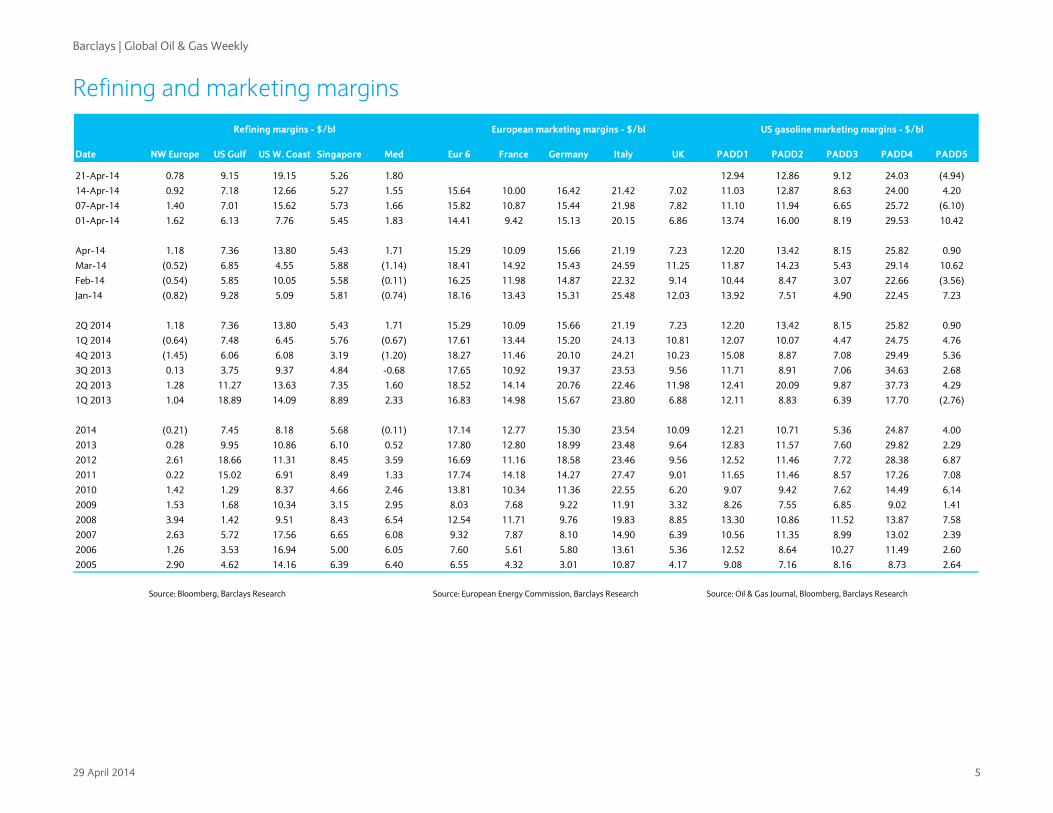
Refining and marketing margins
Date NW Europe US Gulf US W. Coast Singapore Med Eur 6 France Germany Italy UK PADD1 PADD2 PADD3 PADD4 PADD5
21-Apr-14 0.78 9.15 19.15 5.26 1.80 12.94 12.86 9.12 24.03 (4.94)
14-Apr-14 0.92 7.18 12.66 5.27 1.55 15.64 10.00 16.42 21.42 7.02 11.03 12.87 8.63 24.00 4.20
07-Apr-14 1.40 7.01 15.62 5.73 1.66 15.82 10.87 15.44 21.98 7.82 11.10 11.94 6.65 25.72 (6.10)
01-Apr-14 1.62 6.13 7.76 5.45 1.83 14.41 9.42 15.13 20.15 6.86 13.74 16.00 8.19 29.53 10.42
Apr-14 1.18 7.36 13.80 5.43 1.71 15.29 10.09 15.66 21.19 7.23 12.20 13.42 8.15 25.82 0.90
Mar-14 (0.52) 6.85 4.55 5.88 (1.14) 18.41 14.92 15.43 24.59 11.25 11.87 14.23 5.43 29.14 10.62
Feb-14 (0.54) 5.85 10.05 5.58 (0.11) 16.25 11.98 14.87 22.32 9.14 10.44 8.47 3.07 22.66 (3.56)
Jan-14 (0.82) 9.28 5.09 5.81 (0.74) 18.16 13.43 15.31 25.48 12.03 13.92 7.51 4.90 22.45 7.23
2Q 2014 1.18 7.36 13.80 5.43 1.71 15.29 10.09 15.66 21.19 7.23 12.20 13.42 8.15 25.82 0.90
1Q 2014 (0.64) 7.48 6.45 5.76 (0.67) 17.61 13.44 15.20 24.13 10.81 12.07 10.07 4.47 24.75 4.76
4Q 2013 (1.45) 6.06 6.08 3.19 (1.20) 18.27 11.46 20.10 24.21 10.23 15.08 8.87 7.08 29.49 5.36
3Q 2013 0.13 3.75 9.37 4.84 -0.68 17.65 10.92 19.37 23.53 9.56 11.71 8.91 7.06 34.63 2.68
2Q 2013 1.28 11.27 13.63 7.35 1.60 18.52 14.14 20.76 22.46 11.98 12.41 20.09 9.87 37.73 4.29
1Q 2013 1.04 18.89 14.09 8.89 2.33 16.83 14.98 15.67 23.80 6.88 12.11 8.83 6.39 17.70 (2.76)
2014 (0.21) 7.45 8.18 5.68 (0.11) 17.14 12.77 15.30 23.54 10.09 12.21 10.71 5.36 24.87 4.00
2013 0.28 9.95 10.86 6.10 0.52 17.80 12.80 18.99 23.48 9.64 12.83 11.57 7.60 29.82 2.29
2012 2.61 18.66 11.31 8.45 3.59 16.69 11.16 18.58 23.46 9.56 12.52 11.46 7.72 28.38 6.87
2011 0.22 15.02 6.91 8.49 1.33 17.74 14.18 14.27 27.47 9.01 11.65 11.46 8.57 17.26 7.08
2010 1.42 1.29 8.37 4.66 2.46 13.81 10.34 11.36 22.55 6.20 9.07 9.42 7.62 14.49 6.14
2009 1.53 1.68 10.34 3.15 2.95 8.03 7.68 9.22 11.91 3.32 8.26 7.55 6.85 9.02 1.41
2008 3.94 1.42 9.51 8.43 6.54 12.54 11.71 9.76 19.83 8.85 13.30 10.86 11.52 13.87 7.58
2007 2.63 5.72 17.56 6.65 6.08 9.32 7.87 8.10 14.90 6.39 10.56 11.35 8.99 13.02 2.39
2006 1.26 3.53 16.94 5.00 6.05 7.60 5.61 5.80 13.61 5.36 12.52 8.64 10.27 11.49 2.60
2005 2.90 4.62 14.16 6.39 6.40 6.55 4.32 3.01 10.87 4.17 9.08 7.16 8.16 8.73 2.64
Source: Bloomberg, Barclays Research Source: European Energy Commission, Barclays Research Source: Oil & Gas Journal, Bloomberg, Barclays Research
Refining margins - $/bl US gasoline marketing margins - $/blEuropean marketing margins - $/bl

Barclays | Global Oil & Gas Weekly
29 April 2014 6
Tanker and exchange rates
Date Suezmax Aframax Clean Dirty EUR/USD GBP/USD GBP/EUR USD/NOK USD/CAD USD/AUS
21-Apr-14 11,033 15,081 12,895 8,137 1.38 1.68 1.22 6.00 1.10 1.08
14-Apr-14 13,613 17,733 12,619 8,595 1.38 1.68 1.21 5.98 1.10 1.07
07-Apr-14 10,246 18,001 13,594 10,258 1.38 1.67 1.21 5.95 1.09 1.07
01-Apr-14 12,111 14,742 13,579 10,169 1.37 1.66 1.21 5.99 1.10 1.08
Apr-14 11,751 16,389 13,172 9,290 1.38 1.67 1.21 5.98 1.10 1.07
Mar-14 14,344 14,794 14,531 10,110 1.38 1.66 1.20 6.00 1.11 1.10
Feb-14 14,463 15,392 21,143 10,273 1.37 1.66 1.21 6.11 1.11 1.11
Jan-14 57,662 51,898 33,829 10,574 1.36 1.65 1.21 6.15 1.09 1.13
2Q 2014 11,751 16,389 13,172 9,290 1.38 1.67 1.21 5.98 1.10 1.07
1Q 2014 28,823 27,361 23,167 10,319 1.37 1.66 1.21 6.09 1.10 1.11
4Q 2013 23,777 18,715 9,576 10,664 1.36 1.62 1.19 6.06 1.05 1.08
3Q 2013 11,704 13,010 12,432 11,439 1.32 1.54 1.17 5.96 1.04 1.09
2Q 2013 12,134 11,765 11,833 12,983 1.31 1.53 1.18 5.84 1.02 1.01
1Q 2013 15,176 14,118 14,293 21,518 1.32 1.55 1.18 5.63 1.00 0.96
2014 20,287 21,875 18,170 9,804 1.38 1.66 1.21 6.03 1.10 1.09
2013 15,698 14,402 12,033 14,151 1.33 1.56 1.18 5.87 1.03 1.03
2012 17,738 14,881 14,769 13,162 1.29 1.59 1.23 5.82 1.00 0.97
2011 19,239 13,528 10,535 12,644 1.39 1.60 1.15 5.61 0.99 0.97
2010 31,259 19,745 14,956 11,292 1.33 1.55 1.17 6.05 1.03 1.09
2009 28,205 15,969 12,738 8,869 1.39 1.57 1.12 6.29 1.14 1.28
2008 78,573 50,923 37,239 25,508 1.47 1.85 1.26 5.65 1.07 1.20
2007 44,781 35,865 30,533 26,018 1.37 2.00 1.46 5.86 1.07 1.19
2006 52,931 39,338 30,758 27,227 1.26 1.84 1.47 6.41 1.13 1.33
2005 53,579 41,650 37,639 31,145 1.24 1.82 1.46 6.44 1.21 1.31
Source: Clarksons Shipping Weekly Source: Datastream
Tanker rates - $/ship/day Exchange rates

Barclays | Global Oil & Gas Weekly
29 April 2014 7
Inventories
US crude oil inventories, m bl US gasoline inventories, m bl US distillate inventories, m bl
240
280
320
360
400
440
1 4 7 10 13 16 19 22 25 28 31 34 37 40 43 46 49 52
7 Year Range 2013 2014Week
170
190
210
230
250
1 4 7 10 13 16 19 22 25 28 31 34 37 40 43 46 49 52
7 Year Range 2013 2014Week
80
100
120
140
160
180
1 4 7 10 13 16 19 22 25 28 31 34 37 40 43 46 49 52
7 Year Range 2013 2014Week
US total inventories, m bl US Refinery Utilisation, % Natural Gas Storage, bcf
800
900
1,000
1,100
1,200
1 4 7 10 13 16 19 22 25 28 31 34 37 40 43 46 49 52
7 Year Range 2013 2014Week
65
75
85
95
105
Oct-01 Oct-03 Oct-05 Oct-07 Oct-09 Oct-11 Oct-13
Refinery utilisation Rolling 12 month average
750
1,750
2,750
3,750
1 4 7 10 13 16 19 22 25 28 31 34 37 40 43 46 49 52
7 Year Range 2013 2014Week
Non-commercial Paper Positions, m bl Futures Curve - Brent, $/bl Baker Hughes US Rotary Rig Count
050
100150200250300350400450
1 4 7 10 13 16 19 22 25 28 31 34 37 40 43 46 49 52
2013 2014Week
707580859095
100105110115
Dec-14 Dec-15 Dec-16 Dec-17 Dec-18
Brent WTI
Source: Energy Information Administration (EIA), Commitments of Traders report - US CFTC, American Petroleum Institute (API), Bloomberg, Datastream, Barclays Research
0
400
800
1,200
1,600
2,000
Mar-04 Mar-06 Mar-08 Mar-10 Mar-12 Mar-14
Gas rigs Oil rigs

Barclays | Global Oil & Gas Weekly
29 April 2014 8
Crack spreads
European Gasoline Brent Crack Spread, $/bl European Diesel Brent Crack Spread, $/bl European Naptha Brent Crack Spread, $/bl
-10
0
10
20
30
1 4 7 10 13 16 19 22 25 28 31 34 37 40 43 46 49 5210 Year Range 2013 2014Week
-10
0
10
20
30
40
1 4 7 10 13 16 19 22 25 28 31 34 37 40 43 46 49 52
10 Year Range 2013 2014Week
-30
-20
-10
0
10
20
1 4 7 10 13 16 19 22 25 28 31 34 37 40 43 46 49 52
10 Year Range 2013 2014Week
European Kerosene Brent Crack Spread, $/bl European LSFO Brent Crack Spread, $/bl European HSFO Brent Crack Spread, $/bl
-10
0
10
20
30
40
50
1 4 7 10 13 16 19 22 25 28 31 34 37 40 43 46 49 52
10 Year Range 2013 2014Week
-50
-40
-30
-20
-10
0
1 4 7 10 13 16 19 22 25 28 31 34 37 40 43 46 49 52
10 Year Range 2013 2014Week
-60
-50
-40
-30
-20
-10
0
1 4 7 10 13 16 19 22 25 28 31 34 37 40 43 46 49 5210 Year Range 2013 2014Week
Brent-Urals Crude Spread, $/bl Brent-WTI Spread, $/bl Brent Spot Price $/bl
-5
-3
-1
1
3
5
7
9
Apr-08 Apr-09 Apr-10 Apr-11 Apr-12 Apr-13 Apr-14
-10
0
10
20
30
Apr-08 Apr-09 Apr-10 Apr-11 Apr-12 Apr-13 Apr-14
30
60
90
120
150
Apr-08 Apr-09 Apr-10 Apr-11 Apr-12 Apr-13 Apr-14
Source: Energy Information Administration (EIA), Commitments of Traders report - US CFTC, American Petroleum Institute (API), Bloomberg, Datastream, Barclays Research
Barclays | Global Oil & Gas Weekly
29 April 2014 9
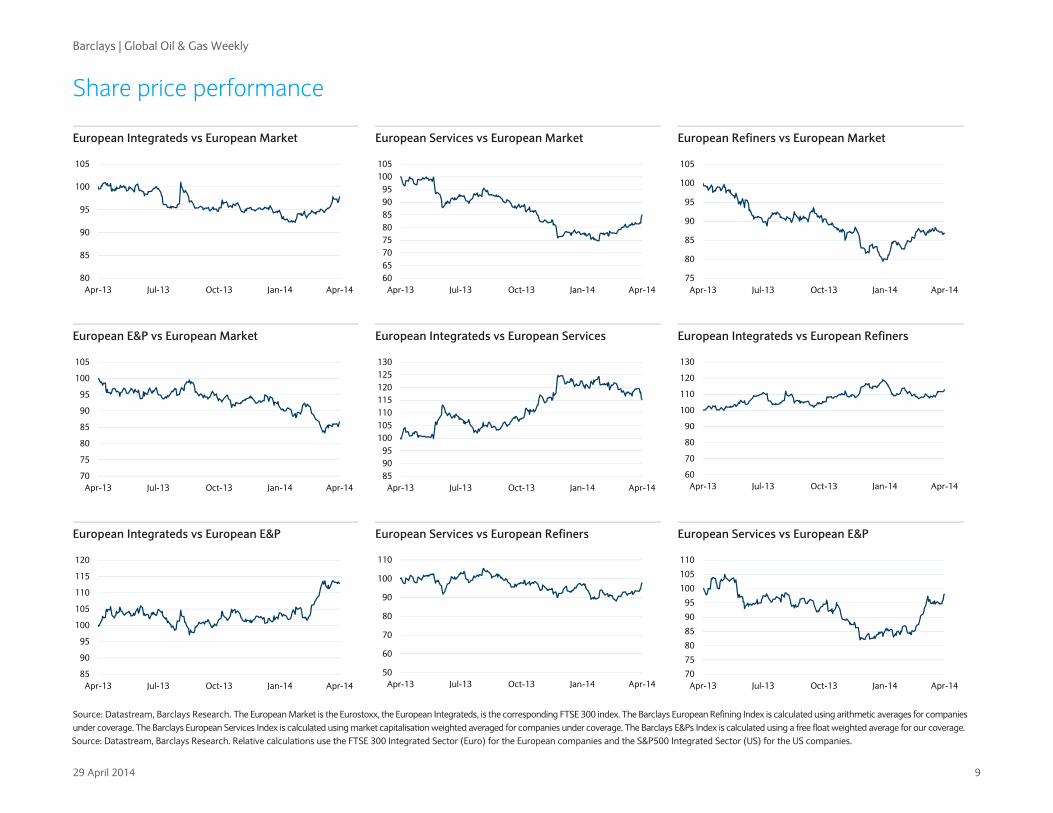
Share price performance
European Integrateds vs European Market European Services vs European Market European Refiners vs European Market
80
85
90
95
100
105
Apr-13 Jul-13 Oct-13 Jan-14 Apr-14
6065707580859095
100105
Apr-13 Jul-13 Oct-13 Jan-14 Apr-14
75
80
85
90
95
100
105
Apr-13 Jul-13 Oct-13 Jan-14 Apr-14
European E&P vs European Market European Integrateds vs European Services European Integrateds vs European Refiners
70
75
80
85
90
95
100
105
Apr-13 Jul-13 Oct-13 Jan-14 Apr-14
859095
100105110115120125130
Apr-13 Jul-13 Oct-13 Jan-14 Apr-14
60
70
80
90
100
110
120
130
Apr-13 Jul-13 Oct-13 Jan-14 Apr-14
European Integrateds vs European E&P European Services vs European Refiners European Services vs European E&P
85
90
95
100
105
110
115
120
Apr-13 Jul-13 Oct-13 Jan-14 Apr-14
50
60
70
80
90
100
110
Apr-13 Jul-13 Oct-13 Jan-14 Apr-14
70
75
80
85
90
95
100
105
110
Apr-13 Jul-13 Oct-13 Jan-14 Apr-14
Source: Datastream, Barclays Research. The European Market is the Eurostoxx, the European Integrateds, is the corresponding FTSE 300 index. The Barclays European Refining Index is calculated using arithmetic averages for companies under coverage. The Barclays European Services Index is calculated using market capitalisation weighted averaged for companies under coverage. The Barclays E&Ps Index is calculated using a free float weighted average for our coverage. Source: Datastream, Barclays Research. Relative calculations use the FTSE 300 Integrated Sector (Euro) for the European companies and the S&P500 Integrated Sector (US) for the US companies.

Barclays | Global Oil & Gas Weekly
29 April 2014 10
Integrateds

Barclays | Global Oil & Gas Weekly
29 April 2014 11
Valuations IntegratedsChange in
Price Target Up/(Down) cons in
Company Rating 25-Apr Price side, % 13F 14F 15F 13F 14F 15F 13F 14F 15F 13F 14F 15F 13F 14F 15F EPS EPS last mnth
MajorsBP U/W 494 550 11 6.1 5.5 5.5 10.7 9.8 10.2 2.0 2.5 4.1 4.9 5.2 5.4 9.0 8.5 8.5 46.2 47.7 -2
Chevron* E/W 124 130 5 7.4 7.4 6.7 12.7 13.3 11.8 (0.5) (0.5) 1.4 3.5 3.8 4.1 11.8 10.7 10.7 9.8 10.9 -2
ExxonMobil* E/W 100.4 95.0 (5) 10.2 10.7 10.3 14.8 16.2 15.8 2.9 2.8 3.1 2.7 3.0 3.3 15.2 12.3 12.3 6.8 7.5 0
Royal Dutch Shell A O/W 2249 2660 18 6.4 6.3 6.4 10.8 10.3 10.3 2.2 2.7 2.6 5.1 5.4 5.7 10.1 9.5 9.5 3.5 3.5 0
Royal Dutch Shell B O/W 2402 2660 11 6.8 6.7 6.7 11.6 11.0 11.0 2.0 2.5 2.4 4.8 5.1 5.3 10.1 9.5 9.5 3.5 3.4 0
Total O/W 49.6 55.0 11 6.1 5.8 5.5 11.1 10.5 10.6 1.2 2.6 3.7 4.9 5.0 5.1 11.0 10.1 10.1 6.0 6.3 -1
Arithmetic average 8 7.2 7.1 6.9 11.9 11.9 11.6 1.7 2.1 2.9 4.3 4.6 4.8 11.2 10.1 10.1 -1
Integrated - EuropeBG Group E/W 1145 1250 9 10.6 9.0 7.6 17.9 14.4 11.3 (6.4) (1.6) 1.9 1.7 1.9 2.1 7.8 9.8 9.8 64.0 69.0 1
Eni E/W 18.4 20.5 11 6.1 5.6 5.5 13.6 11.5 10.7 (1.4) 2.0 2.1 6.1 6.2 6.3 6.5 7.6 7.6 1.4 1.3 -3
Galp O/W 12.7 17.0 34 15.0 12.7 10.5 37.4 26.7 22.5 (4.3) (2.2) (1.7) 2.7 3.3 3.9 4.8 7.3 7.3 0.3 0.4 -1
MOL U/W 13195 14500 10 5.6 4.7 4.4 11.5 8.4 8.5 7.3 8.0 5.4 2.6 3.6 3.5 5.8 6.7 6.7 1145 1525 -2
OMV U/W 32.0 38.0 19 4.4 4.3 4.0 8.5 8.7 8.3 (2.7) 0.2 6.0 4.1 4.2 4.4 9.5 7.6 7.6 3.7 3.9 -1
Repsol E/W 18.9 23.0 22 6.8 5.9 5.2 16.1 13.8 11.7 7.0 9.7 14.8 5.3 5.3 5.3 4.6 7.6 7.6 1.2 1.4 -1
Statoil O/W 173.3 195.0 13 4.7 4.5 4.3 12.0 11.6 11.4 1.1 2.3 4.1 4.2 4.3 4.5 10.8 9.8 9.8 14.5 14.9 -1
Arithmetic average 17 7.6 6.7 5.9 16.7 13.6 12.1 0.1 2.6 4.7 3.8 4.1 4.3 7.1 8.0 8.0 -1
Integrated - US*ConocoPhillips O/W 74.4 83.0 12 7.3 7.1 6.5 13.5 12.8 10.5 (1.7) (1.9) 0.4 3.7 3.8 3.8 10.5 11.1 11.1 5.5 6.1 -1
Hess O/W 87.4 90.0 3 7.7 7.0 6.5 22.7 19.2 17.3 (0.8) 0.9 2.4 1.1 1.1 1.1 5.2 5.8 5.8 3.9 4.6 0
Murphy E/W 63.7 65.0 2 5.2 4.9 5.3 13.1 12.9 15.4 (5) (1.6) (2.0) 2.0 2.0 2.0 8.0 6.1 6.1 4.9 5.5 0
Arithmetic average 7 6.5 6.2 6.0 16.2 14.9 13.9 (2.0) (0.5) 0.4 2.2 2.2 2.2 7.7 7.7 7.7 0
The price targets for the European companies are based on a sum-of-the-parts based DCF methodology. For the US they are based on return on market capitalisation under mid-cycle assumptions.
Source: Company data, Datastream, Barclays Research. * Chevron, Exxon Mobil and the US Integrateds are covered by Barclays Integrated oil research team, headed by Paul Cheng, in New York. The forecasts for these companies are based on assumptions which are aligned but may sometimes differ from those used for the European companies.
EV:EBIDA, xBarclays
2013Cons 2014
P/E, x Dividend yield, % RoACE, %FCF yield, %

Barclays | Global Oil & Gas Weekly
29 April 2014 12
Valuations Integrateds
EV:EBIDA, x P/E, x Dividend yield, %
0
5
10
15
20
BPC
VX
XO
MRD
STO
T
BG ENI
Gal
pM
OL
OM
VRE
PST
L
CO
PH
ESM
UR
EV/EBIDA 2014 Average
0
10
20
30
40
BPC
VX
XO
MRD
STO
T
BG ENI
Gal
pM
OL
OM
VRE
PST
L
CO
PH
ESM
UR
P/E 2014 Average
01234567
BPC
VX
XO
MRD
STO
T
BG ENI
Gal
pM
OL
OM
VRE
PST
L
CO
PH
ESM
UR
Dividend Yield, % 2014 Average
Free cash flow yield, % RoACE, % Gearing - Net Debt to Equity, %
-5
0
5
10
BPC
VX
XO
MRD
STO
T
BG ENI
Gal
pM
OL
OM
VRE
PST
L
CO
PH
ESM
UR
FCF Yield, % 2014 Average
0
5
10
15
20
BPC
VX
XO
MRD
STO
T
BG ENI
Gal
pM
OL
OM
VRE
PST
L
CO
PH
ESM
UR
RoACE, % 2014 Average
0102030405060
BPC
VX
XO
MRD
STO
T
BG ENI
Gal
pM
OL
OM
VRE
PST
L
CO
PH
ESM
UR
2013 2014
Datastream consensus e relative to Barclays EPS, % Dollar EPS change y/y, % EV/b, $
-10-8-6-4-202
BPC
VX
XO
MRD
STO
T
BG ENI
Gal
pM
OL
OM
VRE
PST
L
CO
PH
ESM
UR
Cons vs BC EPS (%) 2014 Average
-0.40-0.30-0.20-0.100.000.100.20
BPC
VX
XO
MRD
STO
T
BG ENI
Gal
pM
OL
OM
VRE
PST
L
CO
PH
ESM
UR
EPS Growth 2014 Average
0
5
10
15
20
25
BPC
VX
XO
MRD
STO
T
BG ENI
Gal
pM
OL
OM
VRE
PST
L
CO
PH
ESM
UR
EV: 2P reserves 2014 Average
Source: Datastream, Barclays Research estimates
Barclays | Global Oil & Gas Weekly
29 April 2014 13
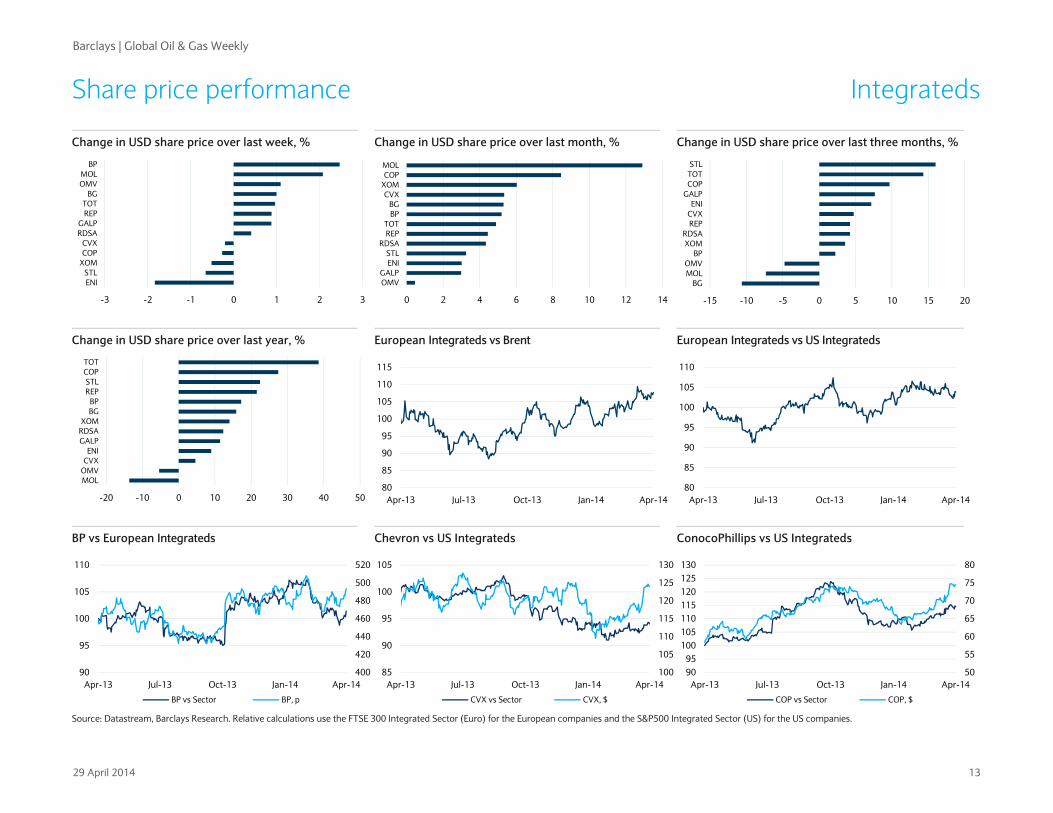
Share price performance Integrateds
Change in USD share price over last week, % Change in USD share price over last month, % Change in USD share price over last three months, %
-3 -2 -1 0 1 2 3
ENISTL
XOMCOPCVX
RDSAGALP
REPTOT
BGOMVMOL
BP
0 2 4 6 8 10 12 14
OMVGALP
ENISTL
RDSAREPTOT
BPBG
CVXXOMCOPMOL
-15 -10 -5 0 5 10 15 20
BGMOLOMV
BPXOMRDSA
REPCVXENI
GALPCOPTOTSTL
Change in USD share price over last year, % European Integrateds vs Brent European Integrateds vs US Integrateds
-20 -10 0 10 20 30 40 50
MOLOMVCVXENI
GALPRDSAXOM
BGBP
REPSTL
COPTOT
80
85
90
95
100
105
110
115
Apr-13 Jul-13 Oct-13 Jan-14 Apr-1480
85
90
95
100
105
110
Apr-13 Jul-13 Oct-13 Jan-14 Apr-14
BP vs European Integrateds Chevron vs US Integrateds ConocoPhillips vs US Integrateds
400
420
440
460
480
500
520
90
95
100
105
110
Apr-13 Jul-13 Oct-13 Jan-14 Apr-14
BP vs Sector BP, p
100
105
110
115
120
125
130
85
90
95
100
105
Apr-13 Jul-13 Oct-13 Jan-14 Apr-14
CVX vs Sector CVX, $
50
55
60
65
70
75
80
9095
100105110115120125130
Apr-13 Jul-13 Oct-13 Jan-14 Apr-14
COP vs Sector COP, $
Source: Datastream, Barclays Research. Relative calculations use the FTSE 300 Integrated Sector (Euro) for the European companies and the S&P500 Integrated Sector (US) for the US companies.

Barclays | Global Oil & Gas Weekly
29 April 2014 14
Share price performance Integrateds
Exxon Mobil vs US Integrateds Royal Dutch Shell A vs Royal Dutch Shell B Royal Dutch Shell A vs European Integrateds
80
85
90
95
100
105
90
94
98
102
106
110
Apr-13 Jul-13 Oct-13 Jan-14 Apr-14XOM vs Sector XOM, $
94
95
96
97
98
99
100
101
Apr-13 Jul-13 Oct-13 Jan-14 Apr-14
2000
2250
2500
2750
3000
85
88
91
94
97
100
103
Apr-13 Jul-13 Oct-13 Jan-14 Apr-14RDSA vs Sector RDSA, p
Total vs European Integrateds BG Group vs European Integrateds Eni vs European Integrateds
34363840424446485052
859095
100105110115120125
Apr-13 Jul-13 Oct-13 Jan-14 Apr-14TOT vs Sector TOT, E
900
1000
1100
1200
1300
1400
70
80
90
100
110
120
130
Apr-13 Jul-13 Oct-13 Jan-14 Apr-14BG vs Sector BG, p
14
15
16
17
18
19
20
80
85
90
95
100
105
Apr-13 Jul-13 Oct-13 Jan-14 Apr-14ENI vs Sector ENI, E
Galp vs European Integrateds Repsol vs European Integrateds Statoil vs European Integrateds
101111121213131414
80
85
90
95
100
105
110
115
Apr-13 Jul-13 Oct-13 Jan-14 Apr-14GALP vs Sector GALP, E
121314151617181920
90
95
100
105
110
115
Apr-13 Jul-13 Oct-13 Jan-14 Apr-14REP vs Sector REP, E
110
120
130
140
150
160
170
180
80
85
90
95
100
105
110
115
Apr-13 Jul-13 Oct-13 Jan-14 Apr-14STL vs Sector STL, NOK
Source: Datastream, Barclays Research. Relative calculations use the FTSE 300 Integrated Sector (Euro) for the European companies and the S&P500 Integrated Sector (US) for the US companies.

Barclays | Global Oil & Gas Weekly
29 April 2014 15
Share price performance Integrateds
BP vs Total BP vs Shell Total vs Eni
70
75
80
85
90
95
100
105
110
Apr-13 Jul-13 Oct-13 Jan-14 Apr-14
80
85
90
95
100
105
110
115
Apr-13 Jul-13 Oct-13 Jan-14 Apr-14
80
90
100
110
120
130
Apr-13 Jul-13 Oct-13 Jan-14 Apr-14
Total vs Shell BG vs Statoil Eni vs Repsol
70
80
90
100
110
120
130
Apr-13 Jul-13 Oct-13 Jan-14 Apr-14
60
70
80
90
100
110
120
130
Apr-13 Jul-13 Oct-13 Jan-14 Apr-14
60
70
80
90
100
110
Apr-13 Jul-13 Oct-13 Jan-14 Apr-14
OMV vs Repsol BG vs Eni Eni vs Statoil
60
70
80
90
100
110
Apr-13 Jul-13 Oct-13 Jan-14 Apr-14
50
70
90
110
130
150
Apr-13 Jul-13 Oct-13 Jan-14 Apr-14
70
80
90
100
110
120
Apr-13 Jul-13 Oct-13 Jan-14 Apr-14
Source: Datastream, Barclays Research

Barclays | Global Oil & Gas Weekly
29 April 2014 16
Share price performance Integrateds Local Price
25-Apr -1d -5d -10d -30d MTD QTD YTD 1Q 14 4Q 13 3Q 13 2Q 13 1Q 13 4Q 12
Indices & marketsFTSE All 3581 -0.3 0.8 2.1 2.8 1.6 1.6 0.7 -0.9 7.1 9.7 -3.1 2.1 33.8StoxxEuro 321 -1.1 -0.1 0.5 3.4 -0.4 -0.4 2.5 2.9 7.9 14.6 0.0 -0.6 14.5S&P 500 1863 -0.8 -0.1 2.6 1.2 -0.5 -0.5 0.8 1.3 9.1 4.1 2.8 10.0 38.8MSCI EMG 1920 -0.4 0.2 1.3 2.9 0.2 0.2 0.3 0.0 4.9 9.8 -1.7 4.4 19.9Hang Seng 22224 -1.5 -2.4 -3.4 3.3 0.4 0.4 -4.6 -5.0 2.0 9.9 -6.6 -1.7 13.2
Integrated - MajorsBP 494 0.9 2.4 4.4 4.6 3.7 3.7 2.6 -1.0 15.4 0.6 -1.4 1.1 39.3Chevron 124 -0.2 0.3 5.9 8.7 4.3 4.3 -0.7 -4.8 3.0 2.0 -1.1 9.9 60.3ExxonMobil 100.4 0.4 0.0 3.8 7.4 2.8 2.8 -0.8 -3.5 17.7 -4.7 -0.5 4.1 52.9Royal Dutch Shell A 27.3 -0.2 0.2 2.9 5.8 3.3 3.3 5.8 2.4 9.0 3.1 -1.4 -5.5 39.2Royal Dutch Shell B 2402 -0.2 0.4 2.7 5.9 3.5 3.5 6.9 3.3 10.1 3.9 -0.8 -6.2 50.5Total 49.6 -0.5 0.7 3.6 7.2 4.7 4.7 11.9 6.9 5.1 18.8 1.6 -6.7 15.1Arithmetic Average 0.0 0.7 3.9 6.6 3.7 3.7 4.3 0.6 10.0 3.9 -0.6 -0.6 42.9
Integrated - EuropeBG Group 1145 -0.4 1.0 3.4 8.1 3.3 3.3 -10.4 -13.3 12.8 11.1 -1.4 4.2 8.7Eni 18.4 -1.6 -2.1 1.2 6.9 1.6 1.6 5.8 4.1 3.1 10.2 -8.9 -6.9 32.0Galp 12.7 0.2 0.7 1.9 7.4 1.5 1.5 6.8 5.2 -3.0 9.9 -5.8 1.2 2.1OMV 32.0 -1.4 0.9 0.9 1.4 -2.4 -2.4 -7.6 -5.3 -2.6 4.4 5.8 18.1 20.3Repsol 18.9 -0.3 0.7 1.7 8.1 2.5 2.5 3.7 1.1 3.1 18.1 3.5 0.7 5.7Statoil 173 0.8 -0.9 3.6 4.1 2.3 2.3 19.2 16.5 7.5 8.7 -15.5 -3.1 32.9Arithmetic Average -0.4 0.0 2.1 6.0 1.5 1.5 2.9 1.4 3.5 10.4 -3.7 2.4 16.9
Integrated - USConocoPhillips 74.4 -0.1 -0.5 5.0 11.7 5.8 5.8 5.3 -0.4 0.9 13.5 0.0 3.6 55.7Cenovus Energy 32.5 -0.2 0.6 1.2 12.0 1.8 1.8 3.1 1.2 -4.1 4.7 -8.8 -7.4 29.8Hess 87.4 -1.0 0.2 4.6 8.9 5.5 5.5 5.3 -0.1 5.5 15.9 -9.6 35.2 6.0Husky Energy 35.4 -0.9 -2.8 0.2 8.8 6.9 6.9 1.3 -5.3 10.5 8.0 -7.2 -2.8 24.5Imperial Oil 53.0 -0.3 1.5 1.8 4.3 3.0 3.0 8.5 5.4 1.4 15.1 -6.6 -4.8 17.7Murphy 63.7 -1.6 -0.3 6.9 5.8 1.4 1.4 -1.8 -3.1 6.6 14.2 -3.8 7.0 21.7Suncor 41.0 0.0 0.8 3.1 13.6 6.2 6.2 6.0 -0.2 -2.6 21.4 -3.1 -8.8 11.6Arithmetic Average -0.6 -0.1 3.3 9.3 4.4 4.4 3.9 -0.4 2.6 13.3 -5.6 3.2 23.8
Source: Datastream, Barclays Research. The European Market is the Eurostoxx, the European Integrateds, is the corresponding FTSE 300 index. The Barclays European Refining Index is calculated using arithmetic averages for
companies under coverage. The Barclays European Services Index is calculated using market capitalisation weighted averaged for companies under coverage. The Barclays E&Ps Index is calculated using a free float weighted
average for our coverage.

Barclays | Global Oil & Gas Weekly
29 April 2014 17
Refiners

Barclays | Global Oil & Gas Weekly
29 April 2014 18
Valuations RefinersChange in
Price Target Up/(Down) cons in
Company Rating 25-Apr Price side, % 13F 14F 15F 13F 14F 15F 13F 14F 15F 13F 14F 15F 13F 14F 15F EPS EPS last mnth
Refiners - EuropeHellenic E/W 6.28 9.00 43 6.4 5.8 5.5 7.6 7.0 7.0 15.2 16.5 16.5 7.2 7.2 7.2 7.2 7.9 7.9 0.82 0.34 -15
Grupa Lotos E/W 39.1 34.0 (13) 8.8 9.0 8.9 11.5 12.8 13.0 5.5 4.6 4.5 0.0 0.0 0.0 4.0 3.5 3.5 3.38 4.35 0
Motor Oil O/W 8.85 9.50 7 6.9 6.7 6.3 8.7 9.3 9.3 16.6 15.8 15.8 5.6 5.6 5.6 10.9 11.1 11.1 1.02 0.85 -13
Neste Oil U/W 14.78 15.0 1 7.7 6.5 6.1 14.5 12.2 12.0 7.1 9.9 9.9 4.5 4.6 4.7 6.8 6.8 6.8 1.02 1.22 -2
PKN Orlen U/W 45.1 40.0 (11) 5.5 4.5 3.7 12.6 9.8 8.6 9.4 12.4 23.6 0.0 0.0 0.0 5.9 7.1 7.1 3.57 2.80 -8
Saras U/W 1.25 1.00 (20) 5.3 4.9 4.3 50 52 41.3 10.1 10.0 10.5 0.0 0.0 0.0 2.7 3.6 3.6 0.03 -0.02 -13
Tupras U/W 47.7 42.8 (10) 8.5 8.0 - 7.9 9.5 - 3 6.9 - 8.5 8.8 - 16.9 14.0 - 6.01 4.57 -2
Arithmetic average 0 8.1 6.7 6.1 14.7 14.5 13.5 6.3 11.7 14.1 3.5 3.7 3.0 7.5 7.6 6.7 -9
Refiners - US*Alon USA Energy U/W 16.4 14.0 (15) 7.1 9.9 6.7 13.1 27.4 13.1 8.6 5.4 10.3 1.8 2.8 3.0 9.3 9.0 9.0 1.25 0.86 14
Delek US Holdings O/W 31.2 35.0 12 7.3 8.0 5.8 13.6 15.2 9.6 2.9 0.2 9.0 2.4 3.0 3.7 14.2 17.2 17.2 2.30 2.38 -4
Tesoro O/W 55.0 100 82 5.6 5.2 4.8 9.5 8.0 6.9 4.6 3.3 3.3 2.4 3.1 3.8 16.5 17.4 17.4 5.80 5.30 -9
Valero O/W 56.7 70.0 24 6.0 6.1 6.0 8.9 9.9 9.9 7.5 6.5 6.6 1.8 2.1 2.5 14.9 12.0 12.0 6.35 6.07 3
Arithmetic average 26 6.5 7.3 5.8 11.3 15.1 9.9 5.9 3.8 7.3 2.1 2.8 3.3 13.7 13.9 13.9 1
The price targets for the European companies are based on a sum-of-the-parts based DCF methodology. For the US they are based on an assumed discount to the estimated greenfield replacement value.
RoACE, %Barclays
2014Cons 2014
Dividend yield, %EV:EBIDA, x P/E, x FCF yield, %
Source: Company data, Datastream, Barclays Research. *The US Refiners are covered by Barclays Integrated oil research team, headed by Paul Cheng, in New York.

Barclays | Global Oil & Gas Weekly
29 April 2014 19
Valuations Refiners
EV:EBIDA, x P/E, x Dividend yield, %
0
2
4
6
8
10
HEP
LOT
MO
H
NES
T
PKN
SRS
TUP
ALJ DK
TSO
VLO
EV/EBIDA 2014 Average
0
5
10
15
20
HEP
LOT
MO
H
NES
T
PKN
SRS
TUP
ALJ DK
TSO
VLO
P/E 2014 Average
0
2
4
6
8
10
HEP
LOT
MO
H
NES
T
PKN
SRS
TUP
ALJ DK
TSO
VLO
Dividend Yield, % 2014 Average
Free cash flow yield, % RoACE, % Gearing - Net Debt to Equity, %
-20
-10
0
10
20
HEP
LOT
MO
H
NES
T
PKN
SRS
TUP
ALJ DK
TSO
VLO
FCF Yield, % 2014 Average
0
5
10
15
20
HEP
LOT
MO
H
NES
T
PKN
SRS
TUP
ALJ DK
TSO
VLO
RoACE, % 2014 Average
-50
0
50
100
150
200
HEP
LOT
MO
H
NES
T
PKN
SRS
TUP
ALJ DK
TSO
VLO
2013 2014
Datastream consensus e relative to Barclays EPS, % Dollar EPS change y/y, % EV: Capital employed, x
-20
30
80
130
180
HEP
LOT
MO
H
NES
T
PKN
SRS
TU
P
ALJ DK
TSO
VLO
Cons vs BC EPS (%) 2014 Average
-100%
-50%
0%
50%
100%
HEP
LOT
MO
H
NES
T
PKN
SRS
TUP
ALJ DK
TSO
VLO
EPS Growth 2014 Average
0.0
0.5
1.0
1.5
2.0
HEP
LOT
MO
H
NES
T
PKN
SRS
TUP
ALJ DK
TSO
VLO
EV/Capital Employed 2014 Average
Source: Datastream, Barclays estimates

Barclays | Global Oil & Gas Weekly
29 April 2014 20
Share price performance Refiners
Change in USD share price over last week, % Change in USD share price over last month, % Change in USD share price over last three months, %
-6 -4 -2 0 2 4
ELPESRSORL
BrentESSRMOH
SectorNES1V
LTSTUPRS
PKN
-15 -10 -5 0 5 10 15
ELPEMOH
SRSESSR
NES1VSectorBrent
LTSORLPKN
TUPRS
-20 -10 0 10 20 30 40 50 60
ELPEORL
BrentMOHESSR
NES1VLTS
SectorPKN
TUPRSSRS
Change in USD share price over last year, % European Refiners vs Brent European Refiners vs US Refiners
-60 -40 -20 0 20 40
ESSRORL
ELPETUPRS
PKNSector
LTSBrentMOH
SRSNES1V
70
75
80
85
90
95
100
105
110
Apr-13 Jul-13 Oct-13 Jan-14 Apr-14
60
70
80
90
100
110
120
130
140
Apr-13 Jul-13 Oct-13 Jan-14 Apr-14
Essar vs European Refiners Hellenic Petroleum vs European Refiners Lotos Group vs European Refiners
50
70
90
110
130
150
170
40
50
60
70
80
90
100
110
Apr-13 Jul-13 Oct-13 Jan-14 Apr-14ESSAR vs Sector ESSR, p
2345678910
5060708090
100110120130
Apr-13 Jul-13 Oct-13 Jan-14 Apr-14ELPE vs Sector ELPE, E
20
25
30
35
40
45
80859095
100105110115120
Apr-13 Jul-13 Oct-13 Jan-14 Apr-14LTS vs Sector LTS, PLN
Source: Datastream, Barclays Research. The European Market is the Eurostoxx, the European Integrateds, is the corresponding FTSE 300 index. The Barclays European Refining Index is calculated using arithmetic averages for companies under coverage. The Barclays European Services Index is calculated using market capitalisation weighted averaged for companies under coverage. The Barclays E&Ps Index is calculated using a free float weighted average for our coverage.

Barclays | Global Oil & Gas Weekly
29 April 2014 21
Share price performance Refiners
Motor Oil vs European Refiners Neste Oil vs European Refiners ORL vs European Refiners
234567891011
50
70
90
110
130
150
Apr-13 Jul-13 Oct-13 Jan-14 Apr-14MOH vs Sector MOH, E
4
8
12
16
20
60708090
100110120130140150160
Apr-13 Jul-13 Oct-13 Jan-14 Apr-14NES1V vs Sector NES1V, E
80
100
120
140
160
180
40
50
60
70
80
90
100
110
Apr-13 Jul-13 Oct-13 Jan-14 Apr-14ORL vs Sector ORL, ILS
PKN Orlen vs European Refiners Saras vs European Refiners Tupras vs European Refiners
25
35
45
55
65
60
70
80
90
100
110
120
Apr-13 Jul-13 Oct-13 Jan-14 Apr-14PKN vs Sector PKN, PLN
0.50.60.70.80.91.01.11.21.31.4
60708090
100110120130140
Apr-13 Jul-13 Oct-13 Jan-14 Apr-14SRS vs Sector SRS, E
202530354045505560
50
60
70
80
90
100
110
Apr-13 Jul-13 Oct-13 Jan-14 Apr-14Tupras vs Sector TUPRS, TRY
Source: Datastream, Barclays Research. The European Market is the Eurostoxx, the European Integrateds, is the corresponding FTSE 300 index. The Barclays European Refining Index is calculated using arithmetic averages for companies under coverage. The Barclays European Services Index is calculated using market capitalisation weighted averaged for companies under coverage. The Barclays E&Ps Index is calculated using a free float weighted average for our coverage.

Barclays | Global Oil & Gas Weekly
29 April 2014 22
Share price performance Refiners
PKN Orlen vs Lotos Group Saras vs Motor Oil Saras vs Neste
60
70
80
90
100
110
Apr-13 Jul-13 Oct-13 Jan-14 Apr-14
40
60
80
100
120
140
Apr-13 Jul-13 Oct-13 Jan-14 Apr-14
50
60
70
80
90
100
110
120
130
Apr-13 Jul-13 Oct-13 Jan-14 Apr-14
Neste vs Tupras Tupras vs Saras Hellenic vs Motor Oil
60
80
100
120
140
160
180
Apr-13 Jul-13 Oct-13 Jan-14 Apr-14
40
60
80
100
120
140
Apr-13 Jul-13 Oct-13 Jan-14 Apr-14
60
80
100
120
140
160
Apr-13 Jul-13 Oct-13 Jan-14 Apr-14
Essar vs Neste
10
30
50
70
90
110
130
Apr-13 Jul-13 Oct-13 Jan-14 Apr-14
Source: Datastream, Barclays.

Barclays | Global Oil & Gas Weekly
29 April 2014 23
Share price performance RefinersLocal Price
25-Apr -1d -5d -10d -30d MTD QTD YTD 1Q 14 4Q 13 3Q 13 2Q 13 1Q 13 4Q 12
Indices & marketsFTSE All 3581 -0.3 0.8 2.1 2.8 1.6 1.6 0.7 -0.9 7.1 9.7 -3.1 2.1 33.8StoxxEuro 321 -1.1 -0.1 0.5 3.4 -0.4 -0.4 2.5 2.9 7.9 14.6 0.0 -0.6 14.5S&P 500 1863 -0.8 -0.1 2.6 1.2 -0.5 -0.5 0.8 1.3 9.1 4.1 2.8 10.0 38.8MSCI EMG 1920 -0.4 0.2 1.3 2.9 0.2 0.2 0.3 0.0 4.9 9.8 -1.7 4.4 19.9Refiners - EuropeHellenic 6.28 -3.0 -4.8 -5.5 -17.7 -13.3 -13.3 -16.8 -4.1 0.6 14.1 -5.0 -1.4 32.8Grupa Lotos 39.1 2.0 0.3 -0.7 6.1 2.1 2.1 9.2 7.0 -1.1 6.6 -14.3 -5.5 57.2MOL 13195 1.8 1.7 -1.3 6.8 4.7 4.7 -12.3 -16.2 -8.1 -2.7 5.9 -12.4 -4.5Motor Oil 8.85 0.7 -0.2 -1.5 -10.4 -6.5 -6.5 8.1 15.6 9.2 10.2 -2.4 -11.1 25.2Neste Oil 14.78 -5.0 0.1 -1.2 -0.5 0.3 0.3 3.3 3.0 -10.4 48.7 3.4 9.7 -11.0ORL 0.98 -0.5 -1.3 -2.9 2.2 1.9 1.9 -12.5 -11.6 -8.1 -14.1 -15.6 -2.0 26.2PKN Orlen 45.1 -1.3 3.0 0.3 11.2 3.6 3.6 9.1 5.3 -5.8 -1.5 -11.5 -1.2 50.4Saras 1.25 -0.6 -2.2 -2.6 13.0 -0.9 -0.9 51.2 52.6 -7.7 -1.7 6.4 -6.8 -37.0Tupras 47.7 1.1 2.0 1.5 17.7 5.5 5.5 11.9 6.1 -7.2 -12.7 -19.8 5.3 56.3Arithmetic Average -0.5 -0.2 -1.5 3.2 -0.3 -0.3 5.7 6.4 -4.3 5.2 -5.9 -2.8 21.7
Refiners - USAlon 16.4 -0.4 4.3 16.8 3.0 9.9 9.9 -0.7 -9.7 62.3 -27.4 -23.0 5.3 200.0Delek 31.2 0.0 -0.1 11.2 1.3 7.5 7.5 -9.3 -15.6 61.9 -24.8 -27.1 55.8 245.4HollyFrontier 51.9 0.8 2.1 12.3 4.3 9.0 9.0 4.4 -4.2 18.8 3.4 -16.7 10.5 262.0Marathon Petroleum 90.7 0.0 0.9 8.9 -3.5 4.2 4.2 -1.1 -5.1 42.7 -8.6 -20.9 42.2 NASunCoke Energy 20.7 -4.5 -5.3 -4.6 -4.6 -9.2 -9.2 -9.1 0.1 32.9 21.1 -12.0 4.7 NATesoro 55.0 1.5 4.0 15.9 3.4 8.7 8.7 -6.0 -13.5 35.7 -15.3 -8.0 32.9 298.3Valero 56.7 0.2 1.2 11.2 4.5 6.7 6.7 12.4 5.4 48.9 -0.3 -15.4 33.3 97.7Arithmetic Average -0.3 1.0 10.2 1.2 5.3 5.3 -1.3 -6.1 43.3 -7.4 -17.6 26.4 220.7
Source: Datastream, Barclays Research. The European Market is the Eurostoxx, the European Integrateds, is the corresponding FTSE 300 index. The Barclays European Refining Index is calculated using arithmetic averages for companies
under coverage. The Barclays European Services Index is calculated using market capitalisation weighted averaged for companies under coverage. The Barclays E&Ps Index is calculated using a free float weighted average for our coverage.

Barclays | Global Oil & Gas Weekly
29 April 2014 24
Services

Barclays | Global Oil & Gas Weekly
29 April 2014 25
Valuations ServicesChange in
Price Target Up/(Down) cons in
Company Rating 25-Apr Price side, % 13F 14F 15F 13F 14F 15F 13F 14F 15F 13F 14F 15F 13F 14F 15F EPS EPS last mnth
Services - EuropeAker Solutions U/W 100 106 6 9.7 8.1 7.8 21.1 13.4 10.9 (6.7) 8.2 8.7 4.0 3.7 4.1 8.7 11.3 13.9 7.45 7.68 -2CGG Veritas U/W 12.3 13.6 10 (11.5) 21.4 13.8 (4.1) 17.6 9.7 (52) (28) (13) 0.0 0.0 0.0 (8.0) 4.1 5.8 0.70 0.61 -15Hunting O/W 869 1050 21 11.7 10.7 9.1 14.5 14.0 12.3 11.9 9.3 18.5 3.4 3.5 3.9 8.3 9.2 10.1 100.70 97.82 60Maire Tecnimont O/W 2.63 3.25 24 21.5 11.6 8.8 48.1 14.4 11.0 (24) (0.3) 8.4 0.0 0.0 0.0 5.6 13.1 13.1 0.18 0.15 -1Petrofac U/W 1443 1655 15 11.4 10.3 8.4 11.8 12.2 10.2 (8.5) 3.6 2.0 3.0 3.1 3.7 26.1 21.0 21.9 1.99 1.98 0PGS O/W 71.5 93.0 30 7.7 7.6 6.3 10.2 7.3 7.1 (5.0) (2.5) (1.6) 1.2 4.6 5.5 9.3 8.3 10.1 1.16 1.27 -4Polarcus E/W 4.31 6.4 48 5.0 4.8 4.1 9.3 5.1 3.8 1.0 2.4 6.8 0.0 0.0 0.0 0.5 0.5 0.4 0.14 0.11 -11Saipem E/W 19.5 20.0 3 23.3 10.9 7.4 nm 24.8 11.8 (5.6) 6.5 12.8 0.0 1.3 2.8 (1.1) 4.7 8.3 0.79 0.81 1SBM Offshore O/W 13.0 18.4 41 nm 7.0 7.5 30.1 8.2 5.3 (30) (20) (21) 0.0 0.0 0.0 4.6 10.5 12.3 1.60 1.69 -4Subsea 7 O/W 113 175 55 9.0 6.4 5.9 18.9 10.3 8.8 4.5 2.3 2.6 3.3 3.2 3.6 5.2 9.1 9.9 1.83 1.89 0Technip O/W 82.3 100 22 9.1 9.4 6.8 17.5 17.4 12.4 7.8 5.9 10.2 2.2 2.7 3.0 9.8 9.3 12.7 4.72 4.82 -2Tecnicas Reunidas E/W 42.6 49 15 13.8 11.0 7.8 16.6 14.1 12.4 6.4 9.2 9.3 3.3 3.9 4.4 26.3 27.6 27.0 3.03 2.65 -1TGS U/W 200 185 -7 5.2 4.5 4.3 12.8 12.4 11.9 2.3 6.1 5.9 4.3 4.7 4.2 22.2 20.2 19.2 2.70 2.59 1Wood Group O/W 792 1025 30 12.1 11.1 9.4 12.2 12.1 10.8 4.9 7.4 7.7 1.5 1.5 1.7 14.3 13.9 15.0 0.65 0.63 0Arithmetic average 22 9.9 9.6 7.7 16.9 13.1 9.9 (6.7) 0.8 4.1 1.9 2.3 2.6 9.4 11.6 12.8 2Source: Company data, Datastream , Barclays Research - Price targets are base d on a sum-of- the-parts based DC F methodology.
Barclays 2014
Cons 2014
RoACE, %EV:EBIDA, x P/E, x FCF yield, % Dividend yield, %

Barclays | Global Oil & Gas Weekly
29 April 2014 26
Valuations Services
EV:EBIDA, x P/E, x Dividend yield, %
-10-505
1015
AKS
O
CG
G
HT
G
MT
PFC
PLC
S
PGS
SPM
SBM
SUB
TEC
TR
S
TG
S
WG
EV/EBIDA 2014 Average
05
1015202530
AKS
O
CG
G
HTG M
T
PFC
PLC
S
PGS
SPM
SBM
SUB
TEC
TRS
TGS
WG
P/E 2014 Average
0
1
2
3
4
5
AKS
O
CG
G
HTG M
T
PFC
PLC
S
PGS
SPM
SBM
SUB
TEC
TRS
TGS
WG
Dividend Yield, % 2014 Average
Free cash flow yield, % RoACE, % Gearing - Net Debt to Equity, %
-10
-5
0
5
10
15
AKS
O
CG
G
HTG M
T
PFC
PLC
S
PGS
SPM
SBM
SUB
TEC
TRS
TGS
WG
FCF Yield, % 2014 Average
05
1015202530
AKS
O
CG
G
HTG M
T
PFC
PLC
S
PGS
SPM
SBM
SUB
TEC
TRS
TGS
WG
RoACE, % 2014 Average
-2000
200400600800
1000
AKS
O
CG
G
HTG M
T
PFC
PLC
S
PGS
SPM
SBM
SUB
TEC
TRS
TGS
WG
2013 2014
Datastream consensus e relative to Barclays EPS, % Dollar EPS change y/y, % EV:Capital Employed, x
-20
-10
0
10
20
AKS
O
CG
G
HTG M
T
PFC
PLC
S
PGS
SPM
SBM
SUB
TEC
TRS
TGS
WG
Cons vs BC EPS (%) 2014 Average
-100%
0%
100%
200%
300%
AKS
O
CG
G
HT
G
MT
PFC
PLC
S
PGS
SPM
SBM
SUB
TEC
TR
S
TG
S
WG
EPS Growth 2014 Average
-4
1
6
11
16
AKS
O
CG
G
HTG M
T
PFC
PLC
S
PGS
SPM
SBM
SUB
TEC
TRS
TGS
WG
EV/Capital Employed 2014 Average
Source: Datastream, Barclays Research estimates

Barclays | Global Oil & Gas Weekly
29 April 2014 27
Share price performance Services
Change in USD share price over last week, % Change in USD share price over last month, % Change in USD share price over last three months, %
-2 0 2 4 6 8 10 12
BrentSBMO
PFCHTGPGSTRE
AMCSPMWG
SectorAKSO
SUBCGGTECMT
0 5 10 15 20
PFCBrent
PGSWG
HTGSUB
AKSOTRE
SBMOSector
CGGMT
TECAMCSPM
-20 0 20 40 60
SBMOSUB
BrentAKSO
CGGPGSTRE
HTGSector
SPMWG
AMCPFCTECMT
Change in USD share price over last year, % European Services vs US Services Amec vs European Services
-50 0 50 100 150 200 250
CGGPGSSUB
AKSOSPM
SectorTECWG
BrentSBMO
PFCHTGTRE
AMCMT
50
60
70
80
90
100
110
Apr-13 Jul-13 Oct-13 Jan-14 Apr-14
700
900
1100
1300
70
80
90
100
110
120
130
140
Apr-13 Jul-13 Oct-13 Jan-14 Apr-14AMEC vs Sector AMEC, p
Aker Solutions vs European Services CGG Veritas vs European Services Maire Tecnimont vs European Services
405060708090100110120
65707580859095
100105110
Apr-13 Jul-13 Oct-13 Jan-14 Apr-14AKSO vs Sector AKSO, NOK
8
12
16
20
24
28
32
65
75
85
95
105
115
125
135
Apr-13 Jul-13 Oct-13 Jan-14 Apr-14CGG vs Sector CGG, E
0.0
0.5
1.0
1.5
2.0
2.5
3.0
3.5
1060
110160210260310360410
Apr-13 Jul-13 Oct-13 Jan-14 Apr-14MT vs Sector MT, E
Source: Datastream, Barclays Research. Relative calculations use the Barclays Oil Services Index calculated as a market capitalisation weighted average for companies under coverage

Barclays | Global Oil & Gas Weekly
29 April 2014 28
Share price performance Services
Petrofac vs European Services PGS vs European Services Saipem vs European Services
1000
1100
1200
1300
1400
1500
1600
60
70
80
90
100
110
120
130
Apr-13 Jul-13 Oct-13 Jan-14 Apr-14PFC vs Sector PFC, p
40
50
60
70
80
90
100
6065707580859095
100105
Apr-13 Jul-13 Oct-13 Jan-14 Apr-14PGS vs Sector PGS, NOK
10
12
14
16
18
20
22
24
10
30
50
70
90
110
130
Apr-13 Jul-13 Oct-13 Jan-14 Apr-14SPM vs Sector SPM, E
SBM Offshore vs European Services Subsea 7 vs European Services Technip vs European Services
0
5
10
15
20
25
40
60
80
100
120
140
160
Apr-13 Jul-13 Oct-13 Jan-14 Apr-14SBMO vs Sector SBMO, E
80
100
120
140
160
80
85
90
95
100
105
110
Apr-13 Jul-13 Oct-13 Jan-14 Apr-14SUB vs Sector SUB, NOK
60
65
70
75
80
85
90
95
80859095
100105110115120
Apr-13 Jul-13 Oct-13 Jan-14 Apr-14TEC vs Sector TEC, E
Tecnicas Reunidas vs European Services Wood Group vs European Services
30
32
34
36
38
40
42
44
80
90
100
110
120
130
140
Apr-13 Jul-13 Oct-13 Jan-14 Apr-14TRE vs Sector TRE, E
600
650
700
750
800
850
900
950
80859095
100105110115120125
Apr-13 Jul-13 Oct-13 Jan-14 Apr-14WG vs Sector WG, p
Source: Datastream, Barclays Research. Relative calculations use the Barclays Oil Services Index calculated as a market capitalisation weighted average for companies under coverage.
Barclays | Global Oil & Gas Weekly
29 April 2014 29
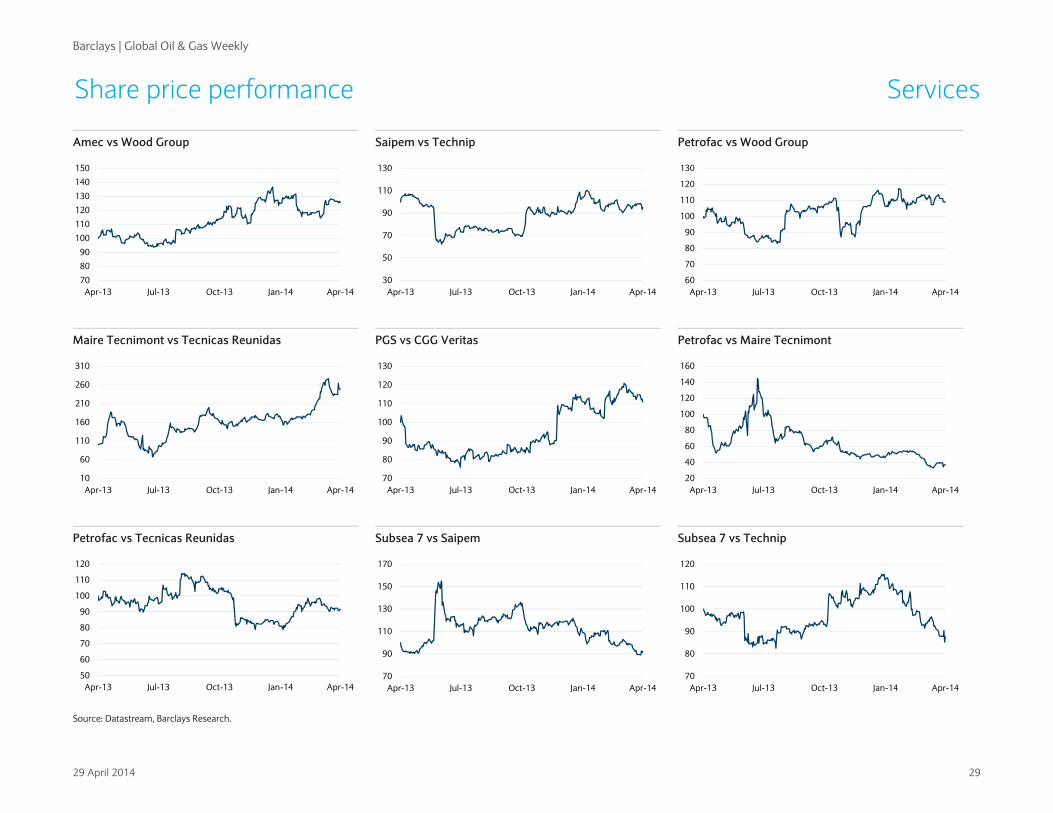
Share price performance Services
Amec vs Wood Group Saipem vs Technip Petrofac vs Wood Group
70
80
90
100
110
120
130
140
150
Apr-13 Jul-13 Oct-13 Jan-14 Apr-14
30
50
70
90
110
130
Apr-13 Jul-13 Oct-13 Jan-14 Apr-14
60
70
80
90
100
110
120
130
Apr-13 Jul-13 Oct-13 Jan-14 Apr-14
Maire Tecnimont vs Tecnicas Reunidas PGS vs CGG Veritas Petrofac vs Maire Tecnimont
10
60
110
160
210
260
310
Apr-13 Jul-13 Oct-13 Jan-14 Apr-14
70
80
90
100
110
120
130
Apr-13 Jul-13 Oct-13 Jan-14 Apr-14
20
40
60
80
100
120
140
160
Apr-13 Jul-13 Oct-13 Jan-14 Apr-14
Petrofac vs Tecnicas Reunidas Subsea 7 vs Saipem Subsea 7 vs Technip
50
60
70
80
90
100
110
120
Apr-13 Jul-13 Oct-13 Jan-14 Apr-14
70
90
110
130
150
170
Apr-13 Jul-13 Oct-13 Jan-14 Apr-14
70
80
90
100
110
120
Apr-13 Jul-13 Oct-13 Jan-14 Apr-14
Source: Datastream, Barclays Research.

Barclays | Global Oil & Gas Weekly
29 April 2014 30
Share price performance Services 25-Apr -1d -5d -10d -30d MTD QTD YTD 1Q 14 4Q 13 3Q 13 2Q 13 1Q 13 4Q 12
Indices & marketsFTSE All 3581 -0.3 0.8 2.1 2.8 1.6 1.6 0.7 -0.9 7.1 9.7 -3.1 2.1 33.8StoxxEuro 321 -1.1 -0.1 0.5 3.4 -0.4 -0.4 2.5 2.9 7.9 14.6 0.0 -0.6 14.5S&P 500 1863 -0.8 -0.1 2.6 1.2 -0.5 -0.5 0.8 1.3 9.1 4.1 2.8 10.0 38.8MSCI EMG 1920 -0.4 0.2 1.3 2.9 0.2 0.2 0.3 0.0 4.9 9.8 -1.7 4.4 19.9
Oil Services - EuropeAker 100 0.5 6.6 11.5 7.7 7.2 7.2 -6.5 -12.8 27.1 2.7 -27.5 -8.2 116.1AMEC 1238 -0.4 4.1 4.3 17.4 11.3 11.3 15.5 3.8 3.6 12.7 -5.2 -1.7 33.9CGG Veritas 12.3 2.5 7.1 3.9 13.3 6.3 6.3 -1.7 -7.5 -25.0 3.7 -2.2 -24.2 75.5Hunting 869 0.5 3.0 1.5 5.6 1.7 1.7 13.0 11.2 -0.4 6.3 -18.0 5.0 93.5Maire Tec 2.63 -0.4 9.6 5.0 43.9 -2.9 -2.9 62.0 66.9 8.5 41.5 -18.2 -10.7 -83.0Petrofac 1443 0.4 2.8 3.4 8.2 1.2 1.2 19.7 18.3 -11.6 23.4 -16.8 -17.5 53.0PGS 71.5 1.1 3.3 0.3 13.0 -2.1 -2.1 1.2 3.4 -5.1 0.4 -21.7 -9.9 111.9Polarcus 4.31 2.7 5.3 1.4 0.0 -7.5 -7.5 -7.1 0.5 19.7 -21.3 -26.2 -8.2 84.1Saipem 19.5 0.8 4.0 9.5 14.2 10.5 10.5 25.8 13.9 -3.2 23.5 -47.3 -20.3 26.0SBM 13.03 -0.7 0.6 -1.4 23.8 -1.0 -1.0 -11.6 -10.7 1.5 15.3 3.2 19.6 -2.5Subsea 7 113 1.6 6.9 5.7 7.3 1.0 1.0 -1.9 -2.9 -8.9 19.3 -25.7 -1.4 70.6Technip 82.3 -1.1 7.6 11.1 21.2 10.2 10.2 18.2 7.2 -18.6 13.5 -1.3 -10.3 102.2Tecnicas 42.6 0.2 3.5 3.6 11.2 4.2 4.2 8.2 3.9 17.0 -1.9 -2.3 1.5 0.6TGS 200 0.9 2.2 3.8 14.4 1.6 1.6 25.7 23.7 -10.6 1.1 -23.6 15.7 187.6Wood Group 792 0.2 4.7 6.5 10.7 4.1 4.1 17.1 12.5 -12.1 3.5 -7.0 11.4 147.9Arithmetic Average 0.6 4.4 4.3 13.2 2.8 2.8 11.2 8.3 -1.2 9.1 -15.3 -3.9 63.9
Source: Datastream, Barclays. The European Market is the Eurostoxx, the European Integrateds, is the corresponding FTSE 300 index. The Barclays European Refining Index is calculated using arithmetic averages for companies under coverage. The Barclays European Services Index is calculated using market capitalisation weighted averaged for companies under coverage. The Barclays E&Ps Index is calculated using a free float weighted average for our coverage.

Barclays | Global Oil & Gas Weekly
29 April 2014 31
Share price performance Services 25-Apr -1d -5d -10d -30d MTD QTD YTD 1Q 14 4Q 13 3Q 13 2Q 13 1Q 13 4Q 12
Indices & marketsFTSE All 3581 -0.3 0.8 2.1 2.8 1.6 1.6 0.7 -0.9 7.1 9.7 -3.1 2.1 33.8StoxxEuro 321 -1.1 -0.1 0.5 3.4 -0.4 -0.4 2.5 2.9 7.9 14.6 0.0 -0.6 14.5S&P 500 1863 -0.8 -0.1 2.6 1.2 -0.5 -0.5 0.8 1.3 9.1 4.1 2.8 10.0 38.8MSCI EMG 1920 -0.4 0.2 1.3 2.9 0.2 0.2 0.3 0.0 4.9 9.8 -1.7 4.4 19.9Oil Services - U.S.Baker Hughes 69.7 -0.1 2.0 10.0 12.8 7.2 7.2 26.1 17.7 11.3 5.2 0.9 13.6 -2.1Basic Energy Systems 26.03 -6.8 -7.5 -2.4 10.4 -5.0 -5.0 65.0 73.7 22.0 1.7 -3.7 19.8 52.9Bristow Group 76.2 0.3 2.7 5.3 3.6 0.9 0.9 1.5 0.6 0.8 10.7 0.4 22.9 82.8Cameron Int 64.6 -0.5 1.6 6.5 4.3 4.6 4.6 8.5 3.8 0.6 -4.4 -4.0 15.5 74.2CARBO 135.4 -0.9 -2.5 1.1 14.2 -1.9 -1.9 16.2 18.4 17.3 51.0 -23.4 16.2 7.2Chart industries 75.3 -3.6 -2.1 1.1 -10.4 -5.2 -5.2 -21.3 -16.9 -25.1 27.9 19.7 20.0 332.2Core Laboratories 190.7 -1.7 -11.2 -4.9 -0.7 -3.9 -3.9 -0.1 3.9 11.4 11.8 13.1 26.2 48.2Diamond Off 53.5 3.5 10.5 16.6 21.0 9.7 9.7 -6.0 -14.3 -8.8 -9.4 -0.6 2.4 6.5Dresser-Rand 61.2 0.5 2.4 6.8 11.6 4.8 4.8 2.6 -2.0 -4.8 0.5 -1.3 9.8 78.9Dril-Quip 113.7 -0.5 1.5 5.1 13.4 1.5 1.5 3.5 2.0 -5.4 24.8 5.5 19.3 65.9ENSCO 51.7 0.3 3.4 6.3 6.8 -2.1 -2.1 -9.7 -7.7 5.5 -7.3 -0.9 1.2 47.5Exterran Holdings 43.8 -0.5 0.1 2.7 14.8 -0.1 -0.1 28.2 28.3 21.8 -2.9 9.0 23.2 -15.4FMC Tech 56.8 -0.6 3.6 8.9 10.6 8.6 8.6 8.8 0.2 -7.1 -0.7 3.3 27.0 60.4Global Geophysical 0.10 -5.9 3.5 13.6 -91.7 -12.8 -12.8 -93.5 -92.6 -40.4 -42.0 101.7 -36.4 -43.9Gulfmark Offshore 44.5 0.0 -0.5 4.2 -0.2 -1.0 -1.0 -5.6 -4.6 -7.9 10.4 21.5 13.1 27.7Halliburton 62.9 -1.0 3.2 9.1 13.9 6.7 6.7 23.9 16.0 4.4 13.4 4.5 16.5 38.9Helmerich & Payne 107.0 0.0 -3.5 1.0 9.2 -0.5 -0.5 27.3 27.9 18.6 8.1 4.4 8.4 53.6Hercules Offshore 4.51 3.9 2.3 4.9 0.7 -1.7 -1.7 -30.8 -29.6 -13.2 4.6 -2.6 20.3 151.8Hornbeck Offshore 40.8 -2.0 1.2 7.0 5.2 -2.5 -2.5 -17.2 -15.1 -14.8 5.0 17.6 35.3 124.4ION Geophysical 4.39 -3.5 -5.2 6.6 7.6 4.3 4.3 33.0 27.6 -38.1 -13.9 -9.9 4.6 80.8Key Energy Ser 9.81 -4.0 0.6 1.9 21.7 6.2 6.2 24.2 17.0 5.5 18.0 -21.0 16.3 -24.1Nabors 24.7 0.0 -0.3 5.1 12.4 0.3 0.3 45.6 45.1 2.9 1.5 -2.0 12.2 -18.0National Oilwell 83.5 0.7 1.3 6.8 11.9 7.2 7.2 5.0 -2.1 0.9 12.1 -1.2 3.5 105.6Noble Corp. 31.5 -0.9 3.7 6.0 8.3 -3.8 -3.8 -16.0 -12.6 -2.2 -0.5 -0.7 9.6 6.9Oceaneering 73.7 -2.2 -0.1 5.1 3.8 2.6 2.6 -6.5 -8.9 -3.2 9.1 8.9 23.5 143.8Parker Drilling 6.50 -4.3 -0.3 -4.8 -9.5 -8.3 -8.3 -20.0 -12.8 38.7 13.1 16.4 -7.0 27.1Patterson-UTI 32.2 -0.7 -2.3 4.6 11.9 1.7 1.7 27.3 25.1 15.1 6.0 -15.6 28.0 42.9Rowan Comp 31.3 -0.6 3.0 3.6 -1.3 -7.1 -7.1 -11.5 -4.8 -4.9 6.7 -1.8 13.1 44.2Schlumberger 101.8 0.0 1.8 4.8 14.2 4.4 4.4 12.9 8.2 1.2 21.4 -3.2 8.1 25.4Seacor 83.3 -4.5 -2.9 -0.2 1.7 -3.7 -3.7 -8.7 -5.2 -0.4 7.3 14.6 13.3 20.0Seadrill 208 3.6 2.7 5.0 2.9 -1.9 -1.9 -15.1 -13.5 -10.5 9.1 10.4 -0.6 104.7Superior Energy 32.6 0.0 4.0 9.1 14.8 5.8 5.8 22.3 15.6 4.0 -4.2 4.3 25.3 10.9Tenaris 16.3 0.1 0.9 1.7 8.2 1.9 1.9 2.8 0.8 -7.3 14.9 -1.6 -0.9 17.4Tetra 12.60 -2.3 -3.4 4.6 7.4 -1.6 -1.6 1.9 3.6 -3.4 19.0 6.0 35.2 -13.0Thermon 23.8 -1.0 -2.4 0.3 -4.8 2.8 2.8 -12.8 -15.2 18.4 11.3 -7.4 -1.4 NATidewater 51.8 0.9 5.6 9.1 12.8 6.6 6.6 -12.5 -18.0 0.6 3.9 13.4 13.0 16.6Transocean 42.9 -0.6 5.7 8.7 10.4 3.7 3.7 -13.2 -16.3 9.9 -7.8 -6.1 16.3 -8.7Weatherford 20.5 11.2 12.4 22.0 27.2 17.9 17.9 32.1 12.1 -3.1 10.8 12.8 8.5 -15.4Arithmetic Average -0.6 0.9 5.3 5.6 1.2 1.2 3.1 1.5 0.3 6.5 4.8 13.0 47.5
Source: Datastream, Barclays. The European Market is the Eurostoxx, the European Integrateds, is the corresponding FTSE 300 index. The Barclays European Refining Index is calculated using arithmetic averages for companies under coverage. The Barclays European Services Index is calculated using market capitalisation weighted averaged for companies under coverage. The Barclays E&Ps Index is calculated using a free float weighted average for our coverage.

Barclays | Global Oil & Gas Weekly
29 April 2014 32
E&Ps

Barclays | Global Oil & Gas Weekly
29 April 2014 33
Valuations E&P - EuropeChange in
Price Target Up/(Down) cons in
Company Rating 25-Apr Price side, % 13F 14F 15F 13F 14F 15F 13F 14F 15F 13F 14F 15F NAV NAV last mnth
E&Ps - EuropeAfren O/W 146 225 54 3.1 4.7 4.3 7.5 9.8 7.8 0.4 (1.5) (0.7) 30.5 31.7 29.2 225 207 7
Africa Oil O/W 48.7 75.0 54 nm nm nm nm nm nm (12) (15) (16) (54) (15.7) 28.0 75 83 1
Bowleven O/W 33 135 312 nm nm nm nm nm nm (15) (2) (5) (3) (3) (7) 135 142 -37
Enquest U/W 131 155 18 4.2 3.4 1.5 9.1 6.7 7.0 (30) 26.9 28.6 0 0.0 (0.2) 155 163 5
Oryx Petroleum O/W 14.9 20.0 34 nm nm nm nm nm nm (0.2) (0.3) (0.3) (0) 0.2 0.7 20 19 0
Premier Oil O/W 327 485 48 6.6 5.7 4.0 12.2 8.8 8.0 (12) (15) 11.3 68 88.1 67.5 485 457 -3
Rockhopper Exploration O/W 98 235 140 nm nm nm nm nm nm (5.3) (12) (4.9) (90) (75.4) (70.3) 235 280 -1
Salamander Energy E/W 124 130 5 4.0 - - nm nm nm (14) (4.8) 9.3 149 154.7 117.3 130 187 -2
Soco International U/W 416 415 (0) 7.5 9.0 8.5 21.3 11.7 10.0 9.0 6.0 8.2 (20) (20.5) (24.6) 415 428 3
Tullow Oil O/W 840 1450 73 20.1 14.1 14.6 70.5 29.4 27.8 (2.9) (7.1) (9) 35 50.9 69.8 1450 1236 -3
Arithmetic average 64 7.6 7.5 6.0 18.4 16.8 11.3 (9) (4.8) (0.6) 6.3 15.5 16.8 21.0 -2Source: Company data, Datastream, Barclays Research - Price targets are based on a sum-of-the-parts based DCF methodology.
Barclays 2014
Cons 2014
EV:EBIDA, x P/E, x FCF yield, % Net Debt/Equity, %EV/2P
x
6.9
- 1.2
18.3
12.9 5.8
7.8
1.1
17.6
-
79.2
EV/2P+2Cx
8.4
-
13.5
20.8 9.2
16.8 15.8
39.9 15.9

Barclays | Global Oil & Gas Weekly
29 April 2014 34
Valuations E&P - Europe
EV:EBIDA, x P/E, x Free cash flow yield, %
-10
-5
0
5
10
15
AFR
AO
IL
BLV
N
CN
E
ENQ
OX
C
PMO
RKH
SMR
SIA
TLW
EV/EBIDA 2014 Average
-10
-5
0
5
10
15
AFR
AO
IL
BLV
N
CN
E
ENQ
OX
C
PMO
RKH
SMR
SIA
TLW
P/E 2014 Average
-10
-5
0
5
10
15
AFR
AO
IL
BLV
N
CN
E
ENQ
OX
C
PMO
RKH
SMR
SIA
TLW
FCF Yield, % 2014 Average
Gearing - Net Debt to Equity, % Dollar EPS Growth, y/y % EV:2P, x
-100%-60%-20%20%60%
100%140%180%
AFR
AO
IL
BLV
N
CN
E
ENQ
OX
C
PMO
RKH
SMR
SIA
2013 2014
-150%-100%
-50%0%
50%100%150%200%
AFR
AO
IL
BLV
N
CN
E
ENQ
OX
C
PMO
RKH
SMR
SIA
TLW
EPS Growth 2014 Average
0
10
20
30
40
50
AFR
AO
IL
BLV
N
CN
E
ENQ
OX
C
PMO
RKH
SMR
SIA
TLW
EV: 2P reserves 2014 Average
EV/2P+2C, x Datastream consensus relative to Barclays NAV, % ROACE, %
0
5
10
15
20
25
AFR
AO
IL
BLV
N
CN
E
ENQ
OX
C
PMO
RKH
SMR
SIA
TLW
EV: 3P reserves 2014 Average
-20
-10
0
10
20
AFR
AO
IL
BLV
N
CN
E
ENQ
OX
C
PMO
RKH
SMR
SIA
TLW
Cons vs BC EPS (%) 2014 Average
-20
-10
0
10
20
30
AFR
AO
IL
BLV
N
CN
E
ENQ
OX
C
PMO
RKH
SMR
SIA
TLW
RoACE, % 2014 Average
Source: Datastream

Barclays | Global Oil & Gas Weekly
29 April 2014 35
Share price performance E&P - Europe
Change in USD share price over last week, % Change in USD share price over last month, % Change in USD share price over last three months, %
-5 0 5 10 15 20 25
TLWSIA
BrentAFROXC
SectorENQCNE
BLVNRKH
PMOAOIL
SMDR
-10 -5 0 5 10 15 20
AOILRKHAFR
BrentCNE
BLVNSector
ENQOXC
SIATLWPMO
SMDR
-40 -30 -20 -10 0 10 20
CNERKH
BLVNAOILTLWAFR
SectorENQ
BrentSIA
OXCSMDR
Change in USD share price over last year, % European E&P vs Brent European E&P vs European market
-80 -60 -40 -20 0 20 40
BLVNCNE
SMDRRKHTLWPMOENQ
SectorBrent
AFRSIA
AOIL
80
85
90
95
100
105
110
Apr-13 Jul-13 Oct-13 Jan-14 Apr-14
70
75
80
85
90
95
100
105
Apr-13 Jul-13 Oct-13 Jan-14 Apr-14
Afren vs European E&P Bowleven vs European E&P Cairn Energy vs European E&P
100110120130140150160170180
80
90
100
110
120
130
Apr-13 Jul-13 Oct-13 Jan-14 Apr-14AFR vs Sector AFR, p
20
30
40
50
60
70
80
90
10
30
50
70
90
110
Apr-13 Jul-13 Oct-13 Jan-14 Apr-14BLVN vs Sector BLVN, p
140160180200220240260280300
50
60
70
80
90
100
110
Apr-13 Jul-13 Oct-13 Jan-14 Apr-14CNE vs Sector CNE, p
Source: Datastream, Barclays Research. Relative calculations use the Barclays European E&P Index for the European companies. The index is calculated using free float weighted averages for the E&P companies under coverage.
Barclays | Global Oil & Gas Weekly
29 April 2014 36
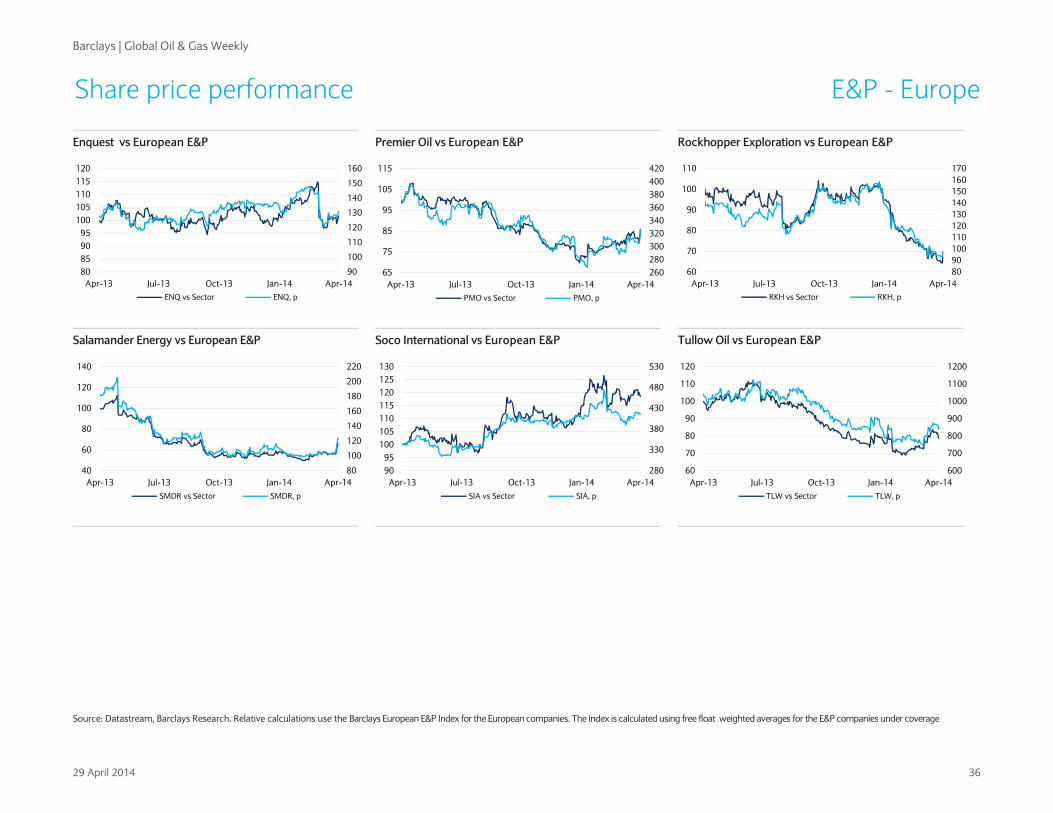
Share price performance E&P - Europe
Enquest vs European E&P Premier Oil vs European E&P Rockhopper Exploration vs European E&P
90
100
110
120
130
140
150
160
80859095
100105110115120
Apr-13 Jul-13 Oct-13 Jan-14 Apr-14ENQ vs Sector ENQ, p
260280300320340360380400420
65
75
85
95
105
115
Apr-13 Jul-13 Oct-13 Jan-14 Apr-14PMO vs Sector PMO, p
8090100110120130140150160170
60
70
80
90
100
110
Apr-13 Jul-13 Oct-13 Jan-14 Apr-14RKH vs Sector RKH, p
Salamander Energy vs European E&P Soco International vs European E&P Tullow Oil vs European E&P
80
100
120
140
160
180
200
220
40
60
80
100
120
140
Apr-13 Jul-13 Oct-13 Jan-14 Apr-14SMDR vs Sector SMDR, p
280
330
380
430
480
530
9095
100105110115120125130
Apr-13 Jul-13 Oct-13 Jan-14 Apr-14SIA vs Sector SIA, p
600
700
800
900
1000
1100
1200
60
70
80
90
100
110
120
Apr-13 Jul-13 Oct-13 Jan-14 Apr-14TLW vs Sector TLW, p
Source: Datastream, Barclays Research. Relative calculations use the Barclays European E&P Index for the European companies. The index is calculated using free float weighted averages for the E&P companies under coverage

Barclays | Global Oil & Gas Weekly
29 April 2014 37
Share price performance E&P-Europe
Tullow Oil vs Cairn Energy Bowleven vs Salamander Energy Cairn Energy vs Premier Oil
50
70
90
110
130
150
170
Apr-13 Jul-13 Oct-13 Jan-14 Apr-14
50
70
90
110
130
150
Apr-13 Jul-13 Oct-13 Jan-14 Apr-14
60
70
80
90
100
110
120
130
Apr-13 Jul-13 Oct-13 Jan-14 Apr-14
Tullow Oil vs Soco International Soco International vs Premier Oil Premier Oil vs Tullow Oil
30
50
70
90
110
130
Apr-13 Jul-13 Oct-13 Jan-14 Apr-14
80
100
120
140
160
180
Apr-13 Jul-13 Oct-13 Jan-14 Apr-14
70
80
90
100
110
120
Apr-13 Jul-13 Oct-13 Jan-14 Apr-14
Afren vs Cairn Energy Afren vs Premier Oil Afren vs Soco International
70
90
110
130
150
170
190
210
230
Apr-13 Jul-13 Oct-13 Jan-14 Apr-14
80
100
120
140
160
180
Apr-13 Jul-13 Oct-13 Jan-14 Apr-14
60
70
80
90
100
110
120
Apr-13 Jul-13 Oct-13 Jan-14 Apr-14
Source: Datastream, Barclays Research

Barclays | Global Oil & Gas Weekly
29 April 2014 38
Share price performance E&P - Europe & Israel 25-Apr -1d -5d -10d -30d MTD QTD YTD 1Q 14 4Q 13 3Q 13 2Q 13 1Q 13 4Q 12
Indices & marketsFTSE All 3581 -0.3 0.8 2.1 2.8 1.6 1.6 0.7 -0.9 7.1 9.7 -3.1 2.1 33.8StoxxEuro 321 -1.1 -0.1 0.5 3.4 -0.4 -0.4 2.5 2.9 7.9 14.6 0.0 -0.6 14.5S&P 500 1863 -0.8 -0.1 2.6 1.2 -0.5 -0.5 0.8 1.3 9.1 4.1 2.8 10.0 38.8MSCI EMG 1920 -0.4 0.2 1.3 2.9 0.2 0.2 0.3 0.0 4.9 9.8 -1.7 4.4 19.9
E&P - EuropeAfren 146 -1.6 0.4 7.7 -1.6 4.2 4.2 -12.5 -16.0 26.4 11.6 -9.1 1.0 78.1Africa Oil 8 0.2 4.7 7.7 -5.7 9.0 9.0 -15.8 -22.7 3.5 18.6 -3.3 0.7 549.4BowLeven 32.8 1.6 4.0 -3.2 -2.6 12.9 12.9 -12.5 -22.5 -31.3 1.9 -38.4 36.6 -44.2Cairn Energy 171 -0.2 3.3 3.7 -12.3 3.3 3.3 -35.7 -37.7 5.1 8.9 -7.9 -3.5 -37.3Enquest 131 1.1 2.0 4.4 -9.0 6.6 6.6 -1.1 -7.3 6.8 16.9 -18.0 11.8 34.4Premier Oil 327 4.3 6.4 5.6 8.7 11.7 11.7 5.7 -5.3 -2.2 2.1 -14.7 7.9 18.1Rockhopper Exploration 98 4.9 4.0 0.5 -7.9 -0.9 -0.9 -35.7 -35.1 21.3 9.8 -18.6 -8.7 -41.1Salamander Energy 124 4.7 19.5 21.3 23.2 23.4 23.4 12.9 -8.6 2.7 -15.2 -31.0 2.2 11.1Soco International 416 -0.4 -0.8 2.5 0.3 6.0 6.0 7.0 0.9 1.5 32.2 -7.4 -2.0 0.2Tullow Oil 840 -2.4 -3.2 2.1 9.2 13.1 13.1 -0.3 -11.9 -15.2 3.8 -19.0 -8.8 36.8Arithmetic Average 0.9 3.0 4.4 -0.8 7.0 7.0 -12.5 -18.8 0.3 8.3 -14.4 3.2 82.0E&P - IsraelAvner 3.51 0.1 0.5 -0.2 7.3 4.3 4.3 10.2 3.3 10.0 15.8 -3.6 4.5 58.7Delek Drilling 20.0 -0.1 0.1 0.3 7.6 4.2 4.2 9.7 2.5 4.9 19.7 -4.6 4.9 61.8Delek Energy Systems 2422 0.0 0.2 0.8 3.4 8.2 8.2 1.1 -9.1 3.7 37.0 3.6 5.3 68.7Isramco Negev 0.73 0.6 -0.7 -1.7 1.0 0.0 0.0 5.3 3.8 9.4 7.2 -6.4 9.1 38.4Ratio Oil 0.52 -0.2 2.7 4.0 7.8 4.4 4.4 16.1 8.1 6.6 30.4 -1.8 0.3 65.8Arithmetic Average 0.1 0.6 0.6 5.4 4.2 4.2 8.5 1.7 6.9 22.0 -2.6 4.8 58.7
Source: Datastream, Barclays Research. The European E&P Sector is the corresponding Euro Stoxx indices and the US E&P Sector is the corresponding S&P 500 indices.
Barclays | Global Oil & Gas Weekly
29 April 2014 39
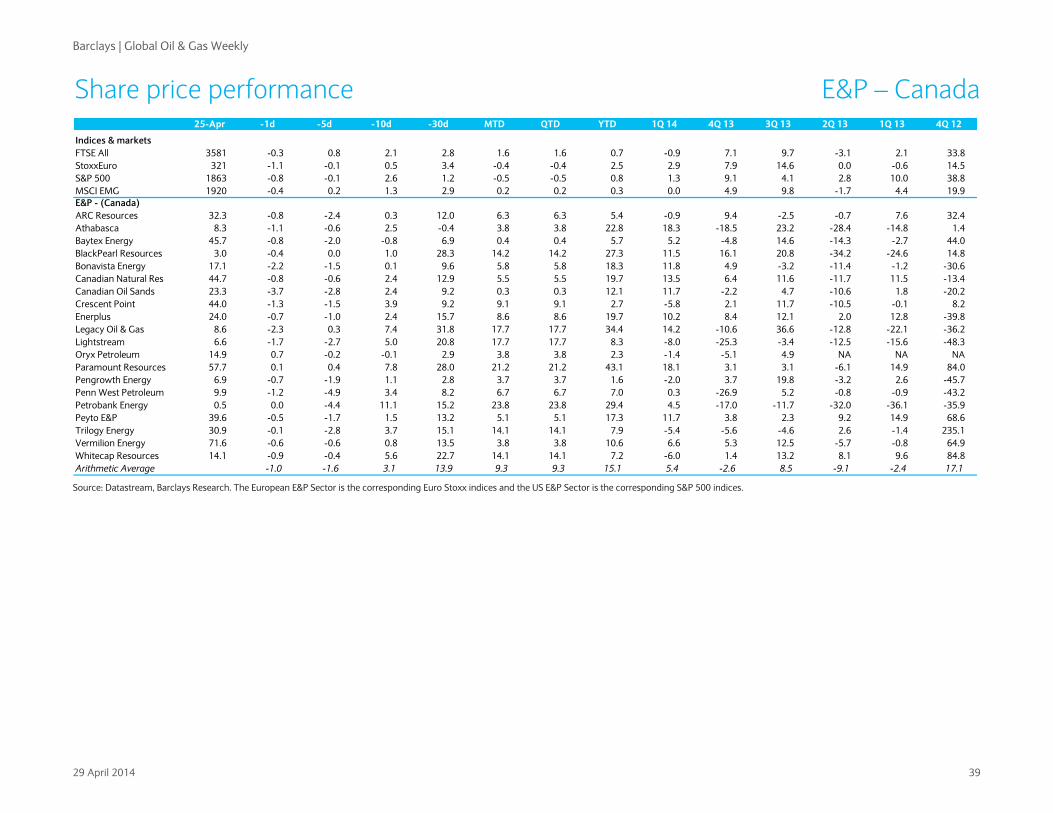
Share price performance E&P – Canada 25-Apr -1d -5d -10d -30d MTD QTD YTD 1Q 14 4Q 13 3Q 13 2Q 13 1Q 13 4Q 12
Indices & marketsFTSE All 3581 -0.3 0.8 2.1 2.8 1.6 1.6 0.7 -0.9 7.1 9.7 -3.1 2.1 33.8StoxxEuro 321 -1.1 -0.1 0.5 3.4 -0.4 -0.4 2.5 2.9 7.9 14.6 0.0 -0.6 14.5S&P 500 1863 -0.8 -0.1 2.6 1.2 -0.5 -0.5 0.8 1.3 9.1 4.1 2.8 10.0 38.8MSCI EMG 1920 -0.4 0.2 1.3 2.9 0.2 0.2 0.3 0.0 4.9 9.8 -1.7 4.4 19.9E&P - (Canada)ARC Resources 32.3 -0.8 -2.4 0.3 12.0 6.3 6.3 5.4 -0.9 9.4 -2.5 -0.7 7.6 32.4Athabasca 8.3 -1.1 -0.6 2.5 -0.4 3.8 3.8 22.8 18.3 -18.5 23.2 -28.4 -14.8 1.4Baytex Energy 45.7 -0.8 -2.0 -0.8 6.9 0.4 0.4 5.7 5.2 -4.8 14.6 -14.3 -2.7 44.0BlackPearl Resources 3.0 -0.4 0.0 1.0 28.3 14.2 14.2 27.3 11.5 16.1 20.8 -34.2 -24.6 14.8Bonavista Energy 17.1 -2.2 -1.5 0.1 9.6 5.8 5.8 18.3 11.8 4.9 -3.2 -11.4 -1.2 -30.6Canadian Natural Res 44.7 -0.8 -0.6 2.4 12.9 5.5 5.5 19.7 13.5 6.4 11.6 -11.7 11.5 -13.4Canadian Oil Sands 23.3 -3.7 -2.8 2.4 9.2 0.3 0.3 12.1 11.7 -2.2 4.7 -10.6 1.8 -20.2Crescent Point 44.0 -1.3 -1.5 3.9 9.2 9.1 9.1 2.7 -5.8 2.1 11.7 -10.5 -0.1 8.2Enerplus 24.0 -0.7 -1.0 2.4 15.7 8.6 8.6 19.7 10.2 8.4 12.1 2.0 12.8 -39.8Legacy Oil & Gas 8.6 -2.3 0.3 7.4 31.8 17.7 17.7 34.4 14.2 -10.6 36.6 -12.8 -22.1 -36.2Lightstream 6.6 -1.7 -2.7 5.0 20.8 17.7 17.7 8.3 -8.0 -25.3 -3.4 -12.5 -15.6 -48.3Oryx Petroleum 14.9 0.7 -0.2 -0.1 2.9 3.8 3.8 2.3 -1.4 -5.1 4.9 NA NA NAParamount Resources 57.7 0.1 0.4 7.8 28.0 21.2 21.2 43.1 18.1 3.1 3.1 -6.1 14.9 84.0Pengrowth Energy 6.9 -0.7 -1.9 1.1 2.8 3.7 3.7 1.6 -2.0 3.7 19.8 -3.2 2.6 -45.7Penn West Petroleum 9.9 -1.2 -4.9 3.4 8.2 6.7 6.7 7.0 0.3 -26.9 5.2 -0.8 -0.9 -43.2Petrobank Energy 0.5 0.0 -4.4 11.1 15.2 23.8 23.8 29.4 4.5 -17.0 -11.7 -32.0 -36.1 -35.9Peyto E&P 39.6 -0.5 -1.7 1.5 13.2 5.1 5.1 17.3 11.7 3.8 2.3 9.2 14.9 68.6Trilogy Energy 30.9 -0.1 -2.8 3.7 15.1 14.1 14.1 7.9 -5.4 -5.6 -4.6 2.6 -1.4 235.1Vermilion Energy 71.6 -0.6 -0.6 0.8 13.5 3.8 3.8 10.6 6.6 5.3 12.5 -5.7 -0.8 64.9Whitecap Resources 14.1 -0.9 -0.4 5.6 22.7 14.1 14.1 7.2 -6.0 1.4 13.2 8.1 9.6 84.8Arithmetic Average -1.0 -1.6 3.1 13.9 9.3 9.3 15.1 5.4 -2.6 8.5 -9.1 -2.4 17.1
Source: Datastream, Barclays Research. The European E&P Sector is the corresponding Euro Stoxx indices and the US E&P Sector is the corresponding S&P 500 indices.
Barclays | Global Oil & Gas Weekly
29 April 2014 40
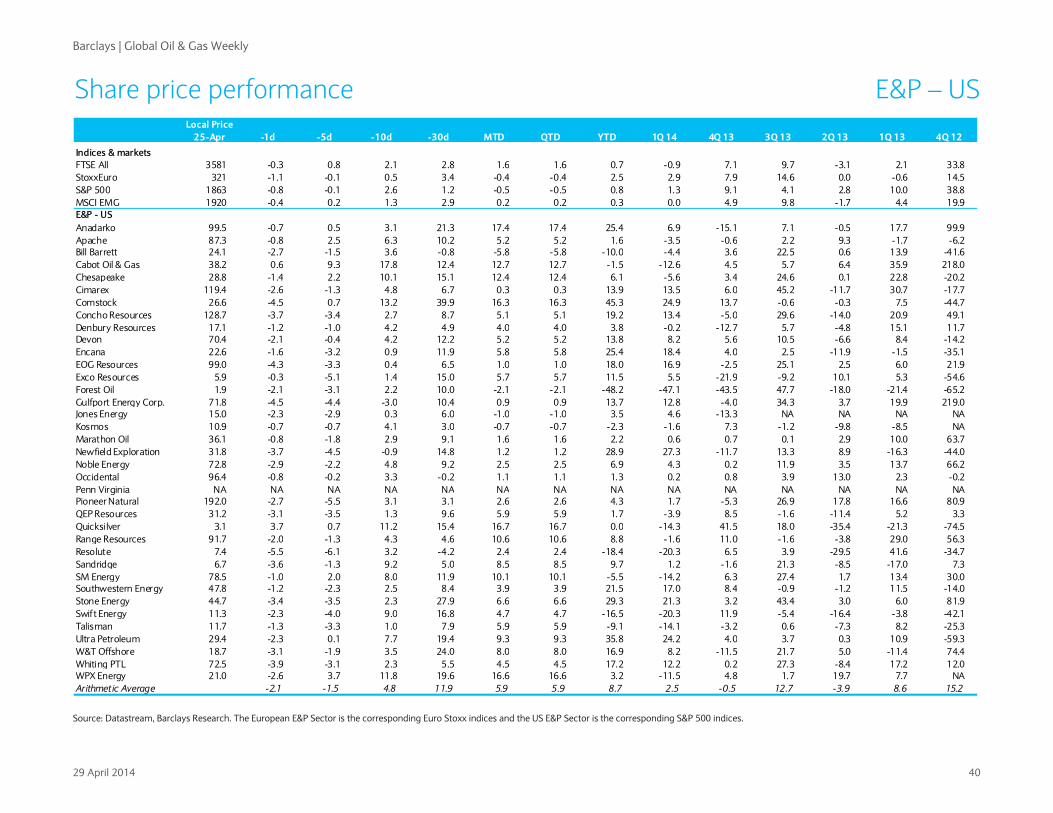
Share price performance E&P – US Local Price
25-Apr -1d -5d -10d -30d MTD QTD YTD 1Q 14 4Q 13 3Q 13 2Q 13 1Q 13 4Q 12
Indices & marketsFTSE All 3581 -0.3 0.8 2.1 2.8 1.6 1.6 0.7 -0.9 7.1 9.7 -3.1 2.1 33.8StoxxEuro 321 -1.1 -0.1 0.5 3.4 -0.4 -0.4 2.5 2.9 7.9 14.6 0.0 -0.6 14.5S&P 500 1863 -0.8 -0.1 2.6 1.2 -0.5 -0.5 0.8 1.3 9.1 4.1 2.8 10.0 38.8MSCI EMG 1920 -0.4 0.2 1.3 2.9 0.2 0.2 0.3 0.0 4.9 9.8 -1.7 4.4 19.9E&P - USAnadarko 99.5 -0.7 0.5 3.1 21.3 17.4 17.4 25.4 6.9 -15.1 7.1 -0.5 17.7 99.9Apache 87.3 -0.8 2.5 6.3 10.2 5.2 5.2 1.6 -3.5 -0.6 2.2 9.3 -1.7 -6.2Bill Barrett 24.1 -2.7 -1.5 3.6 -0.8 -5.8 -5.8 -10.0 -4.4 3.6 22.5 0.6 13.9 -41.6Cabot Oil & Gas 38.2 0.6 9.3 17.8 12.4 12.7 12.7 -1.5 -12.6 4.5 5.7 6.4 35.9 218.0Chesapeake 28.8 -1.4 2.2 10.1 15.1 12.4 12.4 6.1 -5.6 3.4 24.6 0.1 22.8 -20.2Cimarex 119.4 -2.6 -1.3 4.8 6.7 0.3 0.3 13.9 13.5 6.0 45.2 -11.7 30.7 -17.7Comstock 26.6 -4.5 0.7 13.2 39.9 16.3 16.3 45.3 24.9 13.7 -0.6 -0.3 7.5 -44.7Concho Resources 128.7 -3.7 -3.4 2.7 8.7 5.1 5.1 19.2 13.4 -5.0 29.6 -14.0 20.9 49.1Denbury Resources 17.1 -1.2 -1.0 4.2 4.9 4.0 4.0 3.8 -0.2 -12.7 5.7 -4.8 15.1 11.7Devon 70.4 -2.1 -0.4 4.2 12.2 5.2 5.2 13.8 8.2 5.6 10.5 -6.6 8.4 -14.2Encana 22.6 -1.6 -3.2 0.9 11.9 5.8 5.8 25.4 18.4 4.0 2.5 -11.9 -1.5 -35.1EOG Resources 99.0 -4.3 -3.3 0.4 6.5 1.0 1.0 18.0 16.9 -2.5 25.1 2.5 6.0 21.9Exco Resources 5.9 -0.3 -5.1 1.4 15.0 5.7 5.7 11.5 5.5 -21.9 -9.2 10.1 5.3 -54.6Forest Oil 1.9 -2.1 -3.1 2.2 10.0 -2.1 -2.1 -48.2 -47.1 -43.5 47.7 -18.0 -21.4 -65.2Gulfport Energy Corp. 71.8 -4.5 -4.4 -3.0 10.4 0.9 0.9 13.7 12.8 -4.0 34.3 3.7 19.9 219.0Jones Energy 15.0 -2.3 -2.9 0.3 6.0 -1.0 -1.0 3.5 4.6 -13.3 NA NA NA NAKosmos 10.9 -0.7 -0.7 4.1 3.0 -0.7 -0.7 -2.3 -1.6 7.3 -1.2 -9.8 -8.5 NAMarathon Oil 36.1 -0.8 -1.8 2.9 9.1 1.6 1.6 2.2 0.6 0.7 0.1 2.9 10.0 63.7Newfield Exploration 31.8 -3.7 -4.5 -0.9 14.8 1.2 1.2 28.9 27.3 -11.7 13.3 8.9 -16.3 -44.0Noble Energy 72.8 -2.9 -2.2 4.8 9.2 2.5 2.5 6.9 4.3 0.2 11.9 3.5 13.7 66.2Occidental 96.4 -0.8 -0.2 3.3 -0.2 1.1 1.1 1.3 0.2 0.8 3.9 13.0 2.3 -0.2Penn Virginia NA NA NA NA NA NA NA NA NA NA NA NA NA NAPioneer Natural 192.0 -2.7 -5.5 3.1 3.1 2.6 2.6 4.3 1.7 -5.3 26.9 17.8 16.6 80.9QEP Resources 31.2 -3.1 -3.5 1.3 9.6 5.9 5.9 1.7 -3.9 8.5 -1.6 -11.4 5.2 3.3Quicksilver 3.1 3.7 0.7 11.2 15.4 16.7 16.7 0.0 -14.3 41.5 18.0 -35.4 -21.3 -74.5Range Resources 91.7 -2.0 -1.3 4.3 4.6 10.6 10.6 8.8 -1.6 11.0 -1.6 -3.8 29.0 56.3Resolute 7.4 -5.5 -6.1 3.2 -4.2 2.4 2.4 -18.4 -20.3 6.5 3.9 -29.5 41.6 -34.7Sandridge 6.7 -3.6 -1.3 9.2 5.0 8.5 8.5 9.7 1.2 -1.6 21.3 -8.5 -17.0 7.3SM Energy 78.5 -1.0 2.0 8.0 11.9 10.1 10.1 -5.5 -14.2 6.3 27.4 1.7 13.4 30.0Southwestern Energy 47.8 -1.2 -2.3 2.5 8.4 3.9 3.9 21.5 17.0 8.4 -0.9 -1.2 11.5 -14.0Stone Energy 44.7 -3.4 -3.5 2.3 27.9 6.6 6.6 29.3 21.3 3.2 43.4 3.0 6.0 81.9Swift Energy 11.3 -2.3 -4.0 9.0 16.8 4.7 4.7 -16.5 -20.3 11.9 -5.4 -16.4 -3.8 -42.1Talisman 11.7 -1.3 -3.3 1.0 7.9 5.9 5.9 -9.1 -14.1 -3.2 0.6 -7.3 8.2 -25.3Ultra Petroleum 29.4 -2.3 0.1 7.7 19.4 9.3 9.3 35.8 24.2 4.0 3.7 0.3 10.9 -59.3W&T Offshore 18.7 -3.1 -1.9 3.5 24.0 8.0 8.0 16.9 8.2 -11.5 21.7 5.0 -11.4 74.4Whiting PTL 72.5 -3.9 -3.1 2.3 5.5 4.5 4.5 17.2 12.2 0.2 27.3 -8.4 17.2 12.0WPX Energy 21.0 -2.6 3.7 11.8 19.6 16.6 16.6 3.2 -11.5 4.8 1.7 19.7 7.7 NAArithmetic Average -2.1 -1.5 4.8 11.9 5.9 5.9 8.7 2.5 -0.5 12.7 -3.9 8.6 15.2
Source: Datastream, Barclays Research. The European E&P Sector is the corresponding Euro Stoxx indices and the US E&P Sector is the corresponding S&P 500 indices.

Barclays | Global Oil & Gas Weekly
29 April 2014 41
Global Emerging Market Oils

Barclays | Global Oil & Gas Weekly
29 April 2014 42
Valuations GEM Change in
Price Target Up/(Down) cons in
Company Rating 25-Apr Price side, % 13F 14F 15F 13F 14F 15F 13F 14F 15F 13F 14F 15F 13F 14F 15F EPS EPS last mnth
Integrated - RussiaBashneft E/W 59.4 71.0 20 5.1 4.0 3.3 7.8 5.0 4.1 17.5 15.9 18.6 10.6 12.0 13.4 18.7 24.5 24.5 11.88 10.21 2
Gazprom O/W 7.0 9.5 36 2.3 2.5 2.5 2.2 2.3 2.4 4.7 8.2 10.6 5.8 6.2 10.1 12.2 9.0 9.0 1.49 1.39 1
Gazprom Neft O/W 18.9 25.0 32 2.9 3.0 3.2 3.4 3.1 3.3 5.2 (7.5) (0.0) 7.4 8.0 7.6 18.0 13.6 13.6 1.22 1.24 1
Lukoil E/W 51.1 70.0 37 2.6 2.1 1.6 3.7 3.7 3.6 5.4 5.9 15.6 6.2 7.1 8.1 12.8 11.1 11.1 13.72 14.09 1
Novatek O/W 96 140 45 9.1 7.0 6.1 9.7 7.6 6.9 3.6 5.5 6.8 3.1 4.0 3.6 24.0 24.7 24.7 1.28 1.06 0
Rosneft U/W 6.2 7.3 16 5.4 4.8 4.7 5.5 4.7 5.0 (5.0) 11.7 8.3 6.0 5.3 5.0 11.6 8.5 8.5 1.32 1.35 1
Surgutneftegas U/W 6.9 7.3 6 (0.9) (1.2) (1.6) 3.1 2.9 3.7 28.0 24.6 15.3 3.4 4.0 3.2 21.5 18.7 18.7 0.24 0.19 -2
Tatneft E/W 34.6 40.0 16 4.0 3.4 3.1 5.4 4.7 4.8 13.2 13.9 14.5 4.7 5.3 5.3 16.1 15.8 15.8 1.22 1.09 0
Arithmetic average 26 3.8 3.2 2.9 5.1 4.3 4.2 9.1 9.8 11.2 5.9 6.5 7.1 16.9 15.7 15.7 1
Integrated - OtherPetrobras E/W 14 20 48 7.9 8.0 6.5 7.9 7.7 5.5 (21) (12) (4.3) 3.0 4.5 4.9 4.9 5.0 6.4 1.75 1.70 -5
Sasol O/W 587 650 11 11.0 12.0 10.7 4.5 0.4 (10.6) 4.5 0.4 (11) 3.2 4.1 4.4 18.5 16.9 16.6 55.18 57.29 0
Arithmetic average 29 9.4 10.0 8.6 6.2 4.1 (2.6) (8) (5.8) (7.4) 3.1 4.3 4.7 11.7 11.0 11.5 -2
ServicesC.A.T. Oil E/W 14.7 8.0 (45) 8.6 7.6 6.3 2.4 1.8 1.4 0.3 0.3 0.9 0.0 0.0 0.0 8.6 12.3 12.3 0.95 0.97 0
COSL O/W 19.7 25.8 31 2.9 2.7 2.7 14.7 14.4 14.1 8.3 9.0 9.0 1.4 1.4 1.4 8.4 7.4 7.4 1.38 1.93 1
Eurasia Drilling O/W 24.5 42.0 71 3.4 2.3 1.2 nm nm nm 8.3 10.1 13.0 0.0 0.0 0.0 20.7 18.0 18.0 4.08 2.67 -1
Integra O/W 19.3 4.5 (77) 19.7 15.7 13.3 0.5 0.3 0.2 2.4 3.6 4.5 0.0 0.0 0.0 15.5 21.8 21.8 0.59 3.35 nm
Arithmetic average (5) 8.6 7.1 5.9 5.9 5.5 5.2 4.8 5.7 6.8 0.3 0.3 0.4 13.3 14.9 14.9 0
Source: Company data, Datastream, Barclays Research - Price targets are based on a sum-of-the-parts based DCF methodology.
Barclays 2014
Cons 2014
RoACE, %EV:EBIDA, x P/E, x Dividend yield, %FCF yield, %

Barclays | Global Oil & Gas Weekly
29 April 2014 43
Valuations GEM
EV:EBIDA, x P/E, x Dividend yield, %
-5
0
5
10
15
BASH
GA
ZP
GA
ZN
LKO
H
NV
TK
ROSN
SRG
T
TATN
PBRA
SASL
EV/EBIDA 2014 Average
02468
1012
BASH
GA
ZP
GA
ZN
LKO
H
NV
TK
ROSN
SRG
T
TATN
PBRA
SASL
P/E 2014 Average
02468
101214
BASH
GA
ZP
GA
ZN
LKO
H
NV
TK
ROSN
SRG
T
TATN
PBRA
SASL
Dividend Yield, % 2014 Average
Free cash flow yield, % Gearing - Net Debt to Equity, % Datastream consensus e relative to Barclays EPS,%
-10
0
10
20
30
BASH
GA
ZP
GA
ZN
LKO
H
NV
TK
ROSN
SRG
T
TATN
PBRA
SASL
FCF Yield, % 2014 Average
-100
-50
0
50
100
BASH
GA
ZP
GA
ZN
LKO
H
NV
TK
ROSN
SRG
T
TATN
PBRA
SASL
2013 2014
-10-505
10152025
BASH
GA
ZP
GA
ZN
LKO
H
NV
TK
ROSN
SRG
T
TATN
PBRA
SASL
Cons vs BC EPS (%) 2014 Average
EV/Capital Employed, x ROACE, % Dollar EPS Growth y/y , %
-1.0-0.50.00.51.01.52.02.5
BASH
GA
ZP
GA
ZN
LKO
H
NV
TK
ROSN
SRG
T
TATN
PBRA
SASL
EV/Capital Employed 2014 Average
05
1015202530
BASH
GA
ZP
GA
ZN
LKO
H
NV
TK
ROSN
SRG
T
TATN
PBRA
SASL
RoACE, % 2014 Average
-20%
0%
20%
40%
60%
BASH
GA
ZP
GA
ZN
LKO
H
NV
TK
ROSN
SRG
T
TATN
PBRA
SASL
EPS Growth 2014 Average
Source: Datastream
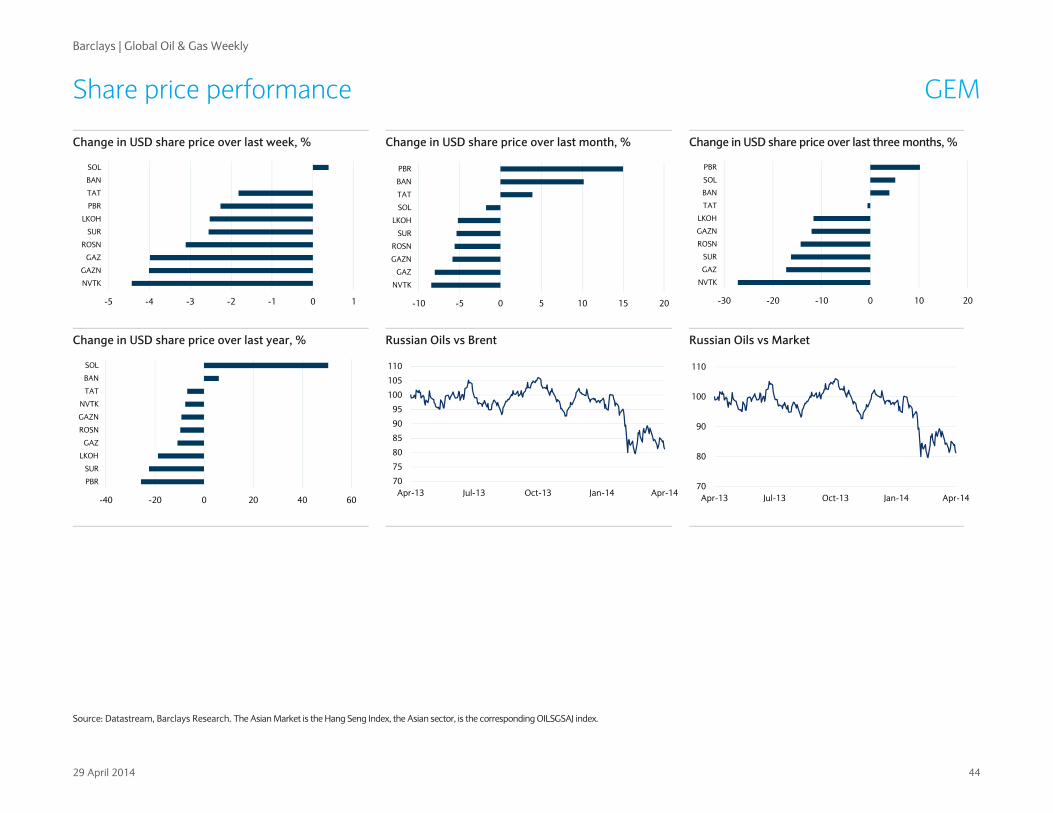
Barclays | Global Oil & Gas Weekly
29 April 2014 44
Share price performance GEM
Change in USD share price over last week, % Change in USD share price over last month, % Change in USD share price over last three months, %
-5 -4 -3 -2 -1 0 1
NVTK
GAZN
GAZ
ROSN
SUR
LKOH
PBR
TAT
BAN
SOL
-10 -5 0 5 10 15 20
NVTK
GAZ
GAZN
ROSN
SUR
LKOH
SOL
TAT
BAN
PBR
-30 -20 -10 0 10 20
NVTK
GAZ
SUR
ROSN
GAZN
LKOH
TAT
BAN
SOL
PBR
Change in USD share price over last year, % Russian Oils vs Brent Russian Oils vs Market
-40 -20 0 20 40 60
PBR
SUR
LKOH
GAZ
ROSN
GAZN
NVTK
TAT
BAN
SOL
70
75
80
85
90
95
100
105
110
Apr-13 Jul-13 Oct-13 Jan-14 Apr-1470
80
90
100
110
Apr-13 Jul-13 Oct-13 Jan-14 Apr-14
Source: Datastream, Barclays Research. The Asian Market is the Hang Seng Index, the Asian sector, is the corresponding OILSGSAJ index.

Barclays | Global Oil & Gas Weekly
29 April 2014 45
Share price performance Russia
RTS vs Urals Sector vs RTS Gazprom vs RTS
70
75
80
85
90
95
100
105
110
Apr-13 Jul-13 Oct-13 Jan-14 Apr-14
80859095
100105110115120125
Apr-13 Jul-13 Oct-13 Jan-14 Apr-14
4
5
6
7
8
9
10
11
70
80
90
100
110
120
Apr-13 Jul-13 Oct-13 Jan-14 Apr-14
GAZP vs RTS GAZP, $
Lukoil vs RTS Rosneft vs RTS Novatek vs RTS
40
50
60
70
80
80
85
90
95
100
105
110
Apr-13 Jul-13 Oct-13 Jan-14 Apr-14
LKOH vs RTS LKOH, $
4
6
8
10
70
80
90
100
110
120
130
Apr-13 Jul-13 Oct-13 Jan-14 Apr-14
ROSN vs RTS ROSN, $
60708090100110120130140150
60708090
100110120130140
Apr-13 Jul-13 Oct-13 Jan-14 Apr-14
NVTK vs RTS NVTK, $
Rosneft vs Lukoil Novatek vs Sector Gazprom vs Novatek
70
80
90
100
110
120
130
Apr-13 Jul-13 Oct-13 Jan-14 Apr-1470
80
90
100
110
120
130
140
Apr-13 Jul-13 Oct-13 Jan-14 Apr-1450
60
70
80
90
100
110
Apr-13 Jul-13 Oct-13 Jan-14 Apr-14
Source: Datastream, Barclays Research. Relative calculations use the Russia RTS index.
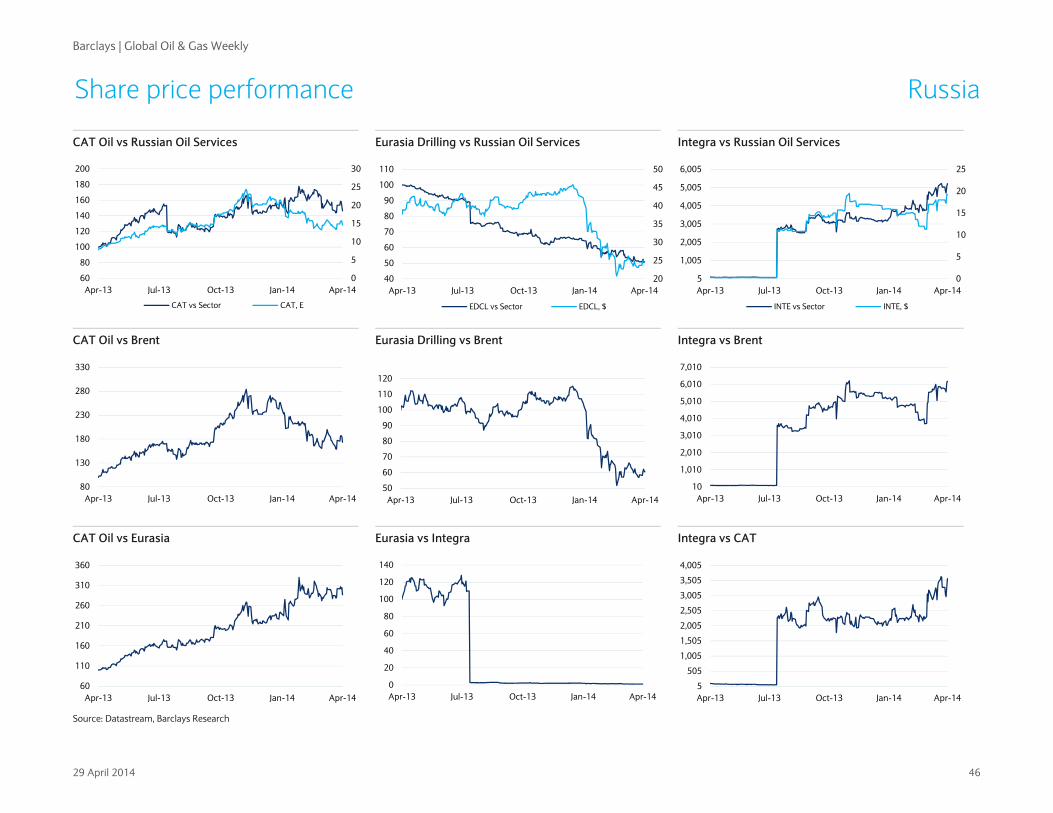
Barclays | Global Oil & Gas Weekly
29 April 2014 46
Share price performance Russia
CAT Oil vs Russian Oil Services Eurasia Drilling vs Russian Oil Services Integra vs Russian Oil Services
0
5
10
15
20
25
30
60
80
100
120
140
160
180
200
Apr-13 Jul-13 Oct-13 Jan-14 Apr-14
CAT vs Sector CAT, E
20
25
30
35
40
45
50
40
50
60
70
80
90
100
110
Apr-13 Jul-13 Oct-13 Jan-14 Apr-14
EDCL vs Sector EDCL, $
0
5
10
15
20
25
5
1,005
2,005
3,005
4,005
5,005
6,005
Apr-13 Jul-13 Oct-13 Jan-14 Apr-14
INTE vs Sector INTE, $
CAT Oil vs Brent Eurasia Drilling vs Brent Integra vs Brent
80
130
180
230
280
330
Apr-13 Jul-13 Oct-13 Jan-14 Apr-1450
60
70
80
90
100
110
120
Apr-13 Jul-13 Oct-13 Jan-14 Apr-1410
1,010
2,010
3,010
4,010
5,010
6,010
7,010
Apr-13 Jul-13 Oct-13 Jan-14 Apr-14
CAT Oil vs Eurasia Eurasia vs Integra Integra vs CAT
60
110
160
210
260
310
360
Apr-13 Jul-13 Oct-13 Jan-14 Apr-140
20
40
60
80
100
120
140
Apr-13 Jul-13 Oct-13 Jan-14 Apr-145
505
1,005
1,505
2,005
2,505
3,005
3,505
4,005
Apr-13 Jul-13 Oct-13 Jan-14 Apr-14
Source: Datastream, Barclays Research

Barclays | Global Oil & Gas Weekly
29 April 2014 47
Share price performance GEM
Local Price25-Apr -1d -5d -10d -30d MTD QTD YTD 1Q 14 4Q 13 3Q 13 2Q 13 1Q 13 4Q 12
Indices & marketsFTSE All 3581 -0.3 0.8 2.1 2.8 1.6 1.6 0.7 -0.9 7.1 9.7 -3.1 2.1 33.8StoxxEuro 321 -1.1 -0.1 0.5 3.4 -0.4 -0.4 2.5 2.9 7.9 14.6 0.0 -0.6 14.5S&P 500 1863 -0.8 -0.1 2.6 1.2 -0.5 -0.5 0.8 1.3 9.1 4.1 2.8 10.0 38.8MSCI EMG 1920 -0.4 0.2 1.3 2.9 0.2 0.2 0.3 0.0 4.9 9.8 -1.7 4.4 19.9MSCI Russia 661 -2.4 -6.7 -7.8 3.4 -9.9 -9.9 -23.9 -15.5 -1.3 13.3 -11.3 -3.5 18.9Integrated - RussiaBashneft 2120 -0.8 0.6 3.3 17.2 7.7 7.7 -3.3 -10.2 2.7 4.4 -10.2 7.2 63.5Gazprom 6.99 -2.0 -4.0 -6.9 6.1 -9.2 -9.2 -18.3 -9.9 -5.3 33.9 -23.0 -9.6 2.7Gazprom Neft 18.9 -2.4 -4.0 -6.2 1.7 -8.2 -8.2 -16.3 -8.9 1.8 21.3 -15.6 -9.0 30.2Lukoil 51.1 -1.9 -2.5 -4.2 -0.9 -8.1 -8.1 -18.3 -11.0 -1.8 9.3 -10.9 -2.7 32.3Novatek 96.5 -1.4 -4.4 -5.4 -3.3 -12.3 -12.3 -29.5 -19.7 3.9 10.8 10.9 -10.0 67.3Rosneft 6.23 -1.5 -3.1 -4.5 -0.6 -6.4 -6.4 -18.2 -12.6 -6.8 16.7 -10.2 -14.4 50.5Surgutneftegas 6.88 -1.7 -2.6 -6.0 -3.0 -6.7 -6.7 -20.4 -14.7 -0.7 10.6 -12.3 1.6 4.4Tatneft 34.6 -2.0 -1.8 -6.5 9.2 1.0 1.0 -9.5 -10.4 -3.5 6.4 -8.2 -9.2 60.2Arithmetic Average -1.7 -2.7 -4.6 3.3 -5.3 -5.3 -16.7 -12.2 -1.2 14.2 -9.9 -5.8 38.9
Integrated - OtherPetrobras 13.5 -1.7 -3.6 -3.8 30.2 2.7 2.7 -2.0 -4.6 -11.8 16.6 -18.3 -14.9 -42.1Sasol 587 -0.6 -1.1 0.4 4.6 -1.7 -1.7 12.2 14.1 2.9 7.8 -2.0 3.8 22.5Arithmetic Average -1.2 -2.4 -1.7 17.4 0.5 0.5 5.1 4.8 -4.5 12.2 -10.2 -5.5 -9.8ServicesC.A.T. Oil 14.65 -6.6 -1.7 3.2 4.9 -4.7 -4.7 -27.8 -24.2 48.1 21.6 26.7 37.6 1.9China Oilfield Systems 19.7 3.5 7.2 -2.5 7.0 8.5 8.5 -17.9 -24.4 23.7 28.1 -6.6 1.6 74.5Eurasia Drilling 24.5 -1.0 3.4 2.9 18.0 -4.4 -4.4 -45.6 -43.0 13.1 3.9 5.2 -0.6 87.9Integra 19.25 0.0 7.0 7.0 60.4 13.2 13.2 14.2 0.9 16.7 4713.3 -16.3 -10.7 -81.6Arithmetic Average -1.0 4.0 2.6 22.6 3.2 3.2 -19.3 -22.7 25.4 1191.7 2.3 7.0 20.7
Source: Datastream, Barclays Research. The Asian Market is the Hang Seng Index, the Asian sector, is the corresponding OILSGSAJ index

Barclays | Global Oil & Gas Weekly
29 April 2014 48
ANALYST(S) CERTIFICATION(S):
We, Lydia Rainforth, CFA, Paul Y. Cheng, CFA, Mick Pickup, Alessandro Pozzi, Matthew Thomas, Caroline Learmonth and Somshankar Sinha,hereby certify (1) that the views expressed in this research report accurately reflect our personal views about any or all of the subject securities orissuers referred to in this research report and (2) no part of our compensation was, is or will be directly or indirectly related to the specificrecommendations or views expressed in this research report.
IMPORTANT DISCLOSURES CONTINUED
Barclays Research is a part of the Corporate and Investment Banking division of Barclays Bank PLC and its affiliates (collectively and eachindividually, "Barclays"). For current important disclosures regarding companies that are the subject of this research report, please send a writtenrequest to: Barclays Research Compliance, 745 Seventh Avenue, 14th Floor, New York, NY 10019 or refer to http://publicresearch.barclays.comor call 212-526-1072.
The analysts responsible for preparing this research report have received compensation based upon various factors including the firm's totalrevenues, a portion of which is generated by investment banking activities.
Research analysts employed outside the US by affiliates of Barclays Capital Inc. are not registered/qualified as research analysts with FINRA.These analysts may not be associated persons of the member firm and therefore may not be subject to NASD Rule 2711 and incorporated NYSERule 472 restrictions on communications with a subject company, public appearances and trading securities held by a research analyst’saccount.
Analysts regularly conduct site visits to view the material operations of covered companies, but Barclays policy prohibits them from acceptingpayment or reimbursement by any covered company of their travel expenses for such visits.
In order to access Barclays Statement regarding Research Dissemination Policies and Procedures, please refer tohttps://live.barcap.com/publiccp/RSR/nyfipubs/disclaimer/disclaimer-research-dissemination.html. In order to access Barclays ResearchConflict Management Policy Statement, please refer to: http://group.barclays.com/corporates-and-institutions/research/research-policy.
The Corporate and Investment Banking division of Barclays produces a variety of research products including, but not limited to, fundamentalanalysis, equity-linked analysis, quantitative analysis, and trade ideas. Recommendations contained in one type of research product may differfrom recommendations contained in other types of research products, whether as a result of differing time horizons, methodologies, orotherwise.
Materially Mentioned Stocks (Ticker, Date, Price)
Afren Plc (AFRE.L, 28-Mar-2014, GBP 1.42), Overweight/Positive, F/J
Africa Oil Corp. (AOIC.ST, 28-Mar-2014, SEK 43.30), Overweight/Positive, J
Aker Solutions (AKSO.OL, 28-Mar-2014, NOK 93.50), Underweight/Positive, D/J/K/L/M/N
Alon USA Energy (ALJ, 28-Mar-2014, USD 14.48), Underweight/Positive, A/C/D/J/L/O
Bashneft (BANE.MM, 28-Mar-2014, USD 53.65), Equal Weight/Neutral, D/J/K/L/M/N
BG Group (BG.L, 28-Mar-2014, GBP 11.12), Equal Weight/Positive, C/D/J/K/L/M/N
Bowleven PLC (BLVN.L, 28-Mar-2014, GBP 0.30), Overweight/Positive, A/D/F/J/K/L/N/Q
BP (BP.L, 28-Mar-2014, GBP 4.84), Underweight/Positive, A/C/D/F/G/J/K/L/M/N
C.A.T. Oil AG (O2C.DE, 28-Mar-2014, EUR 14.57), Equal Weight/Positive, J
CGG (GEPH.PA, 28-Mar-2014, EUR 11.20), Underweight/Positive, D/J/K/L/N
Chevron Corporation (CVX, 28-Mar-2014, USD 118.50), Equal Weight/Positive, A/C/D/E/J/K/L/M/N/O
China Oilfield Services (COSL) (2883.HK, 28-Mar-2014, HKD 18.44), Overweight/Positive, D/J/K/L/M/N
ConocoPhillips (COP, 28-Mar-2014, USD 70.35), Overweight/Positive, C/D/J/K/L/M/N
Delek US Holdings Inc. (DK, 28-Mar-2014, USD 28.43), Overweight/Positive, A/C/D/J/K/L/M/N/O
Eni (ENI.MI, 28-Mar-2014, EUR 18.18), Equal Weight/Positive, A/D/J/K/L/M/N
Enquest (ENQ.L, 28-Mar-2014, GBP 1.26), Underweight/Positive, D/J/K/L/N
Essar Energy (ESSR.L, 28-Mar-2014, GBp 67.2), Rating Suspended/Negative, D/E/J/K/L/M/N
Eurasia Drilling Co., Ltd. (EDCLq.L, 28-Mar-2014, USD 24.90), Overweight/Positive, J
Exxon Mobil Corp. (XOM, 28-Mar-2014, USD 97.70), Equal Weight/Positive, A/C/D/E/J/K/L/M/N/O
Other Material Conflicts: The Corporate and Investment Banking Division of Barclays is providing investment banking services to ExxonMobilInternational Holdings Inc and ExxonMobil Energy Limited, both fully-owned subsidiaries of Exxon Mobil Corporation in relation to their proposedsale of an interest in Castle Peak Power Company Limited and in Hong Kong Pumped Storage Development Company Limited.
Galp Energia (GALP.LS, 28-Mar-2014, EUR 12.40), Overweight/Positive, D/J/L
Gazprom (GAZPq.L, 28-Mar-2014, USD 7.38), Overweight/Neutral, D/J/K/L/M/N
Gazprom Neft (SIBNq.L, 28-Mar-2014, USD 20.24), Overweight/Neutral, A/D/J/K/L/M/N
Grupa Lotos (LTSP.WA, 28-Mar-2014, PLN 36.80), Equal Weight/Negative, J/K/M

Barclays | Global Oil & Gas Weekly
29 April 2014 49
IMPORTANT DISCLOSURES CONTINUED
Hellenic Petroleum (HEPr.AT, 28-Mar-2014, EUR 7.28), Equal Weight/Negative, D/E/J/K/L/M
Other Material Conflicts: The Corporate and Investment Banking division of Barclays is providing investment banking services to HellenicPetroleum SA in relation to the potential sale of their stake in DESFA SA to the State Oil Company of the Azerbaijan Republic (SOCAR). The rating,price target and estimates for Hellenic Petroleum do not incorporate the impact of this potential transaction.
Hess Corp. (HES, 28-Mar-2014, USD 83.22), Overweight/Positive, C/D/J/K/L/M/N
Hunting (HTG.L, 28-Mar-2014, GBp 841.5), Overweight/Positive, D/J/K/L/N/Q
Integra Group (INTEq.L, 28-Mar-2014, USD 17.00), Overweight/Positive, J
Lukoil (LKOHyq.L, 28-Mar-2014, USD 53.15), Equal Weight/Neutral, J/K/N
Maire Tecnimont (MTCM.MI, 28-Mar-2014, EUR 2.54), Overweight/Positive, A/D/J/L
Other Material Conflicts: The Corporate and Investment Banking Division of Barclays Bank Plc is providing equity advisory services to MaireTecnimont SPA
MOL (MOLB.BU, 28-Mar-2014, HUF 12600.00), Underweight/Positive, D/J/L
Motor Oil (MORr.AT, 28-Mar-2014, EUR 9.38), Overweight/Negative, J
Murphy Oil (MUR, 28-Mar-2014, USD 62.75), Equal Weight/Positive, C/D/J/K/L/N
Neste Oil (NES1V.HE, 28-Mar-2014, EUR 14.58), Underweight/Negative, D/J/K/L/M/N
Novatek (NVTKq.L, 28-Mar-2014, USD 103.30), Overweight/Neutral, A/D/J/K/L/M
OMV (OMVV.VI, 28-Mar-2014, EUR 32.44), Underweight/Positive, D/J/K/L/M/N
Oryx Petroleum Corp., Ltd. (OXC.TO, 28-Mar-2014, CAD 14.50), Overweight/Positive, A/D/J/L/R
Petrofac (PFC.L, 28-Mar-2014, GBP 14.16), Underweight/Positive, A/C/D/J/K/L/M
Petroleo Brasileiro S.A. (PBR, 28-Mar-2014, USD 13.18), Equal Weight/Positive, C/D/J/K/L/M
Petroleo Brasileiro S.A. (PBRA, 28-Mar-2014, USD 13.90), Equal Weight/Positive, C/D/J/K/L/M
Petroleum Geo-Services (PGS.OL, 28-Mar-2014, NOK 70.80), Overweight/Positive, D/J/K/L/M/N
PKN Orlen (PKN.WA, 28-Mar-2014, PLN 42.09), Underweight/Negative, D/J/L
Polarcus (PLCS.OL, 28-Mar-2014, NOK 4.54), Equal Weight/Positive, J
Premier Oil (PMO.L, 28-Mar-2014, GBP 2.92), Overweight/Positive, A/D/F/J/K/L/M/N
Repsol (REP.MC, 28-Mar-2014, EUR 18.61), Equal Weight/Positive, A/D/J/K/L/M/N
Rockhopper Exploration (RKH.L, 28-Mar-2014, GBP 1.00), Overweight/Positive, F/J/K/N
Rosneft (ROSNq.L, 28-Mar-2014, USD 6.48), Underweight/Neutral, D/J/K/L/M/N
Royal Dutch Shell A (RDSa.L, 28-Mar-2014, GBP 21.94), Overweight/Positive, A/C/D/E/J/K/L/M/N
Royal Dutch Shell B (RDSb.L, 28-Mar-2014, GBP 23.40), Overweight/Positive, A/C/D/E/J/K/L/M/N
Saipem (SPMI.MI, 28-Mar-2014, EUR 17.19), Equal Weight/Positive, D/J/K/L/M/N
Salamander Energy (SMDR.L, 28-Mar-2014, GBP 1.05), Equal Weight/Positive, J
Saras (SRS.MI, 28-Mar-2014, EUR 1.30), Underweight/Negative, D/J/K/L/M/N
Sasol Limited (SOLJ.J, 28-Mar-2014, ZAR 595.30), Overweight/Neutral, C/D/J/K/L/M/N/O
SBM Offshore (SBMO.AS, 28-Mar-2014, EUR 12.60), Overweight/Positive, C/J
Soco International (SIA.L, 28-Mar-2014, GBP 4.02), Underweight/Positive, J
Statoil ASA (STL.OL, 28-Mar-2014, NOK 169.50), Overweight/Positive, A/D/J/K/L/M/N
Subsea 7 SA (SUBC.OL, 28-Mar-2014, NOK 109.50), Overweight/Positive, D/J/K/L/M/N
Surgutneftegas (SNGSyq.L, 28-Mar-2014, USD 7.16), Underweight/Neutral, J
Tatneft (TATNxq.L, 28-Mar-2014, USD 33.58), Equal Weight/Neutral, J/K/M
Technip (TECF.PA, 28-Mar-2014, EUR 75.00), Overweight/Positive, C/D/J/K/L/M/N
Other Material Conflicts: The Corporate and Investment Banking Division of Barclays Bank Plc is providing equity advisory services to Technip SA.
Tecnicas Reunidas (TRE.MC, 28-Mar-2014, EUR 40.80), Equal Weight/Positive, J/K/M/N
Tesoro Corporation (TSO, 28-Mar-2014, USD 50.50), Overweight/Positive, A/C/D/F/J/K/L/M
TGS (TGS.OL, 28-Mar-2014, NOK 190.50), Underweight/Positive, J
Total (TOTF.PA, 28-Mar-2014, EUR 48.03), Overweight/Positive, A/C/D/F/J/K/L/M/N
Tullow Oil (TLW.L, 28-Mar-2014, GBP 7.60), Overweight/Positive, A/D/J/K/L/M/N/Q
Tupras (TUPRS.IS, 28-Mar-2014, TRY 44.90), Underweight/Neutral, J/K/N

Barclays | Global Oil & Gas Weekly
29 April 2014 50
IMPORTANT DISCLOSURES CONTINUED
Valero Energy (VLO, 28-Mar-2014, USD 52.86), Overweight/Positive, A/C/D/J/K/L/M/N
Wood Group (WG.L, 28-Mar-2014, GBP 7.68), Overweight/Positive, C/D/E/F/J/K/L/M/N
Disclosure Legend:
A: Barclays Bank PLC and/or an affiliate has been lead manager or co-lead manager of a publicly disclosed offer of securities of the issuer in theprevious 12 months.
B: An employee of Barclays Bank PLC and/or an affiliate is a director of this issuer.
C: Barclays Bank PLC and/or an affiliate is a market-maker and/or liquidity provider in equity securities issued by this issuer or one of its affiliates.
D: Barclays Bank PLC and/or an affiliate has received compensation for investment banking services from this issuer in the past 12 months.
E: Barclays Bank PLC and/or an affiliate expects to receive or intends to seek compensation for investment banking services from this issuerwithin the next 3 months.
F: Barclays Bank PLC and/or an affiliate beneficially owned 1% or more of a class of equity securities of the issuer as of the end of the monthprior to the research report's issuance.
G: One of the analysts on the coverage team (or a member of his or her household) owns shares of the common stock of this issuer.
H: This issuer beneficially owns 5% or more of any class of common equity securities of Barclays Bank PLC.
I: Barclays Bank PLC and/or an affiliate has a significant financial interest in the securities of this issuer.
J: Barclays Bank PLC and/or an affiliate trades regularly in the securities of this issuer.
K: Barclays Bank PLC and/or an affiliate has received non-investment banking related compensation from this issuer within the past 12 months.
L: This issuer is, or during the past 12 months has been, an investment banking client of Barclays Bank PLC and/or an affiliate.
M: This issuer is, or during the past 12 months has been, a non-investment banking client (securities related services) of Barclays Bank PLCand/or an affiliate.
N: This issuer is, or during the past 12 months has been, a non-investment banking client (non-securities related services) of Barclays Bank PLCand/or an affiliate.
O: Barclays Capital Inc., through Barclays Market Makers, is a Designated Market Maker in this issuer's stock, which is listed on the New YorkStock Exchange. At any given time, its associated Designated Market Maker may have "long" or "short" inventory position in the stock; and itsassociated Designated Market Maker may be on the opposite side of orders executed on the floor of the New York Stock Exchange in the stock.
P: A partner, director or officer of Barclays Capital Canada Inc. has, during the preceding 12 months, provided services to the subject company forremuneration, other than normal course investment advisory or trade execution services.
Q: The Corporate and Investment Banking division of Barclays Bank PLC, is a Corporate Broker to this issuer.
R: Barclays Capital Canada Inc. and/or an affiliate has received compensation for investment banking services from this issuer in the past 12months.
S: Barclays Capital Canada Inc. is a market-maker in an equity or equity related security issued by this issuer.
Guide to the Barclays Fundamental Equity Research Rating System:
Our coverage analysts use a relative rating system in which they rate stocks as Overweight, Equal Weight or Underweight (see definitions below)relative to other companies covered by the analyst or a team of analysts that are deemed to be in the same industry (the "industry coverageuniverse").
In addition to the stock rating, we provide industry views which rate the outlook for the industry coverage universe as Positive, Neutral orNegative (see definitions below). A rating system using terms such as buy, hold and sell is not the equivalent of our rating system. Investorsshould carefully read the entire research report including the definitions of all ratings and not infer its contents from ratings alone.
Stock Rating
Overweight - The stock is expected to outperform the unweighted expected total return of the industry coverage universe over a 12-monthinvestment horizon.
Equal Weight - The stock is expected to perform in line with the unweighted expected total return of the industry coverage universe over a 12-month investment horizon.
Underweight - The stock is expected to underperform the unweighted expected total return of the industry coverage universe over a 12-monthinvestment horizon.
Rating Suspended - The rating and target price have been suspended temporarily due to market events that made coverage impracticable or tocomply with applicable regulations and/or firm policies in certain circumstances including where the Corporate and Investment Banking Divisionof Barclays is acting in an advisory capacity in a merger or strategic transaction involving the company.
Industry View
Positive - industry coverage universe fundamentals/valuations are improving.
Neutral - industry coverage universe fundamentals/valuations are steady, neither improving nor deteriorating.
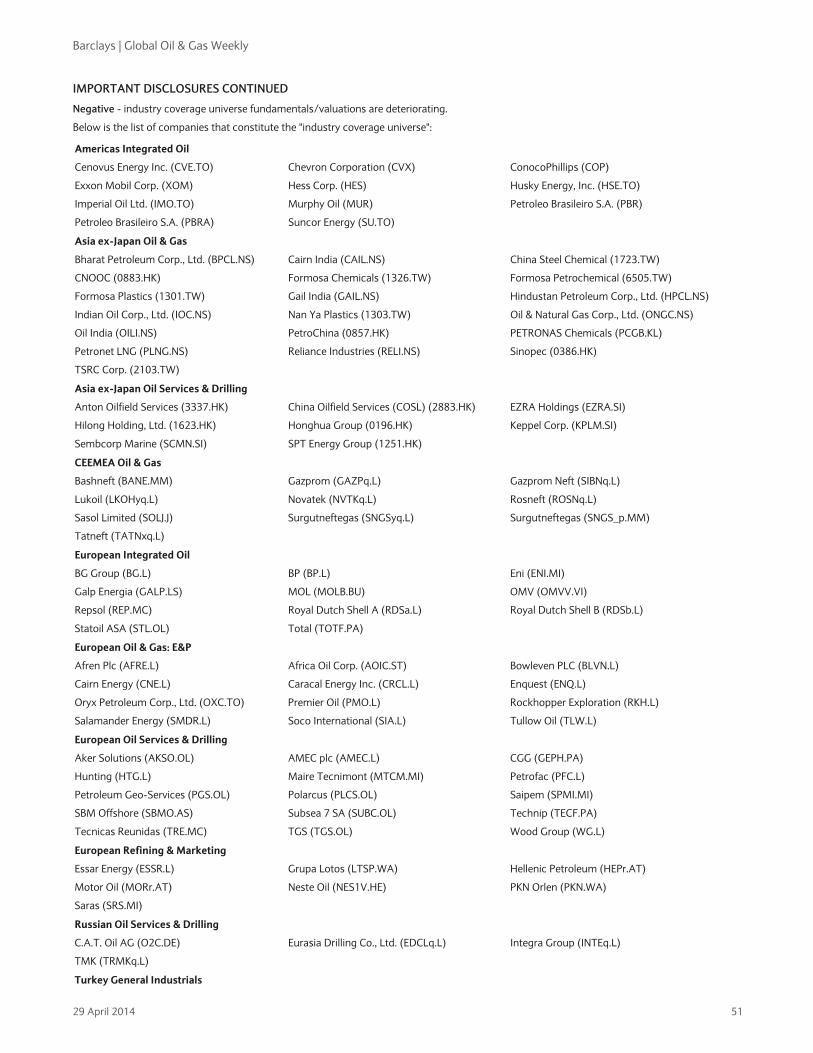
Barclays | Global Oil & Gas Weekly
29 April 2014 51
IMPORTANT DISCLOSURES CONTINUED
Negative - industry coverage universe fundamentals/valuations are deteriorating.
Below is the list of companies that constitute the "industry coverage universe":
Americas Integrated Oil
Cenovus Energy Inc. (CVE.TO) Chevron Corporation (CVX) ConocoPhillips (COP)
Exxon Mobil Corp. (XOM) Hess Corp. (HES) Husky Energy, Inc. (HSE.TO)
Imperial Oil Ltd. (IMO.TO) Murphy Oil (MUR) Petroleo Brasileiro S.A. (PBR)
Petroleo Brasileiro S.A. (PBRA) Suncor Energy (SU.TO)
Asia ex-Japan Oil & Gas
Bharat Petroleum Corp., Ltd. (BPCL.NS) Cairn India (CAIL.NS) China Steel Chemical (1723.TW)
CNOOC (0883.HK) Formosa Chemicals (1326.TW) Formosa Petrochemical (6505.TW)
Formosa Plastics (1301.TW) Gail India (GAIL.NS) Hindustan Petroleum Corp., Ltd. (HPCL.NS)
Indian Oil Corp., Ltd. (IOC.NS) Nan Ya Plastics (1303.TW) Oil & Natural Gas Corp., Ltd. (ONGC.NS)
Oil India (OILI.NS) PetroChina (0857.HK) PETRONAS Chemicals (PCGB.KL)
Petronet LNG (PLNG.NS) Reliance Industries (RELI.NS) Sinopec (0386.HK)
TSRC Corp. (2103.TW)
Asia ex-Japan Oil Services & Drilling
Anton Oilfield Services (3337.HK) China Oilfield Services (COSL) (2883.HK) EZRA Holdings (EZRA.SI)
Hilong Holding, Ltd. (1623.HK) Honghua Group (0196.HK) Keppel Corp. (KPLM.SI)
Sembcorp Marine (SCMN.SI) SPT Energy Group (1251.HK)
CEEMEA Oil & Gas
Bashneft (BANE.MM) Gazprom (GAZPq.L) Gazprom Neft (SIBNq.L)
Lukoil (LKOHyq.L) Novatek (NVTKq.L) Rosneft (ROSNq.L)
Sasol Limited (SOLJ.J) Surgutneftegas (SNGSyq.L) Surgutneftegas (SNGS_p.MM)
Tatneft (TATNxq.L)
European Integrated Oil
BG Group (BG.L) BP (BP.L) Eni (ENI.MI)
Galp Energia (GALP.LS) MOL (MOLB.BU) OMV (OMVV.VI)
Repsol (REP.MC) Royal Dutch Shell A (RDSa.L) Royal Dutch Shell B (RDSb.L)
Statoil ASA (STL.OL) Total (TOTF.PA)
European Oil & Gas: E&P
Afren Plc (AFRE.L) Africa Oil Corp. (AOIC.ST) Bowleven PLC (BLVN.L)
Cairn Energy (CNE.L) Caracal Energy Inc. (CRCL.L) Enquest (ENQ.L)
Oryx Petroleum Corp., Ltd. (OXC.TO) Premier Oil (PMO.L) Rockhopper Exploration (RKH.L)
Salamander Energy (SMDR.L) Soco International (SIA.L) Tullow Oil (TLW.L)
European Oil Services & Drilling
Aker Solutions (AKSO.OL) AMEC plc (AMEC.L) CGG (GEPH.PA)
Hunting (HTG.L) Maire Tecnimont (MTCM.MI) Petrofac (PFC.L)
Petroleum Geo-Services (PGS.OL) Polarcus (PLCS.OL) Saipem (SPMI.MI)
SBM Offshore (SBMO.AS) Subsea 7 SA (SUBC.OL) Technip (TECF.PA)
Tecnicas Reunidas (TRE.MC) TGS (TGS.OL) Wood Group (WG.L)
European Refining & Marketing
Essar Energy (ESSR.L) Grupa Lotos (LTSP.WA) Hellenic Petroleum (HEPr.AT)
Motor Oil (MORr.AT) Neste Oil (NES1V.HE) PKN Orlen (PKN.WA)
Saras (SRS.MI)
Russian Oil Services & Drilling
C.A.T. Oil AG (O2C.DE) Eurasia Drilling Co., Ltd. (EDCLq.L) Integra Group (INTEq.L)
TMK (TRMKq.L)
Turkey General Industrials
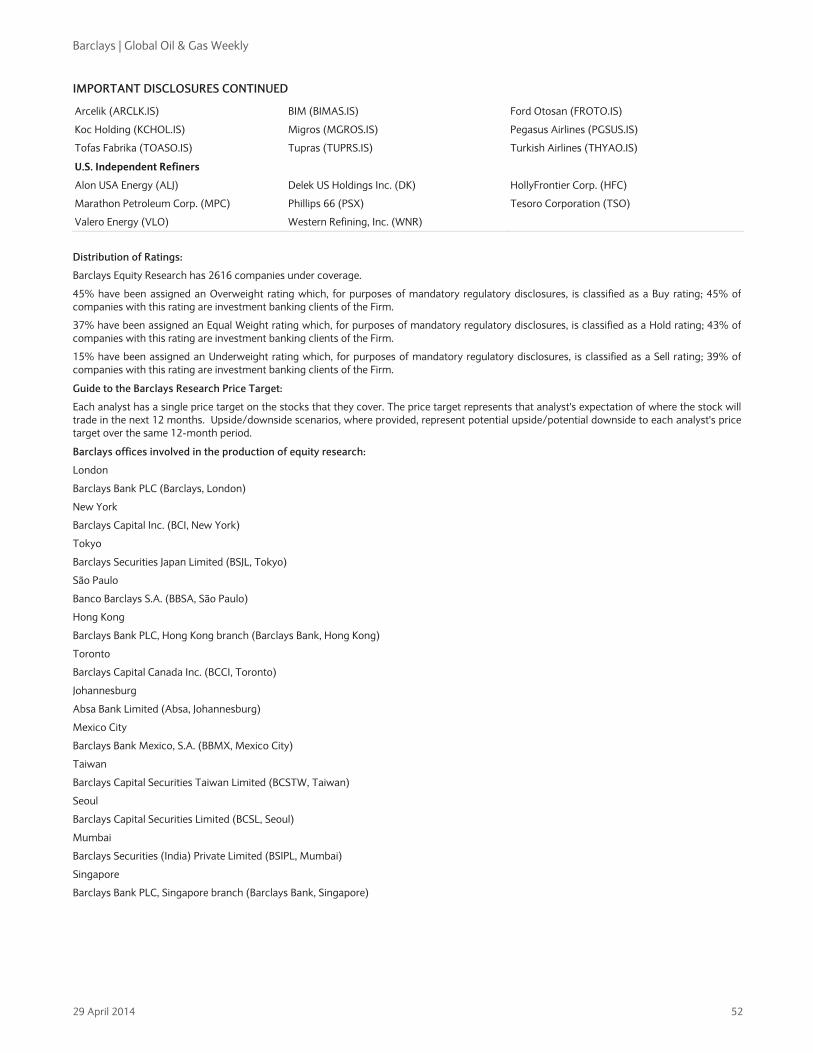
Barclays | Global Oil & Gas Weekly
29 April 2014 52
IMPORTANT DISCLOSURES CONTINUED
Arcelik (ARCLK.IS) BIM (BIMAS.IS) Ford Otosan (FROTO.IS)
Koc Holding (KCHOL.IS) Migros (MGROS.IS) Pegasus Airlines (PGSUS.IS)
Tofas Fabrika (TOASO.IS) Tupras (TUPRS.IS) Turkish Airlines (THYAO.IS)
U.S. Independent Refiners
Alon USA Energy (ALJ) Delek US Holdings Inc. (DK) HollyFrontier Corp. (HFC)
Marathon Petroleum Corp. (MPC) Phillips 66 (PSX) Tesoro Corporation (TSO)
Valero Energy (VLO) Western Refining, Inc. (WNR)
Distribution of Ratings:
Barclays Equity Research has 2616 companies under coverage.
45% have been assigned an Overweight rating which, for purposes of mandatory regulatory disclosures, is classified as a Buy rating; 45% ofcompanies with this rating are investment banking clients of the Firm.
37% have been assigned an Equal Weight rating which, for purposes of mandatory regulatory disclosures, is classified as a Hold rating; 43% ofcompanies with this rating are investment banking clients of the Firm.
15% have been assigned an Underweight rating which, for purposes of mandatory regulatory disclosures, is classified as a Sell rating; 39% ofcompanies with this rating are investment banking clients of the Firm.
Guide to the Barclays Research Price Target:
Each analyst has a single price target on the stocks that they cover. The price target represents that analyst's expectation of where the stock willtrade in the next 12 months. Upside/downside scenarios, where provided, represent potential upside/potential downside to each analyst's pricetarget over the same 12-month period.
Barclays offices involved in the production of equity research:
London
Barclays Bank PLC (Barclays, London)
New York
Barclays Capital Inc. (BCI, New York)
Tokyo
Barclays Securities Japan Limited (BSJL, Tokyo)
São Paulo
Banco Barclays S.A. (BBSA, São Paulo)
Hong Kong
Barclays Bank PLC, Hong Kong branch (Barclays Bank, Hong Kong)
Toronto
Barclays Capital Canada Inc. (BCCI, Toronto)
Johannesburg
Absa Bank Limited (Absa, Johannesburg)
Mexico City
Barclays Bank Mexico, S.A. (BBMX, Mexico City)
Taiwan
Barclays Capital Securities Taiwan Limited (BCSTW, Taiwan)
Seoul
Barclays Capital Securities Limited (BCSL, Seoul)
Mumbai
Barclays Securities (India) Private Limited (BSIPL, Mumbai)
Singapore
Barclays Bank PLC, Singapore branch (Barclays Bank, Singapore)

DISCLAIMER:
This publication has been prepared by the Corporate and Investment Banking division of Barclays Bank PLC and/or one or more of its affiliates (collectivelyand each individually, "Barclays"). It has been issued by one or more Barclays legal entities within its Corporate and Investment Banking division as providedbelow. It is provided to our clients for information purposes only, and Barclays makes no express or implied warranties, and expressly disclaims all warrantiesof merchantability or fitness for a particular purpose or use with respect to any data included in this publication. Barclays will not treat unauthorizedrecipients of this report as its clients. Prices shown are indicative and Barclays is not offering to buy or sell or soliciting offers to buy or sell any financialinstrument.
Without limiting any of the foregoing and to the extent permitted by law, in no event shall Barclays, nor any affiliate, nor any of their respective officers,directors, partners, or employees have any liability for (a) any special, punitive, indirect, or consequential damages; or (b) any lost profits, lost revenue, loss ofanticipated savings or loss of opportunity or other financial loss, even if notified of the possibility of such damages, arising from any use of this publication orits contents.
Other than disclosures relating to Barclays, the information contained in this publication has been obtained from sources that Barclays Research believes tobe reliable, but Barclays does not represent or warrant that it is accurate or complete. Barclays is not responsible for, and makes no warranties whatsoever asto, the content of any third-party web site accessed via a hyperlink in this publication and such information is not incorporated by reference.
The views in this publication are those of the author(s) and are subject to change, and Barclays has no obligation to update its opinions or the information inthis publication. The analyst recommendations in this publication reflect solely and exclusively those of the author(s), and such opinions were preparedindependently of any other interests, including those of Barclays and/or its affiliates. This publication does not constitute personal investment advice or takeinto account the individual financial circumstances or objectives of the clients who receive it. The securities discussed herein may not be suitable for allinvestors. Barclays recommends that investors independently evaluate each issuer, security or instrument discussed herein and consult any independentadvisors they believe necessary. The value of and income from any investment may fluctuate from day to day as a result of changes in relevant economicmarkets (including changes in market liquidity). The information herein is not intended to predict actual results, which may differ substantially from thosereflected. Past performance is not necessarily indicative of future results.
This material has been issued and approved for distribution in the UK and European Economic Area (“EEA”) by Barclays Bank PLC. It is being made availableprimarily to persons who are investment professionals as that term is defined in Article 19 of the Financial Services and Markets Act 2000 (FinancialPromotion) Order 2005. It is directed at, and therefore should only be relied upon by, persons who have professional experience in matters relating toinvestments. The investments to which it relates are available only to such persons and will be entered into only with such persons. Barclays Bank PLC isauthorised by the Prudential Regulation Authority and regulated by the Financial Conduct Authority and the Prudential Regulation Authority and is amember of the London Stock Exchange.
The Corporate and Investment Banking division of Barclays undertakes U.S. securities business in the name of its wholly owned subsidiary Barclays CapitalInc., a FINRA and SIPC member. Barclays Capital Inc., a U.S. registered broker/dealer, is distributing this material in the United States and, in connectiontherewith accepts responsibility for its contents. Any U.S. person wishing to effect a transaction in any security discussed herein should do so only bycontacting a representative of Barclays Capital Inc. in the U.S. at 745 Seventh Avenue, New York, New York 10019.
Non-U.S. persons should contact and execute transactions through a Barclays Bank PLC branch or affiliate in their home jurisdiction unless local regulationspermit otherwise.
Barclays Bank PLC, Paris Branch (registered in France under Paris RCS number 381 066 281) is regulated by the Autorité des marchés financiers and theAutorité de contrôle prudentiel. Registered office 34/36 Avenue de Friedland 75008 Paris.
This material is distributed in Canada by Barclays Capital Canada Inc., a registered investment dealer and member of IIROC (www.iiroc.ca).
Subject to the conditions of this publication as set out above, the Corporate & Investment Banking Division of Absa Bank Limited, an authorised financialservices provider (Registration No.: 1986/004794/06. Registered Credit Provider Reg No NCRCP7), is distributing this material in South Africa. Absa BankLimited is regulated by the South African Reserve Bank. This publication is not, nor is it intended to be, advice as defined and/or contemplated in the (SouthAfrican) Financial Advisory and Intermediary Services Act, 37 of 2002, or any other financial, investment, trading, tax, legal, accounting, retirement, actuarialor other professional advice or service whatsoever. Any South African person or entity wishing to effect a transaction in any security discussed herein shoulddo so only by contacting a representative of the Corporate & Investment Banking Division of Absa Bank Limited in South Africa, 15 Alice Lane, Sandton,Johannesburg, Gauteng 2196. Absa Bank Limited is a member of the Barclays group.
In Japan, foreign exchange research reports are prepared and distributed by Barclays Bank PLC Tokyo Branch. Other research reports are distributed toinstitutional investors in Japan by Barclays Securities Japan Limited. Barclays Securities Japan Limited is a joint-stock company incorporated in Japan withregistered office of 6-10-1 Roppongi, Minato-ku, Tokyo 106-6131, Japan. It is a subsidiary of Barclays Bank PLC and a registered financial instruments firmregulated by the Financial Services Agency of Japan. Registered Number: Kanto Zaimukyokucho (kinsho) No. 143.
Barclays Bank PLC, Hong Kong Branch is distributing this material in Hong Kong as an authorised institution regulated by the Hong Kong MonetaryAuthority. Registered Office: 41/F, Cheung Kong Center, 2 Queen's Road Central, Hong Kong.
Information on securities/instruments that trade in Taiwan or written by a Taiwan-based research analyst is distributed by Barclays Capital SecuritiesTaiwan Limited to its clients. The material on securities/instruments not traded in Taiwan is not to be construed as 'recommendation' in Taiwan. BarclaysCapital Securities Taiwan Limited does not accept orders from clients to trade in such securities. This material may not be distributed to the public media orused by the public media without prior written consent of Barclays.
This material is distributed in South Korea by Barclays Capital Securities Limited, Seoul Branch.
All equity research material is distributed in India by Barclays Securities (India) Private Limited (SEBI Registration No: INB/INF 231292732 (NSE), INB/INF011292738 (BSE) | Corporate Identification Number: U67120MH2006PTC161063 | Registered Office: 208 | Ceejay House | Dr. Annie Besant Road | ShivsagarEstate | Worli | Mumbai - 400 018 | India, Phone: + 91 22 67196363). Other research reports are distributed in India by Barclays Bank PLC, India Branch.
Barclays Bank PLC Frankfurt Branch distributes this material in Germany under the supervision of Bundesanstalt für Finanzdienstleistungsaufsicht (BaFin).
This material is distributed in Malaysia by Barclays Capital Markets Malaysia Sdn Bhd.
This material is distributed in Brazil by Banco Barclays S.A.
This material is distributed in Mexico by Barclays Bank Mexico, S.A.
Barclays Bank PLC in the Dubai International Financial Centre (Registered No. 0060) is regulated by the Dubai Financial Services Authority (DFSA). Principalplace of business in the Dubai International Financial Centre: The Gate Village, Building 4, Level 4, PO Box 506504, Dubai, United Arab Emirates. Barclays

Bank PLC-DIFC Branch, may only undertake the financial services activities that fall within the scope of its existing DFSA licence. Related financial products orservices are only available to Professional Clients, as defined by the Dubai Financial Services Authority.
Barclays Bank PLC in the UAE is regulated by the Central Bank of the UAE and is licensed to conduct business activities as a branch of a commercial bankincorporated outside the UAE in Dubai (Licence No.: 13/1844/2008, Registered Office: Building No. 6, Burj Dubai Business Hub, Sheikh Zayed Road, DubaiCity) and Abu Dhabi (Licence No.: 13/952/2008, Registered Office: Al Jazira Towers, Hamdan Street, PO Box 2734, Abu Dhabi).
Barclays Bank PLC in the Qatar Financial Centre (Registered No. 00018) is authorised by the Qatar Financial Centre Regulatory Authority (QFCRA). BarclaysBank PLC-QFC Branch may only undertake the regulated activities that fall within the scope of its existing QFCRA licence. Principal place of business in Qatar:Qatar Financial Centre, Office 1002, 10th Floor, QFC Tower, Diplomatic Area, West Bay, PO Box 15891, Doha, Qatar. Related financial products or servicesare only available to Business Customers as defined by the Qatar Financial Centre Regulatory Authority.
This material is distributed in the UAE (including the Dubai International Financial Centre) and Qatar by Barclays Bank PLC.
This material is distributed in Saudi Arabia by Barclays Saudi Arabia ('BSA'). It is not the intention of the publication to be used or deemed asrecommendation, option or advice for any action (s) that may take place in future. Barclays Saudi Arabia is a Closed Joint Stock Company, (CMA License No.09141-37). Registered office Al Faisaliah Tower, Level 18, Riyadh 11311, Kingdom of Saudi Arabia. Authorised and regulated by the Capital MarketAuthority, Commercial Registration Number: 1010283024.
This material is distributed in Russia by OOO Barclays Capital, affiliated company of Barclays Bank PLC, registered and regulated in Russia by the FSFM.Broker License #177-11850-100000; Dealer License #177-11855-010000. Registered address in Russia: 125047 Moscow, 1st Tverskaya-Yamskaya str. 21.
This material is distributed in Singapore by the Singapore branch of Barclays Bank PLC, a bank licensed in Singapore by the Monetary Authority of Singapore.For matters in connection with this report, recipients in Singapore may contact the Singapore branch of Barclays Bank PLC, whose registered address is OneRaffles Quay Level 28, South Tower, Singapore 048583.
Barclays Bank PLC, Australia Branch (ARBN 062 449 585, AFSL 246617) is distributing this material in Australia. It is directed at 'wholesale clients' as definedby Australian Corporations Act 2001.
IRS Circular 230 Prepared Materials Disclaimer: Barclays does not provide tax advice and nothing contained herein should be construed to be tax advice.Please be advised that any discussion of U.S. tax matters contained herein (including any attachments) (i) is not intended or written to be used, and cannotbe used, by you for the purpose of avoiding U.S. tax-related penalties; and (ii) was written to support the promotion or marketing of the transactions or othermatters addressed herein. Accordingly, you should seek advice based on your particular circumstances from an independent tax advisor.
© Copyright Barclays Bank PLC (2014). All rights reserved. No part of this publication may be reproduced or redistributed in any manner without the priorwritten permission of Barclays. Barclays Bank PLC is registered in England No. 1026167. Registered office 1 Churchill Place, London, E14 5HP. Additionalinformation regarding this publication will be furnished upon request.
