global transformations in pattern recognition of bubble chamber
TRANSCRIPT

IEEE TRANSACTIONS ON COMPUTERS, VOL. C-20, NO. 9, SEPTEMBER 1971
expect that DAPR's entirely automatic scanning processwill be the most satisfactory means offinding and measuringevents in this class of chambers.We view DAPR as a step toward the analysis of bubble
chamber data concurrently with the actual experiment.Presently, bubble chamber pictures are exposed at the rateof 4000 per hour, while their analysis proceeds many timesmore slowly. With the tandem FSD, DAPR will operatewithin a factor of 10-15 of this exposure rate using therelatively slow IBM 7094 computer. Given the develop-ment of suitable data acquisition hardware which can lookdirectly at the chamber and can digitize the information inreal time, several computers exist even now with centralprocessor speeds sufficient to perform the DAPR processin real-time synchronism with the chamber operation. Thusa DAT could replace the photographic film as the primarystore ofinformation from the experimental run. Concurrentanalysis would not only relieve the massive bottleneck indata analysis, but also could serve to feed back importantinformation useful in guiding the course of the experimentwhile it is still in process.We believe that entirely automatic feature extraction
has been achieved for bubble chamber data by the DAPRsystem. This process is already more economical than
manual systems. Furthermore, it is rapidly becoming moreeffective. The complete automation of this process opensnew vistas for bubble chamber experimentation.
ACKNOWLEDGMENTThe development ofDAPR has been truly the result ofthe
efforts of many people. D. Hall has made invaluable con-tributions to all parts of the DAPR system, and is primarilyresponsible for the design and implementation of the trackcertification, matching, and cleanup procedures. Pro-grammers Joan Franz, Barbara Britton, and Wen-Sue Geehave made the programs reliable and versatile tools forfeature extraction. The continued support of LRL DirectorE. McMillan has made this development possible.
REFERENCES[1] H. S. White, "Status of the LRL flying spot digitizer," in 1966 Proc.
Int. Conf. Instrumentation for High Energy Physics (Stanford, Calif.).Springfield, Va.: Clearinghouse for Federal Scientific and TechnicalInformation, NBS.
[2] P. V. C. Hough and B. W. Powell, "A method for faster analysis ofbubble chamber photographs," in 1960 Proc. Int. Conf. Instrumenta-tion for High Energy Physics (Berkeley, Calif.). New York: Inter-science, 1961.
[3] H. S. White and D. E. Hall, "Performance of the DAPR system," inProc. 10th Int. Co/i'f Data Handling Systems in High Energy Physics(Cambridge, England, March 1970), in press.
Global Transformations in PatternRecognition of Bubble Chamber
Photographs
PIERRE L. BASTIEN AND LAWRENCE A. DUNN
Abstract-In this paper we present some new ideas on patternrecognitiQrl of bubble chamber photographs. We have found globaltransformations that reduce circular tracks to a point in a two-dimensional angle-curvature space. The performance of this trackingmethod on a sample of bubble chamber events is presented andplanned irmprovements are discussed.
Index Terms-Angle-curvature space, bubble chamber photo-graphs, clustering techniques, global tracking, image processing,orthogonal transformations, pattern recognition.
Manuscript received January 4, 1971; revised April 12, 1971. This workwas supported by the National Science Foundation under Grant USDG,GU-2655. A preliminary version of this paper was presented at the IEEESymposium on Feature Extraction and Selection in Pattern Recognition,Argonne, Ill., October 5-7, 1970.
The authors are with the Visual Techniques Laboratory, Departmentof Physics, University of Washington, Seattle, Wash. 98105.
I. INTRODUCTIONUBBLE chambers have been used since 1954 to studyhigh-energy collisions. Millions of bubble chamberphotographs are being produced and analyzed
through various systems each year. Many systems are nowperforming well; however, one would like to further im-prove the speed and especially the efficiency with whichbubble chamber events can be extracted from film. The ulti-mate goal is to implement a practical, full pattern recogni-tion system.We present some new ideas on pattern recognition of
bubble chamber photographs. Global transformations areused on the raw data obtained by scanning the pictures witha CRT device. These transformations allow the extraction
995

IEEE TRANSACTIONS ON COMPUTERS, SEPTEMBER 1971
of entire tracks at once from all the digitizations. Thistype of global approach was originally suggested a fewyears ago [1], [9]. We have found that there exist two"orthogonal" transformations that can be conjunctivelyapplied to the raw data. This new approach is considerablymore powerful and has been successfully tried on bubblechamber film.
This paper is divided into four sections: 1) a limited de-scription of the hardware that is used to gather the data, a
CRT scanner called PEPR; 2) the global transformations;3) preliminary results obtained with our system; and 4)discussion of the improvements which are currently beingcontemplated.
II. PEPR HARDWAREThe PEPR hardware was proposed by Pless and Rosen-
son at M.I.T. [2] and developed by Pless, Wadsworth, andothers. It is a CRT scanner that uses a flying line segmentto locate track elements. This hardware has been describedin several publications and only the relevant details are
reviewed in this paper. The reader is referred to other publi-cations on this subject for a more complete description [3].A schematic drawing of the PEPR system is shown in
Fig. 1. A computer is attached on line to the hardware:in our case, a PDP-10 with a 48K memory. A 20-p spot canbe produced on the CRT at any one of 4096 x 4096 points.We define these as scan points. The distance between eachscan point is 25 p on the CRT (also called a main deflectioncount, MDC). Besides the spot, a line segment of variouslengths (2, 1, 1/2, 1/4 mm) can be generated by means of adiquadrupole. The line segment can be oriented at any
angle and swept either in the x or y direction from any one
of the 4096 x 4096 scan points for a distance of either 200 ,or 2 mm.The flying line segment is projected onto the film plane
by means ofa high-resolution lens with a 1: 1 magnification.The light transmitted through the film is amplified by a
photomultiplier. If a track happens to be on the film at thecorrect angle on a sweep, it will produce a characteristicpulse which is recognized by the track element detecting(TED) circuits. The output of the TED circuits gives posi-tion(s) of the track element(s) in a sweep. These data or
"hits" are sent back to the computer that then decideswhere to scan next. There are two sweep speeds: a slowsweep that covers 200 p and gives a 2-p accuracy on thecenter of the track, and a fast sweep that covers 10 times as
much distance (2 mm) and gives an accuracy of 20 p.
Let us look in detail at the sweeping of a line segmentof width D and length L across a slit of width W. Thetheoretical light output for various angles between theline segment and the slit are shown in Fig. 2(a). In actualpractice what is seen by the photomultiplier of the PEPRhardware when scanning a bubble chamber track is shownin Fig. 2(b). In this figure, seven slow sweeps are shownand the angle of the line segment is being increased by 1°on each sweep; the sharpest pulse occurs when the line seg-ment is tangent to the track.The track element detector circuits operate as follows. If
Fig. 1. Schematic of the PEPR system.
0
I-
w1-. .. .
Width atO holf - height
O 25
362 70
3 1054 1405 175
= 4e
I 5e
Relative Displocement oa Line Segment and Slit
(a)
(b)Fig. 2. Photomultiplier output for a range of orientations of a swept
line segment. (a) Theoretical. Light output from slit crossed by linesegment having, uniform intensity distribution (for case where D Wand L/D= 80). (b) Actual.
996
1: 1°I

BASTIEN AND DUNN: PATTERN RECOGNITION OF BUBBLE CHAMBER PHOTOGRAPHS
at some time t the photomultiplier signal V(t) satisfies thefollowing conditions,
V(t - At) = V(t + At)V(t) . 2V(t - At)V(t) > vthreshold,
the pulse is taken as a hit. The time t gives the position ofthe center of the pulse. The parameter At is adjustable bymeans of delay lines and controls the maximum width ofthe pulse.
It should be obvious from Fig. 2(b) that the TED circuitswill in general fire at several angles around the tangent angleand that some angle-averaging procedure is necessary. Thisis done by software and is fairly involved. It turns out thatthe angle is known with an accuracy of roughly 2°. Detailson this part of the software and on the complex calibrationswhich have to be made will be found in [4].
In summary, we can determine both the x, y coordinateand the angle i of the track element. A triple x, y, 4 is calledan element. The final accuracy on x, y is approximately 5 4uand 4 is known to 20.
III. GLOBAL TRANSFORMATIONSOur approach to the software is called "vertex guidance"
in high-energy physics: the film is prescanned for interestingevents and the vertex point is measured and given as inputto tIheprogram. These operations take place on a devicecalled.image plane digitizer (IPD).Asan example, look at the picture shown in Fig. 9. There
are two-sitx-rg ents- on the picture and the positions ofboth vertices will be given to the program. We assume forthe purposes of discussion that the accuracy with whichthe vertex point is measured on the IPD machine is muchbetter than a track width. This is not actually the case andwe shall discuss in Section VI how we handle the real-lifesituation.We define a cell scan: From any one of the 4096 x 4096
scan points we scan at all angles, as shown on Fig. 3. Be-tween -45° and 440 the line segment is swept along y, andbetween 450 and 135° it is swept along x. The cell scan willin general yield a certain number of track elements (x, y, ).An area scan is a set of cell scans that cover the entire
picture. The scan points of an area scan are in generalseparated by -0.5 mm, implying an overlap of 50 percent.To each element (x, y, O) found in the area scan, two trans-
formations are applied. For each element one computesthe potential curvature (- p) and an angle (_ii, based onthe vertex point and the (x, y, 4),n coordinate of the element.When the (p, i/), values corresponding to each element areplotted on a two-dimensional scatter plot, circular tracksemanating from the vertex are reduced to a point cluster.Tracks that do not go through the vertex are spread asbackground over the scatter plot.A. i/ transformationsThe geometry of the i/ transformation is shown in Fig. 4.
It is easy to see that, for all the elements (subscript n) belong-ing to a circular track (superscript i) emanating from the
y
fLrmm+ 134°
- 45°
Fig. 3. Line orientation determines the scan axis.
Fig. 4. Geometry of the / transformation.
Fig. 5. The p transformation separates two segmentsin the same ,iG pulse.
vertex V (and ignoring errors), the following relation holds:
=n 3n + OA = vi (1)
5n is the difference between the angle of the chord from thevertex point to (xn, yn) and Ong A is the angle between thex axis and the chord, and Qi/ is the angle between the tangentto track i at the vertex point and the x axis.The error on /in is constant over the whole PEPR scope,
except very near the vertex, and is approximately equal to 2°:
(2)
If we histogram all ql,'s for the area scan, circular tracksemanating from the vertex will show as pulses of width 20,independent of the curvature of the track.
B. p transformationsIn Fig. 5 we show a configuration where both tracks have
the samne tangent at the vertex point, and therefore will fallin a single i/ pulse. It is possible to separate them by taking
997
0A.n- AOn '+2.

98IEEE TRANSACTIONS ON COMPUTERS, SEPTEMBER 1971
-;- ~~~-
Fig. 6. Bubble chamber photograph of a y-ray event.
the elements belonging to the t/ pulse and making a histo-gram of the curvature (pn) for those elements. The curvatureis computed by the following relation:
2 sin cnpn= (3)
The error on p is not nearly as well behaved as the erroron+:
2Apn = d cos 6 Ab6
However, one notices that
dp 2 dd sin ( - OA) 1 d2d fl d dqsln' d
- -
(a)
4-
-4
Us
50
+30
+10
-10
-30-
-50
-20 -4 12 28 44 60
DEGREES
(b)
_+
+
(c)
Fig. 7. Transformation sequence isolating the two tracks ofthe y ray shown in Fig. 6.
20
16
ERz0
EUz
,
(4)
12
8
4
0(5)
Therefore, the errors on p and tf are very strongly cor-related, even though p and q/ themselves are "orthogonal"quantities. Consequently, it is better to histogram thequantity p'
P:n = P. + d -n)
0 10 20 30 40 50
DEGREES
(a)20
16
(6)
where i is the average value of a q/ pulse.To make absolutely clear what is meant by these two
transformations, we choose to show the results of the pro-gram on the y ray of Fig. 6. By y-ray event we mean ma-terialization of a photon into an electron and a positron inthe field of a nucleus. The point is that the photon has nomass, and therefore the opening angle between the electronand the positron is zero. So in effect this event is analogousto Fig. 5. A coarse mesh area scan of the y ray is shown inFig. 7(a) (scan points separated by 2 mm). The program isgiven the position of the y-ray vertex and computes the pand tl values for each element. A plot of these is shown inFig. 7(b). The two concentrations of points correspond tothe electron and the positron. One also notes the strongcorrelation between p and 4l. A simple program can easilyisolate these two concentrations and obtain whole tracksat once. The resulting tracks are shown in Fig. 7(c).To isolate the concentrations, we project the scatter plot
on the 4/ axis and obtain the histogram shown in Fig. 8(a).
Piz0
ERz
53
12-
8-
4 -
0 )UL+ ---50 -34 -18 -2 2
CURVATURE (x 10 )
14 30
(b)Fig. 8. (a) Projection of the scatter plot in Fig. 7(b) onto the i/ axis.
(b) Projection of the isolated V/ pulse onto the p axis.
The program recognizes the q/ pulse and projects the ele-ments in that pulse on the p axis [Fig. 8(b)]. The pulserecognition algorithm is now applied to the p histogram.
Finally, the elements in a p pulse are processed through acircle-fitting routine that is capable of eliminating elementswith large residuals.
I
I
998
BASTIEN AND DUNN: PATTERN RECOGNITION OF BUBBLE CHAMBER PHOTOGRAPHS
IV. PERFORMANCE OF THE PROGRAM ON 91 EVENTS
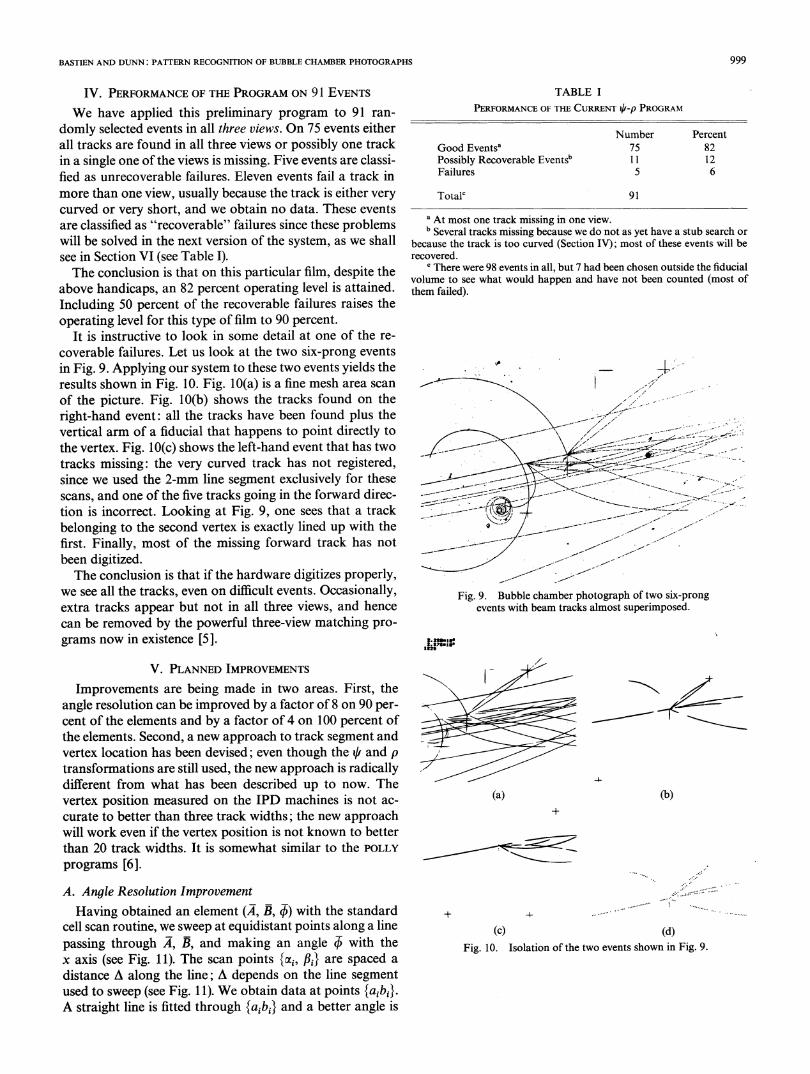
We have applied this preliminary program to 91 ran-domly selected events in all three views. On 75 events eitherall tracks are found in all three views or possibly one trackin a single one of the views is missing. Five events are classi-fied as unrecoverable failures. Eleven events fail a track inmore than one view, usually because the track is either verycurved or very short, and we obtain no data. These eventsare classified as "recoverable" failures since these problemswill be solved in the next version of the system, as we shallsee in Section VI (see Table I).The conclusion is that on this particular film, despite the
above handicaps, an 82 percent operating level is attained.Including 50 percent of the recoverable failures raises theoperating level for this type of film to 90 percent.
It is instructive to look in some detail at one of the re-coverable failures. Let us look at the two six-prong eventsin Fig. 9. Applying our system to these two events yields theresults shown in Fig. 10. Fig. 10(a) is a fine mesh area scanof the picture. Fig. 10(b) shows the tracks found on theright-hand event: all the tracks have been found plus thevertical arm of a fiducial that happens to point directly tothe vertex. Fig. 10(c) shows the left-hand event that has twotracks missing: the very curved track has not registered,since we used the 2-mm line segment exclusively for thesescans, and one of the five tracks going in the forward direc-tion is incorrect. Looking at Fig. 9, one sees that a trackbelonging to the second vertex is exactly lined up with thefirst. Finally, most of the missing forward track has notbeen digitized.The conclusion is that if the hardware digitizes properly,
we see all the tracks, even on difficult events. Occasionally,extra tracks appear but not in all three views, and hencecan be removed by the powerful three-view matching pro-grams now in existence [5].
TABLE IPERFORMANCE OF THE CURRENT qi-P PROGRAM
Number PercentGood Eventsa 75 82Possibly Recoverable Events" 11 12Failures 5 6
Totalc 91
a At most one track missing in one view.b Several tracks missing because we do not as yet have a stub search or
because the track is too curved (Section IV); most of these events will berecovered.
There were 98 events in all, but 7 had been chosen outside the fiducialvolume to see what would happen and have not been counted (most ofthem failed).
Fig. 9. Bubble chamber photograph of two six-prongevents with beam tracks almost superimposed.
:, Ms
V. PLANNED IMPROVEMENTSImprovements are being made in two areas. First, the
angle resolution can be improved by a factor of 8 on 90 per-cent of the elements and by a factor of 4 on 100 percent ofthe elements. Second, a new approach to track segment andvertex location has been devised; even though the / and ptransformations are still used, the new approach is radicallydifferent from what has been described up to now. Thevertex position measured on the IPD machines is not ac-curate to better than three track widths; the new approachwill work even if the vertex position is not known to betterthan 20 track widths. It is somewhat similar to the POLLYprograms [6].
A. Angle Resolution ImprovementHaving obtained an element (A, B, )) with the standard
cell scan routine, we sweep at equidistant points along a linepassing through A, B, and making an angle / with thex axis (see Fig. 11). The scan points {ai, fpi} are spaced adistance A along the line; A depends on the line segmentused to sweep (see Fig. 11). We obtain data at points {aibi}.A straight line is fitted through {ajbj} and a better angle is
(a)+
t-
4-
(b)
+4
(c) (d)Fig. 10. Isolation of the two events shown in Fig. 9.
999
.:.: ..... ... :::::.... "
............. ...................
..... .....

IEEE TRANSACTIONS ON COMPUTERS, SEPTEMBER 1971
F *1'~~~~~~~~,
sweep direction
Values Of A Currently In Use* Line/ SegmentA
/ 2mm 35.0M1DCmm 25.0MDC
1/2mm I5O0MDC/4) 1/4mm IOOMDC
Fig. 11. Sweep positions for angle resolution improvement.
obtained. The number of extra sweeps used is two, excludingthe point A, B.
If a single one of the sweeps does not register, we do notuse the element since it is most likely that something iswrong, i.e., crossing track, gap, etc.A qlp scatter plot for a three-prong event with this new
cell scan routine is shown in Fig. 12(b) and with the old cellscan in Fig. 12(a). The improvement is considerable and we
remind the reader that our results on the 91 events were ob-tained with the old cell scan.
B. Track Segment and Vertex Location
We now discuss our strategy for events where the vertexis poorly known. The error on the input vertex position isassumed to be a maximum of 20 MDC (250 Iu on film). Thefirst step is the data gathering. Using the input vertex as
center, an area scan is performed in the circular area ofradius 600MDC (7.5 mm on film). The 1/4-mm line segmentis used to a radius of 250 MDC and the 1-mm line segment isused in the annulus from about 300 to 600 MDC radius. It isnot necessary to perform the scan at all angles since thesegment length needed to determine curvature and centercoordinates for road scanning of the track is inversely pro-
portional to the curvature. The angular range used at a givenposition may be approximated in the following way (seeFig. 13):
(01 02) = (ko-O(d), o0 + 0(d)),
00 = arctan -
where d is the distance between (xv, yv) and (x, y),
0(d) = 00 + kl
Suitable values for (00, k1, k2) are (10, x 1.2 x 10⁴).The 1/4-mm line segment is used in the area where high-
curvature tracks would be seen. The data gathering is per-formed in a sequence that orders the located elements bydecreasing (or increasing) distance from the given vertexposition. Local inversions of that order can occur, but are
irrelevant since local order is rapidly achieved for elementson the same track. This is important for later processing.The next step is to group the elements into track segments.
+30
+18
x
E-)4
+ 6
- 6
-18
-30
+30
+18
x-4
,:4CDle.
+ 6
- 6
-18
-30
l I
-40 -22 -4 +14 +32 +50
DEGREES
(a)
l I
-40 -22 -4 +14 +32 +50
DEGREES
(b)Fig. 12. Effect of the angle resolution improvement
on the f-p scatter plot.
(Y -Yv)
(X Y)vVertex
e(d)
(X-X )
0 200 400 600 800 1000
d, MDC
Fig. 13. Limits on the scan angle range.
(0, qb) = (+0,- (d), qbO+ 0(d) ) f
0 = arctonx
v / p
8(d
S P, 200 29.2°/ P2 400 5. 8°
/8¢>o ~~~p3 600 2.70 _ _
1000
BASTIEN AND DUNN: PATTERN RECOGNITION OF BUBBLE CHAMBER PHOTOGRAPHS
This is accomplished by taking the most distant elementfrom the vertex and using its position and angle to performthe V-p-circle fit sequence on the remaining elements inthe bank. This will either unambiguously yield a track seg-ment or cause a removal of that element from further con-
sideration. Then take the next most distant unused elementfrom the bank and perform the same transformations. Dothis until the element bank is exhausted.Any segment outside of the expected error range of the
vertex position is removed from further consideration. Theremoval of elements that fail to yield an unambiguous seg-ment can occur only for elements whose angle is incorrect.These elements usually result from an occasional false ele-ment at small angle crossings. To be recognized, a segmentshould have a minimum of four elements within the ex-
pected dispersion on /, p and circle-fit transformations.With the angle accuracy now obtainable with the cell scan
routine, the only reason for missing a track should be thelack of digitizations that result for very short tracks andstubs and for tracks not resolvable by the detection circuitsbecause they lie close to and parallel to another track.
Following segment location, the position and tangentangle of each fitted segment at the point of the arc closest tothe given vertex position are calculated. These are usedpairwise to obtain intersection points when the tangentangles differ by 10 or more. A point cluster will occur atthe real vertex position and can be easily distinguished frombackground intersections. Only rarely, less than 1 percentof the time, can a background and event topology yield a
second point cluster that will cause an incorrect determina-tion of the vertex position. The real vertex position iscalculated as an average of the coordinates in the cluster.Since the error range of the vertex is now considerably re-
duced, remaining background can now be removed exceptwhen it passes close enough to nearly overlay the vertex.Some of the overlaying background can be removed sincethe number oftracks for the event is known; hence an excess
can be detected. The existence of an overlaying track is partof the input data; hence it is known when to expect such a
case.
Failure to determine the vertex position occurs on lessthan 5 percent of the events and its occurrence is almostalways an indication that the event is not digitizing wellenough to determine track segments. This usually means
that the film plane is out of focus or the operational levelof the scanner is marginal or the film contrast is very poor.The only other reason for failure would be an input vertexposition outside of the expected range of a detected clusterand is easily distinguishable from a lack of digitizations.The discussion on vertex determination applies to eventswith more than two outgoing tracks, since frequently, fortwo prongs, a cluster does not result or is not unambig-uously distinguishable from background. The maximumnumber of intersections expected in the cluster is given by
n(n - 1)2
where n is the number of tracks emanating from the vertex.
VI. CONCLUSIONSSome work remains to be done in order to bring this sys-
tem to its full capability. We feel that this approach has greatpotential because of its global character. When followingtracks locally, one is always plagued with gaps caused eitherby poor contrast on some area of the frame or by crossingtracks at narrow angles that confuse the hardware. Theglobal approach essentially eliminates this problem pro-vided the tracks are circles. This is an excellent approxima-tion to real life, especially at very high energies where mostof the research in the field is currently being done.Another interesting development in bubble chamber
physics is the new trend towards hybrid systems [7], [8].Counters are used to ensure that interesting interactionshave occurred in the chamber before a picture is taken. Oneis therefore guaranteed an event on every picture and fullpattern recognition becomes economically feasible by fol-lowing beam tracks until they interact. Our software is veryeasily adaptable to this sort of film and we are planning toanalyze some in the near future.
ACKNOWLEDGMENTThe authors would like to thank Prof. H. J. Lubatti for
his enthusiastic support of the project and Prof. L. Kirk-patrick for his frequent and v,aluable assistance. They arealso indebted to Prof. I. Pless, Prof. R. Hulsizer, andB. Wadsworth for use of the PEPR facilities at M.I.T.'sLaboratory for Nuclear Science in obtaining the data, andto B. Wadsworth for providing them with Figs. 1-3. Theyalso wish to thank Ms. L. Ellis and D. Menasian for pre-paring the illustrations and Ms. V. Blogg for typing thepaper.
REFERENCES[1] M. J. Bazin and J. W. Benoit, "Off-line global approach to pattern
recognition for bubble chamber pictures," IEEE Trans. Nucl. Sci.,vol. NS-12, Aug. 1965, pp. 291-295.
[2] I. A. Pless and L. Rosenson, Proposal to the U. S. Atomic EnergyCommission for the development of a precision encoder and patternrecognition device (PEPR) in the M.I.T. Laboratory for NuclearScience, Feb. 1961.
[3] B. F. Wadsworth, "PEPR, a hardware description," presented at theComput. Graphics Conf., Univ. Illinois, Urbana, Nov. 1967.
[4] P. L. Bastien, T. L. Watts, R. K. Yamamoto, M. Alston, A. Rosenfeld,F. Solmitz, and fI. Taft, "Programming for the PEPR system,"in Methods in Computational Physics, vol. 5. New York: Academic,1966.
[5] P. L. Bastien, J. N. Snyder, and V. Pless, "Match, a track matchingprogram for bubble chamber photographs," J. Comput. Phys., to bepublished.
[6] W. W. Allison, F. Beck, D. Hodges, J. G. Loken, B. Musgrave, H. B.Phillips, R. Royston, and R. A. Sunde, "Automatic scanning andmeasurement of bubble chamber film on POLLY II, in Proc. 2ndInt. Colloq. PEPR, May 5-7, 1970.
[7] D. H. Brick, D. Goloskie, I. A. Pless, E. Sartori, B. Wadsworth, R. A.Gearhart, J. J. Murray, and H. J. Lubatti, "Test of counter controlledbubble chamber photography," presented at the Int. Conf. on Instrum.for High Energy Phys., Dubna, U.S.S.R., Sept. 1970.
[8] B. Barish, W. Ford, R. Gomez, C. Peck, J. Pine, F. Sciulli, B. Sher-wood, A. Tollestrup, and G. Zweig, SLAC Proposal BC-25, Mar. 1969.
[9] B. M. McCormick and D. Innes, "The spiral reader measuring pro-jector and associated filter program," in Proc. Int. Conf. Instrum.for High-Energy Phys., Lawrence Radiation Lab., Sept. 1960, Inter-science, 1961.
1001