global views 03-27-15 - global banking and markets · global views corporate bond research contact...
TRANSCRIPT

Foreign Exchange Strategy Fixed Income Strategy Fixed Income Research Emerging Markets Strategy Portfolio Strategy Economics
Weekly commentary on economic and financial market developments
Global Views
Corporate Bond Research
Contact Us
Global Views is available on scotiabank.com, Bloomberg at SCOT and Reuters at SM1C
March 27, 2015
Economics
If Nonfarm Hiring Falls Will Anyone Hear It? 2-4
Derek Holt
Global Housing Recovery Remains Uneven 5
Adrienne Warren
BoJ And ECB Entering Uncharted Waters As The Fed And BoE Retreat 6-8
Alan Clarke, Frances Donald, Derek Holt and Frédéric Prêtet
Merchandise Export Growth Shifts Towards Central Canada 9
Warren Kirkland and Mary Webb
Is The US Housing Market About To Enter A Sweet Spot? 10-11
Derek Holt
The UK’s Economic Outlook Remains Sound 12
Alan Clarke and Erika Cain
Foreign Exchange Strategy
Macro EM Asia FX View: CNH Favoured Over TWD 13-16
Sacha Tihanyi
Key Data Preview A1-A2
Key Indicators A3-A5
Global Auctions Calendar A6-A7
Events Calendar A8
Global Central Bank Watch A9
Latest Economic Statistics A10-A11
Latest Financial Statistics A12
Global Forecast Update Report
Forecasts & Data
This Week’s Featured Chart
Please see the Global Forecast Update, February 26, 2015, for our latest economic, interest and exchange rate and commodity price forecasts and the Foreign Exchange Outlook, March 2015, for more detailed currency forecasts and commentary.
130
150
170
190
210
230
250
02/05 02/07 02/09 02/11 02/13 02/15
Greek Deposits Reach A 10-Year Low
€, billions
Source: Scotiabank Economics, Bank of Greece.
Private Sector Bank Deposits

Economics
Global Views
March 27, 2015
2
If Nonfarm Hiring Falls Will Anyone Hear It?
Please see our full indicator, central bank, auction and event calendars on pp. A3-A9.
Canada — Front-Loaded Shocks
The first quarter is shaping up to be very soft for Canada in support of the Bank of Canada’s argument that the effects of the oil price shock will be front-loaded. Very little if any growth is on track to be registered in Q1. Nothing can be done about that now, but that doesn’t mean the resulting slack should not be countered with greater monetary policy stimulus. That’s where the debate lies now with markets still pricing in decent odds of another rate cut by mid-year or later notwithstanding Governor Poloz’s latest remarks (here).
We’ll get a reminder of all of this in Tuesday’s GDP print for the month of January. While it’s just a monthly figure, Ottawa’s statisticians have been digging a deep enough hole that it will be tough to salvage growth in Q1. Enter chart 1. This is what we are tracking by way of annualized and seasonally adjusted contractions in the first quarter for key types of economic activity amid few and small expansions in some indicators based upon what we know of the Q4 hand-off and the first month of 2015Q1. For just the first month of the new year, activity was uniformly lower and that has us expecting a sizeable drop in January GDP. Let’s start with the positives. Recall that hours worked were up 0.1% m/m as a surge in part-time jobs outweighed a drop in full-time employment. Housing starts were also up by 4.5% m/m but this was due to longer-lived multis that were up 13% and that are particularly made up of condos while single housing starts that are more impactful on nearer term construction activity fell 4.2% m/m.
Now for the negatives. Home sales fell 2.4% and that could negatively affect industries providing ancillary services to housing like professional and financial services. Retail sales volumes fell 1.2% m/m for the second consecutive month, wholesale sales were down 3.3%, vehicle sales fell 7% m/m, and manufacturing shipment volumes slipped by 1% m/m. Trade was also a negative with export volumes down 1.4% m/m and import volumes down by a lesser 0.1%. We’ll get the February trade update on Thursday next week but recall that Statistics Canada assumes much of the energy side of the trade picture until hard company data arrives later, so treat the first pass at the trade figures as a ‘draft’.
US — Respect The Good Friday Effect
The latest nonfarm payrolls print will land on Good Friday when most global markets are shut. Oops, someone didn’t get the memo. It is expected to exhibit a cooler pace of hiring compared to the 295k pace of the prior month as temporary (we think) distortions to growth may interrupt the pace of hiring. The day is not a
Derek Holt 416.863.7707 [email protected]
THE WEEK AHEAD
Next Week's Risk Dashboard
US nonfarm payrolls…
…on a liquidity constrained Good Friday
Other US macro risks
FOMC speak
Canadian GDP
Eurozone CPI
Eurozone consumer spending
China’s state PMI
UK PMI
UK Party Leaders debate
Hou
sing
Sta
rts
Hom
e R
esal
es
Ret
ail S
ales
Who
lesa
le S
ales
Veh
icle
Sal
es
Impo
rt V
olum
es
Em
ploy
men
t
Hou
rs W
orke
d
Exp
ort
Vol
umes
Mfg
. S
ales
Vol
umes
-35
-30
-25
-20
-15
-10
-5
0
5
Weak Q1 In Canada
q/q % change seasonally adjusted at an annualized rate
Source: Scotiabank Economics, Statistics Canada, CMHC.
Chart 1

Economics
Global Views
March 27, 2015
3
… continued from previous page
Federal holiday in the US. US equity cash markets will nevertheless be shut including the NYSE and Nasdaq that reopen on Monday, although equity futures will be open briefly that morning and bonds will be open for a half day on Friday. Many European markets will be closed for both Good Friday and Easter Monday. Chinese markets will be shut by the time the Friday morning figures are released, and then shut again on Monday for the separate Qingming Festival otherwise known as Tomb-Sweeping day so they’ll have to wait until Tuesday to react — much like Europe. Canada is closed on Friday but will react to nonfarm spillover effects on Monday.
Nonfarm landing on Good Friday actually has plenty of precedent and last happened in 2012. Chart 2 shows that there were 10 times when the change in nonfarm payrolls was reported on Good Friday dating back to 1980 and what happened to 10 year Treasury yields from the close on the day before until the close of the following Monday to capture most of a market move through scattered global market closures. Ideally we would want the surprise to consensus but this is not available over the whole period. That said, there are times when soft payrolls coincide with significant rallies (like 1980) and times like 1994 and again in 1996 when the opposite happens. There is about a 75% directional correlation between nonfarm prints and movements in US 10 year yields on these days. Don’t fully discount Good Friday distortions, in other words, but don’t take them to the bank either. The Good Friday landing will mean that some markets may be advantaged over others and that any global market effects will be spread out over multiple days. Usually it doesn’t matter much, but market participants with a few grey hairs — or fewer period — may recall that when nonfarm landed on Good Friday in 1994 the effects were rather calamitous over a few days. Recall that back then job growth smashed expectations by about 236,000 jobs above consensus and the final estimate for job growth in March 1994 came in at 465,000 which accelerated Fed Chairman Alan Greenspan’s path toward 300bps of hikes. It would take a large surprise to again matter much to markets this time around as the Federal Reserve’s dual mandate has been shifted toward inflation underperformance such that jobs really only seem to particularly matter right now if the trend sharply disappoints.
Several other macro releases will be on tap including first, second and third tier reports like February’s consumer spending and incomes plus pending home sales on Monday, S&P Case-Shiller home prices and consumer confidence on Tuesday, ISM manufacturing and ADP payrolls and vehicle sales on Wednesday, and international trade and factory orders for February on Thursday.
Federal Reserve communications will also be fairly intense including from the top of the house. Chair Yellen provides opening remarks at an economic mobility conference on Thursday, and Vice Chair Stanley Fishcher speaks on monetary policy and financial stability on Monday. Three voting regional Fed Presidents will speak (Lacker, Lockhart, and Williams) two alternate voters will also speak (Mester, George), and so will Kocherlakota who is nonvoting this year.
Europe — Reflation Coming?
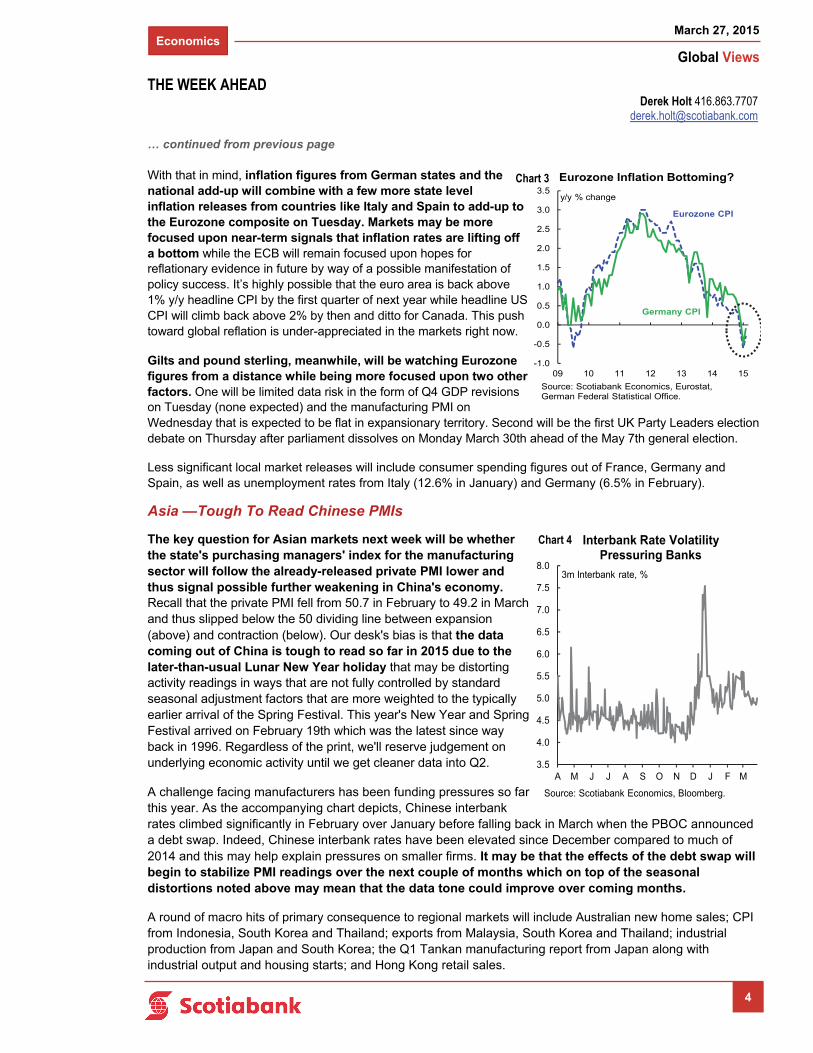
Few obsessions rank as highly in economics these days as watching inflation figures. It often seems that the forward-looking conduct of monetary policy actions includes a great deal of time looking at the latest rear-view inflation assessment with some explicitly framing this in the context of data dependency that connotes a backward-looking policy bias. That’s less so in the Eurozone these days by contrast to, say, the US and UK as the latter two countries’ central banks ponder exit timing. Or the Bank of Japan where the possible persistence of inflation downsides beyond transitory matters may influence the debate over whether to apply additional stimulus. The ECB, however, is more likely treating inflation figures as stale compared to the 6-12+ month policy lags of expansionary monetary policy on inflation readings.
Derek Holt 416.863.7707 [email protected]
THE WEEK AHEAD
-50
-40
-30
-20
-10
0
10
20
30
40
50
60
-500
-400
-300
-200
-100
0
100
200
300
400
500
600
80 83 85 88 94 96 99 07 10 12
Good Friday & Nonfarm Sometimes Don't Mix Well
change in yield, bps
Source: Scotiabank Economics, BLS.
change in March NFP, 000s
U.S. 10 Year Treasury (RHS)
U.S. Nonfarm Payrolls
(LHS)
Chart 2
Economics
Global Views
March 27, 2015
4
… continued from previous page
With that in mind, inflation figures from German states and the national add-up will combine with a few more state level inflation releases from countries like Italy and Spain to add-up to the Eurozone composite on Tuesday. Markets may be more focused upon near-term signals that inflation rates are lifting off a bottom while the ECB will remain focused upon hopes for reflationary evidence in future by way of a possible manifestation of policy success. It’s highly possible that the euro area is back above 1% y/y headline CPI by the first quarter of next year while headline US CPI will climb back above 2% by then and ditto for Canada. This push toward global reflation is under-appreciated in the markets right now.
Gilts and pound sterling, meanwhile, will be watching Eurozone figures from a distance while being more focused upon two other factors. One will be limited data risk in the form of Q4 GDP revisions on Tuesday (none expected) and the manufacturing PMI on Wednesday that is expected to be flat in expansionary territory. Second will be the first UK Party Leaders election debate on Thursday after parliament dissolves on Monday March 30th ahead of the May 7th general election.
Less significant local market releases will include consumer spending figures out of France, Germany and Spain, as well as unemployment rates from Italy (12.6% in January) and Germany (6.5% in February).
Asia —Tough To Read Chinese PMIs
The key question for Asian markets next week will be whether the state's purchasing managers' index for the manufacturing sector will follow the already-released private PMI lower and thus signal possible further weakening in China's economy. Recall that the private PMI fell from 50.7 in February to 49.2 in March and thus slipped below the 50 dividing line between expansion (above) and contraction (below). Our desk's bias is that the data coming out of China is tough to read so far in 2015 due to the later-than-usual Lunar New Year holiday that may be distorting activity readings in ways that are not fully controlled by standard seasonal adjustment factors that are more weighted to the typically earlier arrival of the Spring Festival. This year's New Year and Spring Festival arrived on February 19th which was the latest since way back in 1996. Regardless of the print, we'll reserve judgement on underlying economic activity until we get cleaner data into Q2.
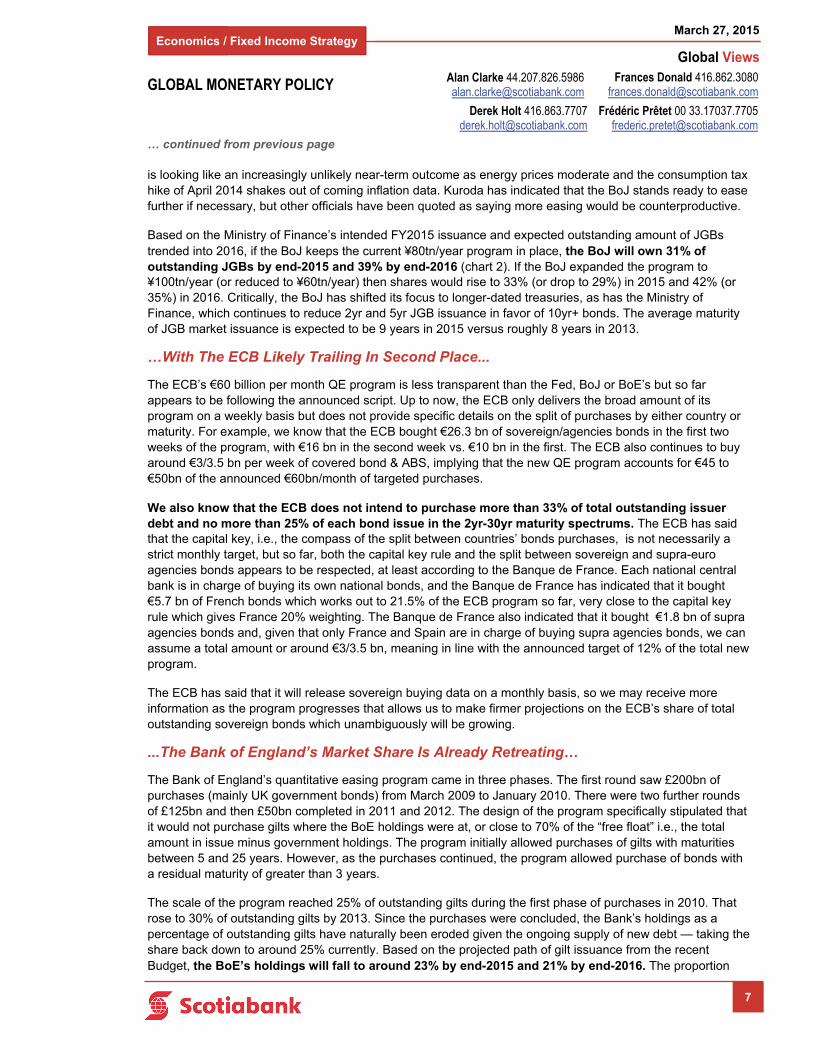
A challenge facing manufacturers has been funding pressures so far this year. As the accompanying chart depicts, Chinese interbank rates climbed significantly in February over January before falling back in March when the PBOC announced a debt swap. Indeed, Chinese interbank rates have been elevated since December compared to much of 2014 and this may help explain pressures on smaller firms. It may be that the effects of the debt swap will begin to stabilize PMI readings over the next couple of months which on top of the seasonal distortions noted above may mean that the data tone could improve over coming months.
A round of macro hits of primary consequence to regional markets will include Australian new home sales; CPI from Indonesia, South Korea and Thailand; exports from Malaysia, South Korea and Thailand; industrial production from Japan and South Korea; the Q1 Tankan manufacturing report from Japan along with industrial output and housing starts; and Hong Kong retail sales.
Derek Holt 416.863.7707 [email protected]
THE WEEK AHEAD
3.5
4.0
4.5
5.0
5.5
6.0
6.5
7.0
7.5
8.0
A M J J A S O N D J F M
Source: Scotiabank Economics, Bloomberg.
3m Interbank rate, %
Interbank Rate Volatility Pressuring Banks
Chart 4
-1.0
-0.5
0.0
0.5
1.0
1.5
2.0
2.5
3.0
3.5
09 10 11 12 13 14 15
Eurozone Inflation Bottoming?
y/y % change
Source: Scotiabank Economics, Eurostat, German Federal Statistical Office.
Germany CPI
Eurozone CPI
Chart 3

Economics
Global Views
March 27, 2015
5
Global Housing Recovery Remains Uneven
The recovery in global property markets remains relatively sluggish and uneven, mirroring the slow pace of global growth and broad disinflationary pressures. Unprecedented monetary accommodation is supporting improving demand in many nations, but high unemployment, weak consumer confidence and credit constraints are an impediment to a broader and more synchronized performance.
Housing markets in Europe are mixed, mirroring divergent economic performances. Faster-growing economies, including Ireland, the U.K., and Sweden, continue to show strong price appreciation. Property markets in others, including France and Italy, are still languishing. Encouragingly, prices in a few hard-hit areas, notably Spain, are showing signs of stabilizing after a lengthy period of decline.
In the Americas, Canada and the United States remain steady performers, with low single-digit real house price increases supported by low lending rates and moderate economic growth. Latin America is a global outperformer, despite some loss of regional economic momentum and an intensifying property slowdown in Brazil. Chile, Colombia and Peru continue to post solid price gains, and conditions are firming up in Mexico alongside recent market reforms.
Slowing regional growth has cooled property markets in much of Asia. Real home prices in China are still declining, and have flattened out in Korea and Indonesia. Russia’s property slump also continues to deepen. The notable exception is Australia, with housing demand underpinned by strong population growth and foreign demand.
The uneven global performance is prompting divergent policy responses. Policymakers in a number of countries have recently tightened macro-prudential rules (UK, Ireland, Sweden) and/or foreign purchase restrictions (Australia), as the persistence of ultra-low borrowing costs heightens concerns of overheating. Others are easing lending restrictions to bolster housing demand (China, Korea). An increasing number of European nations are offering purchase incentives targeted to non-EU buyers.
Strong foreign demand is contributing to rapid house price appreciation in a number of markets globally, primarily in major capital cities and for luxury properties. Interest from international buyers is expected to remain high as investors seek geographical and asset diversification. Foreign currency considerations are increasing, with the strength of the U.S. dollar and sterling raising the relative attractiveness of properties in areas that offer greater purchasing power, both in advanced and emerging economies.
The combination of aggressive monetary easing and gradually improving economic momentum should support global housing demand and affordability in 2015. Many central banks around the world have eased policy this year in the face of softening economic growth and inflation trends. However, still soft labour markets in many nations may forestall a broader and more synchronized pickup for the time being. Meanwhile, credit availability in many jurisdictions remains tight.
Stretched affordability will remain a challenge in many high-priced housing markets, especially for first-time buyers. Tighter post-crisis credit conditions and weak income growth also have raised the bar to homeownership. Weak first-time buyer activity has contributed to rising rental demand and declining homeownership rates in a number of countries in recent years, including Australia, the U.K., Spain, Ireland and the United States.
Adrienne Warren 416.866.4315 [email protected]
GLOBAL PROPERTY MARKETS
-10 0 10 20
Russia
China
Japan*
Italy*
France
Indonesia
Spain
Brazil
Switzerland
Mexico
South Korea
U.S.
India**
Thailand
Canada
Germany***
Australia
Colombia
Chile
Sweden
Peru
U.K.
Ireland
y/y % change, 2014Q4
Real House Prices
*2014Q3 **2014Q2 ***2014 Source: Scotiabank Economics

Economics
Global Views
March 27, 2015
6
BoJ And ECB Entering Uncharted Waters As The Fed And BoE Retreat
Current shares of outstanding sovereign debt markets held by the world’s biggest central banks are similar now — but will come to differ sharply over the next year.
The biggest global central banks to have embarked upon programs of quantitative easing have all converged upon roughly the same magic number insofar as they all presently own around 25-30% of their respective sovereign bond markets (chart 1) and the ECB has suggested a roughly comparable target at an early stage of implementing its plans. Going forward, however, the four central banks’ balance sheet management paths and their respective governments’ issuance plans will have them sharply diverging from one another barring the introduction of new programs or sustained reinvestment decisions at the Federal Reserve and BoE or the premature end or reduction of buying programs at the ECB and BoJ.
In fact, both the Federal Reserve and Bank of England may see their respective roles in domestic sovereign debt markets retreat sharply while the Bank of Japan’s share of JGBs will soar to unprecedented heights for any significant central bank and the ECB will occupy second place. The Anglo-American central banks will therefore be passing the baton to the other two heavy weights.
It is important to note that there is zero science behind these ownership shares either current or projected. You did not miss a major study about optimal buying as the targeted shares represent grand and highly uncertain experiments. Going forward, the BoJ and ECB will be entering uncharted waters and further testing the bounds in terms of how much of a market can be owned by a central bank before courting potential dysfunction such as whiffs of the liquidity management troubles which occurred in the Treasury market last October. A distinguishing feature in Japan’s market is a captive domestic investor base with little foreign participation that raises the odds of financial repression arguments, but this is much less of a factor elsewhere. We simply do not know the share that a central bank can take down while funneling every other source of demand into a narrower pool of tradable fixed income product without potentially amplifying market swings or — far worse — sparking severely constrained market liquidity. That’s especially true since what is available on traders’ screens at any one point in time is further constrained by what is subject to low frequency trading at longer-term investors or what is tied up as collateral in various types of leveraged transactions. This experiment and projected relative divergences across central banks on balance sheet management practices will matter at least as much to global markets as potential divergences in policy interest rates, yet it is the latter issue that gets most of the attention in discussions on relative bond market and currency performances.
The Bank of Japan Is On A Path To Exceed All Others...
In April 2013, the BoJ announced it would purchase about ¥50 trillion in JGBs, with the rest of the ¥10-20 trillion in monetary base expansion allocated to ETFs and J-REITs. On October 31st, Governor Kuroda referenced the “public’s deflationary mindset” and expanded JGB purchases to ¥80 trillion per year. Since the implementation of the program, the BoJ’s share of JGBs has grown from roughly 11% to 23% as at the end of 2014. The BoJ has said it will continue its purchase program until inflation reaches 2%, which
GLOBAL MONETARY POLICY
Chart 2
0
5
10
15
20
25
30
35
08 09 10 11 12 13 14
Source: Scotiabank Economics, Bloomberg
Central Bank Holdings of Outstanding Sovereign Debt
% of outstanding bonds BoE
BoJ
Fed
0
5
10
15
20
25
30
35
40
45
0
100
200
300
400
500
600
700
800
900
1000
05 06 07 08 09 10 11 12 13 14 15 16
Bank of Japan JGB Holdings
Outstanding JGBs(LHS)
BoJ share of JGBs(RHS)
BoJ JGB Holdings(LHS)
Source: Scotiabank Economics, Bloomberg, Bank of Japan
Yen, trillions %
Frédéric Prêtet 00 33.17037.7705 [email protected]
Alan Clarke 44.207.826.5986 [email protected]
Derek Holt 416.863.7707 [email protected]
Frances Donald 416.862.3080 [email protected]
Chart 1
forecast
Economics / Fixed Income Strategy
Economics
Global Views
March 27, 2015
7
… continued from previous page
is looking like an increasingly unlikely near-term outcome as energy prices moderate and the consumption tax hike of April 2014 shakes out of coming inflation data. Kuroda has indicated that the BoJ stands ready to ease further if necessary, but other officials have been quoted as saying more easing would be counterproductive.
Based on the Ministry of Finance’s intended FY2015 issuance and expected outstanding amount of JGBs trended into 2016, if the BoJ keeps the current ¥80tn/year program in place, the BoJ will own 31% of outstanding JGBs by end-2015 and 39% by end-2016 (chart 2). If the BoJ expanded the program to ¥100tn/year (or reduced to ¥60tn/year) then shares would rise to 33% (or drop to 29%) in 2015 and 42% (or 35%) in 2016. Critically, the BoJ has shifted its focus to longer-dated treasuries, as has the Ministry of Finance, which continues to reduce 2yr and 5yr JGB issuance in favor of 10yr+ bonds. The average maturity of JGB market issuance is expected to be 9 years in 2015 versus roughly 8 years in 2013.
…With The ECB Likely Trailing In Second Place...
The ECB’s €60 billion per month QE program is less transparent than the Fed, BoJ or BoE’s but so far appears to be following the announced script. Up to now, the ECB only delivers the broad amount of its program on a weekly basis but does not provide specific details on the split of purchases by either country or maturity. For example, we know that the ECB bought €26.3 bn of sovereign/agencies bonds in the first two weeks of the program, with €16 bn in the second week vs. €10 bn in the first. The ECB also continues to buy around €3/3.5 bn per week of covered bond & ABS, implying that the new QE program accounts for €45 to €50bn of the announced €60bn/month of targeted purchases.
We also know that the ECB does not intend to purchase more than 33% of total outstanding issuer debt and no more than 25% of each bond issue in the 2yr-30yr maturity spectrums. The ECB has said that the capital key, i.e., the compass of the split between countries’ bonds purchases, is not necessarily a strict monthly target, but so far, both the capital key rule and the split between sovereign and supra-euro agencies bonds appears to be respected, at least according to the Banque de France. Each national central bank is in charge of buying its own national bonds, and the Banque de France has indicated that it bought €5.7 bn of French bonds which works out to 21.5% of the ECB program so far, very close to the capital key rule which gives France 20% weighting. The Banque de France also indicated that it bought €1.8 bn of supra agencies bonds and, given that only France and Spain are in charge of buying supra agencies bonds, we can assume a total amount or around €3/3.5 bn, meaning in line with the announced target of 12% of the total new program.
The ECB has said that it will release sovereign buying data on a monthly basis, so we may receive more information as the program progresses that allows us to make firmer projections on the ECB’s share of total outstanding sovereign bonds which unambiguously will be growing.
...The Bank of England’s Market Share Is Already Retreating…
The Bank of England’s quantitative easing program came in three phases. The first round saw £200bn of purchases (mainly UK government bonds) from March 2009 to January 2010. There were two further rounds of £125bn and then £50bn completed in 2011 and 2012. The design of the program specifically stipulated that it would not purchase gilts where the BoE holdings were at, or close to 70% of the “free float” i.e., the total amount in issue minus government holdings. The program initially allowed purchases of gilts with maturities between 5 and 25 years. However, as the purchases continued, the program allowed purchase of bonds with a residual maturity of greater than 3 years.
The scale of the program reached 25% of outstanding gilts during the first phase of purchases in 2010. That rose to 30% of outstanding gilts by 2013. Since the purchases were concluded, the Bank’s holdings as a percentage of outstanding gilts have naturally been eroded given the ongoing supply of new debt — taking the share back down to around 25% currently. Based on the projected path of gilt issuance from the recent Budget, the BoE’s holdings will fall to around 23% by end-2015 and 21% by end-2016. The proportion
GLOBAL MONETARY POLICY
Frédéric Prêtet 00 33.17037.7705 [email protected]
Alan Clarke 44.207.826.5986 [email protected]
Derek Holt 416.863.7707 [email protected]
Frances Donald 416.862.3080 [email protected]
Economics / Fixed Income Strategy

Economics
Global Views
March 27, 2015
8
… continued from previous page
could fall more rapidly if the BoE were to decide to modify its current policy of reinvesting the proceeds of maturing bonds held by the Asset Purchase Facility (APF). However, we do not envisage that this would happen until the Bank begins to unwind QE holdings, which is likely to be at least 2 years away.
...And The Federal Reserve’s Share Of Treasuries May Decline Significantly
From a present size of US$4.5 trillion, we anticipate that the Federal Reserve’s balance sheet may contract by as much as just under a half trillion dollars by the end of next year and by about a cumulative US$1.25 trillion by the end of 2018. These 10% and nearly 30% contractions by the end of 2016 and 2018 respectively are based upon the assumption that the Federal Reserve begins to allow maturing and prepaid securities to roll off its balance sheet as soon as toward the end of this year for MBS and into next year for Treasuries. Treasuries will roll off the balance sheet as they mature following the completion of ‘Operation Twist’ in 2012 that sold securities with maturities under 3 years to purchase securities with maturities from 6-30 years, and following the end of QE3 in October last year. This is contingent upon the Federal Reserve ending reinvestment of maturing flows as an exit strategy while remaining true to its guidance that it will not pursue asset sales.
We think this will take the Federal Reserve’s share of the total Treasury market from about 24% now down to about 19% by the end of next year and 14% by the end of 2018 (chart 3). Even if the FOMC continues reinvestment and flat-lines its portfolio of Treasury holdings held within the Securities Open Market Account (SOMA), the Fed’s share of the Treasury market will still decline due to issuance but at a substantially slower and more drawn out pace (see chart 3 again). Finally, note the vastly different shares of Treasuries held by the Fed by maturity range and the sensitivity to parts of the curve to how the Federal Reserve may alter reinvestment plans relative to issuance by maturity (chart 4).
0
10
20
30
40
50
08 09 10 11 12 13 14 15
3Y to 5Y0Y to 3Y5Y to 10Y10Y +
% of total
Federal Reserve Holdings OfTreasury Securities By Maturity Buckets
Source: Scotiabank Economics, Scotiabank Fixed Income Research, Federal Reserve Board, Dept. of Treasury.
GLOBAL MONETARY POLICY
Frédéric Prêtet 00 33.17037.7705 [email protected]
Alan Clarke 44.207.826.5986 [email protected]
Derek Holt 416.863.7707 [email protected]
Frances Donald 416.862.3080 [email protected]
Chart 3
Chart 4
10
12
14
16
18
20
22
24
26
07 08 09 10 11 12 13 14 15 16 17 18
% of total holdings
Federal ReserveTreasury Holdings
Source: Scotiabank Economics, Scotiabank Fixed Income Research, Federal Reserve Board, Dept. of Treasury.
Feb 28, 2015: 23.6%
Assuming Reinvestment Ends
In Early 2016
Assuming Constant Holdings
forecast
The authors would like to thank Juan Manuel Herrera (Research Assistant) for the help he provided while crafting this article.
Economics / Fixed Income Strategy

Economics
Global Views
March 27, 2015
9
Merchandise Export Growth Shifts Towards Central Canada
Manufacturing shipments and orders corroborate a recent shift in export gains.
Recent data offer some evidence that the CAD/USD exchange rate, coupled with a stronger U.S. economy, is facilitating a pick-up in Canada’s non-energy international merchandise export receipts. Resource export receipts have weakened in recent months largely due to a 55% decline in WTI oil prices since June, dampening growth by more than half in the six months ending January from the 14.0% y/y increase in the six months prior. Other industries have increased activity, with a notable rise in consumer goods, aircraft, motor vehicles, and electrical equipment (chart 1).
Among Canadian manufacturers, new orders have become more promising (chart 2). Unfilled orders for durable goods have surged in Canada (chart 3), with the actual 12-month average to January now 38½% above the pre-recession high. Not just durable manufacturing is rebounding. Unfilled orders for non-durables have shifted significantly higher as well.
Among the seven provinces that are not major oil producers, non-resource international merchandise export receipts over the six-months ending January increased more than 20% in Quebec & PEI, and 11.4% in Ontario & Nova Scotia. Though a smaller segment of their economy, oil-producing provinces are benefiting as well, with non-resource export receipts expanding almost 17% over the same period. Despite this strengthening, oil producing provinces have seen their overall contribution to growth shift lower in recent months (chart 4).
Looking ahead, the anticipated pick-up in goods & services exports not directly related to oil may be uneven over the balance of the year. Nevertheless, evidence of a sustained upward shift will be carefully monitored as a precursor to more robust business investment in provinces such as Ontario and Quebec, where growth in capital stock outstanding since the recession has been disappointing.
PROVINCES
Chart 1
Source for charts 1,2,3,4: Statistics Canada; for chart 2: U.S. data from the U.S. Commerce Department.
-30
-20
-10
0
10
20
30
40
95 00 05 10 15
Canada's Unfilled Durable Goods Orders Surge
y/y % change, 12-month moving average
-5
0
5
10
15
20
12 13 14 15
Manufacturing Leads Exports Gains
Other
Resources
y/y % change, 12-month moving average
International merchendise export receipts
-2
0
2
4
6
8
10
12
14
12 13 14 15
New Durable Goods Orders Build in Canada
y/y % change, 12-month moving average
U.S.
Canada
-2
0
2
4
6
8
10
12
14
Jul-13* Jan-14* Jul-14* Jan-15*
Regional Contribution to Export Growth
*Six-month sum to stated date.** For Canada y/y % growth for accumulated six-month period.
percentage points**
Canada
Atlantic & Other
West
Central
Chart 2
Chart 3 Chart 4
Mary Webb 416.866.4202 [email protected]
Warren Kirkland 416.866.4212 [email protected]

Economics
Global Views
March 27, 2015
10
Is The US Housing Market About To Enter A Sweet Spot?
The key is whether mortgage industry capacity constraints will no longer be tested by bouts of refinancing that crowd out new purchase mortgages.
Availability of credit has clearly been a sore point in the US housing market for a number of years now. In fact, it's one of the main remaining hurdles to achieving considerably faster and more diversified economic growth. New research from staff economists at the Federal Reserve combined with our own observations may suggest that this issue of access to new mortgage loans may be on the cusp of changing for the better should other fundamental drivers remain generally constructive notwithstanding some ongoing housing headwinds.
The thesis that follows posits that the mortgage industry has been capacity constrained for some time and therefore unable to deal with a volatile and unexpected series of large refinancing waves that crowded out the ability to process mortgage purchase applications. If this series of refinancings is approaching a mature point in the cycle, that may connote a greater ability to divert origination capacity toward newly originated mortgage loans which, in turn, would drive new purchase and homebuilding activity. The two core arguments are outlined below.
Mortgage Industry Capacity Constraints
The crux of our first argument aims at bringing to our clients a thesis based upon a research paper published this month by a pair of economists at the Federal Reserve Board — Steve Sharpe and Shane Sherlund — that is titled Crowding Out Effects of Refinancings on New Purchase Originations.
The authors reason that after the mortgage industry thinned the ranks of staff in the wake of the crisis, meeting refinancing waves after controlling for other factors resulted in crowding out new purchase applications because of capacity constraints. Observe in chart 1 that the number of employees in the sector fell from about a half million pre-crisis to a quarter-million afterward. That 50% cut suitably took out industry spare capacity in the immediate aftermath of the crisis, but left the industry unable to later keep up with processing of refinancing applications that soared.
The study’s authors back up this thesis by pointing to evidence of how mortgage providers rationed access to newly originated purchase loans by temporarily widening spreads over funding costs during each successive refinancing upsurge. The authors found that low purchase loan approval rates during refi waves were particularly focused upon higher credit-risk borrowers with lower credit scores whose mortgages are generally harder and costlier to complete. This could be why only the most sparkling borrowers got approved and for reasons that go beyond credit quality differences absent refi waves.
Why not simply expand capacity to meet this new demand? This swell of refinancings was probably unanticipated at the time of the earlier industry cutbacks because few people — if anyone — anticipated Treasury yields and fixed mortgage borrowing rates pushing as low as they did over the ensuing years. The mortgage industry may have been reticent to expand capacity to meet these successive bouts of refinancing because of how volatile and fleeting they can be and the industry lacked confidence to expand capacity on a pure bet that purchase activity might pick up any slack between waves of refinancing.
One might also surmise that non-price measures beyond the price effects considered by the study’s authors may have also been utilized to ration credit. Consider, for instance, the stories we’ve been hearing for some time now about a medley of odd criteria used to determine credit worthiness in the US mortgage market. Examples have included requiring borrowers to provide explanations for individual checks and other debits clearing their accounts over a number of prior years. It is possible that these were examples of artificial non-price constraints on borrowing applications that reflected capacity constraints in US mortgage markets. Think
Derek Holt 416.863.7707 [email protected]
U.S. HOUSING MARKETS
0
10
20
30
40
50
60
70
80
200
250
300
350
400
450
500
550
03 04 05 06 07 08 09 10 11 12 13 14 15
Mortgage Industry Capacity Unable To Handle Refi Waves000s
Source: Scotiabank Economics, Mortgage Bankers' Association, BLS.
Real Estate Credit & Loan Broker Employment
(LHS)
MBA Refinancing Application Index(RHS)
3 mth mov avg index
Chart 1

Economics
Global Views
March 27, 2015
11
… continued from previous page
of it as parallel to application bottlenecks at the most desirable universities that ration demand in ways that go beyond other institutions’ focus upon more standard criteria like GPAs or SAT scores.
Is The Refi Wave At An End?
Now if unanticipated refi waves within the context of industry capacity constraints sparked rationing of demand for purchase applications, then the next question quickly becomes focused upon asking whether the refi boom may be over. If so, then a quarter million mortgage industry employees face one of two possibilities. Either they will be let go in a renewed bout of downsizing, or their efforts will be employed toward originating brand spanking new mortgages. We lean toward the latter argument for reasons we’ll come back to in a moment.
As chart 2 demonstrates, the average effective mortgage interest rate (EMIR) being paid by American mortgage borrowers ended last year at 3.83% — the lowest on record. This reflects some newly originated loans at record-low mortgage financing rates and the cumulative effects of a series of refinancings on previously outstanding mortgages. This effective mortgage interest rate has tracked the blended average of the 15 and 30 year fixed rates lower. The EMIR now actually sits on top of the most popular rate — the 30 year fixed mortgage rate as reported by Bankrate.com. The smaller share of outstanding mortgages in adjustable rate products was re-priced well after the Fed went to zero.
Given that 30 year US mortgages are priced off10 year Treasuries and swapped, if Treasury yields are unlikely to move lower than they have over the past couple of years then it may well be that the refinancing boom has largely run its course or is close to having done so. That does not mean or require that Treasuries cannot rally from here. It means that if they do, then it is unlikely to spark another massive refi swell sustained over a lengthy period as most borrowers already refinanced at the rate lows of 2013-14 including the lower depths set before the ‘taper tantrum’ in the Spring of 2013. Refi waves will be shallower and shorter in length and can increasingly coincide with pick-ups in purchase application approvals.
Finally, we doubt that mortgage companies will simply cut staff by even more if the refi wave is over. Given that they held employment in the 250-300k range since 2010 despite unanticipated rounds of refinancing activity, it’s not clear to us that they would further cut this possibly minimum collective staffing requirement as opposed to directing them to originate new purchase loans.
Conclusion
The broad takeaway is that US housing markets may be on the verge of entering a sweet spot if the argument advanced in this article operates against the continued backdrop of an otherwise constructive set of conditions. Those with prior debt have refinanced at the lowest borrowing costs in generations given the one-way refinancing option that is fairly unique to the US mortgage market. This may have been the first focus of Fed policy to enable debt refinancings as a way of facilitating the deleveraging process.
At the same time, those who may soon be seeking to buy could be faced with easier credit access than they have faced in at least 7-8 years and increasingly able to buy in the context of a hiring boom that helps offset other headwinds. That, in turn, could well enable the US to withstand the effects of somewhat higher borrowing costs; in essence, an extension of this thesis is that the worst thing that could happen to mortgage purchase approvals could be, say, a full percentage point drop in the 30 year fixed mortgage rate from here. Cheap mortgages are great, but not if you can’t get approved or capacity constraints stay focused on refis; slightly less cheap borrowing rates accompanied by higher approval rates could net out to a positive outcome for US housing markets. Regardless, our argument is that unless mortgage rates drop by arguably more than they have in 2013-14, the refi wave may be coming to an end and industry capacity could be put toward raising approval of purchase applications.
Derek Holt 416.863.7707 [email protected]
U.S. HOUSING MARKETS
2.5
3.5
4.5
5.5
6.5
7.5
8.5
98 00 02 04 06 08 10 12 14
Are U.S. Mortgage Refinancings Over?
%, interest
Source: Scotiabank Economics, Bankrate.com, Federal Reserve Board.
Effective Mortgage Rate
15 Yr Fixed Mortgage Rate
30 Yr Fixed Mortgage Rate
Chart 2

Economics
Global Views
March 27, 2015
12
The UK’s Economic Outlook Remains Sound
Growth prospects remain encouraging, though weak inflation will likely delay the timing of monetary tightening by the Bank of England.
While economic momentum has waned of late, UK real GDP growth should continue to accelerate over the course of 2015. The boost to household real income from lower inflation, coupled with solid employment gains and rising wages should help private consumption continue to drive overall growth higher. Business investment should also perform well, though held back to some extent by cutbacks in the oil & gas sector. Meanwhile, lower energy costs bode well for a modest improvement in industrial output, and exports stand to benefit from strengthening economic fundamentals in the US and Europe. However, the contribution from the external sector will likely be tempered by the appreciation of the British Pound (GBP) vis-à-vis the euro and other European currencies due to unprecedented monetary accommodation by the European Central Bank and its regional peers. UK real GDP is forecast to advance by 2.7% this year and 2.3% in 2016, compared with a 2½% gain in 2014.
Inflation pressures in the UK continue to ease, with the headline CPI print at 0% y/y in February and likely to turn mildly negative over the coming months. Looking ahead to later this year, second round effects associated with the fall in food and energy prices should push core inflation higher. This is likely to coincide with powerful base effects from petrol prices that should add close to 1% to the headline rate. Against this backdrop, it is not unreasonable to expect inflation to approach the Bank of England’s (BoE) 2% target by mid-to-late 2016. We project that UK inflation will end the year at 1.4% in 2015 and 2.3% in 2016. The biggest downside risk to the outlook is the strength of the GBP relative to its European peers, which could feed through to lower import prices and moderate the extent of the recovery.
Despite recent speculation of a rate cut and policy easing by other central banks, we do not expect the BoE will loosen monetary policy further. Nevertheless, the weak underlying inflation dynamic will likely make policy tightening a tough sell this year, which has prompted us to delay our call on the timing of the first rate hike. We also have doubts that wage inflation will accelerate as much as the BoE has assumed. As such we now expect that the BoE’s first interest rate hike will likely arrive in the first half of 2016. However, it is important to note that late-2015 cannot be ruled out if an upward surprise in inflation, growth, or wages materialize.
UK public sector finances are on an improving trajectory, with the cumulative deficit over the first eleven months of financial year 2014/15 down roughly 10% y/y to £81.8bn. This is equivalent to just over 5% of GDP, which makes the UK’s deficit-to-GDP ratio one of the highest in the OECD. Therefore, while the government is on the right track, the fiscal outlook remains challenging, with the pace of deficit reduction continuing to slow and fiscal consensus expected to weaken considerably after the May general election. Chancellor of the Exchequer, George Osborne, plans to narrow the deficit gradually over the coming years before achieving a balanced budget in 2018/19. This is, however, four-years after the administration originally intended and largely rests on ambitious unspecified spending cuts.
EUROPE Alan Clarke 44.207.826.5986 [email protected]
Erika Cain 416.866.4205 [email protected]
-5
-4
-3
-2
-1
0
1
2
3
4
09 10 11 12 13 14 15 16
U.K. Real GDP Growth To Remain Healthy …
y/y % change
Source: Scotiabank Economics, U.K. ONS.
Forecast
-1
0
1
2
3
4
5
6
08 09 10 11 12 13 14 15 16
… Inflation To Gradually Accelerate …
y/y % change
Source: Scotiabank Economics, U.K. ONS.
Forecast
0
2
4
6
8
10
12
0
20
40
60
80
100
09 10 11 12 13 14 15f 16f
… And Fiscal Consolidation Will Continue
% of GDP
Source: IMF, Scotiabank Economics.
% of GDP
Budget Deficit (RHS)
Gross Government Debt (LHS)
Economics / Fixed Income Strategy

Foreign Exchange Strategy
Global Views
March 27, 2015
13
Macro EM Asia FX View: CNH Favoured Over TWD
Extracted from: Scotia Asian FX Strategy Tactical Trading View: Sell TWD Outperformance Against Long CNH, published on Monday March 16th, 2015.
Taiwan has lagged Asia in weakening vs. the USD, against typical correlative trading patterns.
We believe policy makers will allow for TWD catch-up based on the implicit policy goal of minimizing TWD REER volatility.
Political cycle and economic growth dynamics allow little room for sustained TWD outperformance.
Short TWD vs. long CNH makes fundamental macro sense, while we believe CNH carry vs. limited downside is very attractive.
The current strong dollar environment has been characterized by a tendency for Asia to ‘block-move’ lower against the USD, however not without a significant amount of ‘chop’ due to the high degree of uncertainty over the timing of the Fed’s first rate hike. The market’s sensitivity to US data results, heightened by a lack of strong guidance from the Fed, drives sometimes unpredictable volatility in US rates and thus USD direction vs. Asia. Relative value trades that are insulated from US & USD macro uncertainties, and provide attractive ’alpha’ opportunities vs. our core (broadly more bullish than consensus) USD/Asia views can be difficult to find. One of the more obvious to us was our recommendation of long INRIDR (see INR vs. IDR: It’s An Ugly Contest...and IDR Wins It!, September 5, 2014), where we suggested, when INRIDR was trading shy of 195, that the pair could easily reach 205 and likely higher. This was perhaps the only way to truly express a short IDR view and neutralize negative carry as well as the USD macro influence. Currently, TWD has the potential to depreciate vs. the rest of Asia, and particularly against CNH.
TWD Macro Context: Currency Policy As Monetary Policy
The CBCT has held the line on its policy rate since the summer of 2011, and while the actual policy stance has been easier than indicated by the benchmark interest rate (the overnight call-loan rate trades at sub-0.40% vs. the official policy rate at 1.875%), it is obvious to us that interest rates have not been the sole monetary lever in the economy. Instead we see TWD doing the greater proportion of adjustment and shock absorption on the monetary conditions front. Indeed, as the CBCT hiked rates in the spring of 2010 through the summer 2011, the central bank also allowed for a significant pace of appreciation in TWD (over 9% from May 2010 through July 2011), the second strongest performance in Asia ex-Japan over that time. This suggests the importance of TWD’s evolution to Taiwan’s monetary conditions considering that the country executed one of the lesser magnitude tightening cycles via its policy rate over that same time compared to an Asian region that was generally tightening rates, and instead allowed the currency to play a more significant role. It’s also instructive to note that after the CBCT decided to end the rate tightening cycle, USDTWD bottomed and has been drifting on an upwards trend since.
Implicit Currency Policy Objective Suggests Trading Opportunity
Given our view of the importance of TWD levels to policymakers, the real effective exchange rate (REER) will be the exchange rate most economically relevant for the central bank. Looking at the REER, the stability in Taiwan’s REER is immediately obvious, particularly versus the rest of the Asian region. Since 2008, Taiwan’s REER has exhibited the lowest regional volatility (see chart), which suggests an implicit policy objective of maintaining stability in the REER. This, of course, has to be executed through the accommodation or resistance to directional pressures on the currency. Looking at a chart of EM Asia REER performance, TWD’s relative stability is remarkable and not to be considered a statistical anomaly, but rather something deliberate.
Sacha Tihanyi 852.6117.6070 [email protected]
Source: BIS, Scotia FX Strategy
0.0
1.0
2.0
3.0
4.0
5.0
6.0
7.0
8.0
9.0
TWD MYR THB INR PHP IDR SGD KRW CNY
Standard Deviation in REER Since 2008 Standard Deviation in REER Since 2008

Foreign Exchange Strategy
Global Views
March 27, 2015
14
… continued from previous page
TWD Deviation From Normal Trading Patterns
Taiwan has outperformed the region significantly since January 19th, down only 0.2% against the USD to lag only the Philippine peso in Asia, outperforming even HKD. This is suggestive of serious divergence from typical trading patterns and correlations. This begs the paramount question; what is driving the divergence?
We have that foreign portfolio flows into Taiwan have surged since January 19th (basically the ‘start point’ for TWD outperformance), adding over $7.4bn in inflows through March 4th. This is the sharpest pace, and most significant quantity of inflow since before the summer of last year when foreign purchases surged along with Taiwanese equities in the lead-up to the 2014 local elections. It is no surprise that Taiwanese stocks are showing the same upside trend as they did into the summer of last year given the trend in foreign participation. This is, however, only offsetting (in the near term) the longer-term trend phenomenon in net portfolio outflows that typifies Taiwan. The trade surplus has expanded significantly thanks to stagnant imports and better export performance. The impact of the expanding trade surplus has helped to offset trend portfolio outflows, emphasizing the importance of the trade dynamic to Taiwan, and thus the importance of maintaining REER stability, and thus nominal TWD correlation with the market. Interestingly, in the past two weeks investment flows have reversed, but we believe TWD weakness has yet to truly play out.
Looking at relative performance, we see that TWD has particularly lagged MYR, KRW, SGD, and IDR in the recent selloff. This is interesting given that we would have expected TWD to trade more in line with SGD, MYR and KRW, and even EUR (from which TWD has diverged significantly since mid-January), based on our statistical analysis of clustering patterns in the correlations between Asian currencies. We use this useful technique to analyze currency groups that tend to co-vary and thus eliminate ‘macro’ factors for relative value trades. The hierarchical tree chart shows relative dissimilarities between groups of Asian currencies. Essentially what the chart (or ‘dendogram’) shows us is that the correlative behaviour of TWD, MYR and SGD is very similar,
Sacha Tihanyi 852.6117.6070 [email protected]
Dissimilarity Measure
Correlative Trading Clusters: TWD Should Be ‘Better Behaved’
High degree of correlative trading behaviour
Source: Scotia FX Strategy
‐5
‐4
‐3
‐2
‐1
0
1
KRW IDR SGD MYR JPY INR CNH THB CNY HKD TWD PHP
98.00
98.50
99.00
99.50
100.00
100.50Asian FX Performance Jan. 19 ‐
March 13 (%)
Asia Trade‐WeightedPerformance vs. TWD
(rhs)
Source: Bloomberg, Scotia FX Strategy
Asian Currencies Have Broadly Underperformed TWD
98
100
102
104
106
108
110
112
114
116
118Sep‐14
Oct‐14
Nov
‐14
Dec‐14
Jan‐15
Feb‐15
Mar‐15
USDMYR
USDIDR
USDSGD
USDKRW
USDTWD
USDINR
USDCNY
USDTHB
USDPHP
Source: Bloomberg, Scotia FX Strategy
Since Mid-Jan TWD Looks Abnormally Decoupled

Foreign Exchange Strategy
Global Views
March 27, 2015
15
… continued from previous page
and not too dissimilar to KRW and EUR for that matter. The fact that TWD has diverged from this statistical behaviour also shows us that a bit of an anomaly is in play, and one that we would not expect to hold for a sustained period of time. Note that CNY stands out on its own due to the more controlled and low volatility nature of the currency relative to the rest of Asia, though we know the important role it plays relative to the region’s other currencies.
Taiwan Macro Outlook — No Impediment to TWD Weakness
The state of play for TWD is likely to be given greater policy focus and sensitivity by policy makers due to the drivers of growth in recent quarters. Export orders, industrial production and indeed growth, are currently undergoing their most sustained and stable expansion since the rebound from the financial crisis. While the 2016 election is still some time off, given that the timing is within 4 quarters (January 2016), maintaining growth momentum will be in the interest of fiscal policymakers, particularly given that the current government saw a significant turn in political fortune during the 2014 local elections. This sensitizes the overall policy outlook to the performance in the trade sector. Low inflation, driven by both external and internal factors, also provides an environment in which the central bank is free to focus more on economic support, and allowing for a weakening in TWD would fit well into this framework. Thus the domestic environment presents little constraint in the way of TWD weakening in line with our view.
Favour CNH Over TWD
This begs the question, what Asian currency do we like on a relative value basis? Considering current trading levels, of all Asian currencies we currently have the most constructive relative view on the renminbi, and its particular relevance for TWD. We’ve fleshed out our structural medium term view on the currency (see: Scotia Asian FX Strategy Focus RMB — Down But Not Out, February 13, 2015), and while short-term debt repayments and a shift in hedging behaviour (engineered by the authorities allowing for greater two-way volatility) may keep the currency under pressure for a period of time, we expect that by mid-year this will have played itself out, and that the seasonal expansion in the trade surplus will offset outflows to a greater
Sacha Tihanyi 852.6117.6070 [email protected]
‐10
‐5
0
5
10
15
‐40
‐30
‐20
‐10
0
10
20
30
40
50
60Jan‐07
Jun‐07
Nov‐07
Apr‐08
Sep‐08
Feb‐09
Jul‐09
Dec‐09
May‐10
Oct‐10
Mar‐11
Aug‐11
Jan‐12
Jun‐12
Nov‐12
Apr‐13
Sep‐13
Feb‐14
Jul‐14
Dec‐14
Industrial Production (%Y/Y)
Export Orders (%Y/Y)
GDP Growth (%Y/Y, rhs)
Taiwan Growth Sensitized to Export Performance
Source: EMED, Scotia FX Strategy
‐15.0
‐10.0
‐5.0
0.0
5.0
10.0
15.0
20.0
Mar‐02
Mar‐03
Mar‐04
Mar‐05
Mar‐06
Mar‐07
Mar‐08
Mar‐09
Mar‐10
Mar‐11
Mar‐12
Mar‐13
Mar‐14
Current AccountFDIPortfolio InvestmentCA + FDI + PI
BoP: Current Account Offsetting Portfolio and FDI
Source: EMED, Scotia FX Strategy
CNH: Implied Carry Offsets Downside Risk
5.90
5.95
6.00
6.05
6.10
6.15
6.20
6.25
6.30
‐4
‐3
‐2
‐1
0
1
2
3
4
1‐Jan
1‐Apr
1‐Jul
1‐Oct
1‐Jan
1‐Apr
1‐Jul
1‐Oct
1‐Jan
Fwd‐LookingSpot ReturnHolding longCNY 6 mths6mth Carry(%)
Total 6mthReturn
USDCNH (rhs)
Source: Bloomberg, Scotia FX Strategy

Foreign Exchange Strategy
Global Views
March 27, 2015
16
… continued from previous page
degree. Also, implied yields on CNH forwards have continued to march higher and higher since May of last year, and are sitting at nearly 4.5% annualized on a 6-month basis, compared with virtually nil on the equivalent TWD forwards. This provides for a significant carry buffer to potential further renminbi weakening. It is, in our view, highly unlikely that one sees CNY weaken by more than implied carry over the next six months (or to over 6.38).
We are also given comfort in CNHTWD direction by our bullish structural USD/Asia call, and bullish USD outlook globally, as CNHTWD shows a strong tendency to correlate positively with bullish moves in the dollar. In fact, it is during the current divergence in TWD’s typical trading pattern that we see this correlation break down.
The main risk to our view that TWD underperforms CNH comes from the potential for the USD rally to unwind, which could have a higher ‘beta’ effect on TWD versus CNH, in terms of subsequent strength against the USD. We believe that much of the broad USD rally is driven by European monetary policy divergences from the US, as well as certain easing biases in other countries (particularly relevant in Asia). The actual Fed shift is yet to come, while the ECB’s quantitative easing efforts are in their early stages. While positioning remains a risk, it is unlikely that the medium-term trends can be sustainably reversed as we do not see minor economic hiccups pushing either central bank off of its current trajectory.
Sacha Tihanyi 852.6117.6070 [email protected]

Economics
Global Views
March 27, 2015
17
Key Data Preview
CANADA
The evidence seems to indicate that there was a meaningful drag on the Canadian economy from the drop in the oil price in January, with GDP likely in our estimate to come in at -0.4% m/m. Soft spots include… pretty much everything. Constant dollar manufacturing sales fell by 1% m/m, retail sales by 1.2% m/m, wholesale trade by 3.3% m/m, housing starts were fairly flat… To the extent that there is a positive, it is that total hours worked increased by +0.1% m/m, an anemic rate of growth but at least not negative.
Canadian nominal trade numbers for February ought to be soft, and we’re looking for a C$ -2bn deficit, a bit less bad than January’s level as the oil price rebounded moderately, although much of the good that the oil price rebound on the month ought to bring will at least be challenged by the weaker C$, which saw its average level drop by 3.5% vs. the USD in February vs. January. As Canada is now importing more than it exports, a softer currency should widen the trade deficit in nominal terms. The weak outlook for vehicle manufacturing on the month (assemblies in the U.S. fell by 5.5%) implies that exports of cars shouldn’t be a source of strength.
UNITED STATES
Can U.S. labor markets maintain their current hot streak? We expect nonfarm payrolls to rise by 230k in March, softer than the 295k number in February but solid nonetheless. Can labor market strength be sustained on the basis of soft growth numbers (particularly soft numbers so far in Q1 2015 — see chart)? This might be a bit of a short-sighted way of looking at things as growth was very strong in mid-2014 and we think will remain solid through 2015 overall. A few months of soft numbers on the growth front shouldn’t change things, particularly as they come immediately following an unsustainable hot streak (the economy is not growing at a faster 4%+ annualized rate — as the data in mid-2014 reflected). It’s important in considering growth numbers to smooth through volatility, and it’s similarly important to understand that even if payrolls were to print near 235k for the next while (i.e., well below the 321k run rate over the past quarter and lower than the 260k average booked in 2014), they would still be running at a very fast rate. In terms of the unemployment rate, we’re looking for a 5.5% print after the participation rate ticked lower in February — and could (hopefully) revert higher in March on new entrants to the labor market amidst strong payroll growth. There is a chance that soft household survey jobs numbers in February revert higher though resulting in a softer unemployment rate. The balance of these risks is why we expect a flat unemployment rate.
Trade figures for February should reflect a narrower trade deficit as the port strike in California hit peak levels and therefore constrained imports before it was resolved late in the month. We’re anticipating a narrowing of the trade deficit to USD -40.5bn on a mix of the port strike and potentially lower imports of crude oil as domestic production steamed ahead in February and refineries should exhibit lower foreign demand after loading up on cheap imported oil in December. The USD also strengthened quite a bit on the month, which should reduce the nominal dollar trade deficit as the U.S. is after all a net importer. Negatives include soft vehicle production and new orders which could carry through to soft auto exports.
U.S. personal spending for February ought to be a soft 0% m/m after a -0.6% m/m drop in retail sales on the month, which we expect will be reported as a somewhat more moderate decline in the PCE data as some of the categories that caused retail sales to drop the most (car sales, building materials) figure much less into the PCE numbers. Income numbers should be a more solid +0.3% m/m after labor data on the month reflected a +0.3% m/m increase and other factors that figure into the income data such as rents ought to also be on the strong side. CPI for February was also solid, and we think it should lend itself to a +0.1% m/m and 0.3% y/y rise in the headline PCE deflator, with core rising a bit more in line with the trends in the CPI data.
Dov Zigler 212.225.6631 [email protected]
Derek Holt 416.863.7707 [email protected]
Frances Donald 416.862.3080 [email protected]
A1
y = 65.707x - 52.787R² = 0.4398
-650
-550
-450
-350
-250
-150
-50
50
150
250
350
-5 0 5
Okun's Law: Strong but not Unreasonable Jobs Gains
NFP Y/Y. vs. GDP Y/Y
Jobs, 000s
GDP, Y/Y, %
Source: Scotiabank Economics, BLS, BEA
Q4 2014

Economics
Global Views
March 27, 2015
18
… continued from previous page
EUROPE
Preliminary inflation estimates for March will be released in Europe ahead of the Easter long weekend. We expect that deflationary pressures in the euro zone will continue to ease, with the flash HICP print coming in at -0.1% y/y in March from -0.3% in February. This improvement continues to reflect rebounding energy costs and favourable base effects in food prices. Meanwhile, euro zone core inflation is forecast to remain stable at 0.7% y/y. On March 30th, CPI inflation will also be released in Germany, with the headline print forecast to come in at 0.3% y/y in March up from 0.1% in February, as well as Spain, where the annual change in consumer prices should ease to -1.0% y/y from -1.1%. Italy will follow suit on March 31st, with inflation likely to register flat after a decline of 0.1% y/y in the prior month.
LATIN AMERICA
Peruvian CPI for the month of March is expected to come in around 2.8% y/y, unchanged from the February reading and within the central bank’s 1-3% target range. However, significant rainfall on the back of El Niño conditions has triggered landslides that will impact both crop harvesting and transportation to demand centres for at least the next month, putting some upward pressure on prices into the end of the March. A major highway between farming regions and Lima was blocked earlier in the week by such a landslide and the central bank president expressed concern that a tightening of the food market will likely cause a temporary spike in the inflation rate.
ASIA
South Korea will release inflation data for March on March 31st (EST) while Indonesia and Thailand will do so on April 1st. The collapse in international oil prices is the main driver of inflation dynamics across the Asia/Pacific region. In South Korea, Indonesia and Thailand, lower price pressures have allowed monetary authorities to adopt a gradual monetary easing bias. South Korean consumer prices rose by 0.5% y/y in February — well below the Bank of Korea’s target corridor of 2½-3½%. We estimate that the inflation rate remained unchanged in March. Due to negative producer price inflation (-3.6% y/y in February) together with low international oil prices, headline inflation will remain below the central bank’s target range for an extended period of time. We expect price gains to begin picking up gradually in the second half of 2015, approaching 2½% y/y by the end of 2016 as the economy’s output gap diminishes. In Indonesia, recent cuts in fuel subsidies translated to an uptick in inflation in December, with the consumer price index jumping by 8.4% y/y; in February, price gains eased to 6.3% y/y, yet they remain significantly above the 4½% y/y average recorded in the months prior to the administered price increases. We assess that inflation continued to decelerate in March to 6.1% y/y and that further easing will take place in the coming months toward the official target of 4% ±1 percentage point. Inflation in Thailand has dropped to negative territory, with the consumer price index decreasing by 0.5% y/y in February; we expect a similar decline in March. Inflation will likely begin accelerating in the second half of 2015 along with recuperating domestic demand, yet it will likely remain below 2½% y/y through 2016.
A2
Tuuli McCully 416.863.2859 [email protected]
Rory Johnston 416.862.3908 [email protected]
Erika Cain 416.866.4205 [email protected]
0
0.5
1
1.5
2
2.5
3
3.5
4
4.5
5
Mar-10 Mar-11 Mar-12 Mar-13 Mar-14 Mar-15
forecast
Source: Bloomberg, Scotiabank Economics.
Peruvian CPI
y/y %change
-1.0
0.0
1.0
2.0
3.0
4.0
5.0
6.0
7.0
8.0
9.0
Mar-13 Mar-14 Mar-15
Source: Bloomberg, Scotiabank Economics.
Indonesia CPI
Regional Inflation
y/y % change
Thailand CPI
Korea CPI
forecast

Economics
Global Views
March 27, 2015
1
Key Indicators for the week of March 30 – April 3
Forecasts at time of publication. Source: Bloomberg, Scotiabank Economics.
North America
Europe
A3
Country Date Time Indicator Period BNS Consensus LatestCA 03/30 08:30 IPPI (m/m) Feb -- 0.5 -0.4CA 03/30 08:30 Raw Materials Price Index (m/m) Feb -- 5.0 -7.7US 03/30 08:30 PCE Deflator (m/m) Feb 0.1 0.2 -0.5US 03/30 08:30 PCE Deflator (y/y) Feb 0.3 0.3 0.2US 03/30 08:30 PCE ex. Food & Energy (m/m) Feb 0.2 0.1 0.1US 03/30 08:30 PCE ex. Food & Energy (y/y) Feb 1.4 1.3 1.3US 03/30 08:30 Personal Spending (m/m) Feb 0.0 0.2 -0.2US 03/30 08:30 Personal Income (m/m) Feb 0.3 0.3 0.3US 03/30 10:00 Pending Home Sales (m/m) Feb -- 0.4 1.7US 03/30 10:30 Dallas Fed. Manufacturing Activity Mar -7.0 -9.0 -11.2
CA 03/31 08:30 Real GDP (m/m) Jan -0.4 -0.2 0.3US 03/31 09:00 S&P/Case-Shiller Home Price Index (m/m) Jan 0.5 0.7 0.9US 03/31 09:00 S&P/Case-Shiller Home Price Index (y/y) Jan 4.5 4.6 4.5US 03/31 09:45 Chicago PMI Mar -- 52.0 45.8US 03/31 10:00 Consumer Confidence Index Mar 97.0 96.5 96.4
US 04/01 07:00 MBA Mortgage Applications (w/w) MAR 27 -- -- 9.5US 04/01 08:15 ADP Employment Report (000s m/m) Mar 225.0 225.0 211.8US 04/01 10:00 Construction Spending (m/m) Feb -0.5 -0.2 -1.1US 04/01 10:00 ISM Manufacturing Index Mar 52.2 52.5 52.9US 04/01 Domestic Vehicle Sales (mn a.r.) Mar 13.6 13.5 12.9US 04/01 Total Vehicle Sales (mn a.r.) Mar 16.9 16.9 16.2
CA 04/02 08:30 Merchandise Trade Balance (C$ bn) Feb -2.0 -1.8 -2.5US 04/02 08:30 Initial Jobless Claims (000s) MAR 28 285 285 282US 04/02 08:30 Continuing Claims (000s) MAR 21 2425 -- 2416US 04/02 08:30 Trade Balance (US$ bn) Feb -40.5 -41.0 -41.8US 04/02 10:00 Factory Orders (m/m) Feb 0.1 -0.3 -0.2
US 04/03 08:30 Average Hourly Earnings (m/m) Mar -- 0.2 0.1US 04/03 08:30 Average Weekly Hours Mar -- 34.6 34.6US 04/03 08:30 Nonfarm Employment Report (000s m/m) Mar 230.0 250.0 295.0US 04/03 08:30 Household Employment Report (000s m/m) Mar -- 250.0 96.0US 04/03 08:30 Unemployment Rate (%) Mar 5.5 5.5 5.5
Country Date Time Indicator Period BNS Consensus LatestSP 03/30 03:00 CPI (y/y) Mar P -1.0 -- -1.1SP 03/30 03:00 CPI - EU Harmonized (y/y) Mar P -- -- -1.2UK 03/30 04:30 Net Consumer Credit (£ bn) Feb -- 0.9 0.8EC 03/30 05:00 Business Climate Indicator Mar -- 0.2 0.1EC 03/30 05:00 Consumer Confidence Mar F -3.7 -3.7 -3.7EC 03/30 05:00 Economic Confidence Mar 104.0 103.0 102.1EC 03/30 05:00 Industrial Confidence Mar -4.0 -4.0 -4.7GE 03/30 08:00 CPI (m/m) Mar P 0.5 0.4 0.9GE 03/30 08:00 CPI (y/y) Mar P 0.3 0.3 0.1GE 03/30 08:00 CPI - EU Harmonized (m/m) Mar P 0.5 0.5 1.0GE 03/30 08:00 CPI - EU Harmonized (y/y) Mar P 0.1 0.1 -0.1UK 03/30 19:05 GfK Consumer Confidence Survey Mar -- 2.0 1.0
GE 03/31 02:00 Retail Sales (m/m) Feb -1.0 -0.7 2.3FR 03/31 02:45 Consumer Spending (m/m) Feb -0.4 0.0 0.6FR 03/31 02:45 Producer Prices (m/m) Feb -- -- -0.9

Economics
Global Views
March 27, 2015
2
Key Indicators for the week of March 30 – April 3
Forecasts at time of publication. Source: Bloomberg, Scotiabank Economics.
A4
Europe (continued from previous page)
Country Date Time Indicator Period BNS Consensus LatestSP 03/31 03:00 Real Retail Sales (y/y) Feb -- -- 4.2TU 03/31 03:00 Real GDP (y/y) 4Q -- 2.1 1.7GE 03/31 03:55 Unemployment (000s) Mar -10.0 -12.0 -20.0GE 03/31 03:55 Unemployment Rate (%) Mar 6.5 6.5 6.5SP 03/31 04:00 Current Account (€ bn) Jan -- -- 4.8UK 03/31 04:30 Business Investment (q/q) 4Q F -- -- -1.4UK 03/31 04:30 Current Account (£ bn) 4Q -- -22.0 0.0UK 03/31 04:30 GDP (q/q) 4Q F -- 0.5 0.5UK 03/31 04:30 Index of Services (m/m) Jan -- 0.3 0.6EC 03/31 05:00 Euro zone CPI Estimate (y/y) Mar -0.1 -0.1 -0.3EC 03/31 05:00 Euro zone Core CPI Estimate (y/y) Mar A 0.7 0.7 0.7EC 03/31 05:00 Unemployment Rate (%) Feb 11.2 11.2 11.2IT 03/31 05:00 CPI (m/m) Mar P -- 0.1 0.4IT 03/31 05:00 CPI (y/y) Mar P 0.0 -0.2 -0.1IT 03/31 05:00 CPI - EU Harmonized (m/m) Mar P -- 2.2 0.3IT 03/31 05:00 CPI - EU Harmonized (y/y) Mar P -- 0.1 0.1SP 03/31 Budget Balance YTD (€ mn) Feb -- -- -35561
IT 04/01 03:45 Manufacturing PMI Mar -- 52.1 51.9UK 04/01 04:30 Manufacturing PMI Mar -- 54.4 54.1IT 04/01 12:00 Budget Balance (€ bn) Mar -- -- -7.2RU 04/01 Real GDP (y/y) 4Q -- 0.0 0.7
UK 04/02 04:30 PMI Construction Mar -- 59.8 60.1
Asia Pacific
Country Date Time Indicator Period BNS Consensus LatestSK 03/28 22:00 Department Store Sales (y/y) Feb -- -- -11.0
SK 03/29 17:00 Business Survey- Manufacturing Apr -- -- 82.0SK 03/29 17:00 Business Survey- Non-Manufacturing Apr -- -- 74.0JN 03/29 19:50 Industrial Production (y/y) Feb P -- -0.6 -2.8
SK 03/30 19:00 Industrial Production (y/y) Feb -- -1.8 1.8SK 03/30 19:00 Cyclical Leading Index Change Feb -- -- 1.0AU 03/30 20:00 HIA New Home Sales (m/m) Feb -- -- 1.8AU 03/30 20:30 Private Sector Credit (y/y) Feb -- 6.3 6.2
JN 03/31 00:00 Vehicle Production (y/y) Feb -- -- -9.7JN 03/31 01:00 Housing Starts (y/y) Feb -- -7.0 -13.0JN 03/31 01:00 Construction Orders (y/y) Feb -- -- 27.5TH 03/31 03:30 Exports (y/y) Feb -- -- -2.6TH 03/31 03:30 Imports (y/y) Feb -- -- -14.8TH 03/31 03:30 Trade Balance (US$ mn) Feb -- -- 1392.0TH 03/31 03:30 Current Account Balance (US$ mn) Feb -- 4000 2506TH 03/31 03:30 Business Sentiment Index Feb -- -- 49.0HK 03/31 04:30 Retail Sales - Volume (y/y) Feb -- -- -13.9SK 03/31 19:00 CPI (y/y) Mar 0.5 0.4 0.5SK 03/31 19:00 Core CPI (y/y) Mar -- -- 2.3JN 03/31 19:50 Tankan All Industries Index 1Q -- 0.5 8.9JN 03/31 19:50 Tankan Manufacturing Index 1Q -- 14.0 12.0JN 03/31 19:50 Tankan Non-Manufacturing Index 1Q -- 17.0 16.0SK 03/31 20:00 Exports (y/y) Mar -- -1.8 -3.3SK 03/31 20:00 Imports (y/y) Mar -- -12.1 -19.6SK 03/31 20:00 Trade Balance (US$ mn) Mar -- 8400 7658

Economics
Global Views
March 27, 2015
3
Key Indicators for the week of March 30 – April 3
Forecasts at time of publication. Source: Bloomberg, Scotiabank Economics.
A5
Latin America
Asia Pacific (continued from previous page)
Country Date Time Indicator Period BNS Consensus LatestAU 03/31 20:30 Building Approvals (m/m) Feb -- -4.0 7.9CH 03/31 21:00 Manufacturing PMI Mar -- 49.7 49.9CH 03/31 21:00 Non-manufacturing PMI Mar -- -- 53.9
ID 04/01 00:00 CPI (y/y) Mar 6.1 6.4 6.3ID 04/01 00:00 Core CPI (y/y) Mar -- -- 5.0JN 04/01 01:00 Vehicle Sales (y/y) Mar -- -- -14.2NZ 04/01 19:00 QV House Prices (y/y) Mar -- -- 6.4SK 04/01 19:00 Current Account (US$ mn) Feb -- -- 6938.2JN 04/01 19:50 Monetary Base (y/y) Mar -- -- 36.7AU 04/01 20:30 Trade Balance (AUD mn) Feb -- -1300 -980HK 04/01 22:30 Purchasing Managers Index Mar -- -- 50.7TH 04/01 23:30 Consumer Confidence Economic Mar -- -- 68.4ID 04/01 Consumer Confidence Index Mar -- -- 120.2JN 04/01 Official Reserve Assets (US$ bn) Mar -- -- 1251.1TH 04/01 CPI (y/y) Mar -0.5 -0.5 -0.5TH 04/01 Core CPI (y/y) Mar -- 1.4 1.5
SI 04/02 09:00 Purchasing Managers Index Mar -- -- 49.7CH 04/02 21:45 HSBC Services PMI Mar -- -- 52.0
MA 04/03 00:00 Exports (y/y) Feb -- -2.2 -0.6MA 04/03 00:00 Imports (y/y) Feb -- 1.5 -5.3MA 04/03 00:00 Trade Balance (MYR bn) Feb -- 8.0 9.0
Country Date Time Indicator Period BNS Consensus LatestCL 03/30 08:00 Industrial Production (y/y) Feb -- 1.8 1.0CL 03/30 08:00 Retail Sales (y/y) Feb -- 2.00 1.78
CL 03/31 08:00 Unemployment Rate (%) Feb -- 6.3 6.2CO 03/31 12:00 Urban Unemployment Rate (%) Feb -- 11.1 11.8
PE 04/01 01:00 Consumer Price Index (y/y) Mar 2.8 -- 2.8BZ 04/01 08:00 Industrial Production (y/y) Feb -- -9.0 -5.2BZ 04/01 09:00 PMI Manufacturing Index Mar -- -- 49.6BZ 04/01 14:00 Trade Balance (FOB) - Monthly (US$ mn) Mar -- -- -2842

Economics
Global Views
March 27, 2015
4
Global Auctions for the week of March 30 – April 3
North America
Europe
Source: Bloomberg, Scotiabank Economics.
A6
Country Date Time Event
US 03/30 11:30 3M Bid/Cover Ratio
US 03/30 11:30 3M Direct Accepted %
US 03/30 11:30 3M High Yield Rate
US 03/30 11:30 3M Indirect Accepted %
US 03/30 11:30 6M Bid/Cover Ratio
US 03/30 11:30 6M Direct Accepted %
US 03/30 11:30 6M High Yield Rate
US 03/30 11:30 6M Indirect Accepted %
US 03/30 11:30 U.S. to Sell 3-Month Bills
US 03/30 11:30 U.S. to Sell 6-Month Bills
US 03/31 11:30 4W Bid/Cover Ratio
US 03/31 11:30 4W Direct Accepted %
US 03/31 11:30 4W High Yield Rate
US 03/31 11:30 4W Indirect Accepted %
US 03/31 11:30 52W Bid/Cover Ratio
US 03/31 11:30 52W Direct Accepted %
US 03/31 11:30 52W High Yield Rate
US 03/31 11:30 52W Indirect Accepted %
US 03/31 11:30 U.S. to Sell 52-Week Bills
Country Date Time Event
IT 03/30 05:00 Italy to Sell Up to EUR2 Bln 1.05% 2019 Bonds
MB 03/30 05:00 Malta to Sell Bills
IT 03/30 05:00 Italy to Sell Up to EUR2.5 Bln 1.5% 2025 Bonds
IT 03/30 05:00 Italy to Sell Up to EUR3 Bln 2022 Bonds
DE 03/30 05:00 Denmark to Sell 153-Day Bills
DE 03/30 05:00 Denmark to Sell 61-Day Bills
FR 03/30 08:50 France to Sell Bills
EC 03/31 05:10 ECB Main Refinancing Operation Result
SZ 03/31 05:15 Switzerland to Sell 91-Day Bills
IC 03/31 06:00 Iceland to Sell Bonds
SW 04/01 05:03 Sweden to Sell SEK2.5 Bln 162-Day Bills
SW 04/01 05:03 Sweden to Sell SEK10 Bln 99-Day Bills
GE 04/01 05:30 Germany to Sell EUR4 Bln 0% 2020 Bonds
FR 04/02 04:50 France to Sell Bonds
CC 04/02 05:00 Cyprus to Sell 91-Day Bills

Economics
Global Views
March 27, 2015
5
Global Auctions for the week of March 30 – April 3
Source: Bloomberg, Scotiabank Economics.
A7
Latin America
Asia Pacific
Country Date Time Event
CH 03/30 23:00 China Development Bank To Sell CNY4 Bln 1-Year Bonds
CH 03/30 23:00 China Development Bank To Sell CNY6 bln 3-Year Bonds
JN 04/01 23:35 Japan to Sell 3-Month Bill
JN 04/01 23:45 Japan to Sell 10-Year Bonds
Country Date Time Event
CL 04/01 1M Bill Yield
CL 04/01 3M Bill Yield

Economics
Global Views
March 27, 2015
6
Events for the week of March 30 – April 3
Europe
Source: Bloomberg, Scotiabank Economics.
A8
North America
Latin America
Asia Pacific
Country Date Time EventUS 03/30 19:15 Fischer Speaks on Monetary Policy and Stability in Georgia
CA 03/31 07:30 OEA/CABE 2014 Spring Policy ConferenceUS 03/31 08:00 Fed's Lacker Speaks on the Economic Outlook in RichmondUS 03/31 08:50 Fed's Lockhart Gives Welcome at George ConferenceUS 03/31 09:00 Fed's Mester to Moderate Georgia `Future of Banks' PanelUS 03/31 15:00 Fed's George Speaks in New YorkUS 03/31 Revisions: Wholesale Inventory and Sales Report
US 04/01 09:00 Fed's Williams Moderates Panel on Financial StabilityUS 04/01 10:30 Fed's Lockhart Leads Panel on Banks and Monetary Policy
US 04/02 08:00 Fed Chair Janet Yellen Makes Opening Remarks in Washington
US 04/03 08:30 Fed's Kocherlakota Gives Welcome Remarks at DC Conference
Country Date Time EventEC 03/30 EU's Juncker, Mogherini Meet Ukrainian Officials in Kiev
EC 03/31 09:00 ECB's Nouy Speaks to EU Parliament Committee in BrusselsGE 03/31 German, French Cabinets Hold Joint Meeting in Berlin
UK 04/02 15:00 U.K. Party Leaders' Election Debate on ITV
Country Date Time EventNZ 03/29 21:00 Treasury Publishes Monthly Economic IndicatorsNZ 03/29 22:00 RBNZ Reports Net Currency Sales
JN 03/31 19:50 BOJ Tankan Report
AU 04/01 01:30 Commodity Index YoY
Country Date Time EventCL 03/30 Central Bank 1Q monetary policy report (IPOM)
BZ 03/31 Joaquim Levy testifies to Senate economic affairs commission
CO 04/03 14:00 Colombia Monetary Policy Minutes

Economics
Global Views
March 27, 2015
7
Global Central Bank Watch
NORTH AMERICARate Current Rate Next Meeting Scotia's Forecasts Consensus ForecastsBank of Canada – Overnight Target Rate 0.75 April 15, 2015 0.75 --
Federal Reserve – Federal Funds Target Rate 0.25 April 29, 2015 0.25 0.25
Banco de México – Overnight Rate 3.00 April 30, 2015 3.00 --
EUROPERate Current Rate Next Meeting Scotia's Forecasts Consensus ForecastsEuropean Central Bank – Refinancing Rate 0.05 April 15, 2015 0.05 --
Bank of England – Bank Rate 0.50 April 9, 2015 0.50 0.50
Swiss National Bank – Libor Target Rate -0.75 June 18, 2015 -0.75 --
Central Bank of Russia – One-Week Auction Rate 14.00 April 30, 2015 14.00 13.00
Central Bank of the Republic of Turkey – 1 Wk Repo Rate 7.50 April 22, 2015 7.50 --
Sweden Riksbank – Repo Rate -0.25 April 29, 2015 -0.25 --
Norges Bank – Deposit Rate 1.25 May 7, 2015 1.00 --
ASIA PACIFICRate Current Rate Next Meeting Scotia's Forecasts Consensus ForecastsReserve Bank of Australia – Cash Target Rate 2.25 April 7, 2015 2.00 2.25
Reserve Bank of New Zealand – Cash Rate 3.50 April 29, 2015 3.50 3.50
People's Bank of China – Lending Rate 5.35 TBA -- --
Reserve Bank of India – Repo Rate 7.50 April 7, 2015 7.50 --
Bank of Korea – Bank Rate 1.75 April 9, 2015 1.75 --
Bank of Thailand – Repo Rate 1.75 April 29, 2015 1.75 2.00
Bank Indonesia – Reference Interest Rate 7.50 April 14, 2015 7.50 --
LATIN AMERICARate Current Rate Next Meeting Scotia's Forecasts Consensus ForecastsBanco Central do Brasil – Selic Rate 12.75 April 29, 2015 12.75 --
Banco Central de Chile – Overnight Rate 3.00 April 16, 2015 3.00 --
Banco de la República de Colombia – Lending Rate 4.50 April 24, 2015 4.50 --
Banco Central de Reserva del Perú – Reference Rate 3.25 April 9, 2015 3.00 3.25
AFRICARate Current Rate Next Meeting Scotia's Forecasts Consensus ForecastsSouth African Reserve Bank – Repo Rate 5.75 May 21, 2015 5.75 --
Fedspeak continues next week, including Chair Yellen herself on Thursday providing opening remarks at an economic mobility conference. Vice Chair Fischer may provide more market-moving comments in a keynote address on Monday. Regional Fed Presidents Lacker, Lockhart, Mester, George, and Kocherlakota also all have speaking engagements. The latest nonfarm payrolls print will land on Good Friday but most global markets are shut. Otherwise personal income/spending (Monday), consumer confidence (Tuesday), ISM manufacturing (Wednesday) and the trade balance (Thursday) will play into the Fed’s reaction function. The BoC has no communication on tap yet, so the focus is Tuesday’s release of January GDP, along with Thursday’s February trade figures.
North America
Europe
Asia Pacific
Latin America
Africa
Forecasts at time of publication. Source: Bloomberg, Scotiabank Economics.
A9

Economics
Global Views
March 27, 2015
8
North America
Canada 2014 14Q3 14Q4 Latest United States 2014 14Q3 14Q4 Latest Real GDP (annual rates) 2.5 3.2 2.4 Real GDP (annual rates) 2.4 5.0 2.2 Current Acc. Bal. (C$B, ar) -43.5 -38.4 -55.7 Current Acc. Bal. (US$B, ar) -411 -396 -454 Merch. Trade Bal. (C$B, ar) 4.4 10.6 -9.0 -29.4 (Jan) Merch. Trade Bal. (US$B, ar) -736 -724 -741 -740 (Jan) Industrial Production 2.5 2.7 1.4 -2.2 (Jan) Industrial Production 4.1 4.3 4.5 3.5 (Feb) Housing Starts (000s) 189 199 184 156 (Feb) Housing Starts (millions) 1.00 1.03 1.06 0.90 (Feb) Employment 0.6 0.5 0.7 0.7 (Feb) Employment 1.9 2.0 2.2 2.4 (Feb) Unemployment Rate (%) 6.9 7.0 6.7 6.8 (Feb) Unemployment Rate (%) 6.2 6.1 5.7 5.5 (Feb) Retail Sales 4.6 4.8 4.3 1.2 (Jan) Retail Sales 3.8 4.3 3.7 1.0 (Feb) Auto Sales (000s) 1848 1945 1908 1795 (Jan) Auto Sales (millions) 16.4 16.7 16.7 16.2 (Feb) CPI 1.9 2.1 1.9 1.0 (Feb) CPI 1.6 1.8 1.2 0.0 (Feb) IPPI 2.5 2.7 1.4 2.2 (Jan) PPI 1.9 2.5 0.8 -3.4 (Feb) Pre-tax Corp. Profits 9.0 10.0 6.7 Pre-tax Corp. Profits 8.3 10.0 6.7
Mexico Real GDP 2.1 2.2 2.6 Current Acc. Bal. (US$B, ar) -26.5 -11.1 -21.2 Merch. Trade Bal. (US$B, ar) -2.4 -6.1 -2.7 6.7 (Feb) Industrial Production 1.9 2.0 2.4 0.3 (Jan) CPI 4.0 4.1 4.2 3.0 (Feb)
Euro Zone 2014 14Q3 14Q4 Latest Germany 2014 14Q3 14Q4 Latest Real GDP 0.9 1.0 1.0 Real GDP 1.6 1.2 1.5 Current Acc. Bal. (US$B, ar) 308 364 452 114 (Jan) Current Acc. Bal. (US$B, ar) 219.7 324.0 302.0 234.1 (Jan) Merch. Trade Bal. (US$B, ar) 320.1 324.0 371.0 146.8 (Jan) Merch. Trade Bal. (US$B, ar) 306.6 317.5 311.1 279.3 (Jan) Industrial Production 0.7 0.5 0.2 1.2 (Jan) Industrial Production 1.5 0.3 0.5 0.8 (Jan) Unemployment Rate (%) 11.6 11.5 11.4 11.2 (Jan) Unemployment Rate (%) 6.7 6.7 6.6 6.5 (Feb) CPI 0.4 0.4 0.2 -0.3 (Feb) CPI 0.9 0.8 0.5 0.1 (Feb)
France United Kingdom Real GDP 0.4 0.4 0.2 Real GDP 2.6 2.5 2.7 Current Acc. Bal. (US$B, ar) -28.1 -2.6 0.8 -2.7 (Jan) Current Acc. Bal. (US$B, ar) -108.0 Merch. Trade Bal. (US$B, ar) -39.9 -43.7 -33.9 -38.5 (Jan) Merch. Trade Bal. (US$B, ar) -197.1 -210.4 -184.5 -152.8 (Jan) Industrial Production -1.0 -0.2 -1.5 0.6 (Jan) Industrial Production 1.6 1.2 1.1 1.2 (Jan) Unemployment Rate (%) 10.2 10.3 10.3 10.2 (Jan) Unemployment Rate (%) 6.2 6.0 5.7 5.7 (Dec) CPI 0.5 0.4 0.3 -0.3 (Feb) CPI 1.5 1.5 0.9 0.0 (Feb)
Ita ly Russia Real GDP -0.4 -0.5 -0.5 Real GDP 0.7 Current Acc. Bal. (US$B, ar) 29.3 41.4 55.8 0.5 (Jan) Current Acc. Bal. (US$B, ar) 42.7 6.4 10.5 Merch. Trade Bal. (US$B, ar) 56.7 58.9 73.3 3.1 (Jan) Merch. Trade Bal. (US$B, ar) 15.7 15.1 13.5 15.0 (Jan) Industrial Production -0.7 -1.2 -1.6 -2.4 (Jan) Industrial Production -1.6 1.4 2.1 -1.6 (Feb) CPI 0.2 0.0 0.1 -0.3 (Feb) CPI 7.8 7.7 9.6 16.7 (Feb)
Europe
All data expressed as year-over-year % change unless otherwise noted.
Economic Statistics
Source: Bloomberg, Global Insight, Scotiabank Economics.
A10

Economics
Global Views
March 27, 2015
9
Asia Pacific
Australia 2014 14Q3 14Q4 Latest Japan 2014 14Q3 14Q4 Latest Real GDP 2.7 2.7 2.5 Real GDP -0.1 -1.4 -0.7 Current Acc. Bal. (US$B, ar) -40.3 -54.1 -39.1 Current Acc. Bal. (US$B, ar) 24.6 63.5 52.0 6.2 (Jan) Merch. Trade Bal. (US$B, ar) 12.5 2.6 4.8 -4.6 (Jan) Merch. Trade Bal. (US$B, ar) -122.4 -115.4 -83.8 -64.6 (Feb) Industrial Production 4.2 4.1 3.3 Industrial Production 2.1 -1.1 -1.2 -1.4 (Jan) Unemployment Rate (%) 6.1 6.1 6.2 6.3 (Feb) Unemployment Rate (%) 3.6 3.6 3.5 3.5 (Feb) CPI 2.5 2.3 1.7 CPI 2.7 3.3 2.5 2.2 (Feb)
South Korea China Real GDP 3.3 3.3 2.7 Real GDP 7.4 7.3 7.3 Current Acc. Bal. (US$B, ar) 89.2 90.3 108.9 83.3 (Jan) Current Acc. Bal. (US$B, ar) 213.8 Merch. Trade Bal. (US$B, ar) 47.2 35.7 73.4 92.5 (Feb) Merch. Trade Bal. (US$B, ar) 382.5 513.3 599.6 727.4 (Feb) Industrial Production 0.5 1.1 -1.7 -3.5 (Jan) Industrial Production 7.9 8.0 7.9 7.9 (Dec) CPI 1.3 1.4 1.0 0.5 (Feb) CPI 1.5 1.6 1.5 1.4 (Feb)
Thailand India Real GDP 0.7 0.6 2.3 Real GDP 6.9 7.8 7.5 Current Acc. Bal. (US$B, ar) 14.2 -0.5 9.8 Current Acc. Bal. (US$B, ar) -27.3 -10.1 -8.2 Merch. Trade Bal. (US$B, ar) 2.0 1.6 2.5 1.4 (Jan) Merch. Trade Bal. (US$B, ar) -11.5 -12.4 -13.2 -6.8 (Feb) Industrial Production -4.6 -3.8 -2.1 -0.8 (Jan) Industrial Production 1.7 1.3 1.5 2.6 (Jan) CPI 1.9 2.0 1.1 -0.5 (Feb) WPI 3.8 3.9 0.3 -2.1 (Feb)
Indonesia Real GDP 5.0 4.9 5.0 Current Acc. Bal. (US$B, ar) -26.2 -7.0 -6.2 Merch. Trade Bal. (US$B, ar) -0.2 -0.2 -0.1 0.7 (Feb) Industrial Production 4.6 5.8 4.8 5.0 (Jan) CPI 6.4 4.4 6.5 6.3 (Feb)
Brazil 2014 14Q3 14Q4 Latest Chile 2014 14Q3 14Q4 Latest Real GDP 0.1 -0.6 -0.2 Real GDP 1.9 1.0 1.8 Current Acc. Bal. (US$B, ar) -91.3 -77.6 -111.4 Current Acc. Bal. (US$B, ar) -5.1 -6.3 -2.8 Merch. Trade Bal. (US$B, ar) -3.9 7.2 -12.9 -34.1 (Feb) Merch. Trade Bal. (US$B, ar) 6.7 4.2 7.0 9.0 (Feb) Industrial Production -3.1 -3.8 -4.1 -4.7 (Jan) Industrial Production 0.4 -0.9 -1.0 5.8 (Jan) CPI 6.3 6.6 6.5 7.7 (Feb) CPI 4.4 4.7 5.3 4.4 (Feb)
Peru Colombia Real GDP 1.8 Real GDP 4.6 4.2 3.5 Current Acc. Bal. (US$B, ar) -8.2 -1.6 -1.5 Current Acc. Bal. (US$B, ar) -19.8 -5.0 -6.4 Merch. Trade Bal. (US$B, ar) -0.2 -0.1 -0.1 -0.5 (Jan) Merch. Trade Bal. (US$B, ar) -0.5 -0.4 -1.4 -1.8 (Jan) Unemployment Rate (%) 6.0 5.7 5.6 6.9 (Feb) Industrial Production 1.3 1.2 0.3 2.1 (Dec) CPI 3.2 2.9 3.2 2.8 (Feb) CPI 2.9 2.9 3.5 4.4 (Feb)
Latin America
Economic Statistics
All data expressed as year-over-year % change unless otherwise noted.
Source: Bloomberg, Global Insight, Scotiabank Economics.
A11

Economics
Global Views
March 27, 2015
10
Financial Statistics
A12
Interest Rates (%, end of period)
Canada 14Q3 14Q4 Mar/20 Mar/27* United States 14Q3 14Q4 Mar/20 Mar/27*BoC Overnight Rate 1.00 1.00 0.75 0.75 Fed Funds Target Rate 0.25 0.25 0.25 0.25 3-mo. T-bill 0.92 0.92 0.52 0.55 3-mo. T-bill 0.02 0.04 0.00 0.03 10-yr Gov’t Bond 2.15 1.79 1.31 1.39 10-yr Gov’t Bond 2.49 2.17 1.93 1.96 30-yr Gov’t Bond 2.67 2.34 1.94 2.01 30-yr Gov’t Bond 3.20 2.75 2.51 2.55 Prime 3.00 3.00 2.85 2.85 Prime 3.25 3.25 3.25 3.25 FX Reserves (US$B) 73.6 74.6 74.7 (Feb) FX Reserves (US$B) 126.0 119.0 113.7 (Feb)
Germany France 3-mo. Interbank 0.04 0.02 -0.03 0.01 3-mo. T-bill -0.03 -0.05 -0.20 -0.17 10-yr Gov’t Bond 0.95 0.54 0.18 0.21 10-yr Gov’t Bond 1.29 0.83 0.44 0.50 FX Reserves (US$B) 65.1 62.3 62.4 (Feb) FX Reserves (US$B) 50.6 49.5 51.4 (Feb)
Euro Zone United Kingdom Refinancing Rate 0.05 0.05 0.05 0.05 Repo Rate 0.50 0.50 0.50 0.50 Overnight Rate 0.20 0.14 -0.06 -0.06 3-mo. T-bill 0.51 0.44 0.44 0.43 FX Reserves (US$B) 329.4 327.6 333.3 (Feb) 10-yr Gov’t Bond 2.43 1.76 1.52 1.55
FX Reserves (US$B) 94.4 95.7 102.9 (Feb)
Japan Australia Discount Rate 0.30 0.30 0.30 0.30 Cash Rate 2.50 2.50 2.25 2.25 3-mo. Libor 0.05 0.05 0.04 0.03 10-yr Gov’t Bond 3.48 2.74 2.38 2.41 10-yr Gov’t Bond 0.53 0.33 0.33 0.38 FX Reserves (US$B) 50.1 50.8 47.0 (Feb) FX Reserves (US$B) 1234.4 1231.0 1221.2 (Feb)
Exchange Rates (end of period)
USDCAD 1.12 1.16 1.26 1.25 ¥/US$ 109.65 119.78 120.04 119.20CADUSD 0.89 0.86 0.80 0.80 US¢/Australian$ 0.87 0.82 0.78 0.78GBPUSD 1.621 1.558 1.495 1.490 Chinese Yuan/US$ 6.14 6.21 6.20 6.22EURUSD 1.263 1.210 1.082 1.087 South Korean Won/US$ 1055 1091 1123 1103JPYEUR 0.72 0.69 0.77 0.77 Mexican Peso/US$ 13.429 14.752 15.056 15.146USDCHF 0.96 0.99 0.98 0.96 Brazilian Real/US$ 2.447 2.658 3.231 3.235
Equity Markets (index, end of period)
United States (DJIA) 17043 17823 18128 17699 U.K. (FT100) 6623 6566 7023 6864 United States (S&P500) 1972 2059 2108 2063 Germany (Dax) 9474 9806 12039 11908 Canada (S&P/TSX) 14961 14632 14942 14792 France (CAC40) 4416 4273 5087 5046 Mexico (IPC) 44986 43146 43968 43355 Japan (Nikkei) 16174 17451 19560 19286 Brazil (Bovespa) 54116 50007 51967 50126 Hong Kong (Hang Seng) 22933 23605 24375 24486 Italy (BCI) 1119 1038 1262 1252 South Korea (Composite) 2020 1916 2037 2020
Commodity Prices (end of period)
Pulp (US$/tonne) 1030 1020 995 995 Copper (US$/lb) 3.06 2.88 2.69 2.79 Newsprint (US$/tonne) 605 595 580 580 Zinc (US$/lb) 1.04 0.98 0.91 0.94 Lumber (US$/mfbm) 340 340 276 282 Gold (US$/oz) 1216.50 1206.00 1183.10 1195.75 WTI Oil (US$/bbl) 91.16 53.27 45.72 50.14 Silver (US$/oz) 17.11 15.97 16.17 17.14 Natural Gas (US$/mmbtu) 4.12 2.89 2.79 2.62 CRB (index) 278.55 229.96 214.11 216.79
* Latest observation taken at time of writing. Source: Bloomberg, Scotiabank Economics.
A12

Global Views
March 27, 2015
Fixed Income Strategy (London) www.gbm.scotiabank.com © 2012, The Bank of Nova Scotia This material, its content, or any copy of it, may not be altered in any way, transmitted to, copied or distributed to any other party without the prior express written consent of ScotiabankTM. This material has not been prepared by a member of the research department of Scotiabank, it is solely for the use of sophisticated institutional investors, and this material does not constitute investment advice or any personal recommendation to invest in a financial instrument or “investment research” as defined by the Financial Services Authority. This material is provided for information and discussion purposes only. An investment decision should not be made solely on the basis of the contents of this publication. It is not to be construed as a solicitation or an offer to buy or sell any financial instruments and has no regard to the specific investment objectives, financial situation or particular needs of any recipient. It is not intended to provide legal, tax, accounting or other advice and recipients should obtain specific professional advice from their own legal, tax, accounting or other appropriate professional advisers before embarking on any course of action. The information in this material is based on publicly available information and although it has been compiled or obtained from sources believed to be reliable, such information has not been independently verified and no guarantee, representation or warranty, express or implied, is made as to its accuracy, completeness or correctness. Information included in this material related to comparison performance (whether past or future) or simulated performance (whether past or future) is not a reliable indicator of future returns. This presentation is not directed to or intended for use by any person resident or located in any country where the distribution of such information is contrary to the laws of such country. Scotiabank its directors, officers, employees or clients may currently or from time to time own or hold interests in long or short positions in any securities referred to herein, and may at any time make purchases or sales of these securities as principal or agent. Scotiabank may also have provided or may provide investment banking, capital markets or other services to the companies referred to in this communication.
TM Trademark of The Bank of Nova Scotia. Used under license, where applicable. Scotiabank, together with "Global Banking and Markets", is a marketing name for the global corporate and investment banking and capital markets businesses of The Bank of Nova Scotia and certain of its affiliates in the countries where they operate, including Scotia Capital Inc., Scotia Capital (USA) Inc., Scotiabanc Inc.; Citadel Hill Advisors L.L.C.; The Bank of Nova Scotia Trust Company of New York; Scotiabank Europe plc; Scotia Capital (Europe) Limited; Scotiabank (Ireland) Limited; Scotiabank Inverlat S.A., Institución de Banca Múltiple, Scotia Inverlat Casa de Bolsa S.A. de C.V., Scotia Inverlat Derivados S.A. de C.V. – all members of the Scotiabank Group and authorized users of the mark. The Bank of Nova Scotia is incorporated in Canada with limited liability. Scotia Capital Inc. is a member of CIPF. Scotia Capital (USA) Inc. is a registered broker-dealer with the SEC and is a member of the NASD and SIPC. The Bank of Nova Scotia, Scotiabank Europe plc, Scotia Capital (Europe) Limited and Scotia Capital Inc. are each authorised and regulated by the Financial Services Authority (FSA) in the U.K. Scotiabank Inverlat, S.A., Scotia Inverlat Casa de Bolsa, S.A. de C.V., and Scotia Derivados, S.A. de C.V., are each authorized and regulated by the Mexican financial authorities. Fixed Income Strategy (Paris) Disclaimer © 2011, The Bank of Nova Scotia This material, its content, or any copy of it, may not be altered in any way, transmitted to, copied or distributed to any other party without the prior express written consent of Scotiabank™. This material has not been prepared by a member of the research department of Scotiabank, it is solely for the use of sophisticated institutional investors, and this material does not constitute investment advice or any personal recommendation to invest in a financial instrument or “investment research” as defined by the Financial Services Authority. This material is provided for information and discussion purposes only. An investment decision should not be made solely on the basis of the contents of this publication. It is not to be construed as a solicitation or an offer to buy or sell any financial instruments and has no regard to the specific investment objectives, financial situation or particular needs of any recipient. It is not intended to provide legal, tax, accounting or other advice and recipients should obtain specific professional advice from their own legal, tax, accounting or other appropriate professional advisers before embarking on any course of action. The information in this material is based on publicly available information and although it has been compiled or obtained from sources believed to be reliable, such information has not been independently verified and no guarantee, representation or warranty, express or implied, is made as to its accuracy, completeness or correctness. Information included in this material related to comparison performance (whether past or future) or simulated performance (whether past or future) is not a reliable indicator of future returns. This presentation is not directed to or intended for use by any person resident or located in any country where the distribution of such information is contrary to the laws of such country. Scotiabank its directors, officers, employees or clients may currently or from time to time own or hold interests in long or short positions in any securities referred to herein, and may at any time make purchases or sales of these securities as principal or agent. Scotiabank may also have provided or may provide investment banking, capital markets or other services to the companies referred to in this communication.
Disclaimer

Global Views
March 27, 2015
Foreign Exchange Strategy This publication has been prepared by The Bank of Nova Scotia (Scotiabank) for informational and marketing purposes only. Opinions, estimates and projections contained herein are our own as of the date hereof and are subject to change without notice. The information and opinions contained herein have been compiled or arrived at from sources believed reliable, but no representation or warranty, express or implied, is made as to their accuracy or completeness and neither the information nor the forecast shall be taken as a representation for which Scotiabank, its affiliates or any of their employees incur any responsibility. Neither Scotiabank nor its affiliates accept any liability whatsoever for any loss arising from any use of this information. This publication is not, and is not constructed as, an offer to sell or solicitation of any offer to buy any of the currencies referred to herein, nor shall this publication be construed as an opinion as to whether you should enter into any swap or trading strategy involving a swap or any other transaction. The general transaction, financial, educational and market information contained herein is not intended to be, and does not constitute, a recommendation of a swap or trading strategy involving a swap within the meaning of U.S. Commodity Futures Trading Commission Regulation 23.434 and Appendix A thereto. This material is not intended to be individually tailored to your needs or characteristics and should not be viewed as a “call to action” or suggestion that you enter into a swap or trading strategy involving a swap or any other transaction. You should note that the manner in which you implement any of the strategies set out in this publication may expose you to significant risk and you should carefully consider your ability to bear such risks through consultation with your own independent financial, legal, accounting, tax and other professional advisors. Scotiabank, its affiliates and/or their respective officers, directors or employees may from time to time take positions in the currencies mentioned herein as principal or agent, and may have received remuneration as financial advisor and/or underwriter for certain of the corporations mentioned herein. Directors, officers or employees of Scotiabank and its affiliates may serve as directors of corporations referred to herein. All Scotiabank products and services are subject to the terms of applicable agreements and local regulations. This publication and all information, opinions and conclusions contained in it are protected by copyright. This information may not be reproduced in whole or in part, or referred to in any manner whatsoever nor may the information, opinions and conclusions contained in it be referred to without the prior express written consent of Scotiabank. ™Trademark of The Bank of Nova Scotia. Used under license, where applicable. Scotiabank, together with “Global Banking and Markets”, is a marketing name for the global corporate and investment banking and capital markets businesses of The Bank of Nova Scotia and certain of its affiliates in the countries where they operate, all members of the Scotiabank group and authorized users of the mark. The Bank of Nova Scotia is incorporated in Canada with limited liability and is authorised and regulated by the Office of the Superintendent of Financial Institutions Canada. The Bank of Nova Scotia and Scotiabank Europe plc are authorised by the UK Prudential Regulation Authority. The Bank of Nova Scotia is subject to regulation by the UK Financial Conduct Authority and limited regulation by the UK Prudential Regulation Authority. Scotiabank Europe plc is authorised by the UK Prudential Regulation Authority and regulated by the UK Financial Conduct Authority and the UK Prudential Regulation Authority. Details about the extent of The Bank of Nova Scotia's regulation by the UK Prudential Regulation Authority are available on request. Scotiabank Inverlat, S.A., Scotia Inverlat Casa de Bolsa, S.A. de C.V., and Scotia Inverlat Derivados, S.A. de C.V., are each authorized and regulated by the Mexican financial authorities.Not all products and services are offered in all jurisdictions. Services described are available in jurisdictions where permitted by law.
Disclaimer

Scotiabank Economics
Scotia Plaza 40 King Street West, 63rd Floor
Toronto, Ontario Canada M5H 1H1
Tel: 416.866.6253 Fax: 416.866.2829
Email: [email protected]
For general and publication-related inquiries, contact
us by telephone, email and/or fax.
Scotiabank Economics
This report has been prepared by Scotiabank Economics as a resource for the clients of Scotiabank. Opinions, estimates and projections contained herein are our own as of the date hereof and are subject to change without notice. The information and opinions contained herein have been compiled or arrived at from sources believed reliable but no representation or warranty, express or implied, is made as to their accuracy or completeness. Neither Scotiabank nor its affiliates accepts any liability whatsoever for any loss arising from any use of this report or its contents. TM Trademark of The Bank of Nova Scotia. Used under license, where applicable.
Disclaimer
Global Views
March 27, 2015