globalisation, imports and local content in the south ... · globalisation, imports and local...
TRANSCRIPT
Globalisation, Imports and Local Content in the South African Automotive Industry
Anthony Black and Sipho Bhanisi
The Birchwood Hotel and Conference CentreJohannesburg, South Africa
Accelerated and Shared Growth in South Africa:Determinants, Constraints and Opportunities
18 - 20 October 2006
Conference organised withsupport from the EU

1
1
First draft: Not for quotation without permission
Globalisation, Imports and Local Content in the South AfricanAutomotive Industry
Anthony Black1 and Sipho Bhanisi2
October 2006
1. INTRODUCTION
The globalisation of the South African automotive industry has received much attention.3
Much of the focus has been on the rapid increase in exports resulting at least in part
from the impact of the Motor Industry Development Programme (MIDP). The MIDP’s
main policy elements of tariff reduction and export-import complementation are generally
credited to have played a very significant role in promoting competitiveness and export
expansion. Imports constitute the other side of the adjustment coin and have received
much less attention. In assessing the impact of globalisation, the supply response of
firms to the realignment of incentives towards global rather than domestic markets is a
fundamental determinant. In any process of liberalisation, import expansion would be
anticipated but successful adjustment may require new investment and growing
efficiencies to at least partly offset the impact of declining protection.
The overall picture in the South African automotive sector is that exports have increased
very rapidly but imports have expanded rapidly as well. The growth of vehicle imports is
clearly visible on our roads. Consumers have benefited from a rapidly expanding range
of makes and models, many of which are imported. Less visible and more difficult to
measure is what lies beneath the bonnets of the half million vehicles being assembled
annually in South Africa. Each vehicle contains some 10,000 components, which really
constitute the heart of the industry. A significant percentage of these components are
imported.
Total automotive imports increased from R18.0 billion in 1996 to R73.3 billion in 2005,
and exports increased from R5.6 billion to R45.6 billion over the same period. The value
1School of Economics, University of Cape Town
2Department of Agriculture and School of Economics, University of Cape Town
3See for example, Barnes and Kaplinsky (2000); Black (2001), Black (TIPS), Barnes, Kaplinsky
and Morris (2004).

2
2
of imported vehicles has increased even more sharply; from only R2.8 billion in 1996 to
R28.3 billion in 2005, accounting for nearly 40% of the domestic market. However,
imports of components are considerably larger although the growth rate has been less
dramatic because they started from a higher base. Imports of original equipment and
aftermarket components rose from R15.2 billion to R45.0 billion in 2005. Automotive
products constitute a large and growing segment of South Africa’s total imports (Figure
1). Vehicle ownership is highly income elastic and with GDP growth in excess of 4%,
further rapid increases in vehicle sales are likely. This means that automotive imports
are likely to remain an important component of the current account.
Figure 1: Automotive imports as a share of total imports
0%
2%
4%
6%
8%
10%
12%
14%
16%
18%
20%
1990 1991 1992 1993 1994 1995 1996 1997 1998 1999 2000 2001 2002 2003 2004 2005
TotalAutoImports/Total Imports
The first objective of this paper is to accurately measure the trends in automotive imports
and to place them in a global and local context. The second objective is to explain the
changes that have occurred and their policy implications. There are a number of factors
at play here. Clearly imports are a function of factors such as the growth in the internal
market and the exchange rate. Our focus is primarily on determinants which are more
specific to the automotive industry. These include the policy regime (tariff reductions
and the ability to rebate import duties by exporting), the position of the industry in
relation to global trends in the location of automotive production, the strategies of vehicle
manufacturers, changes in the structure of production, economies of scale and the role
of foreign ownership.
This paper represents work in progress. Detailed survey data on local content for each
manufacturer is not yet available. This will allow us to explore in greater depth, questions
such as the extent to which new model introductions are a factor in determining local

3
3
content and the extent to which higher volumes, for example, in export models lead to
higher local content?
2. GLOBAL TRENDS AND THEIR IMPACT ON THE SOUTH AFRICAN AUTOMOTIVE
INDUSTRY
Internationally, global integration is occurring very rapidly in the automotive industry,
driven by lower trade barriers including the formation and extension of regional trading
blocs4 as well as by the global strategies of major international firms. Global trade in
automotive products grew by an average annual rate of over 8% from 1980 to reach
$847 billion by 2004, accounting for 9.5 % of total merchandise trade and 12.9 % of total
trade in manufactures (WTO).
Table 1 indicates the most important global importers of automotive products for the
period 1980 to 2004. The bulk of world trade takes place within the EU and NAFTA and
the importance of the regional dimension to global automotive trade has led some to
argue that this is a more important force than globalisation.5 South Africa’s share of
global automotive imports, while small, had been growing rapidly.
The share of developing countries in global production and exports has also increased
very rapidly driven by rapidly expanding markets in these countries but also by the
desire by global automotive firms to seek out cheaper locations. Automotive exports
from the 20 major developing country exporters increased to $115.7 billion in 2004 from
$12.3 billion in 1980, representing an increase from 3.9% of global automotive exports to
13.7%.
In this fast changing milieu the outcome of liberalisation is not predetermined. Rapid
liberalisation in the automotive industry has had very different outcomes in, say Chile
and New Zealand, compared to Mexico and the Czech Republic. In considering the
prospects for the growth of the automotive industry in the developing world, four types of
industry locations can be identified.6 Big emerging markets (BEMs) such as China and
India have clear advantages in that they constitute large existing markets with huge
potential. A second category includes countries which are part of regional trading blocs
which collectively can constitute viable ‘automotive spaces’. These countries include
4NAFTA and the enlarged EU have been of particular importance. Other regional formations
such as Mercosur (Laplane and Sarti; 2004) and ASEAN (Shimokawa; 2004) have been muchless significant although this could change.5
See for example van Tulder and Audet (2004).6
We draw here on the typologies used by Sturgeon and Florida (1999) and Humphrey and Oeter(2000).

4
4
Brazil and Argentina (in Mercosur) and Thailand and Malaysia (in ASEAN). Neither
grouping is yet fully effective and Brazil, of course, on its own constitutes a large market.
Sturgeon and Florida (1999) use the term PLEMA’s7 to define the third category. This
group includes countries such as Mexico and also new members of the EU such as the
Czech Republic and Poland. The final category includes countries with independent
strategies such as Korea. South Africa manifestly lacks the attributes of a big emerging
market, is not part of a significant trading bloc8 and is not on the periphery of a major
market. It also does not have home grown firms or governmental strategy capable of
driving a successful Korean style independent strategy.
Table 1: Leading importers of automotive products, 1980-2004
Notes: a Includes Secretariat estimatesc Imports are valued f.o.b.d 2003 instead of 2004
Source: WTO
7Countries on the ‘periphery of large existing market areas’.
8As far as the automotive industry is concerned SADC is insignificant although this may well
change in the long term (Black and Muradzikwa, 2004)
Value ($bn) Share in world imports (%) Annual %change
2004 1980 1990 2000 2004 2000-04
ImportersEuropean Union
(25) 397.44 - - 41.9 46.2 13extra-EU (25)
imports 52.54 - - 5.5 6.1 13
United States 197.00 20.3 24.7 28.9 22.9 4
Canada c 52.85 8.7 7.7 7.9 6.1 3
Mexico a, b, c 21.60 1.8 1.6 3.4 2.5 2
China b 14.43 0.6 0.6 0.6 1.7 40
Australia c 13.35 1.3 1.2 1.5 1.6 12
Japan 12.80 0.5 2.3 1.7 1.5 6
Turkey 11.51 ... 0.4 1.0 1.3 19Russian Federation
a 10.50 - - 0.4 1.2 43
Switzerland 8.10 1.8 1.9 1.1 0.9 7
Saudi Arabia a 6.72 2.7 0.9 0.6 0.8 15
South Africa a, c 5.65 ... ... 0.4 0.7 24United Arab
Emirates a, d 5.64 0.4 0.3 0.5 0.8 ...
Norway 4.58 0.6 0.4 0.4 0.5 15
Thailand a 3.87 ... 0.8 0.4 0.4 19
Above 15 766.03 - - 90.7 89.2 -
5
5
These attributes, or rather the lack of them, have implications for how South Africa is
perceived by the major global decision makers and how they chose to position South
Africa within their global networks. As we shall see, this affects the orientation of
international firms to the South African market and types of investments that have been
undertaken, which in turn impacts on South Africa’s trade profile and development
prospects.
3. EARLY POLICY DEVELOPMENTS
Tariffs and the local content programme
In promoting the development of the automotive industry, South Africa initially followed a
programme of import substitution similar to that adopted in other developing countries
especially in Latin America. High tariffs were placed on built up vehicles, which when
combined with a rapidly growing market, acted as a magnet to a large number of (initially
foreign) companies which established assembly plants in the country. These operations,
although in many cases highly profitable, were very small in international terms with
correspondingly high unit costs. Production was aimed solely at the domestic market
and the South African assembly plants were kept isolated from the global production
networks of the parent companies except as markets for completely knocked down
(CKD) packs.
Ford and General Motors were the first to establish a production presence in South
Africa. They were granted protection and established assembly plants in Port Elizabeth
in the 1920s. The domestic market expanded rapidly in the post-war period reaching
120,000 vehicles in 1960 and a large number of assembly plants were established. The
level of local content at this stage was only 20%. The adverse impact on the balance of
payments led to increasing government support for greater usage of domestically
produced components. As a result, the first in a series of local content programmes was
introduced in 1961. Domestic sourcing of eleven peripheral items such as tyres,
batteries and trim was required and higher local content levels rewarded with additional
import permits (Duncan, 1991). Net local content rose rapidly, reaching approximately
52% by mass by 1971, which marked the end of Phase II of the programme. Rapid
growth was accompanied by a proliferation of assemblers and also by the development
of a low volume components industry oriented towards the production of heavier
components such as body pressings (due to local content being measured on a mass
basis).
6
6
Under Phase III, local content (on a mass basis) was to reach 66 percent by 1977 in the
case of ‘manufactured’ vehicles. Phase IV was a consolidation period with no additional
requirements and Phase V, which was introduced in 1980, applied a local content
requirement of 50% to light commercial vehicles rising to 66% in 1982.
The automotive industry has always been import intensive and in all these developments
the main motivating factor for increasing local content remained the desire to save
foreign exchange. The import penetration ratio in 1965 was 37.1% and after two
decades of prohibitive protection on built up vehicles combined with moderate local
content requirements this had reduced to 30.0% by 1985, still the highest of any
industrial sector apart from machinery (Kahn, 1987:248).
The Phase VI Programme
The problems inherent in the above approach to the promotion of local content were
aggravated by the severe slump, which followed the gold boom of the early 1980s. By
late 1986, there were seven assemblers producing over 20 basic model variants for a
market of 172,000 passenger cars. These low volumes meant that the industry was
uncompetitive. Exports were minimal (R105m in 1985) and with the increased
introduction of highly sophisticated components, it had become increasingly easy to
meet mass based local content requirements while increasing the value of imported
components. Imports of vehicles and components amounted to R2059m during 1985, a
year of weak demand.
According to the BTI, the local content programme up to and including Phase V had two
main deficiencies. It led to:
“a tendency to produce low cost, low technology components which were
unremunerative to export and were produced in uneconomic volumes so
locking the industry into a low volume, high cost production structure; and….
a very high import bill as source companies tended to load the price of
components they supplied to local producers. As they were supplying largely
high technology components which the local industry did not produce, this
too tended to raise prices as there was no incentive to produce low mass,
high cost components locally”.
The new Phase VI local content programme, introduced in 1989, was therefore aimed at
promoting investment, improving productivity, minimising price increases and
maintaining competition (BTI, 1989). It marked a significant change in direction. Local
content was to be measured by value rather than mass. Most importantly, local content

7
7
was to be measured not just by the value of domestically produced components fitted to
locally assembled vehicles but on a net foreign exchange usage basis. In other words,
exports by an assembler counted as local content and enabled it to reduce actual local
content in domestically produced vehicles.
The system operated through the imposition of an excise duty of 37.5% on all locally
assembled vehicles. However, this duty was rebatable to the extent of 50% of the local
content value so that if the local content target (75%) was achieved, no duty was
payable. A minimum average level of 50% actual local content (i.e. irrespective of
exports) had to be maintained across the model range but local content was defined
very broadly as the ex works price less foreign exchange used. It therefore included
profit margins and overheads.
In addition to the protection added by the local content programme, the industry also
received tariff protection on sub-sectors, which fell outside the ambit of Phase VI such as
completely built up (CBU) vehicles, spare parts and accessories. Built up vehicles
received tariff protection of 100% and were subject to a 15% surcharge. As a result,
imports were minimal. The calculation of the effective rate of protection on built up
vehicles is complicated by local content arrangements but because of reduced
protection on components, it increased sharply under Phase VI.
Exports under Phase VI received a substantial effective subsidy in the form of a rebate
of excise duty of 50 cents in the rand. All exports were channelled via vehicle producers
and component exporters had to negotiate the extent of the ‘subsidy’ that they received.
Component producers usually received 60-70% of the rebate or 30-35 cents per rand (of
local content value) of exports. However, there was pressure to reduce this as
assemblers approached their required local content levels.
The impact of Phase VI
Under Phase VI, exports rose faster than expected and this is one area where most
observers would agree that the programme was successful. The growth trend was
dramatic and exports increased from negligible volumes in the mid 1980s to
approximately R2,245 million in 1994. Many component suppliers and all the assemblers
instituted significant export drives. Assemblers developed international marketing
channels frequently via their overseas principals and identified the types of components
where local producers had a competitive advantage. The position of assemblers in the
auto industry’s producer driven value chain proved critical. As we will show in the
response to the MIDP, this has been a key factor in explaining the strong supply
response to the changes to the incentive regime.
8
8
Rapidly rising exports gave assemblers considerably greater flexibility in their sourcing
arrangements. By the end of Phase V, local content in terms of mass (which was the
measurement used) had reached 66% but was lower in value terms. Under Phase VI
actual local content needed only be a minimum of 50% averaged across the model
range as long as the rest of the total 75% ‘local content’ requirement was made up
through exports. It is clear, therefore, that with the growth in exports, vehicle producers
were able to significantly reduce the local content in domestically assembled vehicles.
Imported components were mainly brought into the country in the form of completely
knocked down (CKD) packs. If a vehicle producer opted to use a local component the
foreign supplier would remove this from the pack and subtract a ‘deletion allowance’
from the cost of the pack. Deletion allowances were widely held to be below competitive
international prices. The result was that a domestic component manufacturer was
competing not with ‘competitive’ international prices, but with a lower deletion allowance.
While the component industry was previously excessively protected compared to the
other intermediate goods sectors, under Phase VI this situation had changed
dramatically.
The short term impact of Phase VI on the domestic component industry was felt in three
main areas:
1. The switch from mass to value had a highly differentiated effect on the
component sector. Vehicle producers began looking at ways of increasing local
content by value rather than mass. Heavy components such as body pressings
were no longer required and came under increasing pressure. Because of high
tooling costs and short production runs, this was one of the most vulnerable
sectors especially as it had enjoyed exceptionally high protection in terms of the
mass based scheme. Pressing firms were forced to rapidly restructure by
specialising in fewer parts and establishing export markets in collaboration with
vehicle producers. There was also a limited shift into the increasing use of
domestically produced high value components such as electronics.
2. Components which formed part of sub-assemblies also came under threat
because it became cheaper to import these in a semi-assembled form thus
simplifying assembly and limiting the problems of local re-engineering, quality
and supply complexities.
3. Components with high tooling costs in relation to the cost of the component were
also vulnerable (e.g. plastic moulded components). Again, low volume production
for the domestic market made these uneconomic.

9
9
However, for models introduced under Phase V, manufacturers tended to maintain their
sourcing arrangements due to sunk investment in tooling and contractual obligations.
Also, it took time to build up large export volumes. Thus the increased flexibility to source
additional components abroad was most apparent with new model introductions and
started to have a major impact from 1992. Estimating the impact of Phase VI is
complicated by the difficulties of disaggregating the impact of recession from reduced
domestic sourcing. Also, reduced domestic sourcing was to some extent compensated
for by exports although much of this was in ‘non-traditional’ components such as
catalytic converters. There was, however, a significant fall in employment in the
component industry in the first three years following the introduction of Phase VI.
As has been explained above, the growth in exports greatly increased the flexibility of
component sourcing allowing assemblers to take advantage of cheaper foreign
components. This led to a substantial reduction in costs, especially as new models were
introduced. Component suppliers, who were used to prices being determined on a ‘cost
plus’ basis, were forced to become more efficient and reduce their margins as they faced
ultimatums to reduce prices in real terms or have the particular component placed back
in the CKD pack.
A major defect of Phase VI is that it did not address the major factor impacting on the
scale of production in the components sector – proliferation of makes and models in the
domestic market. Increased flexibility in component sourcing increased the effective rate
of protection on built up vehicles and the predictable result was an increase in the variety
of models and makes being assembled locally.
The series of local content programmes introduced in South Africa was seriously flawed.
They were directly responsible for the development of a fragmented and non-competitive
industry. Phase VI was an attempt to address this situation. It encouraged exports but at
the same time drastically reduced protection of the components sector while doing
nothing to reduce proliferation of models being assembled domestically, which was one
of the major reasons for the component sector being uncompetitive. A further problem
was that Phase VI was introduced at a time of great political and economic uncertainty
and a generalised lack of investor confidence. This provided an inappropriate
environment for a programme of structural adjustment, the success of which is
contingent on a positive supply response.
10
10
4. THE MOTOR INDUSTRY DEVELOPMENT PROGRAMME
The introduction of the MIDP
Phase VI came in for heavy criticism with frequent changes adding to the atmosphere of
uncertainty. In particular, there was pressure from the component producer federation,
NAACAM, and in late 1992 the Motor Industry Task Group (MITG) was appointed to re-
examine the programme and advise government on a future development policy for the
industry. The MITG was a tripartite forum representing industry, trade unions and
government. Government made it clear that tariffs had to be reduced in line with WTO
obligations.
The eventual outcome was the Motor Industry Development Programme (MIDP), which
was introduced in 1995. The recommendations of the MITG were only partly accepted.
Most notably the contentious proposal to encourage higher model volumes and force a
degree of rationalisation was not accepted, as a result of strong opposition from the
vehicle producers federation, NAAMSA. The MIDP continued the direction taken by
Phase VI and entrenched the principle of export complementation. However, it went a
step further by abolishing local content requirements and introducing a tariff phase down
at a steeper rate than required by the terms of South Africa’s offer to the GATT.
The main elements of the MIDP were the following:
a) The excise duty based local content system was changed to a tariff driven
programme.
b) There was no minimum local content requirement.
c) Tariffs were to be phased down to 40% for light vehicles and 30% for components by
2002
d) Manufacturers of light vehicles were entitled to a duty free allowance in terms of
which components to the value of 27% of the wholesale price of the vehicle could be
imported duty free.
e) Import duties on components and vehicles could be offset by import rebate credits
derived from the export of vehicles and components.
f) Provision was made for a Small Vehicle Incentive (SVI) in the form of a higher duty
free allowance for low cost vehicles.
While nominal duties on imported vehicles were set to remain high even until the year
2002, the ability to rebate import duties by exporting enabled importers to bring in
vehicles at lower effective rates of duty. Import-export complementation also enabled
assemblers to use import credits to source components at close to international prices,
thus declining nominal protection on vehicles was to some extent being offset by
reduced protection for components.

11
11
Mid term review and 2003 Review
In response to the need to assess the impact of the MIDP as well as to provide long term
policy certainty to the industry, the dti conducted a Mid Term Review in 1998, the results
of which were published in 1999.9 A further Review was conducted in 2002/2003. Both
policy reviews extended the MIDP with minor adjustments and with a continued gradual
decline in assistance to the industry (see Table 2). In the Mid Term Review the MIDP
Table 2: The MIDP as amended in the Mid Term Review and the 2003 Review
Year Import duty Value of export
performance
Qualifying PGM
content
Ratio of exports against imports
Built up light
vehicles
Original
equipment
components
Built up vehicles
and components
(excluding tooling)
Catalytic Converters
exported
Components,
heavy duty
vehicles & tooling
exported: CBU
light vehicles
imported
Components,
vehicles and
tolling exported:
Components,
heavy vehicles
and tolling
imported
Built up light
vehicles exported:
Built up light
vehicles imported
1999 50,5% 37.5% 100% 90% 100:75 100:100
2000 47% 35% 100% 80% 100:70 100:100
2001 43,5% 32,5% 100% 60% 100:70 100:100
2002 40% 30% 100% 50% 100:65 100:100
2003 38% 20% 94% 40% 100:60 100:100
2004 36% 28% 90% 40% 100:60 100:100
2005 34% 27% 86% 40% 100:60 100:100
2006 30% 26% 82% 40% 100:60 100:100
2007 30% 25% 78% 40% 100:60 100:100
2008 29% 24% 74% 40% 100:60 100:100
2009 28% 23% 70% 40% 100:60 100:100
2010 27% 22% 70% 40% 100:60 100:100
2011 26% 21% 70% 40% 100:60 100:100
2012 25% 20% 70% 40% 100:60 100:100
Notes: The Duty Free Allowance of 27% remained unchanged during this period.
The Productive Asset Allowance (PAA) was put in place until 2007 to be reviewed later.
Source: Adapted from Black and Barnes (2003) and NAAMSA (2005)
was extended to 2007. One significant adjustment was that while import-export
complementation provisions were extended to 2007, this was on a phasing down basis.
The qualifying value of eligible export performance was scheduled to decline from 2003
9See Republic of South Africa (1999) for further detail on the proposals.

12
12
(Table 2). This meant that while exports of components with a local content value of
R100 would allow the exporter to import R100 of components on a duty free basis in
2002, from 2003 a gradually declining value of components could be imported duty free.
There were again extensive discussions regarding the imposition of direct industrial
policy measure to rationalise the industry but these were not adopted. An important late
change introduced into this process as a result of concerted pressure on the Minister of
Trade and Industry by vehicle manufacturers who were planning major export
programmes, was the introduction of a Productive Asset Allowance (PAA). In terms of
the PAA firms making qualifying investments receive import duty credits equal to 20% of
the value of these investments, spread over five years.
A third review was held in 2002 to provide clarity on policy until 2012. The brief was to
maintain the basic architecture of the MIDP. Tariffs were set to decline to 25% and 20%
for built up vehicles and components respectively and there were other minor
adjustments.10
The objectives of the MIDP
The orthodox rationale for tariff reductions is to realign relative prices, reduce input costs
and correct anti-export bias. The expected result would be a shrinking of the sector
concerned, with benefits being felt in other sectors of the economy.
The initial objectives of the MIDP were to provide high quality affordable vehicles,
provide sustainable employment and through increased production contribute to
economic growth (Department of Trade and Industry, 1997). These, of course, are
generic objectives, which are important to all sectors. More specifically, the MIDP was
devised as a trade facilitating measure with very particular industry policy objectives. As
a result of protection, the industry structure had historically been very fragmented and
the resultant failure to achieve economies of scale not only made the assembly industry
inefficient, but imposed major negative externalities on the component sector. With the
proliferation of makes and models being produced in low volumes in South Africa,
component firms were in turn been required to produce at way below minimum efficient
scale. So an objective of the MIDP was to increase the volume and scale of production
though a greater level of specialisation in terms of both vehicle models and components.
Essentially what was required was a transition from (CKD) assembly, which has typically
been characteristic of vehicle production in protected developing country markets,
through a transition stage to full manufacturing (Table 3). CKD assembly involves
relatively light investments in spite of the fact that the need for precision welding and
10For the policy recommendations, see Barnes and Black (2003).

13
13
advanced painting processes in modern CKD plants increasingly require larger capital
outlays (Sturgeon and Florida, 1999). Under CKD assembly, production costs are
usually quite high especially if a high level of localisation is stipulated by government
policy. High local content requirements would necessarily require much higher levels of
investment and would tend to encourage rationalisation. In the CKD assembly stage,
quality is likely to be below international standards and assemblers would be likely to
introduce their own adaptations usually with the purpose of extending model life. As a
result, in many protected, emerging economy markets, models have continued in
production long after they have been phased out in advanced country markets. In South
Africa, the VW Citigolf and Toyota Tazz are examples of this.
Table 3: Stages in the development of vehicle production in South Africa
CKD assembly Transition Full manufacturing
Target market Domestic Domestic and export Domestic and export
Level of integration
with parent company
Low; import of CKD
packs
Medium High
Model line up Many models One or two One or two
Derivatives Limited to reduce
costs
Full range to supply
export market
Full range to supply
export market
Local content Generally low but may
be quite high as a
result of local content
requirement
Moderate based
primarily on cost
factors
Medium to high
Quality Below source plant Equal to source plant Equal to source plant
Production cost High Medium; penalties
incurred by high
logistics costs
Low
Domestic design Local adaptations None None - may do world
wide R&D in niche
areas
Source: Interviews
In the transition and full manufacturing stages, where exports may become substantial,
both quality standards and the number of derivatives offered need to be in line with
international practice. Volumes per model also increase in the transition stage and under
full manufacturing, would approach world scale. Because firms are exporting they would
need access to components at world prices so in spite of higher volumes in the transition
stage, local content levels may not increase. In the full manufacturing stage, much

14
14
higher volumes would normally be attained allowing vehicle makers to localise
components on an economic basis.
The main instruments of the MIDP have been falling nominal duties combined with
export assistance derived from the ability to offset import duties. While nominal duties on
imported vehicles have remained moderately high at least in the early stages of the
MIDP, the ability to rebate import duties by exporting has enabled importers to bring in
vehicles at lower effective rates of duty. Import-export complementation has also
enabled assemblers to use import credits to source components at close to international
prices, so declining nominal protection on vehicles has to some extent been offset by
reduced protection for components. This has meant that there has still been a significant
incentive to assemble locally.
The MIDP seeks to provide support for the automotive industry on a gradually declining
basis. This requires that it meet a number of objectives, including:
- some protection of assembly
- some protection for the component sector
- some export support
- investment assistance
The support mechanism is principally via rebates on import duties which can be gained
by exporting.11 The various components of the system are therefore interdependent. If
credits can be generated too ‘easily’ then import protection is effectively removed, while
if it is too difficult to earn these credits then the industry becomes more protected. The
latter outcome would lead to rising car prices and also higher vehicle production costs.
So the volume of credits being generated is a key policy issue as it affects the ‘balance’
of the programme.
5. THE IMPACT OF THE MIDP
International competition in the South African automotive industry has increased
substantially as a result of the MIDP. Vehicle manufacturers faced the prospect of the
domestic market being eroded by imports as tariffs were reduced from prohibitive levels.
The component sector, which had only just begun the transition from low volume, flexible
production faced further restructuring and consolidation.
11Since 2003 firms undertaking ‘qualifying investments could earn duty rebates but the level of
this is relatively low.

15
15
The impact of the changes was awaited with a degree of trepidation by policy makers,
the industry and unions. Clearly the outcome of this shift towards more open markets
depended not only on the level of import penetration, but also on the supply response in
terms of investment and export expansion. A survey of component firms undertaken in
1995 just before the introduction of the MIDP showed that firms were well aware of the
changes that would have to be made in response to the new programme (Black, 1995).
In spite of the fact that two thirds of firms expected competition in their product line to
increase dramatically as opposed to one third who expected the increase in competition
to be slight or negligible, firms were generally adopting a positive approach. Firms
planned to upgrade productivity by improving production efficiencies, expanding exports
and increasing investment. There was much greater emphasis on a positive supply
response (expanding exports and new investment) than on reducing employment,
curtailing operations or sourcing sub-components internationally.
The restructuring process, therefore, looked likely to be centred around efforts to
improve in-house productivity including work organisation, by attempts to expand
production volumes in a more focused range of products through exporting and to
upgrade plant and equipment including increased use of automation. It should be
recognised, however, that the industry was experiencing boom conditions at the time of
the survey with sales growing rapidly and this is likely to have influenced expectations
about the outlook for investment and employment.
The respondents also proved to be remarkably accurate in forecasting the impact of the
MIDP on exports, investment and employment. Firms anticipated a massive increase in
exports, moderate increases in investment and roughly stable employment with two
clear categories of firm emerging - those who were linked into export markets and
expected to increase employment and another group of more traditional component
suppliers who expected employment to decline.
Imports, the trade balance and automotive policy
As a result of growing component and vehicle imports, the overall automotive trade
deficit widened dramatically from under R5.1 billion in 1992 (a year of weak demand) to
R14.1 billion in 1996 before declining as a result of falling domestic vehicle production
(requiring fewer imported components) and growing exports (Figure 2). In 1999 it had
declined to only R8.0 billion as imports increased moderately while exports continued to
grow rapidly. The rand value of imports has since grown rapidly, initially as a result of the
weaker rand in 2001/2002. Since then the rand has strengthened but booming domestic
demand for imported vehicles as well as components to supply the increase in domestic
16
16
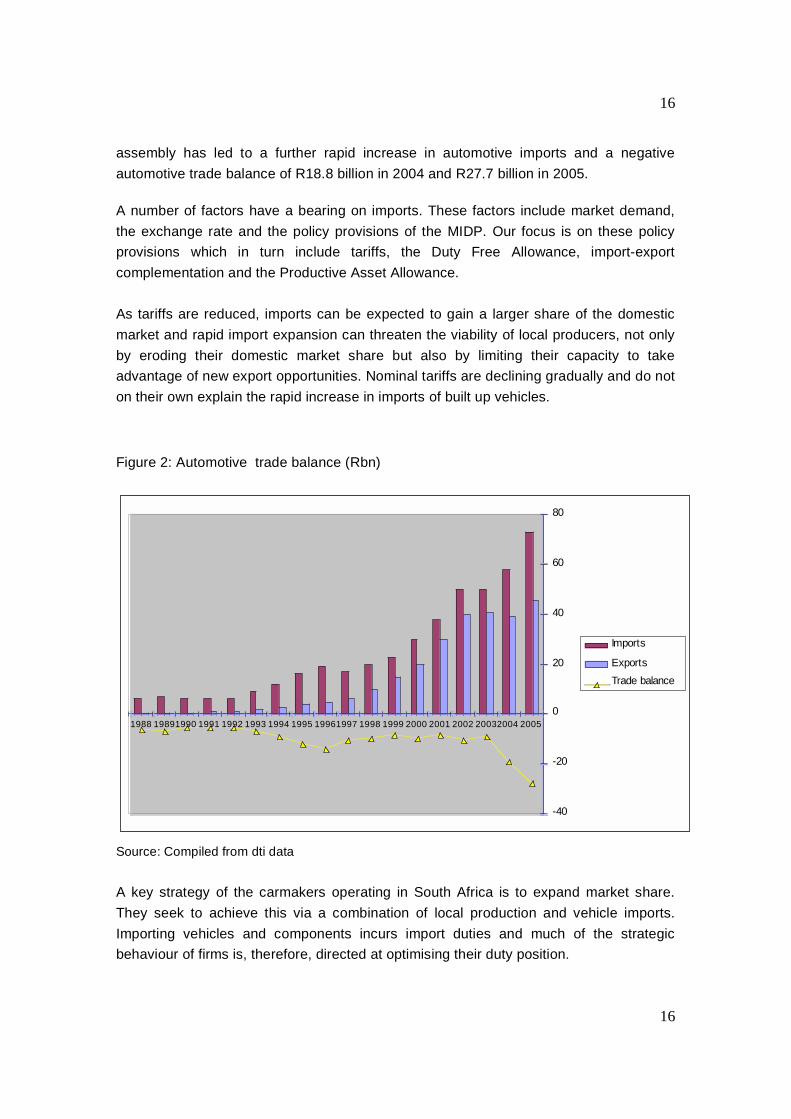
assembly has led to a further rapid increase in automotive imports and a negative
automotive trade balance of R18.8 billion in 2004 and R27.7 billion in 2005.
A number of factors have a bearing on imports. These factors include market demand,
the exchange rate and the policy provisions of the MIDP. Our focus is on these policy
provisions which in turn include tariffs, the Duty Free Allowance, import-export
complementation and the Productive Asset Allowance.
As tariffs are reduced, imports can be expected to gain a larger share of the domestic
market and rapid import expansion can threaten the viability of local producers, not only
by eroding their domestic market share but also by limiting their capacity to take
advantage of new export opportunities. Nominal tariffs are declining gradually and do not
on their own explain the rapid increase in imports of built up vehicles.
Figure 2: Automotive trade balance (Rbn)
-40
-20
0
20
40
60
80
1988 19891990 1991 1992 1993 1994 1995 19961997 1998 1999 2000 2001 2002 20032004 2005
Imports
Exports
Trade balance
Source: Compiled from dti data
A key strategy of the carmakers operating in South Africa is to expand market share.
They seek to achieve this via a combination of local production and vehicle imports.
Importing vehicles and components incurs import duties and much of the strategic
behaviour of firms is, therefore, directed at optimising their duty position.

17
17
Minimising duty payments can be achieved in a number of ways. Firstly, firms can limit
vehicle imports. Secondly, local content in domestically produced vehicles can be
adjusted. Thirdly, vehicle producers can expand exports either of vehicles or
components. As exports have increased so has the ability to import automotive products
without paying duty. Independent importers (such as Renault and Hyundai) which do not
produce vehicles in South Africa are also trying to expand market share and are also
able to offset import duties by facilitating exports into their global networks. In addition
carmakers undertaking specified investments which qualify under the Productive Asset
Allowance also receive import credits. These are currently at a low level in comparison to
the credits earned via exporting.
These considerations have had a decisive effect on the strategic choices made by
vehicle producers. The structure of the MIDP has been such that it has clearly been
easier to generate exports than to develop high local content in domestically assembled
vehicles. In the early stages of the MIDP, the strategy adopted by vehicle manufacturers
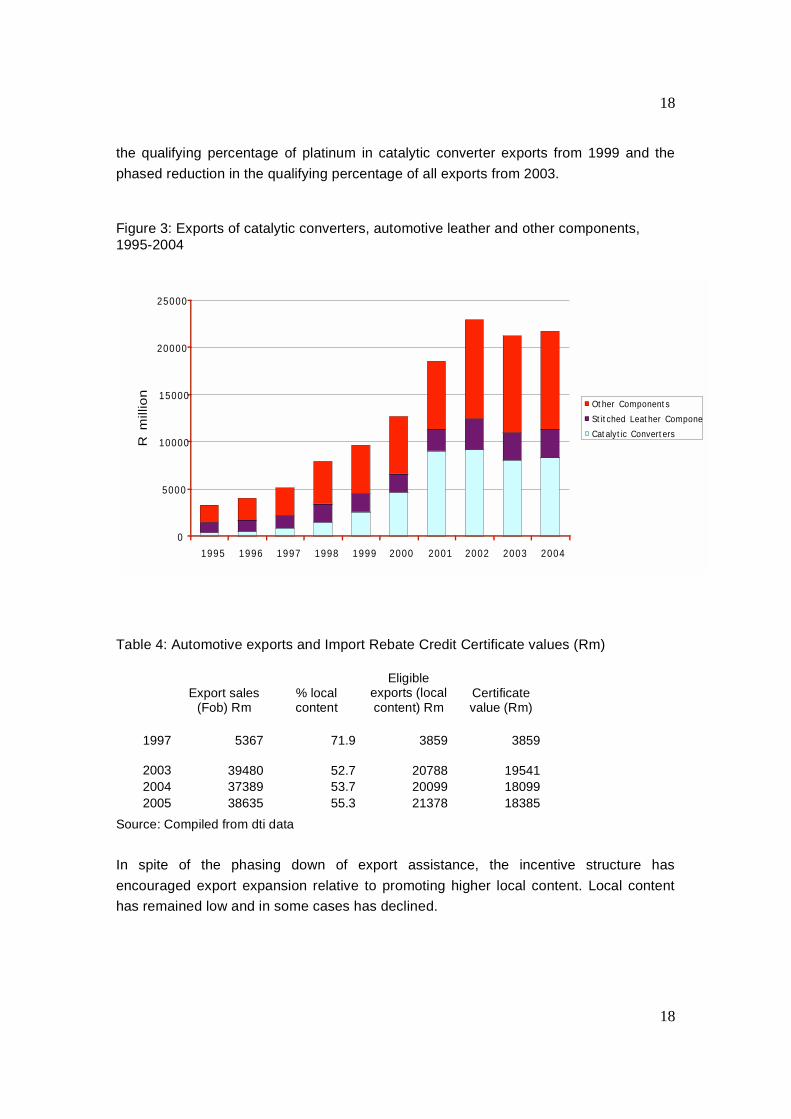
was to develop component exports. As Figure 3 indicates, component exports increased
rapidly until 2002 but a large share was taken by just two types of components,
automotive leather and catalytic converters. These types of ‘peripheral’ components
offered the opportunity of generating large export volumes with limited investment.
Global demand for catalytic converters was expanding rapidly due to environmental
legislation. Also, due to their platinum content, catalytic converters are high value
products. Automotive leather is a labour intensive and footloose industry. This kind of
strategy contributed little to the overall development of the industry because it could co-
exist with low volume CKD assembly and did not contribute to reducing the cost of
domestic vehicle production by reducing the cost of components being supplied to the
domestic industry or by bringing down assembly costs.
From the late 1990s, vehicle exports expanded rapidly. This required much greater
investment by vehicle manufacturers and assisted in raising volumes which at least
helped component suppliers to become competitive. Exports, initially of components, but
later including vehicles were therefore the main strategic choice adopted to minimise
duty payments in the face of increasing imports.
The key to understanding the impact of exports on the ability to import is the import
rebate certificate value (Table 4). Exports grew rapidly until 2002. The certificate value
has, however, grown less rapidly over the period because of lower local content in total
exports as a result of the growth in relative importance of vehicle exports which have
much lower local content than components. Additional factors are the phasing down in
18
18
the qualifying percentage of platinum in catalytic converter exports from 1999 and the
phased reduction in the qualifying percentage of all exports from 2003.
Figure 3: Exports of catalytic converters, automotive leather and other components,1995-2004
0
5000
10000
15000
20000
25000
1995 1996 1997 1998 1999 2000 2001 2002 2003 2004
Rm
illio
n
Other Components
Stitched Leather Compone
Catalytic Converters
Table 4: Automotive exports and Import Rebate Credit Certificate values (Rm)
Export sales(Fob) Rm
% localcontent
Eligibleexports (localcontent) Rm
Certificatevalue (Rm)
1997 5367 71.9 3859 3859
2003 39480 52.7 20788 19541
2004 37389 53.7 20099 18099
2005 38635 55.3 21378 18385
Source: Compiled from dti data
In spite of the phasing down of export assistance, the incentive structure has
encouraged export expansion relative to promoting higher local content. Local content
has remained low and in some cases has declined.

19
19
Vehicle imports
Until the early 1990s, prohibitive tariff levels resulted in negligible imports of vehicles into
South Africa. Vehicle prices were significantly above international levels. The opening up
of the economy and the phasing down of tariffs have led to an increased level of light
vehicle imports which increased from under 2% of the market in 1990 to 13.9%12 in 1997
and nearly 40% in 2005. Until the surge in imports during 2004-2005, increases were
roughly in line with the expectations of policymakers and as indicated in Figure 4, the
expansion in numbers of vehicles exported approximated the growth in imports.
Figure 4: Exports, imports and local production of light vehicles, 1990-2005
0
100
200
300
400
500
600
1990
1992
1994
1996
1998
2000
2002
2004
'000 v
eh
icle
s
Exports Imports Local Production
Sources: NAAMSA,dti
Domestic vehicle producers, especially those firms, which have already established
large-scale vehicle export projects, account for the major share of vehicle imports. In
interviews conducted in 2002, all assemblers were planning to expand imports of
models, which they did not produce locally. This was clearly related to plans to
rationalise production in the domestic market to a reduced number of platforms, raise
production per model and export part of the expanded output. This strategy generally
12This includes imports of semi-knocked down vehicles imported under a temporary concession.

20
20
required an export allocation by the parent company, which in turn was seeking to
expand market share (including the sale of imported models) in South Africa.
Independent importers have also significantly increased their market share since 1995.
Figure 5 shows the close relationship at the firm level between vehicle exports and
imports. In 1996 no firm exported significant numbers of vehicles and imports were
minimal. By 2001 three firms, all German based, had implemented vehicle export
strategies and were generating nearly 50% of their import rebate credit certificates from
vehicle exports This enabled them to make a greater contribution to the overall group by
raising market share in South Africa. During this period other carmakers, such as Ford
and Nissan continued to pursue multi-model strategies (in some cases with low local
content levels). They were able to do this by generating large scale exports of
components which allowed them to offset component imports. This option was not
sustainable in the medium to long term and by 2005 both Toyota and Ford had started to
implement export programmes with the other vehicle producers announcing plans as
well. High volume vehicle exports have allowed vehicle manufacturers to import
significant volumes of both vehicles and components duty free. By 2001, vehicle exports
accounted for over 30% of the Import Rebate Credit Certificates (IRCCs) being
generated, up from only 10% in 1996. This percentage has continued to increase.
Independent importers have also been able to expand offset duties on vehicle imports by
facilitating component exports into their global networks but have less capacity to do this
compared to the vehicle producers with established facilities in South Africa.
The boom in vehicle exports has been driven by the MIDP. Firms do not generally see
South Africa as an export platform and it is unlikely that, without the MIDP, exports would
have risen as dramatically as they have. Nevertheless, costs are low in some respects
and the weak currency up to 2002, low labour and management costs together with
cheap land and electricity are important competitive advantages. In 2002, actual
assembly costs for local operations such as BMW and DaimlerChrysler were well below
in-plant costs in their respective German plants.13 Where these South African operations
incur significant cost disadvantages is in the area of inbound and outbound logistics.
This is a function of high transport costs and long distances to foreign markets as well as
high levels of imported content.
13Interviews.

21
21
Figure 5: Light vehicle imports and exports by firm, 1996-2005
1996
0
5000
10000
15000
20000
25000
30000
35000
40000
Ford
Delta
/GM
Fiat/N
issa
n
Toyot
a
DCSA
BM
WVW
Imports
Exports
2001
0
5000
10000
15000
20000
25000
30000
35000
40000
Ford
Delta
/GM
Fiat/N
issa
n
Toyot
a
DCSA
BM
WVW
Imports
Exports
2005
0
5000
10000
15000
20000
25000
30000
35000
40000
Ford
Delta
/GM
Fiat/N
issa
n
Toyot
a
DCSA
BM
WVW
Imports
Exports
Source: Compiled from NAAMSA data

22
22
Components and local content
A key policy issue in the development of the automotive sector both in South Africa and
other developing countries has been the level of local content in domestically assembled
vehicles. All too frequently vehicle assembly has been characterised by low volumes
which has led to low levels of domestic content.
Measuring the volume and value of vehicle imports is simple enough but the level of
local content in the South African industry remains a major issue of debate between
government and the various industry federations.
Local content is notoriously difficult to measure. As Table 5 indicates it can be defined in
a number of ways and there are significant differences between the various measures.
Each definition is also subject to measurement difficulties and is also subject to the
vagaries of the exchange rate. For example, the ‘official’ definition of local content as
vehicle wholesale price (value of production) less import content leaves much room for
changes in vehicle prices, assembly costs and profit margins. With no change in the
actual sourcing of components, higher prices and profits would mean a ‘higher’ level of
local content. In fact this is what has happened recently in South Africa. The widely
used local content measure based on wholesale price (value of production) has ranged
between 50% and 60% and shows a slight upward trend (Table 5). But this reflects a
stronger rand from 2002 to 2005 as well as rising assembly industry profitability. The
latter dimension is reflected in the assembly contribution and hence higher ‘local
content’. The data based on other definitions show a stable or declining position which
may in fact indicate that ‘actual local content’ based on the number of domestically
produced parts incorporated in locally assembled vehicles is declining.
What is also evident is the low level of local content (between 32% and 26%) in total
component purchases. As a percentage of vehicle revenue this dropped to as low as
16% in 2004, a year in which both the rand and assembly industry profitability were
strong.
Explaining changes in local content
The introduction of a series of local content programmes from 1961 led to increased
levels of local content in South African assembled vehicles. With the introduction of
Phase VI, the component sector came under increasing pressure from imports. This
continued under the MIDP with annual price increases significantly below inflation levels
especially in the early stages.

23
23
Table 5: The level of local content according to various definitions
Local content measure 1996 1997 1998 1999 2000 2001 2002 2003 2004 2005
A. Component purchases byOEMs 39 38 40 43 34 35 38 40 na na
B. Component purchases less allimports na na na na 32 27 27 26 27 31
C..Component purchases less allimports as % of revenue na na na na 21 19 20 16 16 20
D. Average value of productionless average forex 56 58 56 52 51 52 50 56 60 59
E. LC in exported passenger cars na 50 49 na na na na 35 36 37
F. LC in exported light commercialvehicles na 51 50 na na na na 39 36 35
G. LC in exported MCVs na 45 50 na na na na 42 39 39
Notes: A. Local component purchases by vehicle producers based on survey data
B. Local component purchases less all import content as percentage of all component
purchases.
C. Local component purchases less all import content as % of vehicle revenue.
D. Average value of production less average forex (from OEM aggregate data)
E, F, G. Fob export value less forex
Sources: IRCC data, MIDP Customs Account and survey data supplied by Department of Trade
and Industry NAAMSA and NAACAM.
Under the MIDP, protection of the component sector has been reduced. Local content
requirements were abolished and duties have continued to decline, albeit gradually.
Conventional trade theory would predict a decline in local content. Apart from declining
protection there are a number of further considerations. One of the objectives of policy
has been to increase model volumes. These are now increasing, so it would be
important to assess whether this is leading to a higher level of local content. Changes in
local content usually take place when new models are introduced and it would be
important, therefore, to be able to measure whether new models have significantly lower
levels of local content than the vehicles they are replacing. There has also been
significant foreign investment by first tier suppliers and a further question is whether
these firms are mainly engaged in assembly of imported parts or draw on the domestic
supply base.
It is clear that there has been some decline in local content but this has not been
dramatic. Of major concern in the first few years following the introduction of the MIDP

24
24
was the tendency to introduce new models with low local content levels. As Table 6
indicates, the local content level in some new models introduced was very low especially
as the measurement of local content in this table includes assembly and profit margins
apart from actual local content.14 On this measure, a local content level of under 40% is
very low in terms of actual local components and translates into less than 30% of
components fitted being locally sourced. These would comprise mainly peripheral
components such as wheels, exhausts, certain trim components and body panels,
batteries and glass.
Table 6: Local content level of new models introduced from September 1995 to 1998.
New model Local content (%)
A 61
B 60
C 58
D 51
E 41
F 39
G 37
Average (new models -
unweighted)
49.6
Weighted average for the industry 57.5
Note: Local content measured by ex works price less foreign content.
Source: Department of Trade and Industry, unpublished data.
Given the fundamental objective of the MIDP, government was anxious to see higher
levels of localisation. In the course of interviews conducted in 2002, assemblers voiced
their concerns regarding the domestic components industry. They argued that in many
cases it did not have the required technology to supply components for the advanced
vehicles being exported. A particular problem related to the fact that insufficient
investment had occurred to upgrade the technology in this sector. To deal with this
constraint would require large-scale investment, including a substantial expansion in
foreign investment.
The key problem in persuading both local and foreign firms to undertake such
investments remained the problem of low domestic production volumes. Even the
14Some caution should be exercised in the interpretation of the data. The data on new model
local content levels) are not weighted according to volume. Lower local content models wouldtend to be lower volume vehicles.

25
25
highest model volume produced in South Africa at this time (40-50,000 units) was
insufficient to justify local content levels significantly above the low existing levels.
Volumes of at least 100,000 units per annum were necessary to justify the investments
required to achieve a high level of local content on an economic basis.
Achieving higher levels of local content is not easy. Given the very large investments
involved, volumes of 40,000-50,000 units per annum do not justify the investments
required to raise local content much above a level of approximately 60 percent.15 One
solution would be for component firms which supply domestic carmakers to achieve
minimum efficient scale by exporting, say, half of their output. The presence in South
Africa of the three major German car firms, all with significant vehicle export activities,
should be attractive to German component firms. Indeed, the German based carmakers
have co-operated to attract investments by first tier suppliers. To some extent they have
been successful but real constraints remain. As an integral part of the global production
capacity of the parent companies, SA based assemblers would normally be expected to
use exactly the same supplier as the parent company, a practice known as lead
sourcing. These suppliers may be different for VW, BMW and DaimlerChrysler.
Increasing output by supplementing production in order to reduce unit costs is
constrained by the fact that this might make inroads into the established capacity of
existing foreign suppliers.
Part of the trend indicated above reflects changes in the level of local content of
components themselves. While there has been investment, mainly by foreign firms or
joint ventures in high technology, first tier components to supply new, large volume
vehicle projects, in many instances these firms operate as just-in-time sub-assemblers of
imported components using technologically advanced assembly jigs and testing
equipment. They are not, however, responsible for any materials conversion processes
and as such cannot be considered true manufacturers. The advanced materials
conversion (and the associated tooling and technology investment) takes place outside
of South Africa and local content and local value adding, even on large-scale vehicle
export projects, has remained low (Barnes and Black, 2003). The latter characteristic
was clearly borne out in the course of interviews with vehicle producers conducted in
2002 (Barnes and Black, 2003). It is further supported by recent data drawn from the 70
firms which belong to the South African Automotive Benchmarking Club which shows
striking differences in the purchasing patterns of local and foreign owned component
firms (Figure 6).
15The definition of local content is problematic. Here we are using a broad definition of wholesale
value less forex. This therefore includes local assembly. Under narrower definitions (excludingassembly) the local content value would clearly be significantly lower.

26
26
Figure 6: Local content in components produced by multinational and South Africancomponent firms
Source: Derived from data supplied by B&MAnalysts
The reliance on foreign inputs partly reflects the assembly or ‘system integrator’
character of many foreign owned supplier operations and is in part a global trend. This
lack of embeddedness may partly result from the limited time that they have been
operating in South Africa. But it also reflects the fact that vehicles are being produced in
volumes of 50,000 units per annum or less which does not justify heavy investment in
component production. This is further demonstrated by the fact that exporters have
much higher levels of local content than suppliers to the domestic market. Exports are
mainly of less complex components and tend to be in high volumes with concomitant
high levels of local content.
An interesting development noted by certain vehicle producers and also by a number of
component producers, was that some suppliers had become reluctant to supply
assemblers even where volumes were fairly large. This was seen to be because of
demanding price and quality certification requirements on the one hand and the fact that
some component suppliers had access to more lucrative opportunities in international
markets, especially the less technologically demanding and price sensitive aftermarket.16
16Interviews.
0.00
10.00
20.00
30.00
40.00
50.00
60.00
70.00
80.00
90.00
100.00
2000 2001 2002 2003 2004 2005
Lo
cal C
on
ten
t (%
): w
eig
hte
d
MNC
SA

27
27
Figure 7: Local content in components according to supplier firm market focus:Exporters vs non-exporters
Source: Derived from data supplied by B&MAnalysts
6. CONCLUSIONS: THE IMPLICATIONS FOR POLICY
The automotive industry is widely regarded as a major success story of post 1994 South
Africa. This is mainly on account of the well documented expansion in exports. Since
the introduction of the MIDP in 1995, rapidly increasing volumes of components, and
more recently of vehicles, have been supplied mainly to first world markets. Although
export expansion has been accompanied by greater efficiencies and a more rational
industry structure, key vulnerabilities remain.17
This paper has focused on the equally rapid rise in imports, which have risen particularly
sharply in recent years in line with the boom in domestic sales. But the behaviour of
firms is revealing about their long term strategy. The investment in export capability has
to a large extent been driven by the desire to earn import rebate credits. Firms have
been exporting in order to import. This is an important conclusion because it provides
pointers as to how firms would respond to a more open trade environment and must be
of concern to policy makers. If the real target is the domestic market, where does this
leave the industry when assistance is phased down still further? This is where critics of
industrial policy may argue that what policy has done is to simply create an
17See, for example, Black (2003)
0
10
20
30
40
50
60
70
80
90
100
2000 2001 2002 2003 2004 2005
Lo
cal C
on
ten
t (%
): w
eig
hte
d
Non -exporter
Exporter

28
28
unsustainable export edifice in the same way that the import substitution phase created
an inefficient inward looking industry. While it is undoubtedly true that the automotive
industry has been subject to excessive government support, firstly high protection and
then overly generous export support, the counter to this is that the structure of the
industry is much sounder than it was. Investments have taken place in reasonably high
volume production and achieved significant economies of scale. The industry is
operating under a far less protective regime than was previously the case. Although
nominal tariffs remain quite significant, the ability to rebate import duties effectively
reduces protection. With the sharp decline in export support since 1995, the incentive
structure is also tending towards a more neutral stance.
With quite high rates of growth in vehicle sales likely to be sustained as vehicle
ownership increases, automotive imports are likely to loom large as a major policy issue.
Already in 2005, vehicle imports accounted for nearly 40% of the market in unit terms
and given the large number of luxury vehicles being imported, the proportion is higher in
value terms. It is also significantly higher than expected at the time of the 2003 Review.
While the strong rand, boom in domestic sales and related capacity constraints have
contributed to growing imports, policy makers will be looking at the policy parameters of
the MIDP itself to assess whether the pace of liberalization is appropriate.
The hoped for increases in local content have not fully materialised because the bulk of
the industry is still stuck in a ‘transition phase’ (see Table 3) and, with the possible
exception of Toyota, is not yet advancing to full manufacturing with sufficient volume to
justify high local content levels. Tariffs are continuing to decline but as we have
indicated above, it is the ability to rebate import duties which has had the major
liberalizing impact. With export growth leveling off, the result has been a huge increase
in the trade deficit in the sector to a record R27 billion in 2005.
Two questions then emerge. The first is whether the growth path of the past ten years
can be maintained. If we take this to mean an export led growth path, then the answer is
probably not. The export base is now very large and growth has already slowed.
Expansion could continue but at a much slower pace than the exponential expansion
which has occurred since 1995.
The second question is whether automotive policy should proceed to fully liberalize the
domestic market. The reality is that as we indicated earlier, South Africa is not part of a
viable ‘automotive space’. But there are good reasons to believe that it could become
one. The domestic market could easily reach one million units by 2015. Assuming that
economic recovery continues in SADC, the combined region will begin to constitute a

29
29
significant regional market. The conclusion therefore is that further substantive
liberalisation now would be premature.
So from a strategic point of view where does this leave the industry and automotive
policy? The industry has been through a period of heavy protection and then of large
scale export support and export expansion. The incentive regime still favours exports but
to a much lesser extent and protection is effectively quite low which has led to rapid
import growth. It is now time for the industry to move to a more balanced growth path on
the basis of policy which imposes a more neutral incentive structure. This would involve
a gradual move to rates of protection and assistance for production which are set at low
to moderate levels. Under such a scenario, both the domestic market and exports could
provide the basis for sustained future growth.
REFERENCES
Barnes J and Kaplinsky, R (2000) Globalisation and trade policy reform : Whither the
automobile components sector in South Africa Competition and Change, Vol 4 pp
211-243.
Barnes, J. and A. Black (2003) Motor Industry Development Programme: Review Report,
Department of Trade and Industry.
Barnes, J., Kaplinsky, R and M Morris (2004) Industrial policy in developing economies:
Developing dynamic comparative advantage in the South African automobile
sector, Competition and Change. Vol. 8, No 2,pp. 153-172.
Black A (1995) Reducing protection in the motor industry: Likely impact on the
component sector, Trade Monitor, Volume 11, December.
Black, A (2001) Globalisation and restructuring in the South African automotive industry,
Journal of International Development, 13, 779-796.
Black, A (2003) The export ‘success’ of the Motor Industry Development Programme and
the implications for trade and industry policy, Working Paper 13, Trade and
Industrial Policy Strategies, Johannesburg.
Black A and S Muradzikwa (2004) The limits to regionalism: The automotive industry in
the Southern African Development Community. In Carrillo J, Lung Y and R van
Tulder (2004) Cars, carriers of regionalism? Hampshire, Palgrave Macmillan
Board of Trade and Industry. 1988. Investigation into the Industry Manufacturing
Passenger Cars and Light Commercial Vehicles, Report No. 2627. Pretoria,
Government Printer.
Board of Trade and Industry. 1989. Investigation into a Structural Adjustment
Programme for the Industries Manufacturing Motor Vehicles and Automotive

30
30
Components: Phase VI of the Local Content Programme, Report No. 2767.
Pretoria, Government Printer.
Board on Tariffs and Trade (1995), Proposal for a Revised Phase VI Motor Industry
Development Programme, Pretoria, Board on Tariffs and Trade.
Department of Trade and Industry (2004) Current Developments in the Automotive
Industry, Pretoria, Department of Trade and Industry.
Duncan, D. (1997) We are motor men, Scotland, Whittles Publishing.
Humphrey and Oeter (2000) Motor industry policies in emerging markets: Globalisation
and the promotion of domestic industry. In Humphrey, Lecler and Salerno (eds)
Global strategies and local realities: The auto industry in emerging markets,
London, MacMillan.
Kahn, SB (1987) Import penetration and import demands in the South African economy,
South African Journal of Economics, Vol. 55, No. 33, pp 238-248.
Laplane M and Sarti F (2004) Mercosur: Interaction between governments and
producers and the sustainability of the regional automotive industry. In Carrillo J,
Lung Y and R van Tulder (2004) Cars, carriers of regionalism? Hampshire,
Palgrave Macmillan.
Lung Y (2000) Is the rise of emerging countries as automobile producers an irreversible
phenomenon? In Humphrey, J, Lecler, Y and MS Salerno (eds) Global strategies
and local realities: the auto industry in emerging markets. London, MacMillan.
Shimokawa, K (2004) ASEAN: Developing division of labour in a developing region. In
Carrillo J, Lung Y and R van Tulder (eds.) Cars, carriers of regionalism?
Hampshire, Palgrave Macmillan.
Society of Motor Manufacturers and Traders. (2005). World Automotive Statistics, 2005.
London, SMMT.
South African Automotive Benchmarking Club (2006) Does ownership matter in the SA
auto components industry: SA versus MNC-owned firm performance levels,
South African Benchmarking Club Newsletter, Vol. 9, No. 2.
Sturgeon, T. and Florida, R. (1999) The world that changed the machine: Globalization
and jobs in the automotive industry, Final report to the Alfred P Sloan
Foundation, International Motor Vehicle Program, MIT.

31
31
Appendix 1: Summary of Automotive Trade (R million)
Source: NAACAM, unpublished data
1996 1997 1998 1999 2000 2001 2002 2003 2004 2005
Imports (R millions)
Vehicles 2,800 2,646 3,733 3,957 7,431 10,014 13,657 14,388 20,188 28,306
CKD 9,954 8,894 9,415 11,917 15,008 18,413 24,786 24,325 26,111 30,626
Parts 5,283 5,388 5,975 5,653 6,641 8,473 11,755 10,713 11,855 14,369
Total Imports 18,036 16,928 19,123 21,526 29,080 36,900 50,198 49,426 58,154 73,301
Exports (R 000's)
Vehicles 1,429 2,067 2,482 6,254 8,909 14,163 18,198 18,951 19,301 22,846
Parts 4,146 5,171 7,369 9,394 12,254 17,621 21,863 20,122 21,245 22,709
Total Exports 5,575 7,238 9,851 15,648 21,163 31,784 40,061 39,072 40,546 45,555
Trade Surplus/ (Deficit)
(Rmillions) Vehicles (1,371) (579) (1,251) 2,297 1,477 4,149 4,541 4,562 (887) (5,460)
CKD/Parts (11,091) (9,111) (8,021) (8,175) (9,394) (9,265) (14,678) (14,916) (16,721) (22,286)
Total (12,461) (9,690) (9,272) (5,878) (7,917) (5,116) (10,137) (10,354) (17,608) (27,746)
32
32
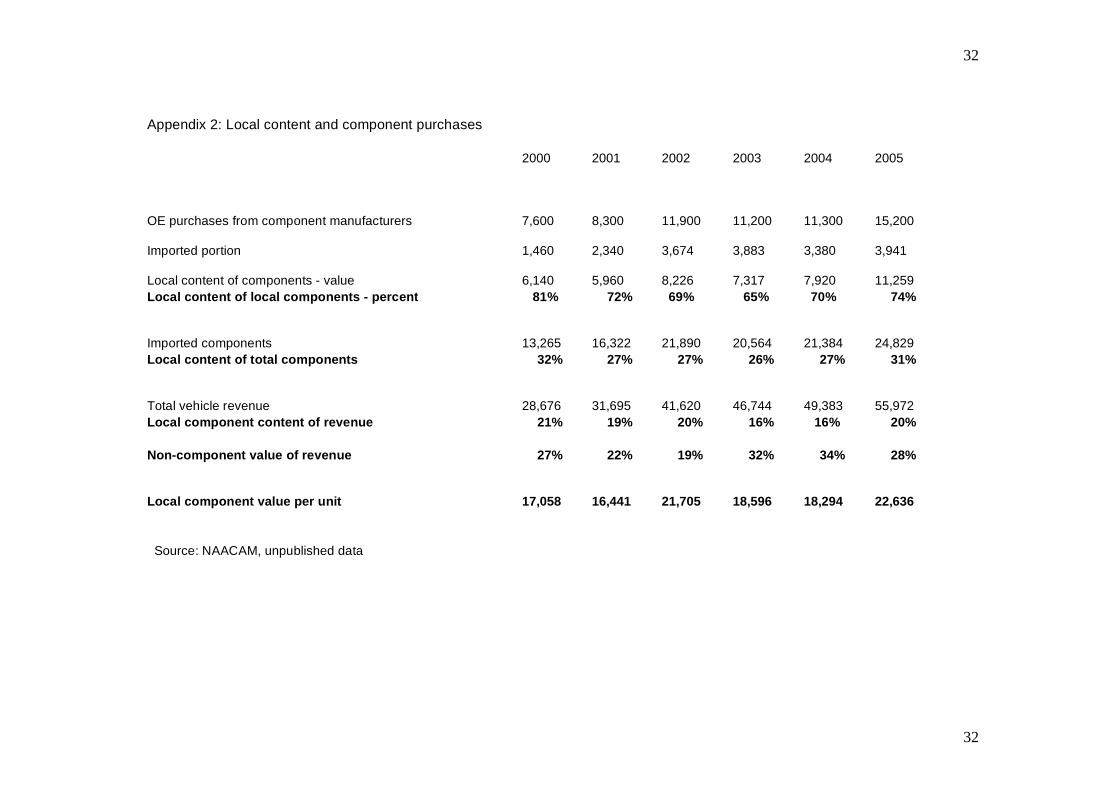
Appendix 2: Local content and component purchases
2000 2001 2002 2003 2004 2005
OE purchases from component manufacturers 7,600 8,300 11,900 11,200 11,300 15,200
Imported portion 1,460 2,340 3,674 3,883 3,380 3,941
Local content of components - value 6,140 5,960 8,226 7,317 7,920 11,259
Local content of local components - percent 81% 72% 69% 65% 70% 74%
Imported components 13,265 16,322 21,890 20,564 21,384 24,829
Local content of total components 32% 27% 27% 26% 27% 31%
Total vehicle revenue 28,676 31,695 41,620 46,744 49,383 55,972
Local component content of revenue 21% 19% 20% 16% 16% 20%
Non-component value of revenue 27% 22% 19% 32% 34% 28%
Local component value per unit 17,058 16,441 21,705 18,596 18,294 22,636
Source: NAACAM, unpublished data