globalization and the automotive industry: is indonesia ... · 1 globalization and the automotive...
TRANSCRIPT
1
Globalization and the Automotive Industry:
Is Indonesia missing out?
Abstract
International trade in automotive and auto parts has grown rapidly during the last two decades but
Southeast Asia largest economy, Indonesia, is lagging behind in its export performance. This paper uses
comparative perspective in examining Indonesia's role in automotive production networks in the context of
the contemporary debate on opportunities for reaping gains from economic globalization through
engagement in global production sharing. Panel data regression on all countries for period 1988-2007 is
applied to analyse factors affecting a country’s participation in global production networks. The regression
result suggests that a country's ability to gain from global production sharing depends more on the service
link factors than production cost factors. Indonesia is indeed left behind in export side but not on the
import side of the global production network. The major factors which affect Indonesian condition are the
costly business practice and low quality of institutions and legal certainty which discourage foreign
investor
Keywords: automotive, auto parts, globalization, product fragmentation, global production networks,
Indonesia, Thailand.
Moekti P. Soejachmoen
PhD Candidate
Arndt-Corden Department of Economics
Crawford School of Economics and Government
Australian National University
9 June 2011

2
I. Introduction
International trade in automotive and auto parts is growing rapidly in the last two decades where
the growth of automotive production reached the highest annual growth during the period 1989-
2000 with almost 5% growth per annum. There is a shift in a global production pattern from the
North America and European countries dominance in 1960 to Japanese dominance in 1970s and
1980s. And for the last twenty years some developing countries increased their production shares in
global market.
The participation of developing countries in automotive industry was made possible by the
technology development and innovations in telecommunication and transportation, which enable
automotive industry to fragment the production process into smaller segments in which
components of productions or assemblies can be relocated to different places based on cost
advantages. The relocation of segmented production process creates global production networks.
However Indonesia as the largest economy in Southeast Asian seems to miss out the opportunity to
reap gains from the globalization in the automotive industry.
This paper examines from a comparative perspective Indonesia's role in automotive production
networks in the context of the contemporary debate on opportunities for reaping gains from
economic globalization through engagement in global production network. Automotive industry is
considered as vital ingredients in national economic development strategies therefore government
involvement in automotive industry is quite intense. Therefore it is necessary to evaluate the role of
government policies in Indonesia on the development of the industry. Analysis on the dynamics of
Indonesian automotive industry is important to ascertain the impacts of government regulation on
the industry and determine Indonesian position in the global automotive industry.
A pooled panel data regression is undertaken to determine the factor affecting countries'
participation in production network in the automotive industry which has become increasingly
globalized over the past two decades. The regression result suggests that a country's ability to gain
from global production sharing depends crucially on labour cost as well as the quality of institutions
and legal certainty. Trade facilitation, procedures to start a new business and certainty in enforcing
the contract affect the participation more than production cost and market size factors. On the
import side, real exchange rate (RER), tariff and market size are the determinants of the
participation in the global production networks. A comparison with Thailand, which has became a
major hub of automotive production for the regional and global markets, suggests that Indonesia is
missing out because most of these preconditions were not present in the Indonesian economy.
This paper is structured as follows: Section 2 discusses the globalization in the automotive industry
started with the overview then further discusses the development of global production network in
the automotive industry. Section 3 discusses the product fragmentation theory as a basic theory in

3
explaining the global production networks. Section 4 describes Indonesian automotive industry and
its position on global automotive production and trade. Section 5 presents the analytical framework
which includes model specification, variable constructions and data, and estimation method. Section
6 reports the result and discussion. Section 7 concludes.
II. Globalization in Automotive Industry
The automotive industry is one of the biggest in the world and employs more than eight million
people making the vehicles directly, and more than forty million people indirectly through related
manufacture and services sectors (OICA, 2007). In principle, the automotive industry is an assembly
industry, where more than a thousand parts and components are produced by independent
industries. Dicken (2003) categorized the major processes in the automotive industry prior to the
final assembly process into the manufacture of bodies, of components and of engines (as shown in
Figure 1).
Figure 1:
The automotive industry has experienced a transformation from its inception in the late 19th
century, when France and Germany were the largest automotive producers but with small domestic
markets (Simarmata, 2007). The first transformation began at the beginning of the 20th century
with the introduction of Fordist mass production in the US. Fordist mass production is a moving
MAJOR
SUPPLYING
INDUSTRIES
Bodies
Components
1. Manufacture of mechanical and electrical
components (e.g. Instruments, carburettors,
braking systems, steering components, etc)
2. Manufacture of wheels, tyres, seats,
windscreens, exhaust systems, etc.
Engines and transmissions
Consumer
Market
Final
Assembly
Manufacture
and stamping of
body panels
Body
assembly
and painting
Forging and
casting of
engine and
transmissions
components
Machining
and assembly
of engines
and
transmission
Steel and other
metals
Rubber
Electronics
Plastic
Glass
Textiles
Source: Dicken, 2003

4
assembly line developed by Henry Ford in 1913. During the 1920s the US car production contributed
84% of world car production and in 1929 it started to export 10% of its production, which
accounted for 35% of the world market. The expansion of the US production urged the European
governments to protect their domestic car producers and promote their national automotive
industries.
The second transformation occurred at the end of 1950s with the implementation of the General
Agreement of Tariff and Trade (GATT). The significant reduction in tariffs integrated the markets
and enabled the European automotive producers to expand their markets with their specialization
on small cars which were energy-efficient. At the beginning of the 1980s the US’s domination of the
world’s automotive producers started to decline, while European production increased.
The third transformation occurred in the 1970s when Japan started to penetrate the world market
with their new lean production system. This new system enabled Japan to produce automotive more
efficiently compared to the US and Europe, with far fewer employees and a “just-in-time” system
compared to the “just-in-case” system operating in the US. The expansion of the Japanese automotive
industry threatened domestic production in the US and Europe and urged the US and European
governments to apply interventionist policies such as import quotas, tariffs and Voluntary Export
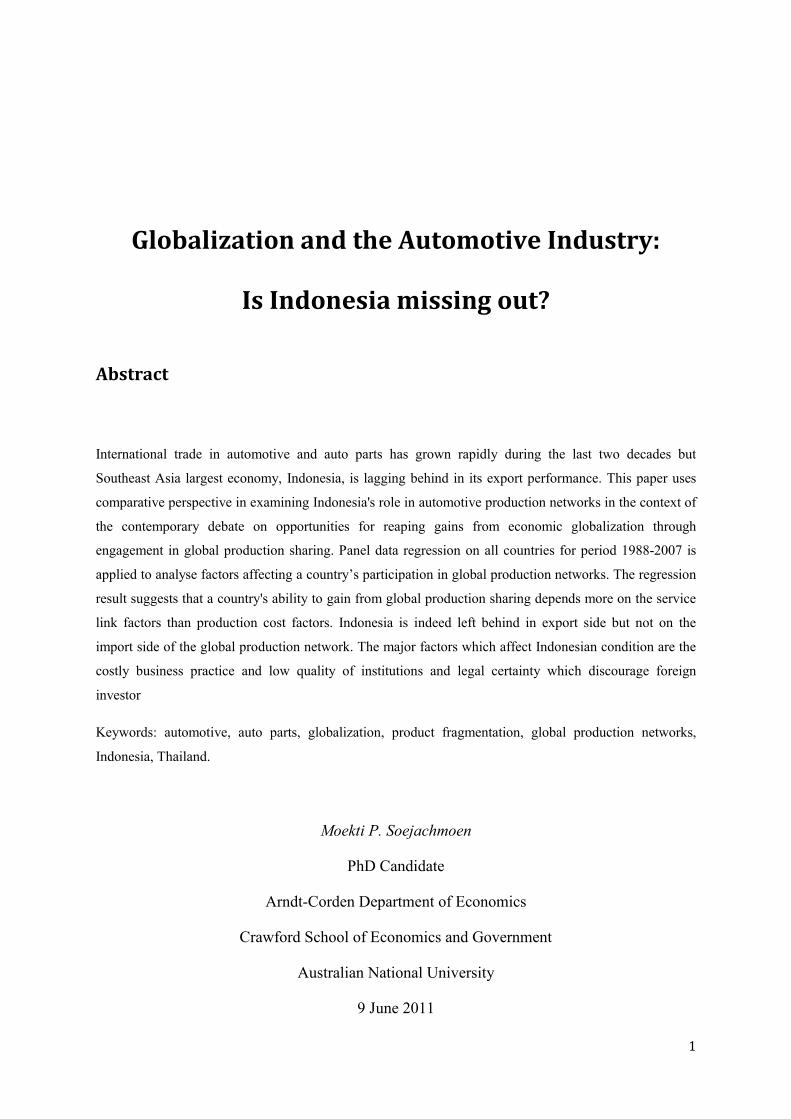
Restriction (VER). The differences between craft production, Fordist mass production and Japanese
lean production is summarized in Table 1.
Since 2000 China became one of the major car producers in the world and since 2008 it replaced
Japan’s position as the second largest car producer. India also shown significant growth in their car
production and its share in the global car production increased significantly from 1.5% in early 2000
to almost 5% in 2010.
Along with the continuous transformation, global automotive production experienced a change of
pattern as shown in Table 2. Global production of automobiles was dominated by North America and
European countries in 1960. North America contributed more than 50% of automotive production
while European countries shared almost 40% of global production or around 13 thousand units. The
US and Germany were the two main producers of automobiles during that period. During the 1970s
and 1980s Japan showed a dramatic development in the automotive production with an almost 55
fold increase in production and experienced 15% annual growth which increased its share of global
production increased from only 1.3% in 1960 to 28% in 1989. In the late 1990s, China started to
enter global automotive production with relatively high level of production at more than 2 million
units. This lowered the dominance of Germany, the US and Japan. The automotive production
reached its highest annual growth during the period 1989-2000, with almost 5% growth per annum.
However, in 2000, Canada, South Korea and Malaysia experienced higher growth compared to other
countries. This reflects the spread of technology from the US and Japan to surrounding countries.
5
Table 1: Comparison among Craft Production, Fordist Mass Production and Japanese Lean Production
Characteristics Craft Production Fordist Mass Production Japanese Lean Production
Technology Simple, but flexible tools and
equipment using un-standardized
components
Complex, but rigid single-purpose
machinery using standardized component.
Heavy time and cost penalties involved in
switching to new products
Highly flexible methods of production
using modular component systems.
Relatively easy to switch to new
products
Labour Force Highly skilled workers in most
aspects of professional production
Very narrowly skilled workers design
products but production itself performed by
unskilled/ semi skilled “interchangeable”
workers. Each performs a very simple task
repetitively and in a predefined time and
sequence
Multi-skilled, polyvalent workers
operate in teams. Responsibilities
include several manufacturing
operations plus responsibility for
simple maintenance and repair
Supplier relationships Very close contract between
customer and supplier. Most
suppliers located within a single city.
Distant relationship with suppliers, both
functionally and geographically. Large
inventories held at assembly plant ‘just in
case’ of disruption of supply
Very close relationship with a
functionally tiered system of
suppliers. Use a ‘just in time’ delivery
systems encourages geographical
proximity between customers and
suppliers
Production volume Relatively slow Extremely high Extremely high
Product variety Extremely wide – each product
customized to specific requirements
A narrow range of standardized designs
with only minor product modifications
Increasingly wide range of
differentiated products
Source: Dicken (2003), table 4.2

6
Table 2: Car production by country, 1960 - 2010
Production
(000 units)
World share
(%)
Production
(000 units)
World share
(%)
Production
(000 units)
World share
(%)
Production
(000 units)
World share
(%)
Production
(000 units)
World share
(%)
EU 5,092 39.17 13,267 37.42 15,761 27.00 15,587 24.17 12,990 16.74
France 1,175 9.04 3,409 9.62 3,348 5.74 3,666 5.68 2,228 2.87
Germany 1,817 13.98 4,564 12.87 5,527 9.47 5,570 8.64 5,906 7.61
Italy 596 4.58 1,972 5.56 1,738 2.98 1,142 1.77 857 1.10
Spain 43 0.33 1,639 4.62 3,033 5.20 3,012 4.67 2,388 3.08
Sweden 108 0.83 384 1.08 301 0.52 340 0.53 217 0.28
UK 1,353 10.41 1,299 3.66 1,814 3.11 1,857 2.88 1,393 1.80
North America 6,998 53.83 7,807 22.02 15,761 27.00 14,701 22.79 9,832 12.67
Canada 323 2.48 984 2.78 2,962 5.07 2,712 4.20 2,071 2.67
USA 6,675 51.35 6,823 19.24 12,800 21.93 11,989 18.59 7,761 10.00
Asia 165 1.27 10,018 28.26 17,113 29.32 22,535 34.94 38,616 49.76
China .. .. .. .. 2,069 3.54 5,234 8.12 18,265 23.53
India .. .. .. .. 801 1.37 1,511 2.34 3,537 4.56
Indonesia .. .. .. .. 293 0.50 408 0.63 705 0.91
Japan 165 1.27 9,052 25.53 10,141 17.37 10,512 16.30 9,626 12.40
Malaysia .. .. 94 0.27 283 0.48 472 0.73 568 0.73
South Korea .. .. 872 2.46 3,115 5.34 3,469 5.38 4,272 5.50
Thailand .. .. .. .. 412 0.71 928 1.44 1,645 2.12
South America 96 0.74 1,282 3.62 3,957 6.78 4,155 6.44 6,710 8.65
Argentina 30 0.23 112 0.32 340 0.58 260 0.40 717 0.92
Brazil 38 0.29 731 2.06 1,682 2.88 2,317 3.59 3,648 4.70
Mexico 28 0.22 439 1.24 1,936 3.32 1,577 2.45 2,345 3.02
Total 12,999 100.00 35,455 100.00 58,374 100.00 64,496 100.00 77,610 100.00
Notes: .. : data not available
Source: 1960 and 1989 data: Dicken (2003)
2000, 2005 and 2010 data: International Organization of Motor Vehicle Manufacturers
2010
Country
1960 1989 2000 2005

7
An important characteristic of the auto parts is that there are few fully generic parts and
components which can be used in a wide variety of final products without extensive customization
such as in the electronics industry. This characteristic limits auto parts firms in reaching economies
of scale in production and economies of scope in design. The relationship between auto parts
suppliers and car assemblers are typically captive and relational. Many components are relatively
heavy compares to electronics industry therefore relocation to close proximity is preferable to a
more distant location. This condition leads to agglomeration in the automotive industry.
Sturgeon et al (2008) argue that the dispersion of the automotive industry has a nested geographical
and organizational structure. Global integration occurred through buyer-supplier relationships,
especially between car makers and their largest suppliers. Production tends to organize regionally
or nationally, where parts and components which are bulky and heavy tend to locate in close
proximity with the assembler to ensure on-time delivery and to save transportation costs.
Meanwhile smaller, lighter and standardized parts and components can be located at a distance to
take advantage of lower labour cost and economies of scale. Vehicle development is concentrated in
a few design centres. As a result, local, national and regional production networks in automotive
industry are nested within the global organization and structures of the largest car maker firms.
There are three large regional clusters in the automotive industry: Europe, North America and Asia.
Within a region there is a tendency to shift investment locations to lower operating cost countries,
such as Mexico in North America, Spain and Eastern Europe in the European region and to Thailand
and China is Asia. Auto parts are more heavily traded within a region compared to the finished
goods. Within a country, production and employment are concentrated in a location which provides
better infrastructure and which in turn lowers the service link costs.
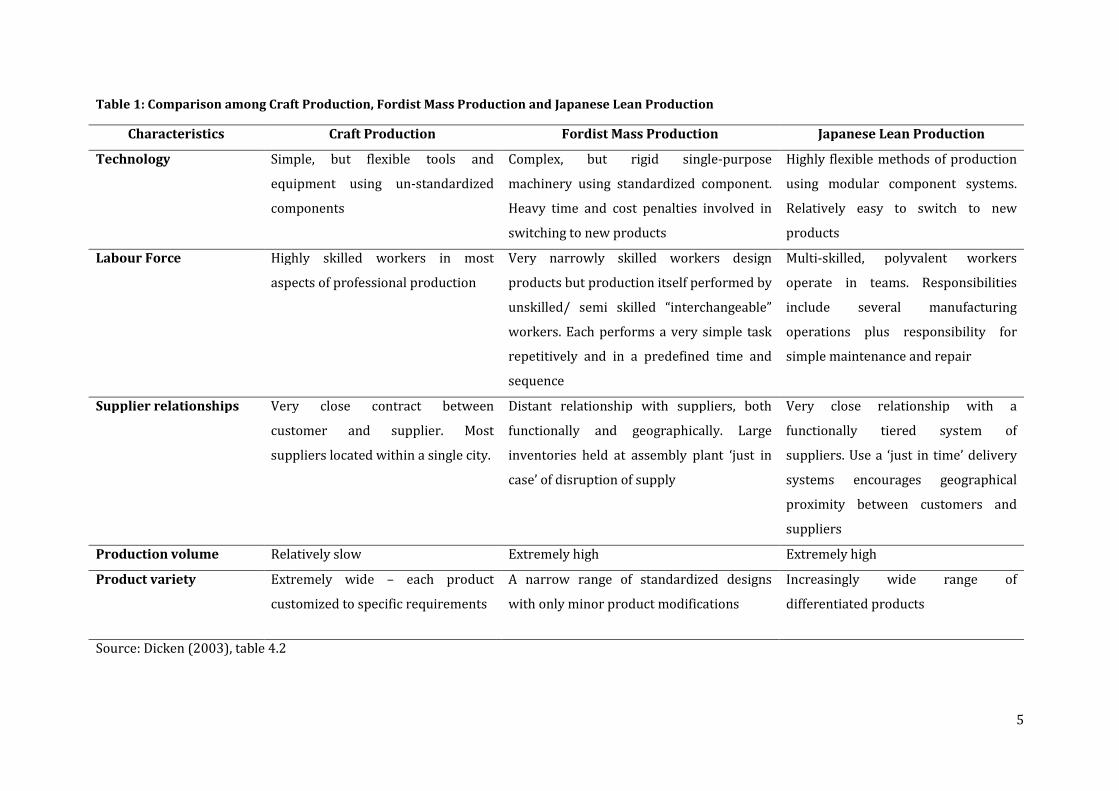
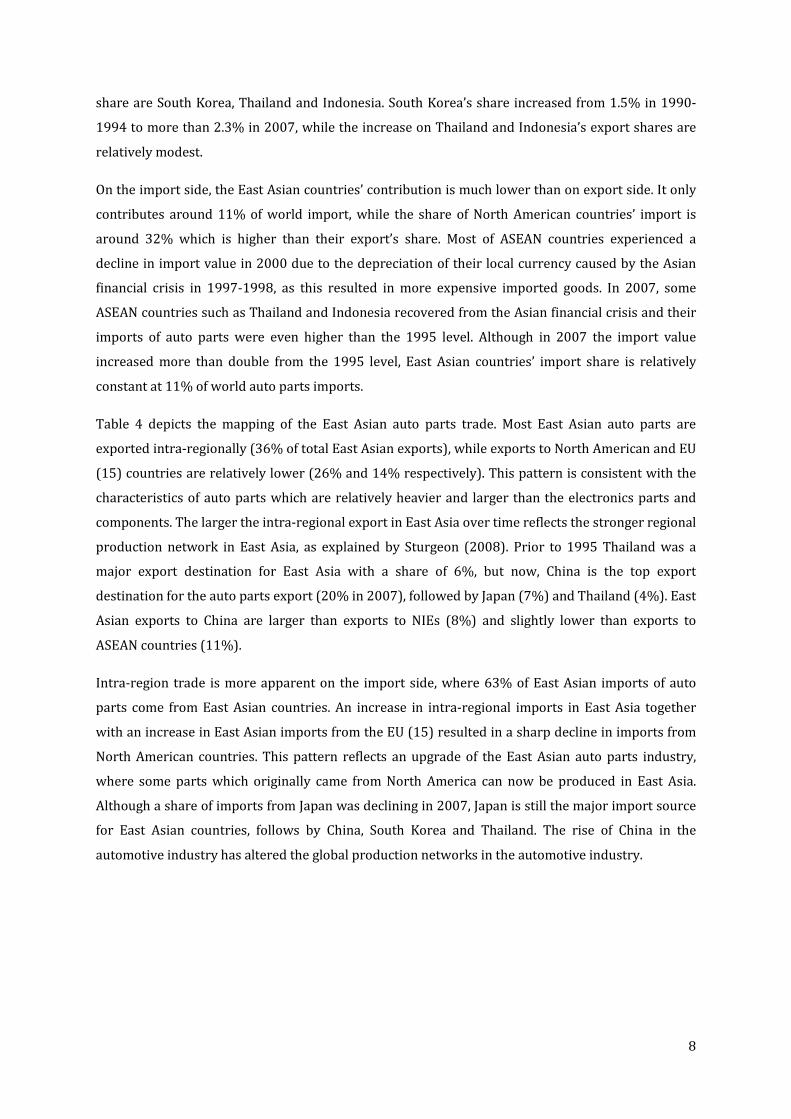
World’s auto parts trade increased significantly from $170 billion in 1990 to almost $700 billion in
2007, with an annual growth of 8.7% which reflects the higher intensity of global production
networks in the automotive industry (see Table 3). The world auto parts trade is dominated by the
EU(15) and North American countries. There is no significant change in the trend of auto parts trade
in the world during 1990-2007.
East Asian countries contribute less significantly in the auto parts trade compared to the electronics
parts and components trade. The share in the world auto parts trade is around 21-23% for the
period 1990-2007, which is much lower than the share in the electronics parts and components
trade (around 50% for export and 45% for import). Among East Asian countries, Japan, China, South
Korea and Thailand are the major players in the auto parts trade. Japan’s role is declining over time
with a decline in export share from 18% in 1990-1994 to 11% in 2000-2007, although it is still the
largest exporter of auto parts in Asia. Meanwhile China’s export share increased from a low 1.2% in
2000 to more than 4% in 2007. Other countries in Asia which experienced an increase in export
8
share are South Korea, Thailand and Indonesia. South Korea’s share increased from 1.5% in 1990-
1994 to more than 2.3% in 2007, while the increase on Thailand and Indonesia’s export shares are
relatively modest.
On the import side, the East Asian countries’ contribution is much lower than on export side. It only
contributes around 11% of world import, while the share of North American countries’ import is
around 32% which is higher than their export’s share. Most of ASEAN countries experienced a
decline in import value in 2000 due to the depreciation of their local currency caused by the Asian
financial crisis in 1997-1998, as this resulted in more expensive imported goods. In 2007, some
ASEAN countries such as Thailand and Indonesia recovered from the Asian financial crisis and their
imports of auto parts were even higher than the 1995 level. Although in 2007 the import value
increased more than double from the 1995 level, East Asian countries’ import share is relatively
constant at 11% of world auto parts imports.
Table 4 depicts the mapping of the East Asian auto parts trade. Most East Asian auto parts are
exported intra-regionally (36% of total East Asian exports), while exports to North American and EU
(15) countries are relatively lower (26% and 14% respectively). This pattern is consistent with the
characteristics of auto parts which are relatively heavier and larger than the electronics parts and
components. The larger the intra-regional export in East Asia over time reflects the stronger regional
production network in East Asia, as explained by Sturgeon (2008). Prior to 1995 Thailand was a
major export destination for East Asia with a share of 6%, but now, China is the top export
destination for the auto parts export (20% in 2007), followed by Japan (7%) and Thailand (4%). East
Asian exports to China are larger than exports to NIEs (8%) and slightly lower than exports to
ASEAN countries (11%).
Intra-region trade is more apparent on the import side, where 63% of East Asian imports of auto
parts come from East Asian countries. An increase in intra-regional imports in East Asia together
with an increase in East Asian imports from the EU (15) resulted in a sharp decline in imports from
North American countries. This pattern reflects an upgrade of the East Asian auto parts industry,
where some parts which originally came from North America can now be produced in East Asia.
Although a share of imports from Japan was declining in 2007, Japan is still the major import source
for East Asian countries, follows by China, South Korea and Thailand. The rise of China in the
automotive industry has altered the global production networks in the automotive industry.
9
Table 3: Trade value of auto parts, 2000 - 2007
1990 1995 2000 2007 1990 1995 2000 2007
World 169,519 265,749 333,865 699,960 154,746 258,327 338,598 699,157
East Asia 33,036 67,428 70,711 166,265 11,991 33,454 32,928 86,887
Japan 28,361 49,842 45,403 64,973 2,751 5,081 7,370 18,427
China - 2,715 6,806 47,792 - 3,467 6,291 29,331
NIEs3 3,925 10,970 11,614 32,575 3,639 12,863 11,067 21,798
Hong Kong - 4,266 3,847 5,468 - 5,274 4,282 5,915
South Korea 2,522 3,862 5,558 20,761 1,679 3,940 4,017 10,381
Singapore 1,403 2,842 2,209 6,346 1,960 3,650 2,769 5,502
ASEAN5 750 3,901 6,888 20,925 5,602 12,043 8,199 17,331
Indonesia 113 595 1,397 3,589 1,543 3,878 2,517 3,363
Malaysia 323 1,197 1,634 2,874 708 1,686 1,560 3,674
Philippines - 801 1,441 3,029 - 961 805 967
Thailand 314 1,309 2,375 10,109 3,351 5,519 3,022 7,285
Viet Nam - - 41 1,324 - - 296 2,042
North America 39,034 66,176 101,091 128,260 55,290 85,726 131,696 180,847
EU (15) 90,182 116,729 133,360 296,510 75,092 107,365 127,173 283,023
ROW 7,267 15,416 28,703 108,926 12,373 31,781 46,801 148,400
Source: Compiled from the UN Comtrade database
Note : The different value of world export and import is because of reporting discrepancies
Export Value ($million) Import Value ($million)

10
Table 4: East Asian auto parts trade: geographic composition, 1990 - 2007
Percentage 1990 1995 2000 2007
Export to
World 100.00 100.00 100.00 100.00
East Asia 20.97 32.20 28.36 35.59
Japan 0.94 2.15 4.32 6.58
China 0.96 6.12 5.97 9.88
NIEs3 7.35 9.19 7.83 7.84
Hong Kong 1.83 3.63 2.98 3.18
South Korea 3.03 2.59 2.83 3.23
Singapore 2.48 2.97 2.01 1.42
ASEAN5 11.73 14.74 10.24 11.29
Indonesia 3.49 3.94 2.79 2.89
Malaysia 2.06 3.20 2.51 2.55
Philippines 0.98 1.57 1.44 1.12
Thailand 5.16 5.81 3.01 3.79
Viet Nam 0.04 0.22 0.48 0.95
North America 43.37 35.00 35.88 25.88
EU (15) 16.92 15.69 16.95 14.41
Others 18.73 17.11 18.81 24.12
Import from
World 100.00 100.00 100.00 100.00
East Asia 56.03 59.36 59.29 62.82
Japan 48.29 43.89 32.18 23.24
China 0.72 5.08 10.95 18.88
NIEs3 3.96 5.50 6.38 7.93
Hong Kong 0.38 1.08 1.09 0.38
South Korea 2.23 2.23 3.09 6.39
Singapore 1.35 2.19 2.20 1.16
ASEAN5 3.07 4.89 9.78 12.77
Indonesia 0.21 0.51 1.66 2.83
Malaysia 1.30 1.99 2.53 1.64
Philippines 0.64 1.26 2.07 1.86
Thailand 0.92 1.10 3.12 5.37
Viet Nam 0.00 0.02 0.40 1.08
North America 16.70 14.26 15.89 9.15
EU (15) 21.52 18.59 17.36 20.99
Others 5.75 7.79 7.46 7.03
Source: Compiled from the UN Comtrade database

III. Product Fragmentation Theory
In the initial formulation, all production processes in the automotive industry were conducted in one
place as a single integrated prod
development together with innovations in telecommunication and transportatio
development of a fragmented production process which consists of more than one product
as shown in Figure 2(B). These production blocks are not independent, but are connected through
service links such as transportation, design, qua
others services. Several patterns of interdependence between production blocks and service links
can be envisaged. Figure 2(C) shows that an output of one production block can become an input for
another production block, while in Figure 2(D) a more complex relationship among production
blocks exists where there is a simultaneous operation of production blocks and the output of each of
these is assembled in the last production block. The degree of fragmen
the number of stages or production blocks. As the degree of fragmentation increases, so does the
importance of service links.
Figure 2: Production Network
Product Fragmentation Theory
, all production processes in the automotive industry were conducted in one
place as a single integrated production block as shown in Figure 2(A). However
development together with innovations in telecommunication and transportatio
development of a fragmented production process which consists of more than one product
(B). These production blocks are not independent, but are connected through
service links such as transportation, design, quality control, insurance, R&D, telecommunication and
others services. Several patterns of interdependence between production blocks and service links
can be envisaged. Figure 2(C) shows that an output of one production block can become an input for
production block, while in Figure 2(D) a more complex relationship among production
blocks exists where there is a simultaneous operation of production blocks and the output of each of
these is assembled in the last production block. The degree of fragmentation can be measured by
the number of stages or production blocks. As the degree of fragmentation increases, so does the
11
, all production processes in the automotive industry were conducted in one
2(A). However technology
development together with innovations in telecommunication and transportation promoted the
development of a fragmented production process which consists of more than one production block
(B). These production blocks are not independent, but are connected through
, R&D, telecommunication and
others services. Several patterns of interdependence between production blocks and service links
can be envisaged. Figure 2(C) shows that an output of one production block can become an input for
production block, while in Figure 2(D) a more complex relationship among production
blocks exists where there is a simultaneous operation of production blocks and the output of each of
tation can be measured by
the number of stages or production blocks. As the degree of fragmentation increases, so does the

Production network started in the
other industries such as sport footwear, automobiles, televisions and radio receivers, sewing
machines, office equipments, power and machine tools, camera and watches and printing and
publishing. One example of the global production network is Japanese car producers. Toyota, for
example, has an assembly centre for cars in Thailand. This assembly centre imports parts from
several countries in East Asia, assembles those parts and then exports the fin
other East Asian markets. Toyota also has another assembly centre for SUVs in Indonesia that
follows the same pattern where Toyota Indonesia imports parts and components from several
countries and then assemblies these parts and co
other East Asian markets.
Fragmentation theory was developed by Jones and Kierzkowski (1990). Product fragmentation is
the breaking down of the integrated process into separate stages of production (producti
which opens up new possibilities for exploiting gains from specialization. Their discussion focused
on the importance of service links in connecting fragmented production blocks.
Growth of a firm’s output level, increasing returns to scale and
encourage a firm to switch a production process from a vertically integrated process to fragmented
production blocks connected by service links. The service links include transportation,
telecommunications and various other
scale.
the electronics and clothing industries and then gradually spread into
other industries such as sport footwear, automobiles, televisions and radio receivers, sewing
machines, office equipments, power and machine tools, camera and watches and printing and
One example of the global production network is Japanese car producers. Toyota, for
example, has an assembly centre for cars in Thailand. This assembly centre imports parts from
several countries in East Asia, assembles those parts and then exports the finished cars to Japan and
East Asian markets. Toyota also has another assembly centre for SUVs in Indonesia that
follows the same pattern where Toyota Indonesia imports parts and components from several
countries and then assemblies these parts and components before exporting the SUVs to Japan and
Fragmentation theory was developed by Jones and Kierzkowski (1990). Product fragmentation is
the breaking down of the integrated process into separate stages of production (producti
which opens up new possibilities for exploiting gains from specialization. Their discussion focused
on the importance of service links in connecting fragmented production blocks.
Growth of a firm’s output level, increasing returns to scale and the advantages of specialization
encourage a firm to switch a production process from a vertically integrated process to fragmented
production blocks connected by service links. The service links include transportation,
telecommunications and various other coordination tasks, which are often subject to economies of
12
nics and clothing industries and then gradually spread into
other industries such as sport footwear, automobiles, televisions and radio receivers, sewing
machines, office equipments, power and machine tools, camera and watches and printing and
One example of the global production network is Japanese car producers. Toyota, for
example, has an assembly centre for cars in Thailand. This assembly centre imports parts from
ished cars to Japan and
East Asian markets. Toyota also has another assembly centre for SUVs in Indonesia that
follows the same pattern where Toyota Indonesia imports parts and components from several
mponents before exporting the SUVs to Japan and
Fragmentation theory was developed by Jones and Kierzkowski (1990). Product fragmentation is
the breaking down of the integrated process into separate stages of production (production blocks)
which opens up new possibilities for exploiting gains from specialization. Their discussion focused
the advantages of specialization
encourage a firm to switch a production process from a vertically integrated process to fragmented
production blocks connected by service links. The service links include transportation,
coordination tasks, which are often subject to economies of

When a firm’s output increases above Y
integrated production process Total Cost (TC
Cost (MC), or it can switch to a
flatter than TC1 because of trade
from an increased specialization of productive
caused by setting up new production blocks. With a fragmented production block, service links
emerge to connect the production blocks, therefore the total cost of the fragmented production
process increases to TC2’. Note that
cost is independent of output level. If service links cost is driven up by the level of output
is steeper than TC2.
Figure 3: Total Cost and Output
The process described in Figure
blocks and connecting service links as shown in Figure
combination of fixed cost and marginal c
declines with output. This rate of decline accelerate
When the production cost per se
production blocks becomes low enough
economic factors such as wage rates and income. Service link cost
technology in each industry.
When a firm’s output increases above Y1 as shown in Figure 3, a firm can choose either to stay at an
integrated production process Total Cost (TC1) which consists of some Fixed Cost (0A)
a fragmented production process with Total Cost of TC
because of trade-off between a lower MC and a higher FC. A lower MC is obtained
from an increased specialization of productive tasks and division of labour, while an increase in FC is
caused by setting up new production blocks. With a fragmented production block, service links
emerge to connect the production blocks, therefore the total cost of the fragmented production
’. Note that TC2 and TC2’ are parallel because we assume that service links
cost is independent of output level. If service links cost is driven up by the level of output
3 can be repeated to higher orders, creating a number of production
blocks and connecting service links as shown in Figure 4. For any degree of fragmentation the
combination of fixed cost and marginal cost within the production blocks ensures that average cost
declines with output. This rate of decline accelerates when the degree of fragmentation is higher.
per se drastically falls and the cost of the service links connecting t
production blocks becomes low enough, fragmentation will occur. Production cost relates to local
economic factors such as wage rates and income. Service link costs depend heavily on the nature of
13
, a firm can choose either to stay at an
) which consists of some Fixed Cost (0A) and Marginal
fragmented production process with Total Cost of TC2. Here, TC2 is
off between a lower MC and a higher FC. A lower MC is obtained
tasks and division of labour, while an increase in FC is
caused by setting up new production blocks. With a fragmented production block, service links
emerge to connect the production blocks, therefore the total cost of the fragmented production
’ are parallel because we assume that service links
cost is independent of output level. If service links cost is driven up by the level of output, then TC2’
can be repeated to higher orders, creating a number of production
For any degree of fragmentation the
ost within the production blocks ensures that average cost
when the degree of fragmentation is higher.
drastically falls and the cost of the service links connecting the
fragmentation will occur. Production cost relates to local
depend heavily on the nature of

Figure 4: Cost and Output under Fragmentation
Following the significant reduction
barriers, fragmentation is likely to occur first on a local or national basis and then spread to the
international market. Firms are able to take advantage of differences in technologies and factor
prices among countries in designing a more global production network. Figure
comparison between local production networks and global production networks
total cost (fixed and variable cost) when all production blocks are located in one country (Home) and
line H’ represents additional cost associated with
locate a production block in anoth
technologies available in that country. The home country has a lower marginal cost in the first
production block and the foreign country has a lower marginal cost in the second block. The cost
fragmented production with using a different location is represented in line M (Mixed)
first production block is located in the home country and second
the foreign country. Line M is flatter than line H du
links cost to connect the two production blocks allocated in the two countries is higher than the
domestic service link costs as shown by the higher fixed cost: AB (local production networks) is
lower than AC (international/global production networks). Therefore a firm will switch to an
international production network when its output level is higher than Y
: Cost and Output under Fragmentation
reduction to international coordination costs such as trade and regulatory
barriers, fragmentation is likely to occur first on a local or national basis and then spread to the
national market. Firms are able to take advantage of differences in technologies and factor
prices among countries in designing a more global production network. Figure
comparison between local production networks and global production networks
total cost (fixed and variable cost) when all production blocks are located in one country (Home) and
additional cost associated with local service links. Suppose now
locate a production block in another country in order to take advantage of factor endowments and
technologies available in that country. The home country has a lower marginal cost in the first
production block and the foreign country has a lower marginal cost in the second block. The cost
fragmented production with using a different location is represented in line M (Mixed)
first production block is located in the home country and second, the production block
the foreign country. Line M is flatter than line H due to lower marginal costs. However the service
links cost to connect the two production blocks allocated in the two countries is higher than the
domestic service link costs as shown by the higher fixed cost: AB (local production networks) is
(international/global production networks). Therefore a firm will switch to an
international production network when its output level is higher than Y2.
14
such as trade and regulatory
barriers, fragmentation is likely to occur first on a local or national basis and then spread to the
national market. Firms are able to take advantage of differences in technologies and factor
prices among countries in designing a more global production network. Figure 5 shows the
comparison between local production networks and global production networks. Line H represents
total cost (fixed and variable cost) when all production blocks are located in one country (Home) and
local service links. Suppose now that a firm can
er country in order to take advantage of factor endowments and
technologies available in that country. The home country has a lower marginal cost in the first
production block and the foreign country has a lower marginal cost in the second block. The cost of
fragmented production with using a different location is represented in line M (Mixed), where the
the production block, is located in
e to lower marginal costs. However the service
links cost to connect the two production blocks allocated in the two countries is higher than the
domestic service link costs as shown by the higher fixed cost: AB (local production networks) is
(international/global production networks). Therefore a firm will switch to an

Figure 5: Total Cost and Output: Effect of Foreign Service Links
The traditional theories of trade are still relevant in the product fragmentation theory.
of specialization according to comparative advantage is still a basis for a decision on the location of
production blocks. Both the Ricardian model on the variet
Heckscher-Ohlin model on factor prices and factor intensities provide explanations for trade within
production blocks. The results from comparative advantages add
and fragmentation as level of output increases.
complicates the analysis since it increases the number of products being traded from two products
in the traditional theory into six tradable items if each of the final products has tw
and components. The answer as
the standard considerations of comparative advantage in the production blocks, but also on the
relative cost and efficiency of service links b
2003).
Product fragmentation becomes important for a country, especially a developing country, because
first, fragmentation and component specialization eliminates the need to gain competency in all
aspects of productions and allows emerging countries to enter into the network of global production
sharing by focusing on the mastery of just one facet of the production process. Given the relative
factor endowments, a country may begin by developing compete
components of complex products and gradually move on to more capital and human
intensive activities. Moreover, by focusing on its factor endowments, it increases the industry
competitiveness as well as employment, o
access of scale economies is limited by volume of the end
: Total Cost and Output: Effect of Foreign Service Links
tional theories of trade are still relevant in the product fragmentation theory.
of specialization according to comparative advantage is still a basis for a decision on the location of
production blocks. Both the Ricardian model on the variety of factor productivities and
Ohlin model on factor prices and factor intensities provide explanations for trade within
production blocks. The results from comparative advantages add the gains from increasing returns
el of output increases. The introduction of cross-border fragmentation
complicates the analysis since it increases the number of products being traded from two products
in the traditional theory into six tradable items if each of the final products has tw
as to which country will specialize on which item depends not only on
the standard considerations of comparative advantage in the production blocks, but also on the
relative cost and efficiency of service links between any pair of countries (Kierzkowski and Arndt,
Product fragmentation becomes important for a country, especially a developing country, because
first, fragmentation and component specialization eliminates the need to gain competency in all
ects of productions and allows emerging countries to enter into the network of global production
sharing by focusing on the mastery of just one facet of the production process. Given the relative
factor endowments, a country may begin by developing competency in the more labour
components of complex products and gradually move on to more capital and human
intensive activities. Moreover, by focusing on its factor endowments, it increases the industry
competitiveness as well as employment, output and wages. When production is fully integrated, the
access of scale economies is limited by volume of the end-product. With fragmentation, volume will
15
tional theories of trade are still relevant in the product fragmentation theory. The principle
of specialization according to comparative advantage is still a basis for a decision on the location of
y of factor productivities and the
Ohlin model on factor prices and factor intensities provide explanations for trade within
from increasing returns
border fragmentation
complicates the analysis since it increases the number of products being traded from two products
in the traditional theory into six tradable items if each of the final products has two tradable parts
to which country will specialize on which item depends not only on
the standard considerations of comparative advantage in the production blocks, but also on the
etween any pair of countries (Kierzkowski and Arndt,
Product fragmentation becomes important for a country, especially a developing country, because
first, fragmentation and component specialization eliminates the need to gain competency in all
ects of productions and allows emerging countries to enter into the network of global production
sharing by focusing on the mastery of just one facet of the production process. Given the relative
ncy in the more labour-intensive
components of complex products and gradually move on to more capital and human-capital
intensive activities. Moreover, by focusing on its factor endowments, it increases the industry
utput and wages. When production is fully integrated, the
product. With fragmentation, volume will

16
rise whenever firms in one country supply not only their own industry, but foreign one as well. It is
no longer necessary for producers to master the entire production chains, therefore large and small
firms can save the learning cost and focus on component production
Based on production technology, the intensity of fragmentation depends on four factors (Lall, et.al,
2004): fist is the technical “divisibility” of the production process: not all production processes can be
divided into separate stages. Some industries have discrete stages of production and components
with different scale, skill and technology requirements which enable the stages then to be separated
and located at different locations and different ownership. Electronics and automotive
manufacturing are examples of these industries. On the other hand, the chemical industry, for
example, has continuous production process is not economically separable. Second, the factor
intensity of the process: the relocation of a production process to a low-wage site is economical only
if it is labour intensive and the reduced cost from labour is greater than the transportation and
coordination costs. Third, the technological complexity of each process: it is not always economical to
relocate a labour intensive process to a low-wage site unless the technology accompanying this
process is simple and stable enough to be conducted by low-wage countries. Finally, the value-to-
weight ratio of the product: the distance of relocation depends on the value-to-weight ratio of the
product. If the parts and components are light and of high value then the relocation of the process to
a further location in order to exploit cost differences is still economical. If the parts and components
are heavy and have low value then it is economic to relocate to proximate areas and encourage
agglomeration.
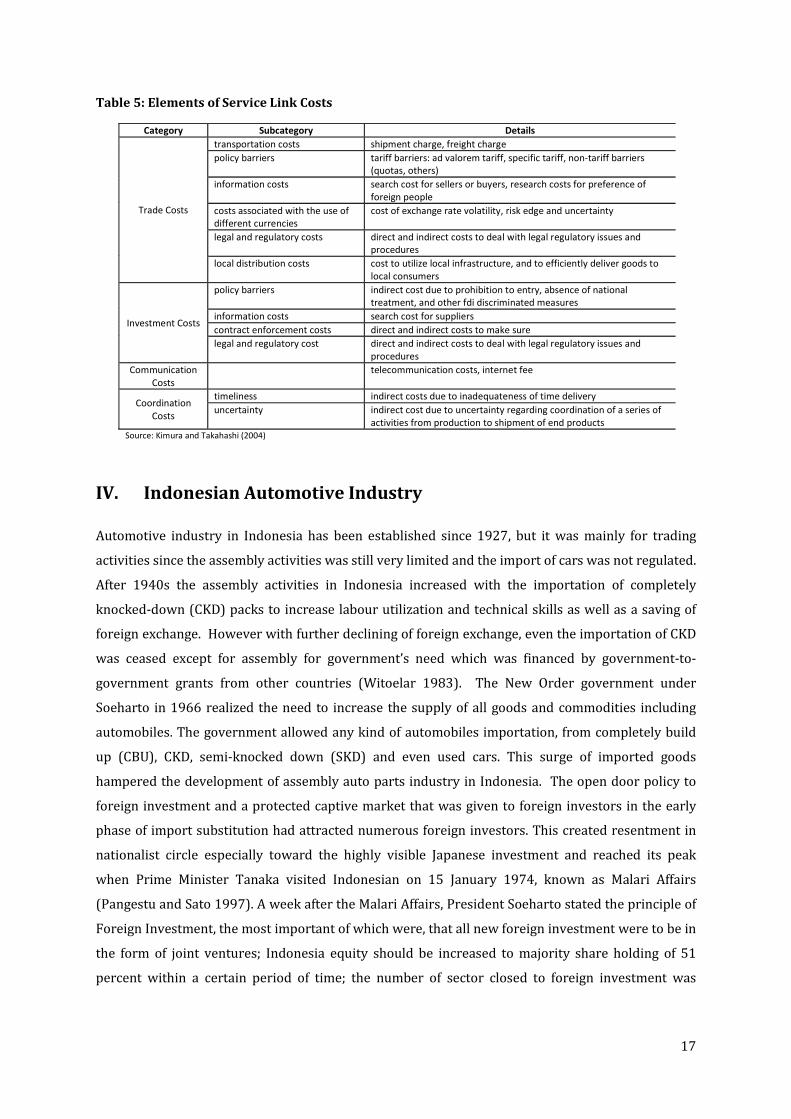
Service links are essential for production networks in order to connect production blocks into one
integrated production process. Following Kimura and Takahashi (2004) elements of service link
costs can be categorized into four groups: trade costs, investment costs, communication costs and
coordination costs.
Trade costs are those costs related to the trade of parts and components among production blocks
whether it happened in the same firm or with other firms (arm’s length firm), both domestic and
international. Most of production blocks located in foreign countries conducted through Foreign
Direct Investment (FDI) therefore investment cost is one category in total service link costs.
Openness of FDI policies, especially in developing countries, is an important factor determining
participation in global production networks. The other two categories are communication costs and
coordination costs. Innovations in telecommunication have significantly reduced the communication
costs and encouraged the development of production networks. Timeliness as one aspect in
coordination costs becomes important as a firm realizes that to hold inventories is costly. “Just-in-
time” technology developed by Japanese production networks has proven effective in holding down
production costs. Therefore infrastructure development and institutional factors are crucial
prerequisites for global production network participation.
17
Table 5: Elements of Service Link Costs
IV. Indonesian Automotive Industry
Automotive industry in Indonesia has been established since 1927, but it was mainly for trading
activities since the assembly activities was still very limited and the import of cars was not regulated.
After 1940s the assembly activities in Indonesia increased with the importation of completely
knocked-down (CKD) packs to increase labour utilization and technical skills as well as a saving of
foreign exchange. However with further declining of foreign exchange, even the importation of CKD
was ceased except for assembly for government’s need which was financed by government-to-
government grants from other countries (Witoelar 1983). The New Order government under
Soeharto in 1966 realized the need to increase the supply of all goods and commodities including
automobiles. The government allowed any kind of automobiles importation, from completely build
up (CBU), CKD, semi-knocked down (SKD) and even used cars. This surge of imported goods
hampered the development of assembly auto parts industry in Indonesia. The open door policy to
foreign investment and a protected captive market that was given to foreign investors in the early
phase of import substitution had attracted numerous foreign investors. This created resentment in
nationalist circle especially toward the highly visible Japanese investment and reached its peak
when Prime Minister Tanaka visited Indonesian on 15 January 1974, known as Malari Affairs
(Pangestu and Sato 1997). A week after the Malari Affairs, President Soeharto stated the principle of
Foreign Investment, the most important of which were, that all new foreign investment were to be in
the form of joint ventures; Indonesia equity should be increased to majority share holding of 51
percent within a certain period of time; the number of sector closed to foreign investment was
Category Subcategory Details
Trade Costs
transportation costs shipment charge, freight charge
policy barriers tariff barriers: ad valorem tariff, specific tariff, non-tariff barriers
(quotas, others)
information costs search cost for sellers or buyers, research costs for preference of
foreign people
costs associated with the use of
different currencies
cost of exchange rate volatility, risk edge and uncertainty
legal and regulatory costs direct and indirect costs to deal with legal regulatory issues and
procedures
local distribution costs cost to utilize local infrastructure, and to efficiently deliver goods to
local consumers
Investment Costs
policy barriers indirect cost due to prohibition to entry, absence of national
treatment, and other fdi discriminated measures
information costs search cost for suppliers
contract enforcement costs direct and indirect costs to make sure
legal and regulatory cost direct and indirect costs to deal with legal regulatory issues and
procedures
Communication
Costs
telecommunication costs, internet fee
Coordination
Costs
timeliness indirect costs due to inadequateness of time delivery
uncertainty indirect cost due to uncertainty regarding coordination of a series of
activities from production to shipment of end products
Source: Kimura and Takahashi (2004)

18
extended; tax incentives were reduced; and the number of foreign personnel was restricted
(Pangestu 1996).
The major government policy that supports the development of auto parts industry was Deletion
Program in 1976. By Minister of Industry Decree no 307/1976, government schedules the gradual
deletion of specific components from the imported CKD packs used in the assembly of commercial
vehicles but not in passenger cars. One objective of deletion program is to stimulate technology
transfer from Japanese auto parts industry to local manufacturer through stable, durable and intense
subcontracting relationship between large car assembling firms and the local auto parts supplier
firms. However, in reality many of components intended to be made locally was actually assembled
from imported parts and components (Aswicahyono, Basri et al. 2000). Therefore government
intention to develop local auto parts manufacturer was not achieved.
The rapid development of assembly activities started in the early 1970s because of the oil boom.
Indonesian automotive market expanded strongly at the early 1970s because of oil boom with the
increase of makes and models. The large number of varieties create very segmented and small
market for auto parts industry and unable them to reach economies of scale. In 1983, government
attempted to rationalize the automotive industry by requiring car assembler to reduce the number
of car brands and models they assembled to achieve economies of scale. The objective was to have
larger market share for each brand and to increase efficiency and lower production cost. However
this regulation was not implemented effectively because of strong rejection from vested interests in
the industry. Another decree was stipulated in 1983 on compulsory use of locally made
components. However this decree was not successful due to the lack of technology, capital and skills
in technical areas of the small and medium scale manufacturers. It resulted on reluctance of foreign
car makers to invest heavily in locally small and medium manufacturer and created shallow, short
term and non-exclusive relationship between assemblers and auto parts manufacturers.
Since there was a little success of deletion program in fostering the development of auto parts
industry in Indonesia, in 1993 government terminated the deletion program and replaced it with the
Incentive program. In this program, assembler are not forced to use locally made auto parts, instead
they will receive an incentive in the form of lower import tariff for imported parts and components if
they increase the use of locally made components (local content). The maximum tariff for imported
parts and components was 40% but it becomes zero when the local content requirements achieved
or exceeded. Local content was measured by a formula of multiplying the percentage of value added
achieved with the given weighted percentage of the component parts. Until 1995, the components
were considered local if they used 40% locally made sub-components for passenger cars and 20%
locally made sub-components for commercial cars.

19
In 1996, Soeharto signed a shocking decree appointing the Timor Putra Nasional (TPN) company
(owned by his son) as the sole manufacturer of the national car, Timor. TPN did not have one single
auto plant, with a joint venture with KIA Motor from Korea, they started to build factory in
Indonesian and meanwhile the cars were produced wholly in Korea and exported to Indonesia in
CBUs. As a national car, it received pioneer status with exempting it from import duties and luxury
sales tax. This national car program was heavily criticized by Japan, the US and the EU and they filed
complaint to WTO which then ruled that the program was a violation to WTO rules. Although the
national car program only last for a while it has big impact on automotive industry in Indonesia.
After the financial crises in 1998, Indonesia has to sign Letter of Intent under the IMF which requires
Indonesia to rapidly liberalize the market. Indonesian government introduced harmonized system
under WTO system in 1999. In this harmonized system, the local content programs were removed
and Indonesia signed the “trade-related investment measures” (TRIMS). The protectionist policy
toward automotive industry was replaced by market liberalization program. The June 1999 tariff
reform has significantly reduced the import tariff for CBU and CKD imports, but it remains relatively
high.
A frequent change in policies toward automotive industry in Indonesia creates uncertainty for both
domestic and foreign investments which in turn hampered the development of automotive industry
especially auto parts manufacturer. Transfer of technology from Japanese car makers to domestic
small and medium enterprises did not occur as expected since Japanese car makers are reluctant to
transfer the technology because they are unable to secure majority of ownership.
Automotive production network in Indonesia has developed rapidly for the last twenty years with
the increase number of car and motorcycle parts producers by three fold and four fold respectively.
The stronger local production networks are due to policies set up by Japanese car makers to
optimize local procurement for cost efficiency and minimizing exchange rate risk. However high
dependency on Japanese car makers hamper the development of domestic auto parts makers since
they are bind to a cooperation agreement which sometimes prohibit them to have cooperation with
other companies.
Although local production network in Indonesia is relatively strong, Indonesia’s position in regional
and global automotive production network is still weak. Indonesian export and import of auto parts
are relatively low compares to other countries in South East Asia. Most developing countries in East
Asia experienced an upgrade in their auto parts industry which is reflected in the change of trade
composition, especially on the export side. For example, Thailand started its export with a labour-
intensive product (wire harness) and then moved to more technology intensive products (other auto
parts and accessories), China from the assembly of radio receiver to electrical accumulator and then
to, and the Philippines from wire harness to other auto parts and accessories. Meanwhile, Malaysia

20
and Indonesia are relatively caught at assembling the same products such as radio-broadcast
receivers and resource based products, i.e. tyres. This condition reflects that Indonesia has been
relatively left behind in the automotive global production network compared to other ASEAN
countries, although it has potentials such as abundant labour and a relatively large market size.
V. Analytical Framework
The empirical model employed in this paper is based on Jones and Kierzkowski (1990)
fragmentation theory which states that fragmentation will occur when production cost per se
drastically falls and the cost of the service links connecting the production blocks become low
enough. The aim is to answer two research questions; the first is on the determinants of a country’s
participation in the global production network, and the second question is whether Indonesia is left
behind in the global production networks compared to other countries.
This research provides new contribution to the empirical studies on the global production network.
While the existing studies focused on selected countries and group of countries, this research covers
all countries in the world and cover long period from 1988 to 2007. One reason to include all
countries in this research is to enable comparison between developed and developing countries as
well as between regions. It also avoids selection bias problem which would occur if countries are
selected based on the trade value or regions.
The existing empirical studies has separately analysed the determinants of the global production
networks. Jones et al (2005) and Golub (2007) focused on the role of service link in the global
production network. Lowering of service link costs promotes fragmentation and outsourcing of
output. The first study uses the business telephone charges as a proxy of service link cost. They
compare three regions: East Asia, EU 15 and NAFTA for period 1990-2000. The result supports the
theory that lowering of business telephone charges increases the trade of parts and components.
The second study uses the index of service link quality and costs as a proxy of service links. They
construct the index consisting of consisting of transport, communications, and electric power
reliability and costs using data from around 2004. The result also supports the theory that lower
service links costs indeed improve the trade of parts and components as well as trade of final goods
and FDI inflows.
Other determinants of the global production networks are exchange rate and relative wages. Arndt
and Hummer (2004) use quarterly data for bilateral trade between the U.S. and Mexico from the first
quarter of 1989 to the fourth quarter of 2002 to examine the effect of cross-border production
sharing on the sensitivity of trade to the exchange rate and GDP. They found that the sensitivity of
exports and imports to the real exchange rate should decline when cross-border fragmentation
expands and when the share of trade associated with production networks rises.

21
Athukorala and Yamashita (2006) use the gravity model to examine the extent, trends and patterns
of the global production networks. They found that relative wage differentials are a significant
determinant of cross border trade in components (as well as the related final products).
In summary, the existing empirical studies find that global production network is explained by cost
differences among countries which consist of production cost and service links costs. The decision
on which country will specialize on which item depends not only on the comparative advantage bust
also on the relative cost and efficiency of service links.
V.1 Model Specification
The empirical model employed in this research is based on Jones and Kierzkowski (1990)
fragmentation theory which states that fragmentation will occur when production cost per se
drastically falls and the cost of the service links connecting the production blocks become low
enough. The decision on which country will specialize on which item depends not only on the
comparative advantage bust also on the relative cost and efficiency of service links. Therefore the
explanatory variables in the model can be grouped into production cost and service link costs. The
dependent variable is fragmentation index which is represented by the trade of parts and
components.
Production Costs
Production cost in this model consists of three variables: labour cost, quality of labour and
competitiveness. In the ideal model, the production cost should include capital cost as well.
However, capital cost is not included in the model because it is difficult to find comparable variable
for capital cost for all countries in the world.
Labour cost
As suggested by the standard international trade theory, comparative advantage is still relevant in
the fragmentation trade. Labour cost (RWages) is crucial in determining the location of production
block in product fragmentation. A country with lower labour cost will attract more production
blocks and will increase the fragmentation index. Therefore the expected sign for labour cost is
negative (Egger and Egger, 2005). However, the expected sign for developed countries is positive
since higher labour cost is associated with higher labour productivity and developed countries is
more conducive location for product fragmentation (Görg, 2000).
Quality of Labour
In addition to labour cost, quality of labour also determines the level of fragmentation in a country.
The heterogeneity of labour quality may determine the pattern of international specialization among

22
countries with similar aggregate factor endowments can explain the trade across industry
(Grossman and Maggi, 2000; Ohnsorge and Trefler, 2004). A country with higher technology
intensity is expected to attract more production blocks and will increase the fragmentation index.
Competitiveness
Traditionally, the appreciation of domestic currency raises import and lowers exports. However in
the production networks the relationship can reverse. The response of a country’s exports to the
exchange rate should decline as the share of imported components for use in the manufacture of its
export rises. Therefore the impact of relationship between changes in exchange rate (RER) and
trade will be negative in the presence of production networks. Moreover, as suggested by Arndt and
Hummer (2004), the sensitivity of trade to exchange rate will decline with the more intensive
fragmentation trade among countries. Then the exchange rate would not be significant in
determining the global production networks.
Service links costs
Besides the production costs listed above, the fragmentation index depends highly on service links
which connect the production blocks and ensure that the production blocks interact in the proper
manner. Basically, goods and services are traded among the production blocks both domestically
and across the border. Therefore it is possible to categorize service link cost into two types of trade
barriers, one is at-the-border trade barriers and another is behind-the-border trade barriers.
At-the-border trade barriers
Across-the-border trade barriers are barriers that affect the flow of goods and services across
countries (borders) which include freight cost and tariff and non tariff barriers.
Freight costs
One explanation of the rise in the international trade is a decline in the international transportation
costs (Hummels, 2007). The decline in the cost is associated with the innovations in transportation
and telecommunication. Mode of transportation depends on the characteristics of the goods. The
bulk commodities such as oil and petroleum products, iron ore, coal, and grains are shipped almost
exclusively via ocean cargo. Oh the other hand, commodities with high value-to-weight ratio will
choose air transportation. Nowadays, air transportation is more preferable than ocean
transportation because of the sharp decline in the relative cost of air transport.
Some studies found that trade is more sensitive to the transportation cost than import tariff. With
the more trade negotiation among countries, the trade barriers from tariffs became less important
therefore the contribution of transportation cost into total cost is rising.

23
Transportation costs co-vary with distance and it well explains the reason of countries trade with
their neighbours first. However distance is not a perfect measurement for the transportation cost
since it does not reflect the change in the quality of transportation. With the declining of air
transport cost and the technology development which enables parts and components to be relocated
in the smaller structure, long distance trade is relatively more attractive.
Therefore the expected sign of freight cost and value of trade can be either positive or negative
depends on the type of traded commodities.
Tariff
Vertical trade is more sensitive to tariff changes compares to final trade (Yi, 2003). Parts and
components are subject to a tariff every time they cross the border. Therefore any reduction in the
parts and components tariff will reduce the production cost, and the level of this reduction will
depend on how many times the fragmented product crosses the border. However, most of
production blocks are located in Special Economic Zone which might include Free Trade Zones
(FTZ), Export Processing Zones (EPZ), Free Zones (FZ), Industrial Estates (IE), Free Ports, Urban
Enterprise Zones and others. Therefore it is expected that the sign of Tariff is negative although it
might not be significant. Another type of trade barrier is Non-Tariff Barriers which are commonly
used by a country as a substitute of the abolishment of tariff barriers and are sometimes more
protective than the tariff barriers. Unfortunately the data on NTB is not widely available for all
countries; therefore it is not included in the model.
Behind-the-border trade barriers
Behind-the-border trade barriers refer to a variety of barriers that operate inside countries rather
than at the border, but that nonetheless can restrict trade. They include trade facilitation and
business and regulatory environment.
Trade Cost
Trade facilitation is generally defined as an improvement of efficiency in logistics and related trade-
enhancing infrastructure at ports and trade customs for the movement of goods in international
trade (Wilson et al, 2003). Administration burdens faced by the exporter and importer at the port
affect the transaction cost of trade flows in a country. Number of documents to be signed and the
time to finish the administration will affect the cost of exporting and importing. Therefore the
expected sign is negative. However, there is a possibility of endogeneity problem between trade
facilitation and trade flows. The higher trade flows made the role of export and import in the GDP
higher and increase the power of exporter and importer to lobby the government to improve the
trade facilitation which in turn will decrease the trade cost.

24
Business and regulatory environment
Most of the production blocks located in foreign countries conducted through Foreign Direct
Investment (FDI), therefore business and regulatory environment related to the FDI is important
factor determining participation in global production networks (Jongwanich,2009). FDI openness is
crucial in the automotive industry because with the possibility of having full foreign ownership in a
country, foreign car maker is willing to bring the latest technology and improve managerial practices
and close supervision of assembly/production by bringing in foreign technicians and managers. It is
expected that the more open the FDI policies in a country the higher the participation in a global
production network, then the expected sign of FDI_Openness is positive.
Institutional quality is relevant in the process of production fragmentation which involves
establishing a complex relationship between two parties engaging in specific investment
relationship. Expansion of production fragmentation will be limited if the quality of institutional is
low. Two indicators are used in the model to represent quality of institutions in a country; fist is the
cost of starting a new business (Buss_Cost) and second is the cost of enforcing a contract
(Contract_Cost). Long and expensive process in attaining a license for new business will discourage
not only foreign investors but also domestic investors in establishing production blocks in a country.
Meanwhile the efficiency of the judicial system in resolving a commercial dispute also affects
investment decision in a country, especially in the automotive industry where most investment is
capital intensive. The expected signs of these variables are negative.
Other variables
Market size
Trade of parts and components depends on market size of export destination and import source
countries. With a larger market size, it is expected that the trade flow of parts and components
increased. Therefore the expected sign for market size (Market) is positive.
Dummy variables
Two dummies variables are included in the model. First, the country dummy variables (C) are
included to capture the unobserved country differences such as geographical location and historical
involvement in production networks. Second, the year dummy variables (T) are included to control
for time-varying factors relating to auto parts such as technological and price changes.
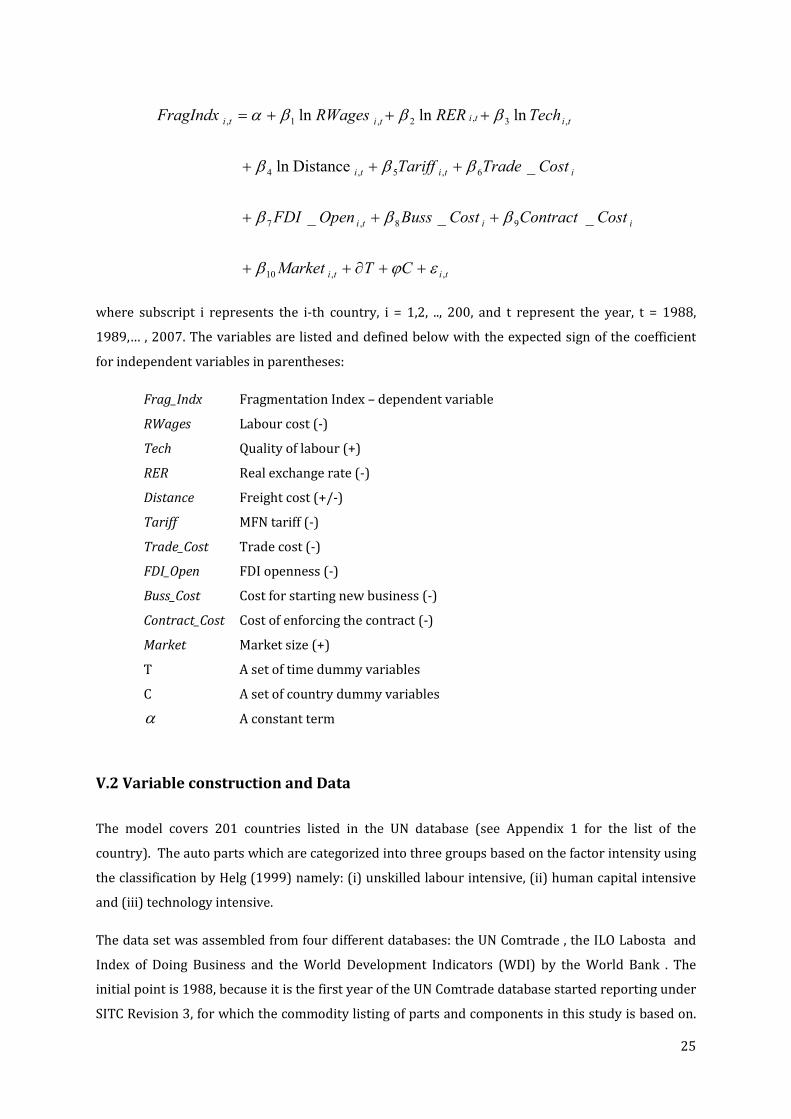
Based on the discussion of the variables above, the full specification of the model can be written as
follows:
25
titi
iiti
ititi
titititi
CTMarket
CostContractCostBussOpenFDI
CostTradeTariff
TechRERRWagesFragIndx
,,10
98,7
6,5,4
,3,2,1,
___
_Distanceln
lnlnln
εϕβ
βββ
βββ
βββα
++∂++
+++
+++
+++=
where subscript i represents the i-th country, i = 1,2, .., 200, and t represent the year, t = 1988,
1989,… , 2007. The variables are listed and defined below with the expected sign of the coefficient
for independent variables in parentheses:
Frag_Indx Fragmentation Index – dependent variable
RWages Labour cost (-)
Tech Quality of labour (+)
RER Real exchange rate (-)
Distance Freight cost (+/-)
Tariff MFN tariff (-)
Trade_Cost Trade cost (-)
FDI_Open FDI openness (-)
Buss_Cost Cost for starting new business (-)
Contract_Cost Cost of enforcing the contract (-)
Market Market size (+)
T A set of time dummy variables
C A set of country dummy variables
α A constant term
V.2 Variable construction and Data
The model covers 201 countries listed in the UN database (see Appendix 1 for the list of the
country). The auto parts which are categorized into three groups based on the factor intensity using
the classification by Helg (1999) namely: (i) unskilled labour intensive, (ii) human capital intensive
and (iii) technology intensive.
The data set was assembled from four different databases: the UN Comtrade , the ILO Labosta and
Index of Doing Business and the World Development Indicators (WDI) by the World Bank . The
initial point is 1988, because it is the first year of the UN Comtrade database started reporting under
SITC Revision 3, for which the commodity listing of parts and components in this study is based on.

26
The end point is 2007, since this was the latest year for which data for most of variables are available
and data for 2008 – 2009 are susceptible from global financial crisis.
Fragmentation Index (dependent variable)
Dependent variable is the real value of export and import of parts and components. The trade data
are sourced from the UN Comtrade database1 and the data is originally expressed in the nominal
US$. The real value is derived using the US import price index collected from the US Department of
Labor2. The automotive industry uses one import price index for the three groups, i.e. the import
price index for automotive Parts & Accessories.
The Athukorala 2009 list is with some modification by including other parts and components which
are considered as auto parts by the Japan Auto Parts Industries Association (JAPIA) and the
Indonesian Automotive Parts and Components Industries Association (GIAMM). Additional parts and
components include tyres, safety glass, electronics parts for automotive, brakes, and safety airbags.
Production Cost
Labour cost
Labour cost is represented by real wage which is calculated from the nominal wages of each country
in US$ deflated by the US Wholesale Price Index (WPI). Nominal wage from the ILO-Laborsta3
database is expressed in the country’s currency therefore it should be converted into US$ using
nominal exchange rate for each country sourced from the WDI website4. However, only 113 of 200
countries have wages data.
USPe
wageRWages
*=
Wherewage denotes nominal wage in domestic currency for each country, e denotes the nominal
exchange rate in the US$ and USP denotes the US Wholesale Price Index as a deflator.
Quality of Labour
Quality of labour is represented by the ratio of high technology export to manufacture export. High-
technology exports are products with high R&D intensity, such as in aerospace, computers,
1 The trade data is collected from UN Comtrade database website, http://comtrade.un.org/db/default.aspx 2 The price indexes are available at Bureau of Labour Statistics, the US Department of Labour ‘s website, http://www.bls.gov/web/ximpim/beaimp.htm 3 The wage data is collected from the ILO – Laborsta, http://laborsta.ilo.org/STP/guest 4 Others data is collected from the World Development Indicator, the World Bank, http://data.worldbank.org/indicator

27
pharmaceuticals, scientific instruments, and electrical machinery. This ratio is available from the
WDI for 173 countries.
Real Exchange Rate
The real exchange rate (RER) is calculated by the following conventional formula:
e
w
eP
ePRER =
Where e denotes the nominal exchange rate measured in terms of foreign currency, wP is an index
of foreign price and dP is an index of domestic price. The producer (wholesale) price index is used
as proxy of wP and, the GDP Deflator is a proxy for dP .
RER based on the price index is not appealing in a pure cross-sectional context because the data only
reflect changes relative to the base year of the index used, with no indication of overvaluation or
undervaluation of a given currency. The alternative measurement is to use the deviation between
RER and the mean of RER over the period with the assumption that the mean of RER is the long-term
equilibrium of the RER (Soloaga and Winters, 2001).
Service links costs
Freight Cost
Some empirical models use distance (Distance) as a proxy of freight cost. Since this model use
unilateral trade instead of bilateral trade, the determination of distance (Distance) is not as
straightforward as in the gravity model. Therefore the distance is calculated between a country and
its major exporter and importer countries. First the major partner is determined for each region and
then each country in the region is assumed to have the same major partner. If a county is also a
major partner for the particular region then the distance is measured by the distance between that
country with its major partner.
The alternative is to calculate the freight cost (Freight_Cost) making use of the reported cost-in-
freight (CIF) records of imports and the free-on-board (FOB) records of export value. The expected
sign is negative, since the higher the freight cost will discourage fragmentation trade. Freight Cost is
calculated through several steps. First is by calculating the CIF-FOB ratio which has to satisfy several
conditions for a reasonable measurement for freight cost. First, the ratio should be larger than 1
which suggests that CIF value is higher than FOB value. If it is less than one it means that the freight
cost is negative. Second condition is that the ratio should be between 1 and 2. If it is more than 2 it
means that the freight cost is higher than the value of the shipment. This condition is illustrated as
follows:

28
FOB
Freight
FOB
CIF+= 1
CIF value is the import value of each country, while FOB value is the world export to each country.
Although the calculation of Freight value using matched partner method is frequently used in the
literature (Baier and Bergstrand, 2001; Limao and Venable, 2001) there is a well-known
measurement error associated with this approach (Anderson and van Wincoop, 2004; Hummels and
Lugovsky, 2006; Hummels, 2007). It has been found that the calculated freight cost do not
necessarily reflect the real shipping cost variation. In fact, the freight cost calculated during the data
construction stage turned out strange and only two percent of the data satisfy the above condition.
Therefore this variable is dropped from the model.
Tariff
The tariff variable is sourced from the average applied MFN import tariff for manufactured goods
from the UNCTAD database5.
Trade cost
Cost for export and import are collected from the World Bank’s Doing Business Survey which
conducted on 183 economies from 2004 – 2010. Cost for export and import is sourced from the
Trading Across Borders indicators which compile procedural requirements for exporting and
importing a standardized cargo of goods by ocean transport. The cargo is a dry-cargo, 20-foot, full
container load of the domestic private, limited liability company that has at least 60 employees. The
company is located in the economy’s largest business city but not operate in an export processing
zone or an industrial estate with special export or import privileges and exports more than 10% if its
sales. For exporting goods, procedures range from packing the goods at the warehouse to their
departure from the port of exit. For importing goods, procedures range from the vessel’s arrival at
the port of entry to the cargo’s delivery at the warehouse.
Trade cost (XCost and MCost) measures the fees levied on a 20- foot container in U.S. dollars. These
include costs for documents, administrative fees for customs clearance and technical control,
customs broker fees, terminal handling charges and inland transport. The cost does not include
customs tariffs and duties or costs related to ocean transport and only official costs are recorded.
FDI openness
5 The MFN tariff data is collected from UNCTAD database website: http://unctadstat.unctad.org/TableViewer/tableView.aspx?ReportId=122

29
The variable used to represent FDI openness is the Inward FDI Potential Index from World
Investment Report - UNCTAD which captures several factors (apart from market size) expected to
affect an economy’s attractiveness to foreign investors. The Inward FDI Potential Index is an average
of the values (normalized to yield a score between zero, for the lowest scoring country, to one, for
the highest) of 12 variables (see Appendix for detail). The expected sign for FDI openness is
negative since the higher the index means the lower the potential inward FDI.
Cost of Starting a New Business
The variable for measuring the cost of starting a new business is sourced from the from the World
Bank’s Doing Business Survey which conducted on 183 economies from 2004 – 2010. The cost
includes cost for all procedures that are officially required for an entrepreneur to start up and
formally operate an industrial or commercial business. These procedures include obtaining all
necessary licenses and permits and completing any required notifications, verifications or
inscriptions for the company and employees with relevant authorities. This definition only includes
procedures required of all businesses are covered. Industry-specific procedures are excluded.
Cost of Enforcing the Contract
This variable is also sourced from the World Bank’s Doing Business Survey. It measures the efficiency
of the judicial system in resolving a commercial dispute. The data are built by following the step-by-
step evolution of a commercial sale dispute before local courts and collected through study of the
codes of civil procedure and other court regulations as well as surveys completed by local litigation
lawyers and by judges.
Other variables
Market Size
Market size variable is different for export and import model. For export, market size is measured by
the real world import of auto parts which is sourced from the UN Comtrade database and the data is
originally expressed in the nominal US$. The real value is derived using the US import price index for
auto parts which is collected from the US Department of Labor. For import model, the market size is
measured by the population of country every year. The data is sourced from the WDI database.
V.3 Estimation Method
Information on the data source explained in the previous section is summarized in Appendix 3. The
pooled panel data for auto parts for period 1988-2007 are estimated for 200 countries. Before
discussing the result, some econometrics issues and the estimating strategy will be addressed.
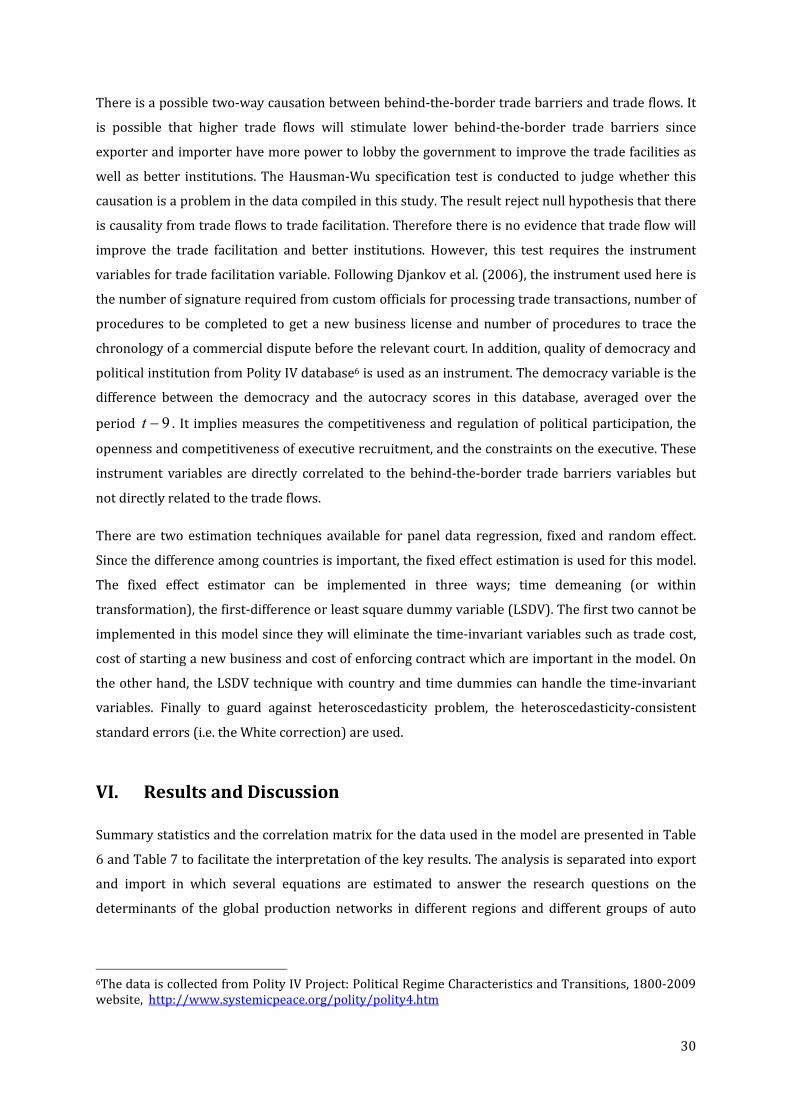
30
There is a possible two-way causation between behind-the-border trade barriers and trade flows. It
is possible that higher trade flows will stimulate lower behind-the-border trade barriers since
exporter and importer have more power to lobby the government to improve the trade facilities as
well as better institutions. The Hausman-Wu specification test is conducted to judge whether this
causation is a problem in the data compiled in this study. The result reject null hypothesis that there
is causality from trade flows to trade facilitation. Therefore there is no evidence that trade flow will
improve the trade facilitation and better institutions. However, this test requires the instrument
variables for trade facilitation variable. Following Djankov et al. (2006), the instrument used here is
the number of signature required from custom officials for processing trade transactions, number of
procedures to be completed to get a new business license and number of procedures to trace the
chronology of a commercial dispute before the relevant court. In addition, quality of democracy and
political institution from Polity IV database6 is used as an instrument. The democracy variable is the
difference between the democracy and the autocracy scores in this database, averaged over the
period 9−t . It implies measures the competitiveness and regulation of political participation, the
openness and competitiveness of executive recruitment, and the constraints on the executive. These
instrument variables are directly correlated to the behind-the-border trade barriers variables but
not directly related to the trade flows.
There are two estimation techniques available for panel data regression, fixed and random effect.
Since the difference among countries is important, the fixed effect estimation is used for this model.
The fixed effect estimator can be implemented in three ways; time demeaning (or within
transformation), the first-difference or least square dummy variable (LSDV). The first two cannot be
implemented in this model since they will eliminate the time-invariant variables such as trade cost,
cost of starting a new business and cost of enforcing contract which are important in the model. On
the other hand, the LSDV technique with country and time dummies can handle the time-invariant
variables. Finally to guard against heteroscedasticity problem, the heteroscedasticity-consistent
standard errors (i.e. the White correction) are used.
VI. Results and Discussion
Summary statistics and the correlation matrix for the data used in the model are presented in Table
6 and Table 7 to facilitate the interpretation of the key results. The analysis is separated into export
and import in which several equations are estimated to answer the research questions on the
determinants of the global production networks in different regions and different groups of auto
6The data is collected from Polity IV Project: Political Regime Characteristics and Transitions, 1800-2009 website, http://www.systemicpeace.org/polity/polity4.htm

31
parts as well as to determine whether Indonesia is left behind in the global production networks
compares to other countries.
From the diagnostic tests, the export model suffers from the endogeneity problems therefore LSDV
with two-stage least square is applied to correct for the endogeneity problems. Meanwhile the
import model does not have endogeneity problem hence the LSDV without two-stage least square is
applied.
Table 8 and 10 present the estimation results for export and import models respectively to answer
the first question which is the determinants of the global production networks. Table 9 and 11
present the estimation results to determine whether Indonesia is left behind in the global
production networks.
Table 6: Summary Statistics
Variable Variable Description Obs Mean Std. Dev. Min Max
FragIndx1 Real Trade Value (log) 2445 12.38 4.16 (0.66) 20.73
RWages Real Wages (log) 1245 7.91 2.31 (1.23) 13.99
Tech Quality of Labor (log) 2060 1.34 1.93 (10.87) 4.32
RER Rearl Exchange Rate (log) 529 0.07 3.10 (8.52) 8.61
Distance Distance to Major Partner (log) 2445 8.40 0.74 7.40 9.37
YWorld Real Value of World Import of Auto parts (log) 2445 22.44 0.37 21.33 23.11
GDPcap GDP per capita (log) 2249 8.13 1.58 4.45 11.55
Pop Population (log) 2012 15.82 1.98 10.91 21.00
FDI_Potential FDI Potential Index (log) 1734 3.81 1.00 - 4.95
Tariff MFN Tariff (log) 1795 1.83 0.97 (2.81) 4.72
Xcost Cost for export (log) 2093 6.89 0.46 5.97 8.43
Mcost Cost for import (log) 2093 7.04 0.51 5.91 8.42
Contract_Cost Cost for starting a new business (log) 2093 3.24 0.63 (2.30) 5.09
Buss_Cost Cost for enforcing contract (log) 2073 2.80 1.67 (1.61) 8.76
Notes: Appendix 3 summarizes the data sources

32
Table 7: Correlation Matrix
RWages Tech RER Distance YWorld GDPcap Pop
FDI_
Potential Tariff Xcost Mcost
Contract
_ Cost
Buss_
Cost
RWages 1
Tech 0.1003 1
RER 0.5828 -0.1429 1
Distance 0.3563 -0.1216 0.3386 1
YWorld 0.2132 -0.1726 0.3435 0.158 1
GDPcap -0.0354 0.509 -0.5438 -0.4699 -0.1955 1
Pop 0.1415 0.0754 0.1291 0.4249 0.0163 -0.1853 1
FDI_Potential 0.1577 -0.5038 0.551 0.3893 0.3495 -0.7502 -0.0709 1
Tariff -0.081 -0.3848 0.261 0.4755 -0.1095 -0.6443 0.2728 0.4353 1
Xcost -0.133 0.0887 0.1393 -0.0982 0.0751 -0.1123 0.0501 0.0599 0.027 1
Mcost -0.1433 0.0193 0.1147 0.0354 0.0604 -0.1841 0.172 0.0749 0.1823 0.9348 1
Contract_Cost 0.2892 -0.1827 0.4574 0.383 0.1646 -0.4895 0.2536 0.3984 0.4372 0.0221 0.1288 1
Buss_Cost 0.1854 -0.3895 0.4672 0.3484 0.3156 -0.6308 0.2998 0.6775 0.3838 0.0929 0.1191 0.3298 1
Variable desription:
RWages
Tech
RER
Distance
YWorld
GDPcap
Pop
FDI_Potential
Tariff
Xcost
Mcost
Contract_Cost
Buss_Cost
Cost for export (log)
Cost for import (log)
Cost for starting a new business (log)
Cost for enforcing contract (log)
Real Wages (log)
Quality of Labor (log)
Rearl Exchange Rate (log)
Distance to Major Partner (log)
Real Value of World Import of Auto parts (log)
GDP per capita (log)
Population (log)
FDI Potential Index (log)
MFN Tariff (log)

33
VI.1. Export Side
Since export models suffer from the endogeneity problem for the behind-the-border trade barriers
then two-stage least square method is applied with quality of democracy and political institution and
the number of documents in export processing and the number of documents in the contract as the
instrumental variables. The analysis is separated into all countries, developed and developing
countries and three regions that have intensive production networks in the automotive industry as
presented in Table 8.
For first model where determinants are examined for all countries, the model resulted quite well
with 98% of the variation in the model can be explained by the explanatory variables. Most of the
coefficients have expected sign except for the FDI openness, Export Cost and Business Cost. From the
estimation result, labour cost, distance and market size determine country participation in the global
production networks as expected by the traditional trade theory. However business and regulatory
environment especially the certainty of business conduct in a country plays more important factor in
the global production networks than in the traditional trade patterns. This condition is well
explained by the characteristics of export in the global production networks where most of the
export is related to the intra-firm trade. Parent company sets up production blocks in a country to
produce parts and components which will be exported to other countries to be assembled. Although
a country has comparative advantage in the lower labour cost, but if business and regulatory
environment is not good, parent company will be reluctant to set up the production blocks because
of the high risk.
This condition is more apparent in the developing countries than developed countries. Coefficient of
labour cost in developing countries is negative as expected where lower labour cost will increase the
value of auto parts export while the coefficient for developed countries is positive. First this result
seems contradict with the theory however it actually explains the impact of heterogeneity of labour
in trade patterns. Developed countries are specialising in the high technology intensive product
which requires more skilled and higher paid labour therefore the labour cost in the developed
countries is positively correlated with the export value. Business and regulatory environment is is
more important determinants for developing countries compare to developed countries and it
represented with the larger coefficient. FDI openness and Business Cost affect the export value more
in developing countries which are represented by the larger coefficient. Meanwhile the certainty in
the contract has relatively similar impact in the developing and developed countries. However, the
export cost affects the participation in the global production networks in the developed countries. It
implies that since the business and regulatory environment are less problematic in the developed
countries then the participation in the global production network in developed countries depend
more on the comparative advantage and trade costs.

34
Table 8: Determinants of global production network, 1988 – 2007 – Export Model
All Countries Developing Developed Asia Europe America
Real Wages -0.695*** -0.438*** 0.462*** -0.201 1.721*** -0.747***
(0.136) (0.134) (0.111) (0.181) (0.230) (0.057)
Quality of Labour 0.073 -0.029 -0.015 0.141 0.582*** -0.722***
(0.076) (0.090) (0.101) (0.148) (0.119) (0.214)
RER 0.017 -0.013 -0.028* -0.012 0.010 -0.191**
(0.023) (0.029) (0.015) (0.056) (0.029) (0.097)
Distance -6.766*** -2.366** -3.179*** -3.926*** 0.028 -0.342
(1.056) (1.093) (0.122) (0.564) (0.604) (0.787)
Tariff -0.027 -0.067 0.004 -0.266** 0.604*** 0.085
(0.072) (0.077) (0.148) (0.119) (0.151) (0.124)
Export Cost 8.455*** 2.854*** -3.175*** 4.672*** 4.828*** 1.521***
(2.030) (0.435) (1.000) (1.719) (1.665) (0.550)
FDI Openness 0.203* -2.540*** -1.344*** -1.456*** 0.134 13.195***
(0.113) (0.904) (0.147) (0.309) (0.375) (0.799)
Business Cost 4.489*** -18.858*** 0.794 4.309*** 21.104*** -24.664***
(1.612) (2.959) (0.774) (0.365) (5.581) (0.852)
Contract Cost -18.333*** -5.083*** -6.002*** -4.505*** 40.899*** -59.066***
(2.289) (1.197) (0.341) (0.599) (12.414) (3.553)
Market 1.289*** 2.136*** 0.439*** 0.824*** 0.114 0.998
(0.166) (0.769) (0.142) (0.137) (0.218) (1.220)
Number of observations 355 184 174 65 157 82
Adjusted R2 0.983 0.985 0.993 0.992 0.971 0.990note: *** p<0.01, ** p<0.05, * p<0.1
Dependent variable: Real Value of Auto Parts ExportExport

35
Another comparison is among region which has intense automotive production networks namely
Asia, Europe and America. Asian region covers all countries in Asia plus Australia and New Zealand
because of their proximity to Asia. The estimation results are as expected.
In Asia, service link costs are more important than production cost in determining participation in
the global production networks. Labour cost is not significant while FDI openness and Contract Cost
are negative and significant. Tariff which is not significant in other model turns out to be significant
and negatively affects the export value in Asia. This unexpected result means that with the declining
in the tariff import, the export of auto parts from Asia is increasing. It is possible because most of the
exported auto parts use imported input in their production process therefore the declining in the
tariff import will increase imported input and in turn will increase the export. As expected the
coefficient for Contract Cost is significant and negative which means that participation in the global
production networks in Asia depends on the certainty of business activity in the country.
Meanwhile, automotive production networks in Europe depend on skilled and high paid workers
which are consistent with the characteristics of developed countries explained above. Both real
wages and quality of labour have positive and significant coefficients. Tariffs, business cost and
contract cost are significant but with reverse signs. One explanation of these unexpected signs is
that parent companies in Europe locate their production blocks in their surrounding countries to
take advantage of the availability of skilled workers regardless of the service links costs related to
the production blocks.
On the other hand, America region which include the US, Canada and South Americans countries has
similar characteristics to developing countries than developed countries where service link costs are
more important than production costs in determining country’s participation in the global
production networks. The unexpected result is the positive and significant coefficient for FDI
openness which implies that country with less potential FDI condition will participate more in the
production networks.
The next research question is to determine whether Indonesia is indeed left behind in the
automotive production networks. For this purpose, dummy variable for Indonesia is added into the
equation. If the coefficient is negative and significant, it implies that Indonesia is left behind
compares to the average of other countries. This approach is applied to different group of countries
such as for all countries, developing countries and Asian countries. When Indonesia dummy (d_Ind)
is added to equation for all countries and developing countries, the coefficient is not significant
which means that compares to all countries and among developing countries, Indonesia is not left
behind. However when d_Ind is added to equation for Asian countries, the coefficient is significant
and negative as presented in Table 9.
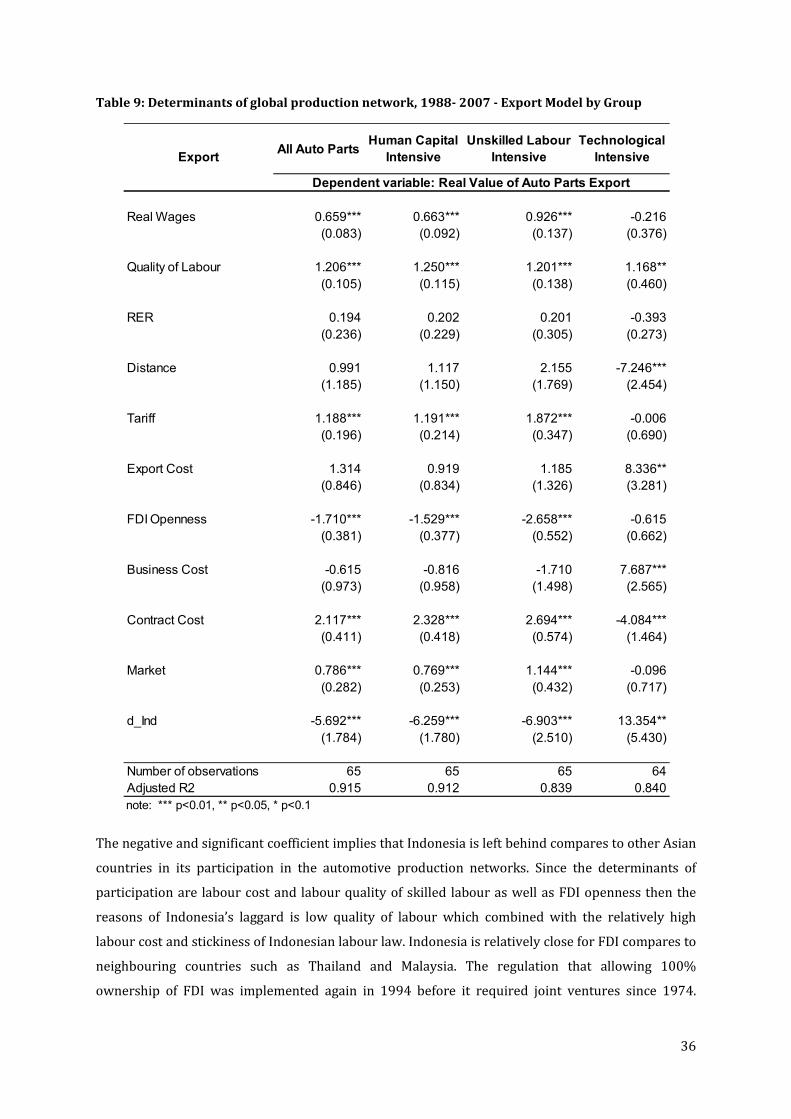
36
Table 9: Determinants of global production network, 1988- 2007 - Export Model by Group
The negative and significant coefficient implies that Indonesia is left behind compares to other Asian
countries in its participation in the automotive production networks. Since the determinants of
participation are labour cost and labour quality of skilled labour as well as FDI openness then the
reasons of Indonesia’s laggard is low quality of labour which combined with the relatively high
labour cost and stickiness of Indonesian labour law. Indonesia is relatively close for FDI compares to
neighbouring countries such as Thailand and Malaysia. The regulation that allowing 100%
ownership of FDI was implemented again in 1994 before it required joint ventures since 1974.
All Auto PartsHuman Capital
Intensive
Unskilled Labour
Intensive
Technological
Intensive
Real Wages 0.659*** 0.663*** 0.926*** -0.216
(0.083) (0.092) (0.137) (0.376)
Quality of Labour 1.206*** 1.250*** 1.201*** 1.168**
(0.105) (0.115) (0.138) (0.460)
RER 0.194 0.202 0.201 -0.393
(0.236) (0.229) (0.305) (0.273)
Distance 0.991 1.117 2.155 -7.246***
(1.185) (1.150) (1.769) (2.454)
Tariff 1.188*** 1.191*** 1.872*** -0.006
(0.196) (0.214) (0.347) (0.690)
Export Cost 1.314 0.919 1.185 8.336**
(0.846) (0.834) (1.326) (3.281)
FDI Openness -1.710*** -1.529*** -2.658*** -0.615
(0.381) (0.377) (0.552) (0.662)
Business Cost -0.615 -0.816 -1.710 7.687***
(0.973) (0.958) (1.498) (2.565)
Contract Cost 2.117*** 2.328*** 2.694*** -4.084***
(0.411) (0.418) (0.574) (1.464)
Market 0.786*** 0.769*** 1.144*** -0.096
(0.282) (0.253) (0.432) (0.717)
d_Ind -5.692*** -6.259*** -6.903*** 13.354**
(1.784) (1.780) (2.510) (5.430)
Number of observations 65 65 65 64
Adjusted R2 0.915 0.912 0.839 0.840
note: *** p<0.01, ** p<0.05, * p<0.1
Export
Dependent variable: Real Value of Auto Parts Export
37
Automotive industry in Indonesia is a very protective sector as explained in the previous section and
a frequent change in policies towards the automotive industry creates uncertainty for both domestic
and foreign investments. With no majority of ownership before 1994, Japanese car makers were
reluctant to transfer the related technology to their partners in Indonesia which resulted in less
participation in production network compares to Thailand.
When comparing fragmentation determinants for different auto parts groups based on their factor
intensity, Human Capital Intensive (HCI) and Unskilled Labour Intensive (ULI) auto parts have
similar determinants with the overall auto parts and Indonesia is relatively left behind in these
groups. Meanwhile, Technology Intensive (TI) auto parts group has different determinants. The
coefficient for d_Ind is positive and significant which means that Indonesia is actually export more of
TI auto parts compare to the average of other Asian countries. Since most of the auto parts in this
category are relatively small therefore the distance is still significant.
In summary, country’s participation the global production network through the export of auto parts
depends more on the service link factors than production cost factors. Sound business and
regulatory environment is important since parent companies will be more willing to relocate their
production blocks to a country which can provide certainty for their business. This is more apparent
in the developing countries and Asian and America regions. Indonesia is indeed left behind because
of FDI policies in Indonesia are less open compares to neighbouring countries.
VI.2 Import Side
In addition to the export of auto parts, a country’s participation in the global production networks
can be analysed through the import of auto parts. Import of auto parts can be viewed as passive
participation in the global production networks. Car makers that relocate their production blocks in
a country usually require the inputs for the production blocks are sourced from their own country to
guarantee the consistency and quality of the products which will be sold domestically and for export
purpose. If most of the products are exported than the determinant of import part of the production
networks will be the same with the determinants of the export side of the production network. In the
contrary if most of the products which use imported inputs are for domestic market then the
determinant of the import will be different.
The analysis of the import side is the same with analysis of the export side. First the analysis is
conducted for all countries and then differentiated between developing and developing countries
and the by regions. Table 10 presents the estimation result for the determinants of the import side of
the global production networks. The estimation of the import side is conducted with the LSDV
without any instrumental variable since the Hausman test for the endogeneity cannot reject the null
hypothesis that the variables are exogenous.

38
Table 10: Determinants of global production network, 1988 - 2007 - Import Model
All Countries Developing Developed Asia Europe America
Real Wages -0.002 -0.051 0.266** 0.023 0.300*** -0.085***
(0.058) (0.042) (0.110) (0.287) (0.097) (0.027)
Quality of Labor 0.027 -0.004 0.061 -0.024 0.135* -0.078
(0.047) (0.053) (0.098) (0.128) (0.078) (0.062)
RER 0.014 0.037 -0.008 -0.131 0.021 0.043
(0.011) (0.025) (0.014) (0.085) (0.013) (0.039)
Distance 2.419*** 2.842*** -0.898*** 0.504 0.777***
(0.114) (0.089) (0.105) (0.389) (0.298)
Tariff 0.013 0.021 0.026 -0.129 0.078 0.063
(0.042) (0.052) (0.079) (0.142) (0.097) (0.065)
Import Cost -3.727*** 0.130 1.042*** 0.635 2.889*** 1.700***
(0.236) (0.151) (0.185) (1.085) (0.189) (0.203)
FDI Openness -1.189*** 0.338 -0.576*** -0.820* -0.638*** -0.548***
(0.064) (0.330) (0.132) (0.421) (0.053) (0.091)
Busines Cost 1.907*** 4.774*** -1.262*** 0.271 -0.748*** -0.275
(0.195) (0.770) (0.219) (0.853) (0.119) (0.196)
Contract Cost 0.663*** 0.622*** -3.738*** 1.398 0.560***
(0.163) (0.158) (0.693) (1.040) (0.147)
Market 1.048*** 1.295*** 0.383** -0.224 0.239* 1.155***
(0.124) (0.156) (0.187) (0.578) (0.144) (0.239)
Number of observations 372 188 184 65 165 82
Adjusted R2 0.989 0.986 0.989 0.962 0.992 0.995
note: *** p<0.01, ** p<0.05, * p<0.1
ImportDependent variable: Real Value of Auto Parts Import

39
Labour condition, RER and import tariff do not significantly affect the import of auto parts in the
global production networks arrangement. It is because most of the trade under global production
networks is inter-firm trade where firms in host country are required to import the parts and
components from the parent country regardless of the labour condition, competitiveness and import
tariff. However, import of auto parts is determined by the import cost, FDI openness and the market
size of the country. Import cost and market size are the common determinants in the import model,
but FDI openness is specific determinants in import side of the participation in the global production
networks. FDI openness is important because the imported auto parts are used as the input for
production blocks established by the car makers and the decision of car makers to relocate the
production blocks in a country depends crucially on the investment climate. Business cost and
contract cost have positive and significant coefficients which imply that when it is more difficult for
foreign car makers to establish their own firms in a host country because of costly business practices
then local firms will establish their own firms and join the car maker as one of the production blocks.
One requirement imposed by foreign car makers to local firm to join their production network is to
import the auto parts from car maker’s production networks to guarantee the quality of the
products.
Comparing developing and developed countries on the import side, the estimation result for
developing countries reconfirms that when the business practices are relatively costly then the
import of auto parts will increase because local firms which join production network are required to
source their input from foreign car makers. Meanwhile, the estimation result for developed
countries is consistent with the theory except for the import cost. It is expected the import cost will
be negatively related to the import value but the estimation result is positive. Coefficient for labour
cost is positive since most of developed countries are endowed with the skilled labours therefore
imported input into the developed countries requires higher wages. Business cost and contract cost
are negatively related to import auto parts in developed countries which imply that better business
and regulatory environment in developed countries resulted in the higher import of auto parts.
Meanwhile, estimation results for three regions which have intensive production networks show
different determinants for every region. For Asian countries, the estimation result only has one
significant factor that affects import value of auto parts namely FDI openness and it has negative
coefficient as expected. Other variables have expected signs but they are not significant. Europe
region has similar determinants of import with developed countries which is reasonable since most
of the trade in European regions is dominated by developed countries. On the other hand, America
regions also have similar determinants with developed countries except that real wages negatively
affects the import value which implies that American countries are dominated by the lower skilled
labour which requires lower wages.

40
Table 11: Determinants of global production network, 1988 - 2007 - Import Model by Group
Table 11 presents the estimation results to answer the second research question whether Indonesia
is left behind in the import side of the production networks. Since estimation for Asian countries
group does not provide good result then the comparison within developing countries is used instead
of Asian countries. The estimation result show that Indonesia is not left behind on the import side of
All Auto PartsHuman Capital
Intensive
Unskilled
Labour
Intensive
Technological
Intensive
Real Wages 0.010 0.056 -0.021 -0.052
(0.067) (0.069) (0.068) (0.070)
Quality of Labor 0.125 0.122 0.128 0.201
(0.134) (0.135) (0.134) (0.132)
RER -0.047 -0.101* 0.003 -0.000
(0.059) (0.060) (0.060) (0.062)
Distance 0.626* 0.525 0.764** -0.191
(0.336) (0.343) (0.332) (0.357)
Tariff 0.177 0.324 0.042 0.274
(0.266) (0.278) (0.259) (0.303)
Import Cost 0.768*** 0.738*** 0.799*** 0.668***
(0.206) (0.219) (0.195) (0.244)
FDI Openness -1.872*** -1.775*** -1.983*** -0.873*
(0.510) (0.531) (0.497) (0.514)
Busines Cost -0.388 -0.269 -0.489 -1.275**
(0.550) (0.571) (0.538) (0.641)
Contract Cost -0.500* -0.465* -0.556** -0.636**
(0.267) (0.281) (0.262) (0.285)
Market 1.081*** 1.122*** 1.027*** 1.588***
(0.227) (0.234) (0.225) (0.249)
d_Ind 3.687*** 3.858*** 3.566*** 3.592***
(0.615) (0.645) (0.604) (0.664)
Number of observations 188 188 188 188
Adjusted R2 0.450 0.448 0.446 0.478
note: *** p<0.01, ** p<0.05, * p<0.1
Import
Dependent variable: Real Value of Auto Parts Import

41
the production networks except for the Technological Intensive auto parts. In fact, the coefficients
are positive which mean that Indonesian imports are higher than the average of developing
countries. This condition is caused by the low quality of Indonesian auto parts production which do
not meet car makers’ standards and requirements therefore automotive firms in Indonesia have to
import most of their auto parts.
VII. Conclusion
Automotive industry experienced continuing transformation from European dominance in the
beginning of 20th century to the US dominance by the introduction of Fordism mass production in
early 20th century and to Japanese dominance in 1970s with the introduction of lean production
system. Saturated market in developed countries drives many carmakers to spread the market to
developing countries by setting up assembly and production base in individual country to serve the
domestic market. With the technology development and innovations in telecommunication and
transportation, automotive industry is able to fragment the production process into smaller
segments in which components of productions or assemblies can be relocated to different places
based on cost advantages. The relocation of segmented production process creates global production
networks. Product fragmentation enables developing countries to participate in the globalization of
automotive industry by focusing on their competitive advantage.
Indonesia as the largest economy in Southeast Asian also participates in the global automotive
industry. Automotive industry which was started in Indonesia in 1928 has shown slow development.
In comparative perspective, Indonesian position in the global automotive industry is quite weak. On
the production side, Indonesian position is below Thailand and Malaysia. While other ASEAN
countries have upgraded their auto parts industry from unskilled labour intensive to technological
intensive products, Malaysia and Indonesia are relatively caught at assembling the same products
such as radio-broadcast receivers and resource based products, i.e. tyres.
This study uses richer dataset than the existing studies since it includes all countries in the world for
the period 1988-2007. Auto parts are classified into three groups based on their factor intensity,
namely Human Capital Intensive, Unskilled Labour Intensive and Technological Intensive. A
country’s participation the global production network through the export of auto parts depends
more on the service link factors than production cost factors. Sound business and regulatory
environment is important since parent companies will be more willing to relocate their production
blocks to a country which can provide certainty for their business. This is more apparent in the
developing countries and Asian and America regions.
On the import side, since most of the trade under global production networks is inter-firm trade
therefore firms in host country are required to import the parts and components from the parent

42
country regardless of the labour condition, competitiveness and import tariff. FDI openness is
important because the imported auto parts are used as the input for production blocks established
by the car makers and the decision of car makers to relocate the production blocks in a country
depends crucially on the investment climate. If a country has costly business practice then local
firms will establish their own firms and join the car maker as one of the production blocks and they
are required to import auto parts from car makers’ production networks .
Indonesia is indeed left behind in export side of the global production network because of FDI
policies in Indonesia are less open compares to neighbouring countries. The major factors which
affect Indonesian condition are the low quality of institutions and legal certainty which discourage
foreign investor to invest significant capital in Indonesia which is required for the technological
intensive auto parts. Automotive industry in Indonesia is a very protective sector and a frequent
change in policies towards the automotive industry creates uncertainty for both domestic and
foreign investments. With no majority of ownership before 1994, Japanese car makers were
reluctant to transfer the related technology to their partners in Indonesia which resulted in less
participation in production network compares to Thailand.
However, Indonesia is not left behind on the import side of production networks except for the
Technological Intensive auto parts. High intensity of Indonesian participation on the import side is
caused by the requirements of car makers to still import the auto parts because of the low quality of
auto parts production which does not meet car maker’s standards.
References
Abbot, Jason P. 2003. Developmentalims and Dependency in Southeast Asia - The case of the
automotive industry. London: Routledge Curzon.
Abrenica, Joy V. 1998. The Asian Automotive Industry: Assessing the roles of state and market in the
age of global competition. Asian Pacific Economic Literature 12 (1).
Anderson, James E. and Eric van Wincoop, 2004, Trade Costs, NBER Working Paper No. 10480 .
Arndt, S. W. and A. Huemer 2004. Trade, Production Networks and the Exchange Rate, Working
Paper (Lowe Institute of Political Economy, Claremont McKenna College).
Arndt, Sven W, and Henryk Kierzkowski, eds. 2003. Fragmentation: New Production Patterns in the
World Economy: Oxford University Press.
Arndt, Sven. 2004. Trade Diversion and Production Sharing. Working Paper Series - Claremont
McKenna College 01.

43
Aswicahyono, Haryo, and Tubagus Feridhanusetyawan. 2004. The Evolution and Upgrading of
Indonesia's Industry. CSIS Working Paper Series WPE 073.
Aswicahyono, Haryo, M. Chatib Basri, and Hal Hill. 2000. How not to industrialize? Indonesia's
automotive industry. Bulletin of Indonesian Economic Studies 36 (1):209-241.
Athukorala, Prema-chandra, and Archanun Kohpaiboon. 2010. Detroit of the East: Thailand in Global
Automotive Network. Canberra.
Athukorala, Prema-chandra, and Nobuaki Yamashita. 2006. Production Fragmentation and Trade
Integration: East Asia in a Global Context. North American Journal of Economics and Statistics 17 (3).
Baier , Scott L. and Jeffrey H. Bergstrand, 2001, The growth of world trade: tariffs, transport costs,
and income similarity , Journal of International Economics. Volume 53, Issue 1
Baier, Scott L. & Bergstrand, Jeffrey H., 2007. Do free trade agreements actually increase members'
international trade?, Journal of International Economics, Elsevier, vol. 71(1), pages 72-95, March.
Bird, Kelly, and Hal Hill. 2006. Indonesian Industrial Policies: Before and After the Crisis. In The East
Asian high-tech drive, edited by Y. Zhi and H. Hill. Northampton: Edward Elgar Publishing Limited.
Bloomfield, Gerald. 1978. The world automotive industry. London: David & Charles (Publishers)
Limited.
Booth, Anne. 1998. The Indonesian economy in the nineteenth and twentieth century’s: a history of
missed opportunity. London: Macmillan Press Ltd.
Cheng, Leonard K., and Henryk Kierzkowski, eds. 1999. Global Production and Trade in East Asia.
Boston: Kluwer Academic Publishers.
Dicken, Peter. 2003. Global Shift - Reshaping the global economic map in the 21st century. New York:
The Guilford Press.
Djankov, Simeon & Freund, Caroline & Pham, Cong S., 2006. Trading on time. Policy Research
Working Paper Series 3909, The World Bank.
Egger, Hartmut and Peter Egger, 2003. Outsourcing and skill-specific employment in a small
economy: Austria after the fall of the Iron Curtain. Oxf. Econ. Pap. 55(4).
Golub, Stephen S, and Henryk Kierzkowski. 2007. Globalization and Country-specific Service Links.
HEI Working Paper 05.
Görg, Holger, 2000. Fragmentation and trade: US inward processing trade in the EU. Review of
World Economics (Weltwirtschaftliches Archiv), Springer, vol. 136(3), pages 403-422, 09.

44
Grossman, Gene M., and Giovanni Maggi. 2000. “Diversity and Trade.” A.E.R. 90 (December): 1255–
75.
Helg, Rodolfo, 1999. Italian Districts in the International Economy. Liuc Papers n.68, Serie
Economica e Impressa.
Hill, Hal. 1997. Indonesia's Industrial Transformation. Singapore: ISEAS.
Hummels, David & Volodymyr Lugovskyy, 2006. Are Matched Partner Trade Statistics a Usable
Measure of Transportation Costs?. Review of International Economics, Wiley Blackwell, vol. 14(1),
pages 69-86, 02.
Hummels, David, 2007. Transportation Costs and International Trade in the Second Era of
Globalization. Journal of Economic Perspectives, American Economic Association, vol. 21(3), pages
131-154, Summer.
Jones, R and Henryk Kierzkowski, 1990. The Role of Services in Production and International Trade:
A Theoretical Framework, in R..Jones and A. Krueger, The Political Economy of International Trade:
Festschrift in Honor of Robert Baldwin, Basil Blackwell, Oxford.
———. 2004. International Fragmentation and the New Economic Geography. North American
Journal of Economics and Statistics 16.
Jones, R, Kierzkowski, Henryk and Lurong, Chen, (2005), What does evidence tell us about
fragmentation and outsourcing?, International Review of Economics & Finance, 14, issue 3, p. 305-
316.
Jongwanich, Juthathip, 2010. Determinants of Export Performance in East and Southeast Asia, The
World Economy, Wiley Blackwell, vol. 33(1), pages 20-41, 01.
Kimura F. and Y. Takahashi, International Trade with FDI and Fragmentation: the Gravity Model
Approach. Hitotsubashi Conference on International Trade and FDI 2004,October 2004.
Kimura, Fukunari. 2005. The Globalization of Production Networks: A View from Asia in the
Globalization of Production: Impacts on Employment, Productivity and Economic Growth. OECD
Workshop.
Kohpaiboon, Archanun. 2009. Global Integration of Thai Automotive Industry. Economic Research
and Training Centre, Faculty of Economics Thammasat University 0016.
Lall, Sanjaya, Manuel Albaladejo, and Jinkang Zhang. 2004. Mapping Fragmentation: Electronics and
Automobiles in East Asia and Latin America. Oxford Development Studies 32 (3).
45
Limao, N., and A.J. Venables. 2001. Infrastructure, Geographical Disadvantage, Transport Costs and
Trade. World Bank Economic Review 15: 451-479
Limão, Nuno and Anthony J. Venables. 2001. Infrastructure, Geographical Disadvantage, Transport
Costs, and Trade , World Bank Econ Rev.
Ohnsorge, Franziska, and Daniel Trefler. 2004. Sorting It Out: International Trade and Protection
with Heterogeneous Workers.” Working Paper no. 10959 (December), NBER, Cambridge, MA.
Pangestu, Mari E. 1996. Economic Reform, Deregulation and Privatization: The Indonesia
Experience. CSIS Working Paper Series.
Pangestu, Mari E., and Yuri Sato, eds. 1997. Waves of Change in Indonesia's Manufacturing Industry.
Tokyo: Institute of Developing Economies.
Poapongsakorn, Nippon, and Kriengkrai Techakanont. 2008. The Development of Automotive
Industry Clusters and Production Networks in Thailand. In Production Networks and Industrial
Clusters, edited by I. Kuroiwa and T. M. Heng. Singapore: ISEAS Publishing.
Simarmata, Djamester. 2007. The automotive industry in Indonesia and its global context. In Market
Access Issues in the Automotive Sector. Paris: OECD
Soloaga, Isidro & Alan Wintersb, L., 2001. Regionalism in the nineties: what effect on trade?, The
North American Journal of Economics and Finance, Elsevier, vol. 12(1), pages 1-29, March.
Sturgeon, Timothy & Johannes Van Biesebroeck & Gary Gereffi, 2008. Value chains, networks and
clusters: reframing the global automotive industry. Journal of Economic Geography, Oxford
University Press, vol. 8(3), pages 297-321, May.
Tarmidi, Lepi T. 2004. Indonesian industrial policy in the automobile sector: focus on technology
transfer. In Production networks in Asia and Europe, edited by R. Busser and Y. Sadoi. London:
Routledge Curzon.
Thee, Kian Wie. 2007. Indonesia's auto parts industry In Indonesia's Industrial Competitiveness - A
study on the Garments, Auto Parts and Electronics Components Industries Development Economies
Research Group, World Bank
Wilson,John S. & Mann, Catherine L. & Otsuki, Tsunehiro, 2003. Trade facilitation and economic
development : measuring the impact. Policy Research Working Paper Series 2988, The World Bank.
Witoelar, Wirmar. 1983. Ancillary firm development in the motor vehicle industry in Indonesia. In
The motor vehicle industry in Asia - A study of ancillary firm development, edited by K. Odaka.
Singapore: Singapore University Press.

46
Yi, Kei-Mu , 2003. Can Vertical Specialization Explain the Growth of World Trade?, Journal of Political
Economy, University of Chicago Press, vol. 111(1), pages 52-102, February.
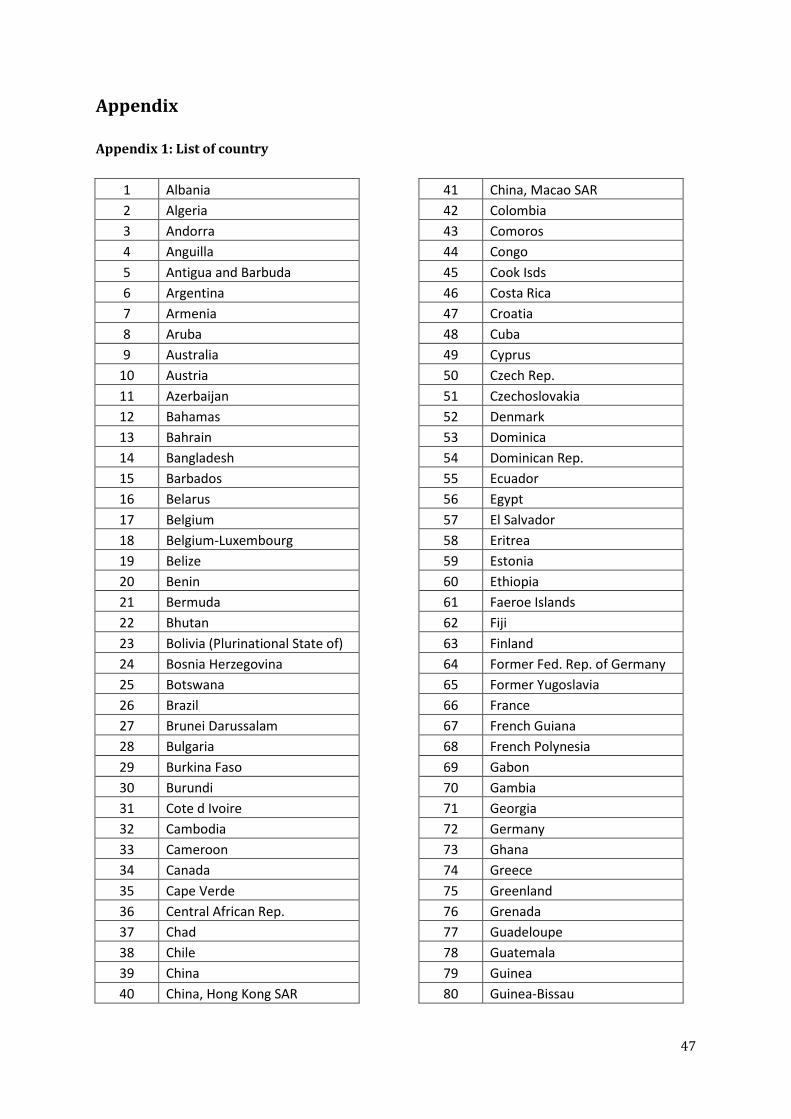
47
Appendix
Appendix 1: List of country
1 Albania
2 Algeria
3 Andorra
4 Anguilla
5 Antigua and Barbuda
6 Argentina
7 Armenia
8 Aruba
9 Australia
10 Austria
11 Azerbaijan
12 Bahamas
13 Bahrain
14 Bangladesh
15 Barbados
16 Belarus
17 Belgium
18 Belgium-Luxembourg
19 Belize
20 Benin
21 Bermuda
22 Bhutan
23 Bolivia (Plurinational State of)
24 Bosnia Herzegovina
25 Botswana
26 Brazil
27 Brunei Darussalam
28 Bulgaria
29 Burkina Faso
30 Burundi
31 Cote d Ivoire
32 Cambodia
33 Cameroon
34 Canada
35 Cape Verde
36 Central African Rep.
37 Chad
38 Chile
39 China
40 China, Hong Kong SAR
41 China, Macao SAR
42 Colombia
43 Comoros
44 Congo
45 Cook Isds
46 Costa Rica
47 Croatia
48 Cuba
49 Cyprus
50 Czech Rep.
51 Czechoslovakia
52 Denmark
53 Dominica
54 Dominican Rep.
55 Ecuador
56 Egypt
57 El Salvador
58 Eritrea
59 Estonia
60 Ethiopia
61 Faeroe Islands
62 Fiji
63 Finland
64 Former Fed. Rep. of Germany
65 Former Yugoslavia
66 France
67 French Guiana
68 French Polynesia
69 Gabon
70 Gambia
71 Georgia
72 Germany
73 Ghana
74 Greece
75 Greenland
76 Grenada
77 Guadeloupe
78 Guatemala
79 Guinea
80 Guinea-Bissau

48
81 Guyana
82 Haiti
83 Honduras
84 Hungary
85 Iceland
86 India
87 Indonesia
88 Iran
89 Iraq
90 Ireland
91 Israel
92 Italy
93 Jamaica
94 Japan
95 Jordan
96 Kazakhstan
97 Kenya
98 Kiribati
99 Kuwait
100 Kyrgyzstan
101 Latvia
102 Lebanon
103 Lesotho
104 Libya
105 Lithuania
106 Luxembourg
107 Madagascar
108 Malawi
109 Malaysia
110 Maldives
111 Mali
112 Malta
113 Martinique
114 Mauritania
115 Mauritius
116 Mayotte
117 Mexico
118 Mongolia
119 Montserrat
120 Morocco
121 Mozambique
122 Myanmar
123 Namibia
124 Nepal
125 Neth. Antilles
126 Netherlands
127 New Caledonia
128 New Zealand
129 Nicaragua
130 Niger
131 Nigeria
132 Norway
133 Occ. Palestinian Terr.
134 Oman
135 Pakistan
136 Panama
137 Papua New Guinea
138 Paraguay
139 Peru
140 Philippines
141 Poland
142 Portugal
143 Qatar
144 Reunion
145 Rep. of Korea
146 Rep. of Moldova
147 Romania
148 Russian Federation
149 Rwanda
150 Saint Kitts and Nevis
151 Saint Lucia
152 Saint Vincent and the
Grenadines
153 Samoa
154 Sao Tome and Principe
155 Saudi Arabia
156 Senegal
157 Serbia
158 Serbia and Montenegro
159 Seychelles
160 Sierra Leone
161 Singapore
162 Slovakia
163 Slovenia
164 So. African Customs Union
165 Solomon Isds
166 South Africa
167 Spain
168 Sri Lanka
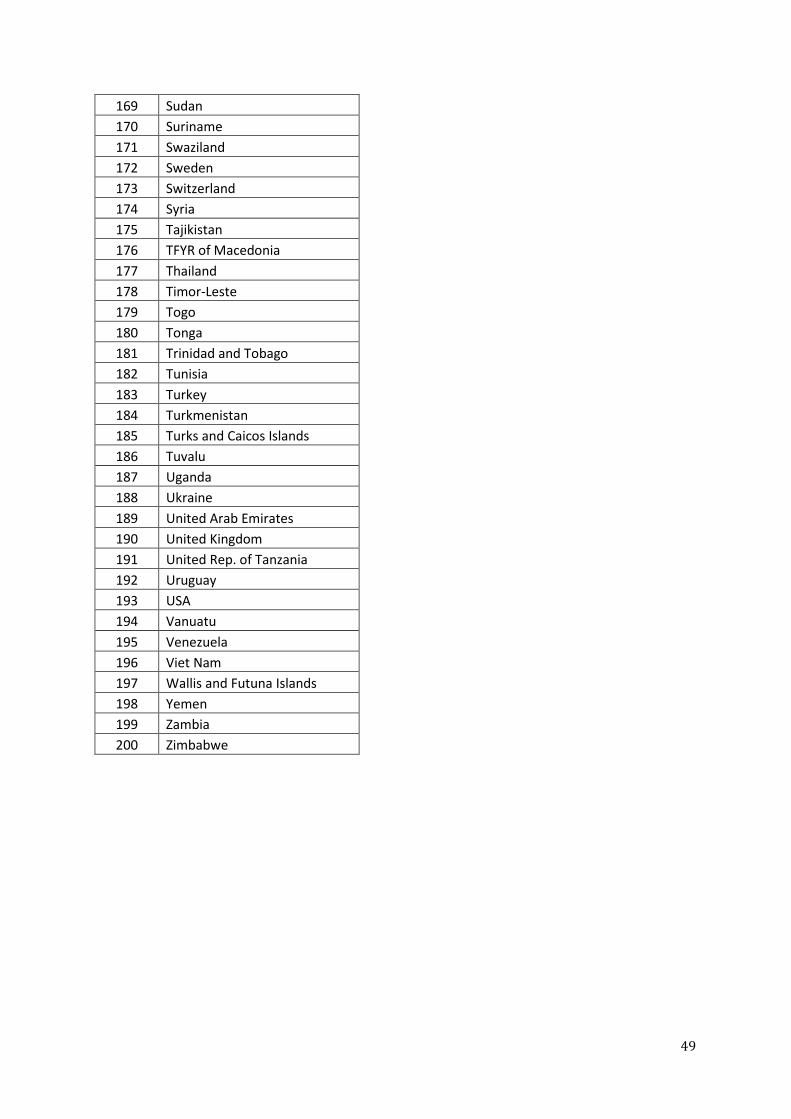
49
169 Sudan
170 Suriname
171 Swaziland
172 Sweden
173 Switzerland
174 Syria
175 Tajikistan
176 TFYR of Macedonia
177 Thailand
178 Timor-Leste
179 Togo
180 Tonga
181 Trinidad and Tobago
182 Tunisia
183 Turkey
184 Turkmenistan
185 Turks and Caicos Islands
186 Tuvalu
187 Uganda
188 Ukraine
189 United Arab Emirates
190 United Kingdom
191 United Rep. of Tanzania
192 Uruguay
193 USA
194 Vanuatu
195 Venezuela
196 Viet Nam
197 Wallis and Futuna Islands
198 Yemen
199 Zambia
200 Zimbabwe

50
Appendix 2: List of auto parts
No SITC Factor
Intensity
Description
1 S3-6251 HCI Tyres, pneumatic, new, of a kind used on motor cars (including station wagons and racing cars)
2 S3-6252 HCI Tyres, pneumatic, new, of a kind used on buses or lorries
3 S3-62541 HCI Tyres, pneumatic, new, of a kind used on motorcycles and bicycles of a kind used on motorcycles
4 S3-62591 HCI Inner tubes
5 S3-62593 HCI Used pneumatic tyre
6 S3-69915 HCI Other mountings, fittings and similar articles suitable for motor vehicles
7 S3-69941 HCI Springs and leaves for springs, of iron or steel
8 S3-76211 HCI Radio-broadcast receivers not capable of operating without an external source of power, of a kind used in motor vehicles
(including apparatus capable of receiving radio-telephony or radio-telegraphy) incorporating sound-recording or reproducing
apparatus
9 S3-76212 HCI Radio-broadcast receivers not capable of operating without an external source of power, of a kind used in motor vehicles
(including apparatus capable of receiving radio-telephony or radio-telegraphy) not incorporating sound-recording or
reproducing apparatus
10 S3-76422 HCI Loudspeakers, mounted in their enclosures
11 S3-76423 HCI Loudspeakers, not mounted in their enclosures
12 S3-76425 HCI Audio-frequency electric amplifiers
13 S3-7841 HCI Chassis fitted with engines, for the motor vehicles of groups 722, 781, 782 and 783
14 S3-78421 HCI Bodies (including cabs), for the motor vehicles of groups 781,
15 S3-78425 HCI Bodies (including cabs), for the motor vehicles of groups 722, 782 and 783
16 S3-78431 HCI Bumpers, and parts thereof
17 S3-78432 HCI Other parts and accessories of bodies (including cabs)
18 S3-78433 HCI Brakes and servo-brakes and parts thereof
19 S3-78434 HCI Gearboxes
20 S3-78435 HCI Drive-axles with differential, whether or not provided with other transmission components

51
21 S3-78436 HCI Non-driving axles, and parts thereof
22 S3-78439 HCI Other parts and accessories
23 S3-78531 HCI Invalid carriages, whether or not motorized or otherwise mechanically propelled
24 S3-78535 HCI Parts and accessories of motorcycles (including mopeds)
25 S3-78536 HCI Parts and accessories of invalid carriages
26 S3-78537 HCI Parts and accessories of other vehicles of group 785
27 S3-88571 HCI Instrument panel clocks and clocks of a similar type, for vehicles, aircraft, spacecraft or vessels
28 S3-71321 TI Reciprocating piston engines of a cylinder capacity not exceeding 1,000 cc
29 S3-71322 TI Reciprocating piston engines of a cylinder capacity exceeding 1,000 cc
30 S3-71323 TI Compression-ignition engines (diesel or semi-diesel engines)
31 S3-71391 TI Parts, n.e.s, for the internal combustion piston engines of subgroups 713.2, 713.3 and 713.8, suitable for use solely or
principally with spark-ignition internal combustion piston engines
32 S3-71392 TI Parts, n.e.s, for the internal combustion piston engines of subgroups 713.2, 713.3 and 713.8, suitable for use solely or
principally with compression-ignition internal combustion piston engines
33 S3-71651 TI Electric generating sets with compression-ignition internal combustion piston engines (diesel or semi-diesel engines)
34 S3-7169 TI Parts, n.e.s., suitable for use solely or principally with the machines falling within group 716
35 S3-74315 TI Compressors of a kind used in refrigerating equipment
36 S3-74363 TI Oil or petrol filters for internal combustion engines
37 S3-74364 TI Intake air filters for internal combustion engines
38 S3-7438 TI Parts for the pumps, compressors, fans and hoods of subgroups 743.1 and 743.4
39 S3-74443 TI Other jacks and hoists, hydraulic
40 S3-7481 TI Transmission shafts (including camshafts and crankshafts) and cranks
41 S3-74821 TI Bearing housings, incorporating ball- or roller bearings
42 S3-74822 TI Bearing housings, not incorporating ball- or roller bearings; plain shaft bearings
43 S3-7484 TI Gears and gearing (excluding toothed wheels, chain sprockets and other transmission elements presented separately); ball
screws; gearboxes and other speed changers (including torque converters)
44 S3-7485 TI Flywheels and pulleys (including pulley blocks)
45 S3-7486 TI Clutches and shaft couplings (including universal joints)

52
46 S3-7489 TI Parts, n.e.s., for the articles of group 748
47 S3-7492 TI Gaskets and similar joints of metal sheeting combined with other material or of two or more layers of metal; sets or
assortments of gaskets and similar joints, dissimilar in composition, put up in pouches, envelopes or similar packings
48 S3-74999 TI Other machinery parts, not containing electrical connectors, insulators, coils, contacts or other electrical features
49 S3-77812 TI Electric accumulators (storage batteries)
50 S3-77821 TI Filament lamps (other than flash bulbs, infrared and ultraviolet lamps and sealed-beam lamp units)
51 S3-77823 TI Sealed-beam lamp units
52 S3-77831 TI Electrical ignition or starting equipment of a kind used for spark- ignition or compression-ignition internal combustion
engines (e.g., ignition magnetos, magnetodynamos, ignition coils, sparking-plugs and glow plugs, starter motors); generators
(e.g., dy dynamos and alternators) and cut-outs of a kind used in conjunction with such engines
53 S3-77833 TI Parts of the equipment of heading 778.31
54 S3-77834 TI Electrical lighting or signalling equipment (excluding articles of subgroup 778.2), windscreen wipers, defrosters and
demisters, of a kind used for cycles or motor vehicles
55 S3-77835 TI Parts of the equipment of heading 778.34
56 S3-66471 ULI Safety glass, consisting of toughened (tempered) or laminated glass of toughened (tempered) glass
57 S3-66472 ULI Safety glass, consisting of toughened (tempered) or laminated glass of laminated glass
58 S3-66481 ULI Rear-view mirrors for vehicles
59 S3-77313 ULI Ignition wiring sets and other wiring sets of a kind used in vehicles, aircraft or ships
60 S3-82112 ULI Seats of a kind used for motor vehicles

53
Appendix 3: Summary of data
Variables Data Data Source Period Expected Sign
Labour cost Real wage LABORSTA Varies among countries (-)
Technology level Share of High Tech Export WDI All period (+)
Competitiveness RER WDI All period (+) for export model
(-) for import model
Trade Cost Export cost Doing Business 2004-2005 (-)
Import Cost Doing Business 2004-2005 (-)
Freight Cost Distance to Major Partner Haveman’s Data All period (+) / (-) depends on type
of commodities
Tariff Manufactured Goods MFN
tariff
TRAINS All period (-)
FDI Openness Inward FDI Potential Index World Investment Report All period (-)
Administration Cost Cost of Starting a new
Business
WB Doing Business 2004-2007 (-)
Cost of Enforcing the
Contract
WB Doing Business 2004-2007 (-)
Country size GDP per capita WDI All period (+)
Market size Export equation: World
Import for Final Assembly
COMTRADE All period (+)
Import equation: GDP per
capita
WDI All period (+)
PRODUCTION COST
SERVICE LINKS COST – Border Trade Barriers
SERVICE LINKS COST – Behind-the-Border Trade Barriers
OTHER VARIABLES