globalization, trade and the changing geography of new zealand
TRANSCRIPT

Globalization, Trade and the Changing Geography of New
Zealand :Urban versus Rural or Centre versus Periphery?
Professor Philip McCannDepartment of Economics
University of Waikato
Australian Agricultural and Resource Economists Society 51st Annual Conference
13th – 16th February 2007

18 April 2007© THE UNIVERSITY OF WAIKATO • TE WHARE WANANGA O WAIKATO 2
Acknowledgements: Data and Information Sources
• OECD
• IMF
• World Bank
• EU
• UN
• NZ Institute
• H.M. Treasury NZ
• NZ Ministry of Economic Development
• NZ Business Roundtable
• DOTARS Australia
• Centre for Population Studies

18 April 2007© THE UNIVERSITY OF WAIKATO • TE WHARE WANANGA O WAIKATO 3
Structure of Presentation
• 1. NZ economy: Historic Trends and Current Features
• 2. NZ Economy: Paradox or Conundrum
• 3. Globalization and the 20th Century Economy
• 4. NZ’s Response to Globalization
• 5. Role of Scale and Geography in Economics
• 6. Scale and Geography in NZ Economics
• 7. NZ Public Policy Arena

18 April 2007© THE UNIVERSITY OF WAIKATO • TE WHARE WANANGA O WAIKATO 4
1. The NZ Economy: Historic Trends
• Structure of NZ Economy• Primary sector accounts for 6.8% of GDP, rising to 17% when we
include forward and backward linkages
• Productivity Trends • 1960: NZ ranked 3rd highest productivity in the world
• 1970: NZ ranked 9th highest productivity country in the world
• 1980 – 1985: NZ ranked 17th highest productivity country in the world
• Institutional and Political Response• Rapid and fundamental economic reforms 1984-1989 and 1991-1995

18 April 2007© THE UNIVERSITY OF WAIKATO • TE WHARE WANANGA O WAIKATO 5
1. The NZ Economy: Historic Trends• Response: Business Environment and
Entrepreneurship ☺• World Bank ranks NZ 2nd for ‘ease of doing business’ – second
lowest compliance costs in the world for starting a business, hiring and firing
• Fraser Institute (2006): NZ ranks 3rd in the world for ‘economic freedoms’
• Heritage Foundations (2007) ranks NZ 5th freest in the world
• Forbes Capital Friendliness Index (2006): NZ is 10th out of 135 countries
• Global Entrepreneurship Monitor: NZ is ranked 1st, for third consecutive year
• World Competitiveness Report, World Economic Forum 2006: NZ is ranked 1st in the world for its institutions

18 April 2007© THE UNIVERSITY OF WAIKATO • TE WHARE WANANGA O WAIKATO 6
1. The NZ Economy: Historic Trends• Response: Unemployment ☺• Lowest in OECD
• NZ Response: Productivity • 1995: NZ ranked 20th highest productivity country in the world
• 2004: NZ ranked 21st highest productivity country in the world
• NZ GDP per capita 2004 ~ US 24,498 (87% of OECD average)
• NZ GDP per capita 2004 ~ 28% below UK and 27% below Australia
• NZ GDP per capita 2004 ~ 21% below Japan and 19% below Germany
• NZ GDP per capita 2004 ~ 21% below OECD top half (where NZ was in 1977)

18 April 2007© THE UNIVERSITY OF WAIKATO • TE WHARE WANANGA O WAIKATO 7
1. The NZ Economy: Historic Trends
• NZ Response: Real GDP Growth ☺Between 1991 and 2004, growth in New Zealand was ranked as the 8th
highest in the OECD (Australia = 6th, UK = 16th, USA = 9th) Ignoring transition economies, NZ is 5th in OECD
Since 2000, NZ growth has average 3.75% p.a.• NZ growth 1998-2003 is outperforming Australia, UK, US and
Denmark• Since 2000, strong evidence of a upward structural shift in NZ growth
performance• 2007-2008 NZ growth is forecast to be slower than most other OECD
countries
• Labour Productivity Growth ☺• NZ growth has outpaced the OECD 10-year moving average since
2000…”.(OECD 2005)
18 April 2007© THE UNIVERSITY OF WAIKATO • TE WHARE WANANGA O WAIKATO 8
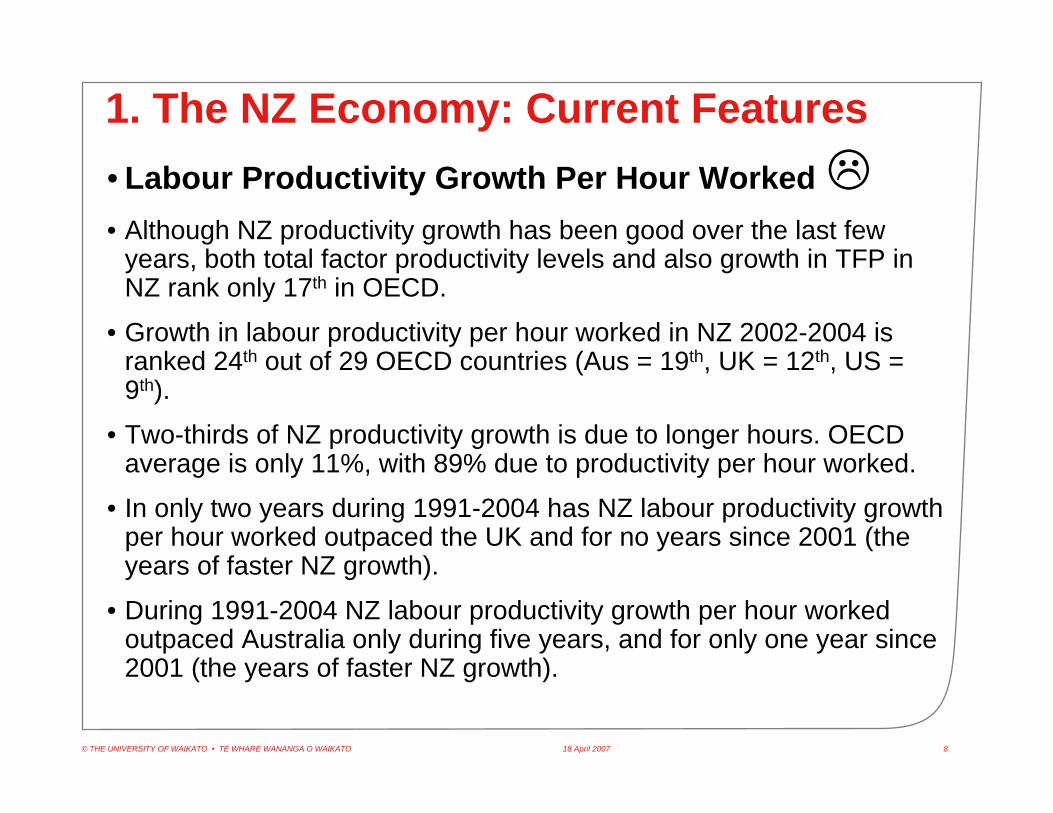
1. The NZ Economy: Current Features• Labour Productivity Growth Per Hour Worked• Although NZ productivity growth has been good over the last few
years, both total factor productivity levels and also growth in TFP in NZ rank only 17th in OECD.
• Growth in labour productivity per hour worked in NZ 2002-2004 is ranked 24th out of 29 OECD countries (Aus = 19th, UK = 12th, US = 9th).
• Two-thirds of NZ productivity growth is due to longer hours. OECD average is only 11%, with 89% due to productivity per hour worked.
• In only two years during 1991-2004 has NZ labour productivity growth per hour worked outpaced the UK and for no years since 2001 (theyears of faster NZ growth).
• During 1991-2004 NZ labour productivity growth per hour worked outpaced Australia only during five years, and for only one year since 2001 (the years of faster NZ growth).

18 April 2007© THE UNIVERSITY OF WAIKATO • TE WHARE WANANGA O WAIKATO 9
1. The NZ Economy: Current Features• Capital Investment
• NZ private sector business investment is ~ 10% GDP, while OECD average is 15%
• Growth in Factor Efficiency Utilisation
• 0.8% p.a. - less than half the OECD average• NZ Firm Size• Firms with less than five staff (micro-businesses) account for 90% of
businesses, 11% of employment, and 20% of GDP.
• Only 6% of NZ firms seek equity investment, with just over 5% securing it.
• NZ Firm Size• Failure rate ~ 50% of small firms last for four years
• NZ business turnover rates are highest in OECD

18 April 2007© THE UNIVERSITY OF WAIKATO • TE WHARE WANANGA O WAIKATO 10
1. The NZ Economy: Current Features• Cost of Living and Government Costs☺• Living (housing) costs are among the lowest in the OECD (except for
Auckland which is the 15th most unaffordable city in English-speaking world).
• Social expenditure relative to GDP in NZ is ranked 21st in OECD
• Total tax revenue relative to GDP is ranked 18th in OECD
• Income tax: NZ is ranked 22nd highest in OECD.
• NZ local government taxes and indirect taxes (GST) are low by OECD levels
• Low property taxes
• Low petrol prices

18 April 2007© THE UNIVERSITY OF WAIKATO • TE WHARE WANANGA O WAIKATO 11
1. The NZ Economy: Current Features
• Education ☺• 15th in OECD for % of university graduates
• NZ 8th highest relative total education expenditure in OECD in 2002
• Education • 1995 NZ tertiary education expenditure relative to GDP was ranked
15th in OECD.
• NZ 25th highest total tertiary education expenditure in OECD in 2004
• Growth in higher education expenditure relative to GDP is lowest in OECD (Aus=13th, UK = 15th, US = 1st)
• Proportion of NZ tertiary studying technical engineering and mathematical subjects is 20th out of 27 countries in the OECD

18 April 2007© THE UNIVERSITY OF WAIKATO • TE WHARE WANANGA O WAIKATO 12
1. The NZ Economy: Current Features• Technology and R&D • NZ has 4th highest % of researchers in population
• NZ annual private sector R&D is ranked 25th in the OECD – less than one third of the OECD average, and including government is ranked 21st.
• Total knowledge activities’ expenditure is ranked 15th out of 18 OECD countries
• Relative R&D share in Finland and Sweden more than five times that of NZ
• NZ broadband penetration is 22nd in OECD, and pricing is ranked 29th
• Number of NZ commercial web-sites per capita are half of OECD average
• Patents per capita = 21st in OECD

18 April 2007© THE UNIVERSITY OF WAIKATO • TE WHARE WANANGA O WAIKATO 13
1. The NZ Economy: Current Features
• Environmental Performance• NZ energy usage per capita is ranked 14th highest in the OECD (Aus
= 2nd, US = 1st)
• NZ energy usage per dollar GDP is ranked 13th highest in OECD (Aus=10th, US=7th).
• NZ ratio of GDP per carbon emissions is ranked 23rd in world (Aus= 41st, Us = 39th). NZ is below all western European countries.
• NZ ratio of cars per people = 0.62 (3rd highest in the world)
• 45.2% of NZ carbon emissions
• Limited public transport
• Local Agenda 21 initiatives: NZ 37, Iceland 37, Luxembourg 69, Australia 176, Denmark 216, Sweden 289, Finland 303, UK 425, Germany 2042

18 April 2007© THE UNIVERSITY OF WAIKATO • TE WHARE WANANGA O WAIKATO 14
2. The NZ Economy: Paradox or Conundrum?
• Until very recently, NZ did not seem to be responding as expected. NZ has fallen from 16th to 22nd (out of 61 countries) in the IMD World Competitiveness Rankings (2006/07). Australia is now 6th.
• Large NZ firms operate with high capital-output ratios – lack of economies of scale
• NZ R&D, technology, productivity per hour worked, and TFP growthare all low
• IMF attributes 75% of the current GDP per capita gap between Australia and NZ as being due to lower capital investment and 25% due to lower factor efficiency utilisation
• An unanswered question is why this situation exists
• A partial answer is due to relatively cheap labour and high capital costs (NZ interest rate premium typically of 0.5% above Aus, 1.4% above UK, 1.7% above US) Does NZ’s growth performance (1984-2004) exhibit an L-shaped or U-shaped trajectory?

18 April 2007© THE UNIVERSITY OF WAIKATO • TE WHARE WANANGA O WAIKATO 15
2. The NZ Economy: Paradox or Conundrum?
“The mystery is why a country that seems close to best practice in most of the policies that are regarded as the key drivers of growth is nevertheless just an average performer.”
OECD (2003) Economic Surveys: New Zealand
• Contrast NZ with another small isolated economy:
“Finland is the most competitive country in the world, despite its rigid labour markets, powerful trade unions, and high tax rates, according to the Global Competitiveness report from the World Economic Forum”.
The Economist, 19.10.01

18 April 2007© THE UNIVERSITY OF WAIKATO • TE WHARE WANANGA O WAIKATO 16
2. The NZ Economy: Paradox or Conundrum?• Why did NZ’s response to reforms take so long relative to other
countries whose reforms were less radical or fundamental, such as UK, Finland, Ireland, Australia or Netherlands
• There are widespread institutional arguments concerning whether the NZ reforms were too radical, insufficiently radical, too fast or too slow. However, such arguments are largely speculative and depend on prior political economy and philosophical positions.
• None of these arguments, however, are broadly consistent with both (i) the observed outcomes (ii) economic theory
• NZ is a highly liberalized, deregulated, and transparent economy, and arguments relating to legal-and regulatory institutions do not provide any coherent explanations with the above observations
• Only if we extend our notions of institutions to include the knowledge generation and exchange relations which exist in the economy can we begin to produce a coherent explanation of the observations

18 April 2007© THE UNIVERSITY OF WAIKATO • TE WHARE WANANGA O WAIKATO 17
2. The NZ Economy: Paradox or Conundrum?
• NZ is not a paradox but rather a conundrum – a riddle with a solution.
• Part of the apparent paradox is the over-emphasis of the perceived role played by deregulation and taxation in generating economic growth.
• A broader argument is related to the issues of scale and geographyin response to the most recent phase of globalization. In particular, geography and scale can provide additional insights regarding the crucial role of externalities in productivity and growth.
• There is now overwhelming evidence that localised knowledge externalities nowadays play a crucial role in labour productivity, as well as both TFP levels and TFP growth.
• The IMF (2004) considers that scale and geographic isolation account for over half of NZ’s low growth in total factor productivity and efficiency

18 April 2007© THE UNIVERSITY OF WAIKATO • TE WHARE WANANGA O WAIKATO 18
3. What is Globalisation?• Perceptions and Features of Globalization• Simultaneous control of production and organisation
• Role of the USA in the capitalist system
• Global branding
• Economic Outcomes of Globalization• Growth in world trade 9.5% p.a.(1970-2002) faster than growth in
global production – and high technology are the fastest growing goods and services
• Multinational firms produce 20 times more patents than domestic firms and grow at 1% p.a. faster
• 25% OECD exports are in high technology goods
• International mobility of capital, firms and people
• Is globalization a new phenomenon? Historically the answer is No but in terms of the most recent phase the answer is -Yes.

18 April 2007© THE UNIVERSITY OF WAIKATO • TE WHARE WANANGA O WAIKATO 19
3. Globalization and The 20th Century Economy
• The 1980s• The “third industrial revolution”: Toyota, Just-In-Time (JIT), Total
Quality Management (TQM)
• Monetarism and Milton Friedman
• Floating Currencies
• Labour flexibility
• New Zealand – Australia: Closer Economic Relationship 1982
• The 1990s onwards• Free trade blocs: EU, NAFTA, ASEAN, MERCOSUR
• Information and Communications Technology ICT
• Global marketplace
• Rapidly increasing labour mobility, flexibility and labour “churn”.

18 April 2007© THE UNIVERSITY OF WAIKATO • TE WHARE WANANGA O WAIKATO 20
3. Globalization and The 20th Century Economy
• In economic terms the 20th century can be divided into four distinct stages.
• 1900 - World War II• Rise of mass production, multinationals
• 1930s Depression
• World War II – 1979• Bretton-Woods system, internal domestic growth, trade restrictions
• 1950s: NZ was the 3rd richest country in the world
• 1970s: oil crisis
18 April 2007© THE UNIVERSITY OF WAIKATO • TE WHARE WANANGA O WAIKATO 21
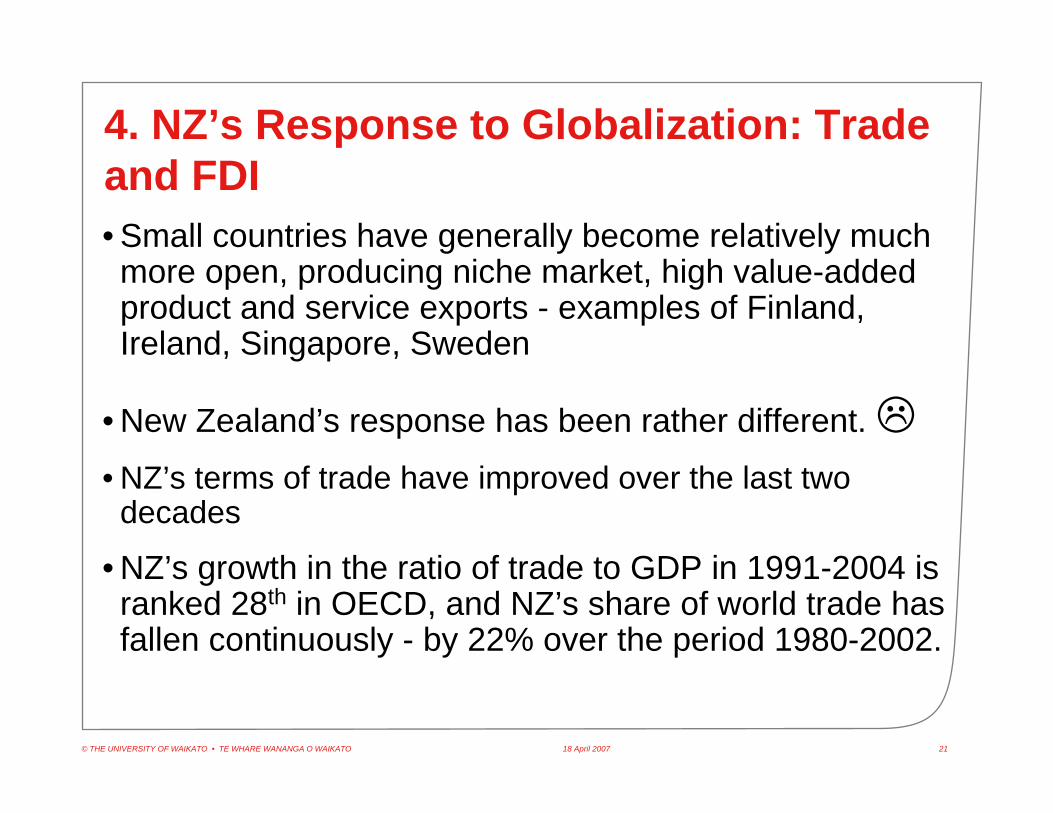
4. NZ’s Response to Globalization: Trade and FDI• Small countries have generally become relatively much more open, producing niche market, high value-added product and service exports - examples of Finland, Ireland, Singapore, Sweden
• New Zealand’s response has been rather different.
• NZ’s terms of trade have improved over the last two decades
• NZ’s growth in the ratio of trade to GDP in 1991-2004 is ranked 28th in OECD, and NZ’s share of world trade has fallen continuously - by 22% over the period 1980-2002.

18 April 2007© THE UNIVERSITY OF WAIKATO • TE WHARE WANANGA O WAIKATO 22
4. NZ’s Response to Globalization: Trade and FDI• Commodity Exports (78% of NZ exports)
• 81% are in low growth sectors.
• Ranked 1st in OECD for low technology exports, and 2nd highest in medium technology exports. Ranked 29th in OECD for high technology exports.
• Little change over 25 years in export composition
• Service Exports (22% of NZ exports)
• Dominated by relatively low growth service export sectors – 83% travel and transport (tourism); 14% higher education
• NZ high value business service exports 17%: 29th in OECD
• Since 1990 NZ has lost market share in 57% of service export sectors by value

18 April 2007© THE UNIVERSITY OF WAIKATO • TE WHARE WANANGA O WAIKATO 23
4. NZ’s Response to Globalization: Trade and FDI• Outward FDI
• 11.9% of GDP in 2005 ~ US12bn
• OECD average is 27%
• Australia 27% UK 65% Finland 40% Denmark 40%
• NZ is 20th out of 23 advanced OECD countries, and recent outflows 2000-2004 are 26th in OECD
• Rate of Return on NZ outward FDI capital is currently 4.2%, and averages only 5% p.a. since 1996

18 April 2007© THE UNIVERSITY OF WAIKATO • TE WHARE WANANGA O WAIKATO 24
4. NZ’s Response to Globalization: Trade and FDI• NZ Foreign Direct Investment (FDI)• Net stock of inward FDI (inward FDI minus outward FDI) is US $40bn
~ 40% of the NZ economy
• Inward FDI ☺• NZ stock of FDI is US $52bn ~ 50% of NZ economy (9th highest in
OECD, and 6th highest in advanced OECD countries)
• NZ’s growth in inward FDI during the 1990s was the 3rd highest and 7th highest in 1980s in the OECD
• NZ rate of return on inward FDI capital is 14.1%, averaging 9% p.a. 1996-2005
• However, annual average inflows 2000-2004 are ranked only 21st in OECD.

18 April 2007© THE UNIVERSITY OF WAIKATO • TE WHARE WANANGA O WAIKATO 25
4. NZ’s Response to Globalization: Trade and FDI
• Outward Openness of the Economy• NZ is a relatively closed economy
• Ratio of Exports/GDP for NZ is 29% - ranks 19th in the OECD
• Little change in the ratio over the last 15 years
• Average value of exports/GDP for small (<10m) OECD countries is 76%.
• Index of Outward Internationalisation: {(exports + outward FDI)/GDP} NZ ranks 25th in OECD
• NZ is the only OECD country to exhibit a declining index of openness

18 April 2007© THE UNIVERSITY OF WAIKATO • TE WHARE WANANGA O WAIKATO 26
4. NZ’s Response to Globalization: Migration
• Labour Immigration ☺• Net flows of ~ 10,000 p.a.
• One in five NZers are immigrants (4th highest in OECD)
• One in 3 current immigrants have university degrees.
• The number of foreign students in NZ has increased steadily since 1994 up to 2005, after which it fell.

18 April 2007© THE UNIVERSITY OF WAIKATO • TE WHARE WANANGA O WAIKATO 27
4. NZ’s Response to Globalization: Migration• Labour Out-Migration• 460,000 NZers live overseas permanently (11.4% of NZ resident
population and 13.7% of NZ-born population), with 70,000 leaving annually. 20,000 annually leaving for Australia.
• 355,000 in Australia, 58,000 in UK
• 24% of NZ highly-skilled workers live and work overseas – the highest in the OECD.
• 32% of NZ-born tertiary-educated live people overseas – the highest in the OECD
• 1998-2005 NZ experienced a net outflow of skilled workers
• Likelihood of remaining overseas increases with level of skill.
• The likelihood of NZ graduates being overseas increased every year 1998-2001, with the likelihood increasing with student loan balances

18 April 2007© THE UNIVERSITY OF WAIKATO • TE WHARE WANANGA O WAIKATO 28
5. Role of Scale and Geography in Economics
• Industrial Clustering and Agglomeration Economies• Knowledge spillovers (Glaeser)
• Increasing input, output and labour market diversity (Fujita, Krugman, Venables)
• Specialist inputs (Marshall)
• Localization economies – v - Urbanization economies (Ohlin, Hoover)

18 April 2007© THE UNIVERSITY OF WAIKATO • TE WHARE WANANGA O WAIKATO 29
5. Role of Scale and Geography in Economics
• Clustering increases competition via mutual transparency (Porter)
• Clustering reduces risks and increases liquidity and trust (Mills)
• Clustering increases trust and cooperation (Scott)
• Clustering and agglomeration maximise innovation(Porter, Chinitz)

18 April 2007© THE UNIVERSITY OF WAIKATO • TE WHARE WANANGA O WAIKATO 30
5. Role of Scale and Geography in Economics
• Reasons for Agglomeration and Growth: Happenstance
• Institutional beneficiaries: Luxembourg, Brussels, Geneva, Zurich
• Technological beneficiaries: San Jose, Seattle, Toulouse, Cambridge UK, Phoenix Arizona
• Location beneficiaries: Rotterdam, Dublin, London, Norway, Australia
18 April 2007© THE UNIVERSITY OF WAIKATO • TE WHARE WANANGA O WAIKATO 31
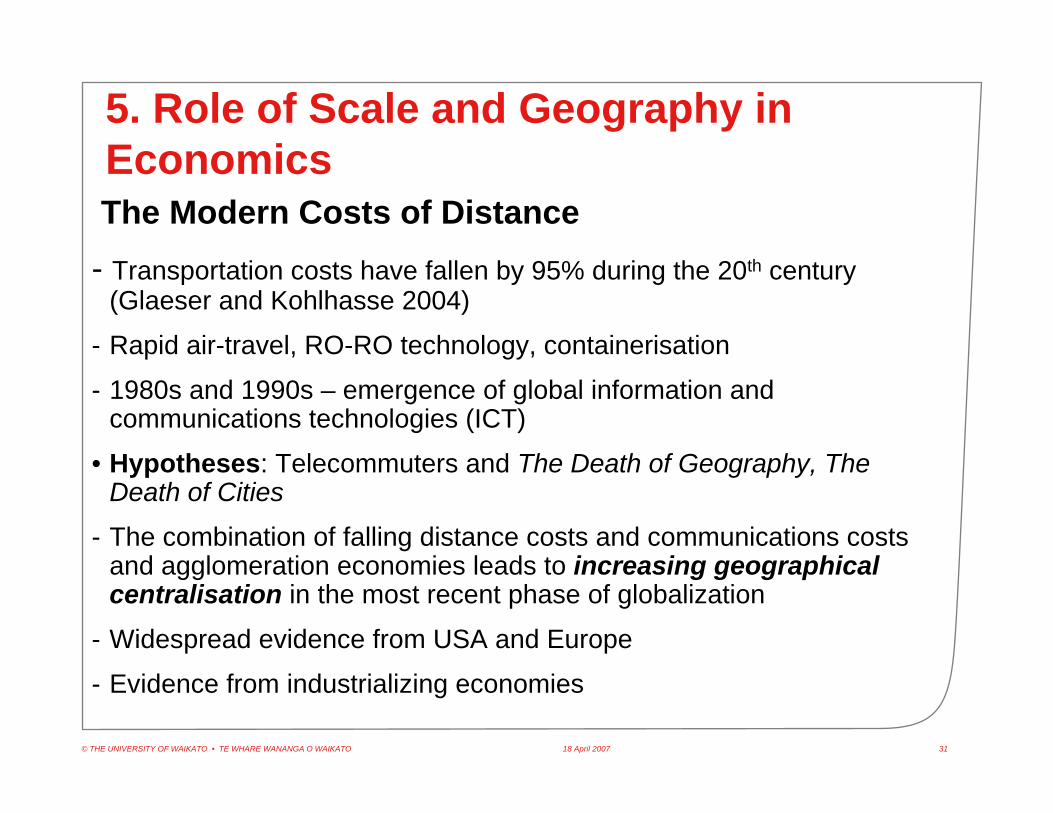
5. Role of Scale and Geography in EconomicsThe Modern Costs of Distance
- Transportation costs have fallen by 95% during the 20th century (Glaeser and Kohlhasse 2004)
- Rapid air-travel, RO-RO technology, containerisation
- 1980s and 1990s – emergence of global information and communications technologies (ICT)
• Hypotheses: Telecommuters and The Death of Geography, The Death of Cities
- The combination of falling distance costs and communications costs and agglomeration economies leads to increasing geographical centralisation in the most recent phase of globalization
- Widespread evidence from USA and Europe
- Evidence from industrializing economies

18 April 2007© THE UNIVERSITY OF WAIKATO • TE WHARE WANANGA O WAIKATO 32
5. Role of Scale and Geography in Economics• Increased Modern Importance of Geographical Proximity and Accessibility (for skilled workers)
• ICT and personal Face-to-Face contact are complements to, and not substitutes for, each other
• ICT, Just-In-Time and personal Face-to-Face contact are all complements to, and not substitutes for, each other
• Rapidly increasing skills-levels in cities (Glaeser and Berry 2005)
• Increased Labour Mobility• Flows of young, highly educated, and equity-poor migrants to London,
Sydney, New York, Auckland, Athens
• Flows of older, equity-rich ‘baby-boomer’ migrants to Queensland, Spain, Greece, Portugal, Florida, Malta, (….but not too far from home!!!)
18 April 2007© THE UNIVERSITY OF WAIKATO • TE WHARE WANANGA O WAIKATO 33
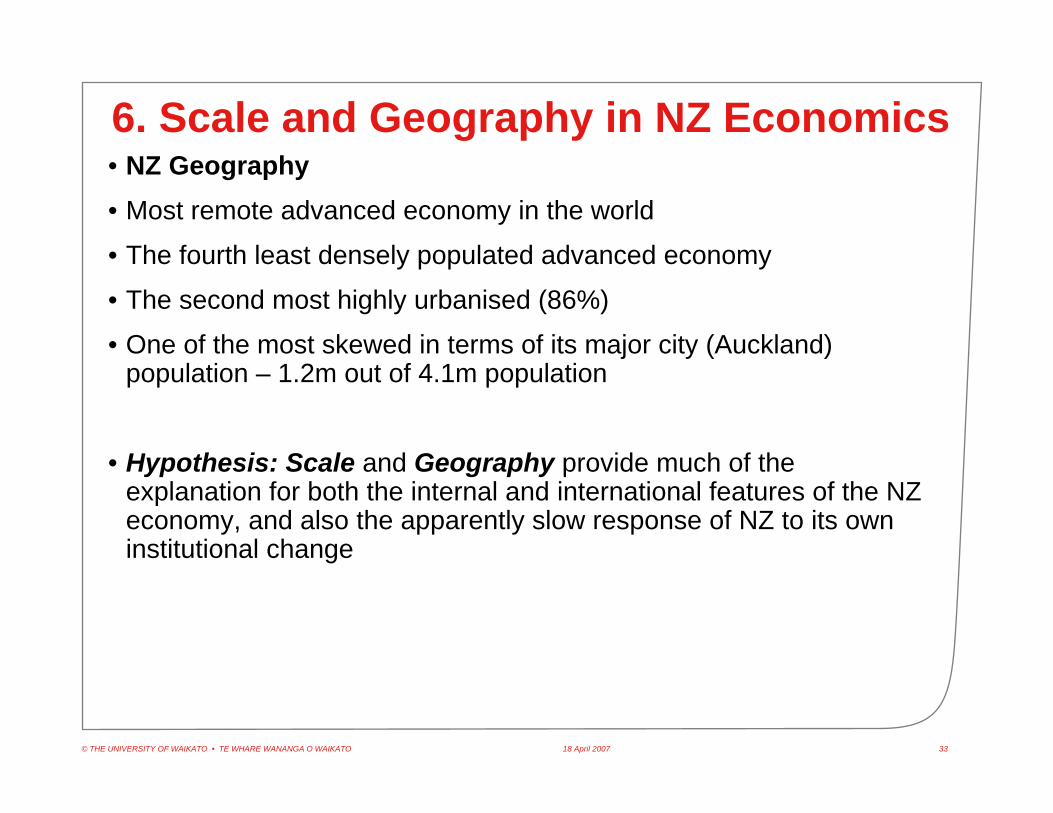
6. Scale and Geography in NZ Economics• NZ Geography• Most remote advanced economy in the world
• The fourth least densely populated advanced economy
• The second most highly urbanised (86%)
• One of the most skewed in terms of its major city (Auckland) population – 1.2m out of 4.1m population
• Hypothesis: Scale and Geography provide much of the explanation for both the internal and international features of the NZ economy, and also the apparently slow response of NZ to its own institutional change

18 April 2007© THE UNIVERSITY OF WAIKATO • TE WHARE WANANGA O WAIKATO 34
6. Scale and Geography in NZ Economics
• Auckland has an increasingly dominant city role in NZ• Auckland accounts for one third of the NZ population and
approximately 40% of the output of NZ
• Auckland is currently the second fastest growing urban area in NZ, and the fastest growing region over the last three decades
• In both NZ and Australia the major urban areas are growing, and the rural areas are shrinking – both in terms of population and relative income per capita
• The central areas are growing and the peripheral areas are shrinking.
• Is Auckland a “world city”?- Yes possibly - in terms of labour prices (Auckland and Wellington)
- Yes possibly - in terms of airline routes (Auckland and Wellington)
- No - in terms of role, economic structure or behaviour

18 April 2007© THE UNIVERSITY OF WAIKATO • TE WHARE WANANGA O WAIKATO 35
Fig 1. Directions of Economic Linkages: London and the UK
London US $ 330bn
UK Economy US $ 1.8 trillion
Global Economy US 37 Trillion

18 April 2007© THE UNIVERSITY OF WAIKATO • TE WHARE WANANGA O WAIKATO 36
Fig 2. Directions of Economic Linkages: New York and USA
New York ≈US $ 330bn
US Economy ≈US $11.7trillion
Global Economy ≈US 37 Trillion

18 April 2007© THE UNIVERSITY OF WAIKATO • TE WHARE WANANGA O WAIKATO 37
Fig 3. Directions of Economic Linkages: Sydney and Australia
Sydney ≈US $ 125bn
Australasian Economy ≈US 732bn
Global Economy ≈US 37 Trillion

18 April 2007© THE UNIVERSITY OF WAIKATO • TE WHARE WANANGA O WAIKATO 38
Fig 4. Directions of Economic Linkages: Auckland and New Zealand
Auckland ≈US $ 35bn
NZ Economy ≈US 100bn
Global Economy ≈US 37 Trillion

18 April 2007© THE UNIVERSITY OF WAIKATO • TE WHARE WANANGA O WAIKATO 39
Fig 5. The Traditional Hierarchical Organization of Operations in Cities and Countries
London HQ
Sydney Country HQ
Rest of Australia
Auckland Country HQ
Rest of New Zealand
Hong Kong
Rest of Asia

18 April 2007© THE UNIVERSITY OF WAIKATO • TE WHARE WANANGA O WAIKATO 40
London HQ
Sydney Country HQ
Rest of Australia
Auckland Country HQ
Rest of New Zealand
Hong Kong
Rest of Asia
Fig 6. The Emerging Hierarchical Organization of Operations in Cities and Countries

18 April 2007© THE UNIVERSITY OF WAIKATO • TE WHARE WANANGA O WAIKATO 41
6. Scale and Geography in NZ Economics• We need to think in terms of a hierarchical system of cities and
regions which spans across international boundaries
• Auckland is linked to Sydney in a manner analogous that Sydney is linked to Kong Kong, Singapore or London
• Wellington and Christchurch are linked to Auckland in a similarmanner
• Peripheral NZ regions are linked to Wellington, Christchurch andAuckland
• Out-migration from rural and peripheral regions to major urban centres – both within and between countries
• Migration is associated with human capital and thus migration and growth are interrelated
• 80% of Australian creative human capital is associated with people aged 22-40 years
18 April 2007© THE UNIVERSITY OF WAIKATO • TE WHARE WANANGA O WAIKATO 42
7. The New Zealand Policy Arena
• The Goal of Economic Transformation is to reverse:
- the outward movement of many of the top NZ jobs
- the increasing outflows of skilled university graduates (with relatively very high NZ education debts)
- NZ’s weak export performance

18 April 2007© THE UNIVERSITY OF WAIKATO • TE WHARE WANANGA O WAIKATO 43
7. The New Zealand Policy Arena
• The Policy Dilemma• Alternative (1): Expansion of Auckland as an export centre
– infrastructure expansion
• Alternative (2): Local regional initiatives to foster local innovation
• Alternative (3): Industry “picking winners” – bio-technology, agri-business, ICT
• Alternative (4): Creating an Australasian dollar
• Alternative (4): Do nothing

18 April 2007© THE UNIVERSITY OF WAIKATO • TE WHARE WANANGA O WAIKATO 44
7. The New Zealand Policy Arena• NZ Growth and Innovation Framework: Growing an Innovative New Zealand (2002) MED
• Theme of sustainable development - working definition:• “meeting the needs of the present generation without compromising
the ability of future generations to meet their own needs”.
• Three core elements of:
• (i) Integration across the dimensions of well-being –economic, social cultural and environmental
• (ii) Consideration of the long-term implications of decisions
• (iii) ‘Inclusivity’ – the importance of citizen participationand inter-sectoral partnerships

18 April 2007© THE UNIVERSITY OF WAIKATO • TE WHARE WANANGA O WAIKATO 45
7. The New Zealand Policy Arena
• Implementation Strategy• (a) GIF Task Forces – private sector ideas regarding
‘enabling sectors’ of ICT, bio-technology and creative industries
• (b) Growth and Innovation Advisory Board (GIAB) –independent perspectives regarding agri-business, infrastructure, growth culture
• (c) Regional Partnerships Programme RPP – ‘new regionalism’ ~ 70 local economic development agencies
• (d) Auckland Regional Economic Development Strategy (AREDS)

18 April 2007© THE UNIVERSITY OF WAIKATO • TE WHARE WANANGA O WAIKATO 46
7. The New Zealand Policy Arena
• Three Questions regarding the current Growth and Innovation Framework:
• (1) Is strategy transformational enough?
• (2) Are the goals mutually consistent or conflicting?
• (3) Are the outcomes realistic?
• Assessments:• (1) Auckland is too small to act as a major export base –
not transformational. Also, problem of public perceptions for and against Auckland
• (2) The RPP scheme is very important, but not transformational due to small scale effects

18 April 2007© THE UNIVERSITY OF WAIKATO • TE WHARE WANANGA O WAIKATO 47
7. The New Zealand Policy Arena• This leaves only three realistic alternatives for economic transformation, neither of which are really discussed openly:
• (3) Picking winners
• (4) Establishing an Australasian currency
• (5) Do nothing
• Picking Winners – for high value-added agricultural exports
• Picking winners is a policy with a very chequered past history in NZ – but many nations (Ireland, USA, UK, Finland, France) are doing it by the ‘back door’ - as a means of retaining and expanding human capital, physical capital and technology

18 April 2007© THE UNIVERSITY OF WAIKATO • TE WHARE WANANGA O WAIKATO 48
7. The New Zealand Policy Arena• NZ already has a huge platform in agricultural exports,
which is a basis for further exports based on bio-technology and ICT applied to agri-business
• Problem of New Zealand’s GE moratorium – is it out of step with other OECD countries? The costs of this moratorium are really opportunity costs.
• Lifting the moratorium is a topic almost never discussed in the popular press.
• Establishing an Australasian Currency• This is a topic rarely discussed in the popular NZ press.

18 April 2007© THE UNIVERSITY OF WAIKATO • TE WHARE WANANGA O WAIKATO 49
7. The New Zealand Policy Arena
• The notions of well-being and sustainability• well-being and sustainability can be simple concepts that everyone
can sign up to and agree with. As such that are of no real use for decision-making
• Alternatively, asking questions about well-being and sustainabilitycan pose a challenge to define exactly what society really thinks about fundamental issues and the direction of the country in the long run
• There is a problematic relationship between perceptions of economic growth (ranked 10th out of 12) and other aspects of life in NZ such as quality of life, education, and environment
• Growth and inequality do not necessarily go hand-in-hand
• The recent effects of 1990s globalisation have not dealt New Zealand a good hand – happenstance – but what New Zealanders choose to do with their hand in future is the real issue for discussion.