glowworm attack: optical tempest sound recovery via a
TRANSCRIPT

Glowworm Attack: Optical TEMPEST SoundRecovery via a Device’s Power Indicator LED
Ben Nassi, Yaron Pirutin, Tomer Galor, Yuval Elovici, Boris ZadovBen-Gurion University of the Negev
{nassib, yaronpir, tomercg, elovici, zadov}@post.bgu.ac.ilWebsite - https://www.nassiben.com/glowworm-attack
Video - https://www.youtube.com/watch?v=z4-OFLTHtiw
Abstract—Two main classes of optical TEMPEST attacksagainst the confidentiality of information processed/delivered bydevices have been demonstrated in the past two decades; the firstclass includes methods for recovering content from monitors, andthe second class includes methods for recovering keystrokes fromphysical and virtual keyboards. In this paper, we identify a newclass of optical TEMPEST attacks: recovering sound by analyzingoptical emanations from a device’s power indicator LED. Weanalyze the response of the power indicator LED of variousdevices to sound and show that there is an optical correlationbetween the sound that is played by connected speakers and theintensity of their power indicator LED due to the facts that: (1)the power indicator LED of various devices is connected directlyto the power line, (2) the intensity of a device’s power indicatorLED is correlative to the power consumption, and (3) manydevices lack a dedicated means of countering this phenomenon.Based on our findings, we present the Glowworm attack, anoptical TEMPEST attack that can be used by eavesdroppersto recover sound by analyzing optical measurements obtainedvia an electro-optical sensor directed at the power indicatorLED of various devices (e.g., speakers, USB hub splitters, andmicrocontrollers). We propose an optical-audio transformation(OAT) to recover sound in which we isolate the speech fromoptical measurements obtained by directing an electro-opticalsensor at a device’s power indicator LED Finally, we test theperformance of the Glowworm attack in various experimentalsetups and show that an eavesdropper can apply the attackto recover speech from speakers’ power LED indicator withgood intelligibility from a distance of 15 meters and with fairintelligibility from 35 meters.
I. INTRODUCTION
Optical TEMPEST attacks [1], which are methods aimedat recovering information from systems through optical sideeffects, pose a great risk to privacy. In the past two decades,various studies have demonstrated novel techniques for recov-ering/extracting information from victim devices using opticalsensors by exploiting the correlation between the optical sideeffects of the information and the device that is used todeliver/process the information. In this context, two mainclasses of attacks were introduced; the first class includesmethods for recovering content from monitors [2–4]. Thesecond class includes methods for recovering keystrokes fromphysical and virtual keyboards [5–11]. In these studies, opticaldata that was obtained directly from the victim device’s opticalemanations (e.g., [2]) or indirectly from reflections of thevictim device’s optical emanations on nearby objects (e.g.,[3, 4]) was used to recover the desired information from a
victim device. These studies have contributed to improvedunderstanding regarding the risks posed by optical TEMPESTattacks.
In this paper, we identify a new class of optical TEMPESTattacks: sound recovery by analyzing optical emanations ob-tained from a device’s power indicator LED. We show thatthe power indicator LED of various devices leaks informationregarding the sound played by connected speakers. This occursin devices whose power indicator LED is connected directly tothe device’s power line and lack integrated voltage stabilizers.As a result, the optical response (intensity) of the powerindicator LED of such devices is correlative to the powerconsumed by the device. This fact can be exploited to recoversound from the connected speakers directly, by obtainingoptical measurements via an electro-optical sensor directed atthe speakers’ power indicator LED, or indirectly, by obtainingoptical measurements via an electro-optical sensor directed atthe power indicator LED of the device used to supply powerto the speakers (e.g., USB hub, microcontrollers).
Previous studies have discussed the risks a device’s powerindicator LED can pose to the information delivered/processedby the device due to the linear response of the power indicatorLED [12, 13]. This fact was exploited in some studies toestablish covert channels by using a preinstalled malware thatmodulated the data via a device’s power indicator LED [14–16], however no prior work was able to demonstrate end-to-end sound recovery from a commercial device’s powerindicator LED without the use of malware. Other studies [17–20] presented optical methods for recovering sound by turningnearby objects into diaphragms (e.g., a hanging light bulb[17], bag of chips [18], trash can [19], glass window [20]).In these studies, sound was recovered by obtaining opticalmeasurements from vibrating objects (objects vibrate whensound waves hit their surface). However, each of these methods[17–20] suffer from one or more of the following limitations:(1) they are limited in range (the nearby vibrating object mustbe within five centimeters of the sound source [17, 18]), (2)their application can be detected by an optical sensor (becausethey require the eavesdropper to direct a laser beam intothe victim’s room [19]), (3) they require the eavesdropper tocompromise a device with malware (to stop the LiDAR fromturning so it can target a specific point or to exifltrate the col-lected data via the Internet [19]). In addition, all of the methodstarget the optical changes resulting from minuscule vibrations

2
of nearby objects that were affected by sound hitting theirsurface. We consider these methods to be optical side-channelattacks rather than optical TEMPEST attacks, because they donot target the optical correlation between the information andthe device used to deliver/process the information. A recentpaper presented a state-of-the-art sound recovery method [21]using an EMR (electromagnetic radiation) TEMPEST attackagainst devices that contain an MSOC (mixed-signal system-on-chip) with an integrated switching regulator from a distanceof 15 meters, however, to the best of our knowledge, no studyhas proposed a method capable of recovering sound from adevice at distances greater than 15 meters using a TEMPESTattack.
In this paper, we present the Glowworm attack, an opticalTEMPEST attack aimed at recovering sound played by com-mercial speakers. First, we analyze speakers and show that theintensity of their power indicator LED is affected by playedaudio. Then, we analyze various devices (USB hub splitter,micro-controller) used to supply power for the speakers andshow that the intensity of the devices’ power indicator LEDis also affected by audio played by the speakers. Then, wesuggest an optical-audio transformation (OAT) to isolate thesound from the optical signal obtained via an electro-opticalsensor directed at the power indicator LED of the devices.Finally, we examine the performance of the Glowworm attackin various experimental setups. We show that it can be used byan eavesdropper to recover speech from virtual meetings byobtaining optical measurements directly from the power LEDindicator of speakers with good intelligibility from a distanceof 15 meters and with fair intelligibility from 35 meters.
In this paper, we make the following contributions: (1) Wereveal a new class of optical TEMPEST attack that violatesthe confidentiality of the information processed/delivered bydevices; the attack should be addressed by hardware man-ufacturers and considered by consumers. (2) We show thatoptical TEMPEST attack can recover sound from a device atgreater distances (35 meters) than an existing SOTA methodthat used an EMR (Electro-Magnetic Radiation) TEMPESTattack (whose range was limited to 15 meters) [21]. (3) Wepropose a new method for recovering speech that is external(obtains data without compromising a device in the targetroom), passive (does not rely on an active sensor), and doesnot depend on the distance between a sound source and anearby object.
The remainder of the paper is structured as follows: InSection II, we review related work. In Section III, we presentthe threat model. In Section IV, we analyze the response of adevice’s power indicator LED to sound played by speakers.In Section V, we present an optical audio transformation(OAT) for recovering sound, and in Section VI, we evaluateGlowworm’s performance on the task of recovering sound.In Section VII, we discuss potential improvements that canbe made to optimize the quality of the sound recovered byan eavesdropper. In Section VIII, we suggest countermea-sure methods that can be applied to prevent the proposedGlowworm attack. In Section IX, we present the responsibledisclosure we made. In Section X, we discuss the limitationsof the attack and mention future work directions.
II. RELATED WORK
In this section, we review related work in the area of opticaldata leakage and sound eavesdropping. TEMPEST attackshave attracted the interest of many researchers since Van Eck’spaper was published in the mid-1980s [22]. The last threeand a half decades have seen the development of variousmethods for extracting information from devices by exploitingthe correlation between the information delivered/processedby a device and its: EMR emanations (e.g., [21, 23–28]),acoustic emanations (e.g., [29–36]), vibrations (e.g., [37–42]), and power consumption (e.g., [43–45]). In the past twodecades, two main classes of optical TEMPEST attacks wereintroduced; the first class includes methods for recoveringcontent from monitors [2–4], and the second class includesmethods for recovering keystrokes from physical and virtualkeyboards [5–11]. In these studies, optical data that wasobtained directly from the victim device’s optical emanations(e.g., [2]) or indirectly from reflections of the victim device’soptical emanations on nearby objects (e.g., [3, 4]) was usedto recover the desired information from a victim device.
The risks posed by a device’s power indicator LED werediscussed by [12, 13]. However, prior research demonstratingmethods capable of exploiting a device’s power indicator LEDfor data exifltration relied on preinstalled malware to establishoptical covert channels [14–16]. The proposed methods leakdata from devices that are connected to air-gapped networks byusing preinstalled malware that modulated data optically viathe integrated LED of a device (e.g., a keyboard [16], router[15], hard drive [14]).
Recent studies have investigated sound eavesdropping [37–40, 46–48], suggesting various methods for recovering soundby analyzing the side effects of sound waves that causednearby lightweight objects (e.g., a bag of chips, a window)and devices (e.g., motion sensors) to vibrate (turning suchobjects/devices to diaphragms). In this context, malware wasused to recover sound by: (1) obtaining data from a device’smotion sensors [37–40], (2) reprogramming a computer’saudio port from output to input [47], (3) inverting the processof a vibration motor [46], and (4) analyzing magnetic dataobtained from a hard disk head [48]. These methods pose aserious threat to privacy, but they require the eavesdropper tocompromise a device (with malware) located near the victim(sound source) in order to obtain data and exfiltrate it to theeavesdropper.
Optical methods for sound recovery were introduced by[17–20]. A recent study demonstrated a method capable ofclassifying words from a precollected dictionary, by analyzingthe vibrations of a trash can using optical data obtained viaa robotic vacuum cleaner’s LiDAR. This method requires theeavesdropper to compromise the robotic vacuum cleaner inorder to: (1) prevent the LiDAR from turning and fix theLiDAR on a specific object to increase the amount of datacollected from the vibrating object (because the frequency ofa robotic vacuum cleaner’s 360◦ LiDAR is limited to 7 Hz),and (2) exfiltrate the data from the robotic vacuum cleaner.Three studies [17, 18, 20] presented external optical methodsto recover sound that rely on data obtained via optical sensors,

3
Fig. 1. Glowworm’s threat model: The sound snd(t) of the virtual meeting (1) which is played by the connected speakers creates changes in the powerconsumption of the power indicator LED of a (2) connected peripheral (e.g., the speakers themselves, a USB hub splitter). The eavesdropper directs anelectro-optical sensor at the power indicator LED of a connected peripheral using a telescope (3). The optical signal opt(t) is sampled from the electro-opticalsensor via an ADC (4) and processed, using an algorithm to recover the acoustic signal snd∗(t) (5).
without the use of malware. The laser microphone [20, 20] is awell-known method that recovers sound using an external lasertransceiver in which a laser beam is directed through a windowinto a target room; the laser beam is reflected off an object andreturned to the transceiver which then converts the beam to anaudio signal. The visual microphone [18] recovers sound byanalyzing the vibrations of material inside the victim’s room(e.g., a bag of chips, water) using video obtained from a high-speed video camera (2200 FPS) to recover speech. Lamphone[17] recovers sound using a remote electro-optical sensor byexploiting the vibrations of a hanging light bulb; the vibrationscause optical changes due to the non-uniform intensity of light-ing, which varies at each angle. These methods [17, 18, 20]pose a great privacy threat, however from an eavesdropper’sperspective, they are limited in one of the following ways: theyrely on (1) a very high sound level (over 100 dB) which isbeyond the sound level of speech and meetings (e.g., [17, 18]),(2) active sensors that use a laser beam (e.g., [20]), a factthat increases the likelihood of detection (compared to passivesensors), (3) hanging light bulbs, which are not commonlyused in office settings today (e.g., Lamphone [17]), or (4)specialized equipment for spying [20], a fact that may limittheir availability in some countries (limiting the sale of suchequipment to, e.g., police departments).
III. THREAT MODEL
In this section, we describe the threat model and explainits significance with respect to other methods. The Glowwormattack targets the speech of participants in virtual meeting plat-forms (e.g., Zoom, Google Meet, Skype, Microsoft Teams).During the COVID-19 pandemic, these platforms became apopular way for people to meet and share information; per-sonal and valuable information is routinely exchanged whenthese platforms are used for personal and business meetings.
We assume that an individual is located inside a room oroffice and using his/her computer to conduct a virtual meetingwith another person (or a group) using a virtual meetingplatform. The purpose of the conversation can vary, for ex-ample, the individuals may want to discuss business (e.g.,sharing something with a client or colleague) or somethingof a personal nature (e.g., talking about medical test resultswith a doctor).
We consider an eavesdropper that is a malicious entityinterested in recovering speech from meetings and using thevaluable information discussed in the meeting for a malicious
purpose that may include spying on individuals (e.g., to obtainsensitive information that can be used for blackmail) or spyingon an organizations (e.g., to obtain a company’s IP anduse it to give a competitor an advantage). We assume theeavesdropper is located within 35 meters of the target room.The eavesdropper can be: (1) a person located in a room in anadjacent building, (2) a person in a nearby car. We considerthis threat as highly probable in the COVID-19 era due tothe number of personal and business meetings being held inunsecured settings, including home offices.
In order to recover the sound in this scenario, the eaves-dropper performs the Glowworm attack. We assume that thea power indicator LED of a vulnerable device is visible fromoutside the room/office. We consider two types of attacks: (1)a direct attack, where the eavesdropper recovers sound fromthe power indicator LED of the speakers, and (2) an indirectattack, where the eavesdropper recovers sound from the powerindicator LED of the device used to provide the power to thespeakers (e.g., a connected USB hub, a microcontroller). Notethat the Glowworm attack can be applied by eavesdroppersto recover: (1) the speech of any person speaking to thevictim during a virtual meeting, and (2) any sound (e.g., musicfrom YouTube, videos from the Internet) that is played by thespeakers during the virtual meeting, which may or may not berelated to the meeting; in this paper, we present the attack inthe context of recovering speech from a virtual meeting.
The main components used to perform the Glowworm attackare: (1) A telescope - This piece of equipment is used to focusthe field of view on a device’s power indicator LED from adistance. (2) An electro-optical sensor - This sensor is mountedon the telescope and consists of a photodiode that convertslight into an electrical current; the current is generated whenphotons are absorbed in the photodiode. (3) A sound recoverysystem - This system receives an optical signal as input andoutputs the recovered acoustic signal. The eavesdropper canimplement such a system with: (a) dedicated hardware (e.g.,using capacitors, resistors), or (b) the use of ADC to samplethe electro-optical sensor and process the data using a soundrecovery algorithm running on a laptop. In this study, we usethe latter digital approach.
Fig. 1 outlines the threat model: The sound snd(t) playedby the speakers in the victim’s room results in changes in thepower consumption due to the direct connection of the powerindicator LED to the input power line and the device’s lackof voltage stabilizers. These changes in power consumption
4
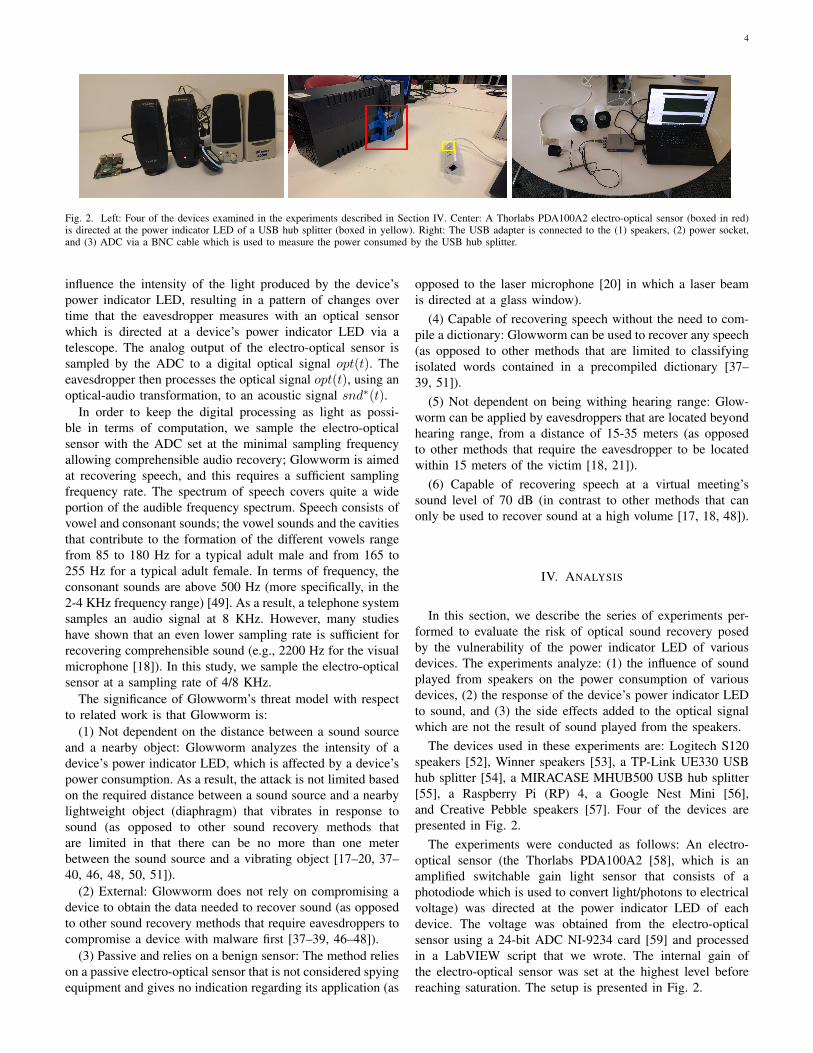
Fig. 2. Left: Four of the devices examined in the experiments described in Section IV. Center: A Thorlabs PDA100A2 electro-optical sensor (boxed in red)is directed at the power indicator LED of a USB hub splitter (boxed in yellow). Right: The USB adapter is connected to the (1) speakers, (2) power socket,and (3) ADC via a BNC cable which is used to measure the power consumed by the USB hub splitter.
influence the intensity of the light produced by the device’spower indicator LED, resulting in a pattern of changes overtime that the eavesdropper measures with an optical sensorwhich is directed at a device’s power indicator LED via atelescope. The analog output of the electro-optical sensor issampled by the ADC to a digital optical signal opt(t). Theeavesdropper then processes the optical signal opt(t), using anoptical-audio transformation, to an acoustic signal snd∗(t).
In order to keep the digital processing as light as possi-ble in terms of computation, we sample the electro-opticalsensor with the ADC set at the minimal sampling frequencyallowing comprehensible audio recovery; Glowworm is aimedat recovering speech, and this requires a sufficient samplingfrequency rate. The spectrum of speech covers quite a wideportion of the audible frequency spectrum. Speech consists ofvowel and consonant sounds; the vowel sounds and the cavitiesthat contribute to the formation of the different vowels rangefrom 85 to 180 Hz for a typical adult male and from 165 to255 Hz for a typical adult female. In terms of frequency, theconsonant sounds are above 500 Hz (more specifically, in the2-4 KHz frequency range) [49]. As a result, a telephone systemsamples an audio signal at 8 KHz. However, many studieshave shown that an even lower sampling rate is sufficient forrecovering comprehensible sound (e.g., 2200 Hz for the visualmicrophone [18]). In this study, we sample the electro-opticalsensor at a sampling rate of 4/8 KHz.
The significance of Glowworm’s threat model with respectto related work is that Glowworm is:
(1) Not dependent on the distance between a sound sourceand a nearby object: Glowworm analyzes the intensity of adevice’s power indicator LED, which is affected by a device’spower consumption. As a result, the attack is not limited basedon the required distance between a sound source and a nearbylightweight object (diaphragm) that vibrates in response tosound (as opposed to other sound recovery methods thatare limited in that there can be no more than one meterbetween the sound source and a vibrating object [17–20, 37–40, 46, 48, 50, 51]).
(2) External: Glowworm does not rely on compromising adevice to obtain the data needed to recover sound (as opposedto other sound recovery methods that require eavesdroppers tocompromise a device with malware first [37–39, 46–48]).
(3) Passive and relies on a benign sensor: The method relieson a passive electro-optical sensor that is not considered spyingequipment and gives no indication regarding its application (as
opposed to the laser microphone [20] in which a laser beamis directed at a glass window).
(4) Capable of recovering speech without the need to com-pile a dictionary: Glowworm can be used to recover any speech(as opposed to other methods that are limited to classifyingisolated words contained in a precompiled dictionary [37–39, 51]).
(5) Not dependent on being withing hearing range: Glow-worm can be applied by eavesdroppers that are located beyondhearing range, from a distance of 15-35 meters (as opposedto other methods that require the eavesdropper to be locatedwithin 15 meters of the victim [18, 21]).
(6) Capable of recovering speech at a virtual meeting’ssound level of 70 dB (in contrast to other methods that canonly be used to recover sound at a high volume [17, 18, 48]).
IV. ANALYSIS
In this section, we describe the series of experiments per-formed to evaluate the risk of optical sound recovery posedby the vulnerability of the power indicator LED of variousdevices. The experiments analyze: (1) the influence of soundplayed from speakers on the power consumption of variousdevices, (2) the response of the device’s power indicator LEDto sound, and (3) the side effects added to the optical signalwhich are not the result of sound played from the speakers.
The devices used in these experiments are: Logitech S120speakers [52], Winner speakers [53], a TP-Link UE330 USBhub splitter [54], a MIRACASE MHUB500 USB hub splitter[55], a Raspberry Pi (RP) 4, a Google Nest Mini [56],and Creative Pebble speakers [57]. Four of the devices arepresented in Fig. 2.
The experiments were conducted as follows: An electro-optical sensor (the Thorlabs PDA100A2 [58], which is anamplified switchable gain light sensor that consists of aphotodiode which is used to convert light/photons to electricalvoltage) was directed at the power indicator LED of eachdevice. The voltage was obtained from the electro-opticalsensor using a 24-bit ADC NI-9234 card [59] and processedin a LabVIEW script that we wrote. The internal gain ofthe electro-optical sensor was set at the highest level beforereaching saturation. The setup is presented in Fig. 2.

5
Fig. 3. The six spectrograms on the right are obtained from power (upper row) and optical (bottom row) measurements of three devices when the speakersplayed a frequency scan (0-4 KHz) on the left.
A. Understanding How Played Sound Affects the Power Con-sumption
Here we explore the effect of played sound on a device’spower consumption and show that it linearly affects thedevice’s power indicator LED due to the fact that hardwaremanufacturers do not integrate any voltage stabilizers or filtersin some products. We show that optical measurements can beused to recover sound using an electro-optical sensor directedat a device’s power indicator LED and eliminate any otherreasonable side effects that could explain this phenomenon.
1) How Played Sound Affects a Device’s Power Consump-tion and the Intensity of Its Power Indicator LED
Here, we show that the intensity of a device’s powerindicator LED is highly correlated with the device’s powerconsumption.
Experimental Setup: We created a USB adapter that allowsus to obtain power measurements from any device with aUSB input connector (the connector can be seen in Fig.2). We conducted three experiments. In the first experiment,the Logitech speakers’ USB was connected to the adapterwhich was connected directly to the electricity. In the secondexperiment, the Logitech speakers’ USB was connected to theTP-Link USB hub splitter. The input USB connector of theUSB hub splitter was connected to the adapter which wasconnected to a PC. In the third experiment, the Logitechspeakers’ USB was connected to the RP. The input microUSB connector of the RP was connected to the adapter whichwas connected to the electricity. In all of these experiments,the audio was played via the speakers (at 70 dB). The audioplayed from the speakers is a 30 second audio file that consistsof a chirp function (a frequency scan between 0-4 KHz). Weobtained optical measurements via the electro-optical sensorwhich was directed at the power indicator LED of the speakers(in the first experiment), the USB hub splitter (second exper-iment), and the RP (third experiment). In addition, in each ofthe experiments, we obtained power measurements from theadapter by connecting it to a BNC cable that was connected toa 24-bit ADC NI-9234 card [59]. The ADC was used to obtainoptical and electrical measurements simultaneously from eachtested device.
Results: Fig. 3 presents (1) three spectrograms extractedfrom the optical signal, and (2) three spectrograms extractedfrom the power signal. As can be seen, the chirp functionplayed by the speakers affected the power consumption of allthree devices. In the case of the RP, the frequency scan thatwas played by the speakers (0-4 KHz) can be spotted in thepower consumption signal). In the cases of the TP-Link USBhub splitter and Logitech speaker, a frequency scan between0-8 KHz can be seen in the power consumption signal (wediscuss this phenomenon later in this section). Moreover, asshown in Fig. 3, the intensity of the power indicator LED ofthe devices is perfectly correlated with the power consumedby the devices (excluding some optical noise which will bediscussed later in the paper).
Conclusions: Based on these experiments, we concludedthat: (1) The power consumed by the three devices correlateswith the sound that the speakers play and the intensity oftheir power indicator LED. (2) The manufacturers of thesedevices do not distort/change the known linear response of theintensity of an LED to power consumption [12] by integratingfilters and voltage stabilizers into the electrical circuits. (3)The power consumed by the speakers influences the devicesproviding the power to the speakers (e.g., USB hub splitter,RP). (4) The linear correlation between the power consumedby the device, the audio played, and the intensity of the powerindicator LED of the devices shows sound can be recovered byobtaining optical measurements via an electro-optical sensordirected at a device’s power indicator LED.
2) Ruling Out Other Possible Side EffectsOne might argue that the optical measurements could be
affected by a phenomenon unrelated to the changes in theintensity of a device’s power indicator LED. For example, onereasonable argument is that electromagnetic radiation emittedfrom the device was captured by the electro-optical sensor.Another reasonable argument is that the optical sensor capturesminuscule vibrations of the power indicator LED caused bythe device’s vibrations due to the sound waves produced fromthe speakers. In order to disprove these claims, we conductedthe following set of experiments.
Experimental Setup: We placed an RP on a table and

6
Fig. 4. From left to right: Spectrograms obtained from optical measurements when the RP’s power indicator LED was visible (first) and covered (second).Spectrograms obtained from gyroscope measurements for three axes.
directed the electro-optical sensor at its power indicator LEDfrom a distance of one meter (through a telescope with a 15 cmlens diameter). We connected the USB cable of the Logitechspeakers to the RP which was connected to the electricity onthe other end. The speakers were placed on a different surfacethan the RP in order to eliminate any vibration resulting fromthe sound waves produced by the speakers. The speakersplayed an audio file consisting of a chirp function which isa frequency scan between 200-400 Hz.
We conducted the following three experiments: In thefirst experiment, we obtained optical measurements when theelectro-optical sensor was directed at the RP, however we cov-ered the device’s power indicator LED with tape (to examinewhether the played signal appears in the optical measurementsand rule out any effect of EMR). In the second experiment, weattached a gyroscope (MPU-6050 GY-521 [60]) to the RP tomeasure its vibrations (to examine whether the played signalappears in the gyroscope measurements and rule out any effectof vibration). We obtained measurements from the gyroscopevia another RP which was used to sample the gyroscope at1000 Hz. In the third experiment, we obtained optical mea-surements when the electro-optical sensor was directed at theRP’s power indicator LED (in order to prove that the playedsignal can be identified in the optical measurements). Thethird experiment was performed for the purpose of validation.The frequency band tested in these experiments (200-400 Hz)was chosen, since the maximum sampling rate our gyroscopeprovided was 1000 Hz, which means that only frequenciesbelow 500 Hz can be measured.
Results: The results are presented in Fig. 4. As can be seen,the frequency scan appears in the spectrogram obtained fromthe optical measurements when a device’s power indicatorLED is visible. However, the frequency scan cannot be spottedin the spectrograms obtained from (1) the optical measure-ments when a device’s power indicator LED is covered, or (2)the gyroscope measurements in each of the three axes.
Conclusions: Based on these experiments, we concludedthat (1) the optical measurements are not affected by elec-tromagnetic radiation (if they were, the frequency scan wouldhave appeared in the spectrogram when the power indicatorLED was covered with tape); and (2) the optical measurementsare not affected by the vibration caused by the sound wavesproduced from the speakers (if they were, the frequency scanwould have appeared in the spectrograms obtained from thegyroscope on at least one of the three axes). These experimentsprove that the frequency scan in the optical measurementsobtained from a device’s visible power indicator LED is the
Fig. 5. FFT graphs extracted from optical measurements of the powerindicator LED of various devices when no sound was played. The frequencyof the LED (100 Hz) can be seen in the graph for each device.
result of changes in a device’s power consumption whichlinearly affect the intensity of the LED.
B. Exploring the Optical Response
Here we explore the recovered optical signal, including thebaseline, side effects added, and SNR (signal-to-noise ratio).
1) Characterizing the Optical Signal When No Sound IsPlayed
Here we examine the characteristics of the optical signalwhen no sound is played.
Experimental Setup: We obtained five seconds of opticalmeasurements via an electro-optical sensor directed at thepower indicator LED of four devices.
Results: The FFT graphs extracted from the optical mea-surements of the devices when no sound was played arepresented in Fig. 5. As can be seen, a peak appears in theFFT at around 100 Hz; this peak is the result of the powerline frequency used to supply power to the LED. Power linesare designed to operate at frequencies of 50 or 60 Hz, howevercertain types of loads contain nonlinear components such asdiodes and transistors, and as a result, the loads producefrequencies which are multiples of the fundamental powerline frequency (50 or 60 Hz) and are called power systemharmonics. Since a diode bridge is integrated into the LED,it distorts the fundamental power line frequency, resulting inpower system harmonics (50 Hz, 100 Hz, 200 Hz, etc.) thatare reflected in the LED’s light intensity. Since the opticalsignal is obtained via an electro-optical sensor directed at adevice’s power indicator LED, the frequency of 50 Hz and itsharmonics (100 Hz, 200 Hz, 300 Hz, etc.) are added to theraw optical signal and are not the result of the sound we wishto recover.
Conclusions: The power system harmonics, which are addedto the optical signal and are not the result of the sound played,need to be filtered in order to recover the played signal.

7
Fig. 6. Spectrograms extracted from optical measurements obtained from the power indicator LED of various devices when a chirp function was played(frequency scan between 0-4 KHz). Note that in some devices (e.g., Logitech S120 speakers) the original frequency played by the speakers appears in thespectrum of the optical signal, while in other cases (e.g., TP-Link UE330, MIRACASE MHUB500), only the first harmonic of the frequency appears in thespectrum of the optical signal.
Fig. 7. SNR of various devices in the spectrum of 0-4 KHz at three sound levels (60, 70 dB).
TABLE ISUMMARY OF RECOVERED OPTICAL SNR OF VARIOUS DEVICES AT SOUND LEVEL OF 70 DB
Recovered SignalDevice 0-4000 Hz 0-1000 Hz 1000-2000 Hz 2000-3000 Hz 3000-4000 Hz
Manufacturer Model Type Tone Avg.SNR [dB] STD Avg.
SNR [dB] STD Avg.SNR [dB] STD Avg.
SNR [dB] STD Avg.SNR [dB] STD
Logitech S120Speakers
Original 40.75 7.52 45.09 4.46 41.50 3.59 41.65 5.88 34.42 10.73Winner Original 58.04 5.67 56.83 7.37 61.34 2.69 58.44 3.30 55.44 6.60CREATIVE Pebble Modern 2.0 Original 6.95 9.67 17.46 13.35 4.17 2.39 0.2 0.5 6 5.69TP-Link UE330 USB Hub First harmonic 20.65 14.53 36.85 8.02 21.35 12.37 16.12 10.98 7.61 8.73MIRACASE MHUB500 First harmonic 10.72 14.79 31.71 11.41 5.33 9.62 2.74 5.66 2.72 5.55Raspberry Pi 4 Microcontroller Original 15.73 9.59 26.85 6.23 18.21 4.79 11.46 6.16 5.93 5.70Google Google Nest Smart Assistant Original 1.53 4.15 3.81 6.23 2.3 4.68 0 0 0 0
2) Power Indicator LED’s Response to Sound at 0-4 KHzIn the next experiments, we tested the response of the
power indicator LED of various devices to a wide range offrequencies.
Experimental Setup: We conducted the following experi-ments: In the first experiment, we obtained optical measure-ments from the power indicator LED of two speakers (Log-itech S120 speakers and Winner speakers) that were connectedto the electricity. In the second experiment, we obtained opticalmeasurements from the power indicator LED of devices (TP-Link UE330 USB hub splitter [54], MIRACASE MHUB500USB hub splitter [55], RP) that were used to provide powerto the speakers via their USB input ports. In each of theexperiments, the audio was played via speakers at a soundlevel of 70 dB. The audio played from the speakers is a 30second audio file that consists of a chirp function (a frequencyscan between 0-4 KHz).
Results: Fig. 6 presents the spectrograms obtained from theoptical measurements. Three observations can be made fromthe spectrograms: (1) For some devices, the signal that appearsin the optical measurements is much stronger (e.g., LogitechS120 speakers) than that of other devices (e.g., the RP). (2)For some devices, the signal obtained matches the originalchirp function (e.g., Winner speakers). (3) For some devices,only the first harmonic of the chirp appears in the spectrogram(e.g., TP-Link USB hub splitter).
Conclusions: Based on these experiments, we concludedthat: (1) For devices with a weak recovered optical signal,the application of denoising techniques is required to optimizethe SNR. (2) For devices where the recovered optical signalappears in the first harmonic, the use of downtuning isrequired.
Next, we conducted an experiment to calculate the SNR ofeach of the seven devices (Logitech S120 speakers, Winnerspeakers, TP-Link UE330 USB hub splitter, MIRACASEMHUB500 USB hub splitter, RP, Google Nest Mini, andCreative Pebble speakers) across the 0-4 kHz spectrum at twolevels (60 and 70 dB).
Experimental Setup: We used the same experimental setupas the previous experiment, however this time we played adifferent audio file which consists of various sine waves (120,170,....1020 Hz), where each sine wave was played separatelyfor two seconds. We played the audio file via the the speakersat two sound levels (60 and 70 dB) and obtained opticalmeasurements.
Results: The SNR is presented in Fig. 7 and Table I. Weused the SNR as a measure in order to assess Glowworm’sto capture essential frequency bands used for speech recovery.Based on the experiments we conducted, we consider an SNRover 40 dB as a high quality signal; an SNR between 20 and40 dB as a medium quality signal; and an SNR below 20 dB asa low quality signal. The following observations can be made

8
based on the results: (1) The SNR changes depending on thetype of device used.
This is the result of the differences in their power con-sumption and the intensity of the light emitted from theirpower indicator LED. (2) For some devices, the SNR hasa low standard deviation (STD) throughout the spectrumexamined (e.g., the STD of the SNR of the optical signalobtained from the Logitech S120 speakers is 7.5, and theSTD of the SNR of the optical signal obtained from theWinner speakers is 5.6), which indicates a stable response,while for other devices, the SNR has a large STD (e.g., RP),which is usually the result of a decrease in the SNR as afunction of the frequency. (3) For some devices, the effectivespectrum that can be used to recover sound is narrow. Forexample, the SNR obtained from the power indicator LED ofthe MIRACASE MHUB500E is only stable up to 1000 Hz;for this device, the SNR of the spectrum beyond 1000 Hz isextremely unstable. (4) In general, the SNR of the recoveredsignal improves as the sound level increases. This phenomenoncan be explained as follows: When the volume of the soundplayed by the speakers increases, the power consumptionincreases. The power is the product of voltage and current.The current consumed from AC-DC converter output stagecapacitors (which have a limited amount of energy) increases,and as a result, the voltage level decreases proportionally tothe current and volume levels. Since a device’s power indicatorLED is connected in parallel to the capacitor, it is linearlyaffected by voltage levels; its intensity also increases, and agreater amount of light is emitted. As a result, more photonsare captured by the electro-optical sensor, which yields a betterSNR. (5) The improvement in the SNR that results from highervolume levels varies depending on the device; in some cases,the improvement is significant (e.g., the TP-Link USB hubsplitter and RP), while in other cases (e.g., Winner speakers),the improvement is less dramatic. (6) For some vulnerabledevices (e.g., Google Nest Mini and Creative Pebble speakers),the SNR is poor due to the weak intensity of their powerindicator LED. This fact requires more sensitive electro-opticalsensor (with lower noise level) to recover sound from theirpower indicator LED.
Conclusions: Based on these experiments, we concludedthat (1) a sound level of 70 dB (the sound level of virtualmeetings) produces a high SNR, and (2) for devices in whichthe SNR decreases as a function of the frequency, an equalizerneeds to be used to amplify the energy of weak frequencyranges.
3) The Influence of Ambient LightIn the next experiment we investigate the influence of
ambient light in the LED’s environment on the SNR calculatedfrom the optical signal obtained.
Experimental Setup: An electro-optical sensor was directedat the power indicator LED of speakers (Logitech S120 speak-ers) from a distance of five meters. The electro-optical sensorobtained measurements from the speakers’ power indicatorLED while the speakers played various sine waves (120,170,....1020 Hz). This setup was repeated twice: (1) when thelights were on, and (2) when the lights were off.
Results: The SNR is presented in Fig. 8. As can be seen, the
Fig. 8. SNR obtained from Logitech S120 speakers’ power indicator LEDwhen ambient lights were on and off.
effect of ambient light on the SNR calculated from the opticalsignal is negligible, and no additional procedures are required.This is due to the fact that the ambient light only adds its powersystem harmonics to the spectrum of the optical signal, andthe harmonics can be filtered early in the processing stage.
Conclusion: Ambient light present in the power indicatorLED’s environment does not affect Glowworm’s ability torecover sound.
V. OPTICAL-ACOUSTIC TRANSFORMATION
In this section, we leverage the findings presented in SectionIV and present optical-acoustic transformation (OAT), whichwe used to recover audio signals from the optical signalsobtained from an electro-optical sensor directed at a device’spower indicator LED. Throughout this section, we considersnd(t) as the audio played inside the target’s room by thespeakers, opt(t) as the optical signal obtained via an electro-optical sensor directed at the power indicator LED of a device,and snd∗(t) as the audio signal recovered from opt(t) usingOAT. OAT consists of the following stages:
Filtering Side Effects. As discussed in Section IV andpresented in Fig. 5, there are factors which affect the opticalsignal opt(t) that are not the result of the sound played snd(t)(e.g., peaks which are added to the spectrum that are the resultof the light frequency of the power indicator LED and itsharmonics - 100 Hz, 200 Hz, etc.). We filter the light frequencyand its harmonics (its first, second, third, ... order harmonics)from opt(t) using notch/bandstop filters.
Downtuning. As discussed in Section IV and presented inFig. 6, in some cases only the second order of the frequenciesof the played signal snd(t) appears in the optical signal opt(t).As a result, the recovered signal snd∗(t) is uptuned comparedto the original signal snd(t) played by the speakers. Thiscase requires the eavesdropper to apply downtuning to theoptical signal opt(t) in order to recover sound at the originalpitch. Downtuning is a standard procedure in the area ofsound processing used to play a song at a lower tone. Weimplemented this procedure digitally according to [61].
Speech Enhancement. Speech enhancement is performedto maximize the signal’s dynamic range before applyingadditional filters. To do so, we normalize the signal by scalingthe values of opt(t) to the range of [-1,1]

9
Fig. 9. The influence of the five stages of optical-audio transformation (OAT)on the recovered signal.
Denoising. This is the process of removing noise from asignal to increase the SNR and optimize its quality. Varioustechniques have been demonstrated to reduce noise, howeverwe reduce noise by applying spectral subtraction, an adaptivetechnique proposed for denoising single channel speech [62].
Equalizer. As discussed in Section IV and presented inFig. 7, the SNR obtained from some devices is unstable anddecreases as a function of the frequency. We use an equalizerin order to amplify the response of weak frequencies byadjusting the balance between frequency components withinan electronic signal.
The techniques that enable OAT to recover audio signalsfrom the optical signals are extremely popular in the area ofspeech processing; we used them for the following reasons:(1) the techniques rely on a speech signal that is obtained froma single channel; if eavesdroppers have the capability of sam-pling a device’s power indicator LED using multiple sensors,thereby obtaining several signals via multiple channels, othermethods can also be applied to recover an optimized signal,(2) these techniques do not require any prior data collectionto create a model; recent methods use learning-based models(e.g., neural networks) to optimize the speech quality in noisychannels, however such methods require a large amount ofdata for the training phase in order to create robust models,something eavesdroppers would likely prefer to avoid, and (3)the techniques can be applied in real-time applications, so theoptical signal obtained can be converted to audio with minimaldelay.
The influence of each step of the OAT on the recoveredsignal when the transformation is used to recover an arbitrarysentence is illustrated in Fig. 9. As can be seen, the rawoptical signal is very noisy. However, the application of speechenhancement and denoising techniques significantly improvesthe SNR. The equalizer is only used for fine-tuning.
Fig. 10. Experimental setup: the telescope and the four devices used in theexperiments. A PDA100A2 electro-optical sensor is mounted on the telescope.The electro-optical sensor outputs voltage which is sampled via an ADC (NI-9234) and processed in LabVIEW.
VI. EVALUATION
In this section, we evaluate the performance of the Glow-worm attack in terms of its ability to recover speech fromthe power indicator LED of various devices. We start bycomparing Glowworm’s performance to the performance ofthe visual microphone and Lamphone in a lab setup. Then,we test the influence of distance and the sound volume onGlowworm’s performance when recovering speech through anoffice’s transparent glass window/door.
The reader can assess the quality of the recovered soundvisually by analyzing the extracted spectrograms, qualitativelyby listening to the recovered audio signal online,1, 2 and quan-titatively based on metrics used by the audio processing com-munity to compare a recovered signal to its original signal: (1)Intelligibility - a measure of the comprehensibility of speech ingiven conditions [63]. To measure intelligibility, we used themetric suggested by [64] which results in values between [0,1].A higher intelligibility indicates better sound quality. (2) Log-Likelihood Ratio (LLR) - a metric that captures how closelythe spectral shape of a recovered signal matches that of theoriginal clean signal [65]. A lower LLR indicates better soundquality. (3) NIST-SNR - the speech-to-noise ratio, which isdefined as the logarithmic ratio between the estimated speechpower and noise power over 20 consecutive milliseconds. Ahigher NIST-SNR indicates better sound quality.
We used the following equipment and configurations torecover sound in the experiments conducted and describedin this section: a telescope (with a 20 cm lens diameter)was directed at the power indicator LED of the device. Wemounted an electro-optical sensor (Thorlabs PDA100A2 [58])to the telescope. The voltage was obtained from the electro-optical sensor using a 24-bit ADC NI-9234 card [59] andwas processed in a LabVIEW script that we wrote. Thesampling frequency of the ADC was configured at 2 KHz.In the remainder of this section we refer to this setup as the
1 https://youtu.be/Mi6T2K9zQgE2 https://youtu.be/eZD4SdeKe7E

10
Fig. 11. mabw0 sa1:"She had your dark suit in greasy wash water all year"recovered from various devices.
eavesdropping equipment. The level of the played sound wasmeasured using a professional decibel meter.
A. Comparing Glowworm to the Visual Microphone and Lam-phone
First, we compare the performance of Glowworm to that ofthe visual microphone [18] and Lamphone [17] using a similarexperimental setup to the one used in the studies presentingthose techniques. In those studies, the recovery of six sen-tences from the TIMIT repository [66] was demonstrated byplaying the sentences via speakers and analyzing the recoveredspeech in a lab setup. We compare Glowworm’s performancewhen recovering the same sentences from the power indicatorLED of the four devices that with the highest SNR in Table I:Two types of speakers (Logitech S120 and Winner speakers)and two types of USB hub splitters (TP-Link UE330 andMIRACASE MHUB500).
Experimental Setup: We replicated the experimental setupused in both the visual microphone [18] and Lamphone [17]studies as follows: We placed the devices on a desktop insidea lab and played the same six sentences from the TIMITrepository [66] that were recovered by the visual microphoneand Lamphone via the speakers, at the same volume level usedin the visual microphone study (an average sound level of 95dB). We note that the speakers we used this research are notcapable of producing speech at sound levels higher than 85dB, so we set the maximum sound level. In our experiment,the eavesdropping equipment was placed 2.5 meters fromthe devices, behind a closed door. Our experimental setup ispresented in Fig. 10. In this experiment, the performance ofthe Glowworm attack was evaluated on the task of recoveringspeech by applying the attack in a direct manner, obtainingoptical measurements from the power indicator LED of twospeakers, and in indirect manner, obtaining optical measure-ments from the power indicator LED of two USB hub splitters.
Results: We recovered speech by applying OAT to the op-tical measurements. The recovered audio signals are availableonline1 where they can be heard. The signals recovered bythe power indicator LED of the two speakers and USB hubsplitters when we played the sentence "She had your dark suitin greasy wash water all year" are presented in Fig. 11. Theintelligibility, LLR, and NIST-SNR of the recovered signals
are reported in Table II. Comparing these results to the resultsreported in the original Lamphone [17] and visual microphone[18] studies on the same sentences, we find that: (1) Theaverage intelligibility of the speech recovered from the powerindicator LED of the speakers (by applying the attack in adirect manner) is considered good/fair (according to [63]),however the average intelligibility of the speech recoveredfrom the power indicator LED of the USB hub splitters (byapplying the attack in an indirect manner) is considered poor.The visual microphone and Lamphone yield the same level ofresults in terms of intelligibility, as their average intelligibilityis also considered good. (2) The average LLR of the speechrecovered from the power indicator LED of Winner speakersis 1.74, which is lower (better) than Lamphone’s average LLR(1.8) but higher (worse) than the visual microphone’s averageLLR (1.53). The average LLR of the other devices was higher(worse) than that of the visual microphone and Lamphone.(3) The average NIST-SNR of the speech recovered from thepower indicator LED of the Logitech S120 speakers is 11.9,which is higher (better) than Lamphone’s average LLR (9.6)but lower (worse) than the visual microphone’s average LLR(24.5). The average NIST-SNR of the other devices was lower(worse) than that of the visual microphone and Lamphone.
We conclude that the quality of the speech recovered byGlowworm is highly dependant on the device that is tested.We note that the Glowworm attack does not rely on thedistance between the sound source and a lightweight vibratingobject, whereas the results reported by Lamphone and thevisual microphone are based on experiments performed whena vibrating object was placed a few centimeters from speakers.As a result, the quality of a signal recovered using theGlowworm attack at a fixed distance is stable and does notvary depending on the distance to nearby objects.
B. The Influence of Distance on Glowworm’s Performance
Next, we evaluate the influence of distance on Glowworm’sperformance.
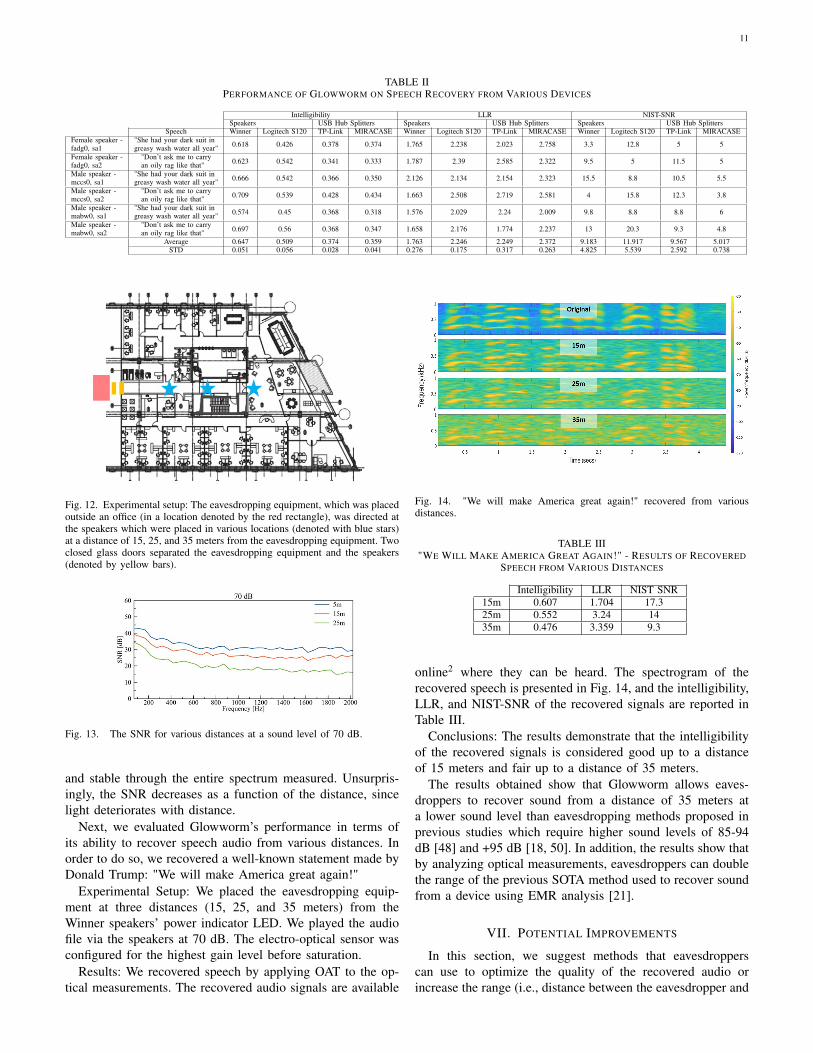
We evaluate Glowworm’s performance on the task of recov-ering sound at the speech level of a typical virtual meeting:70 dB. In the following set of experiments we attemptedto recover sound from the power indicator LED of Winnerspeakers from various distances. We placed the speakers ona desktop inside an office; the eavesdropping equipment waslocated outside the office, behind two closed clear glass doors.As a result, no sound from the speakers was heard from theeavesdropper’s position.
The setup can be seen in Fig. 12.First, we start by examining the influence of the sound level
on the SNR.Experimental Setup: We created an audio file that consists of
various sine waves (120, 170, 220, .... 1970 Hz) and placed theeavesdropping equipment 15, 25, and 35 meters away from thespeakers. We played the audio file via the speakers at 70 dB,obtaining the optical measurements. The electro-optical sensorwas configured for the highest gain level before saturation.
Results: Fig. 13 presents the SNR for various distances. Ascan be seen from the results, the SNR looks very promising
11
TABLE IIPERFORMANCE OF GLOWWORM ON SPEECH RECOVERY FROM VARIOUS DEVICES
Intelligibility LLR NIST-SNRSpeakers USB Hub Splitters Speakers USB Hub Splitters Speakers USB Hub Splitters
Speech Winner Logitech S120 TP-Link MIRACASE Winner Logitech S120 TP-Link MIRACASE Winner Logitech S120 TP-Link MIRACASEFemale speaker -fadg0, sa1
"She had your dark suit ingreasy wash water all year" 0.618 0.426 0.378 0.374 1.765 2.238 2.023 2.758 3.3 12.8 5 5
Female speaker -fadg0, sa2
"Don’t ask me to carryan oily rag like that" 0.623 0.542 0.341 0.333 1.787 2.39 2.585 2.322 9.5 5 11.5 5
Male speaker -mccs0, sa1
"She had your dark suit ingreasy wash water all year" 0.666 0.542 0.366 0.350 2.126 2.134 2.154 2.323 15.5 8.8 10.5 5.5
Male speaker -mccs0, sa2
"Don’t ask me to carryan oily rag like that" 0.709 0.539 0.428 0.434 1.663 2.508 2.719 2.581 4 15.8 12.3 3.8
Male speaker -mabw0, sa1
"She had your dark suit ingreasy wash water all year" 0.574 0.45 0.368 0.318 1.576 2.029 2.24 2.009 9.8 8.8 8.8 6
Male speaker -mabw0, sa2
"Don’t ask me to carryan oily rag like that" 0.697 0.56 0.368 0.347 1.658 2.176 1.774 2.237 13 20.3 9.3 4.8
Average 0.647 0.509 0.374 0.359 1.763 2.246 2.249 2.372 9.183 11.917 9.567 5.017STD 0.051 0.056 0.028 0.041 0.276 0.175 0.317 0.263 4.825 5.539 2.592 0.738
Fig. 12. Experimental setup: The eavesdropping equipment, which was placedoutside an office (in a location denoted by the red rectangle), was directed atthe speakers which were placed in various locations (denoted with blue stars)at a distance of 15, 25, and 35 meters from the eavesdropping equipment. Twoclosed glass doors separated the eavesdropping equipment and the speakers(denoted by yellow bars).
Fig. 13. The SNR for various distances at a sound level of 70 dB.
and stable through the entire spectrum measured. Unsurpris-ingly, the SNR decreases as a function of the distance, sincelight deteriorates with distance.
Next, we evaluated Glowworm’s performance in terms ofits ability to recover speech audio from various distances. Inorder to do so, we recovered a well-known statement made byDonald Trump: "We will make America great again!"
Experimental Setup: We placed the eavesdropping equip-ment at three distances (15, 25, and 35 meters) from theWinner speakers’ power indicator LED. We played the audiofile via the speakers at 70 dB. The electro-optical sensor wasconfigured for the highest gain level before saturation.
Results: We recovered speech by applying OAT to the op-tical measurements. The recovered audio signals are available
Fig. 14. "We will make America great again!" recovered from variousdistances.
TABLE III"WE WILL MAKE AMERICA GREAT AGAIN!" - RESULTS OF RECOVERED
SPEECH FROM VARIOUS DISTANCES
Intelligibility LLR NIST SNR15m 0.607 1.704 17.325m 0.552 3.24 1435m 0.476 3.359 9.3
online2 where they can be heard. The spectrogram of therecovered speech is presented in Fig. 14, and the intelligibility,LLR, and NIST-SNR of the recovered signals are reported inTable III.
Conclusions: The results demonstrate that the intelligibilityof the recovered signals is considered good up to a distanceof 15 meters and fair up to a distance of 35 meters.
The results obtained show that Glowworm allows eaves-droppers to recover sound from a distance of 35 meters ata lower sound level than eavesdropping methods proposed inprevious studies which require higher sound levels of 85-94dB [48] and +95 dB [18, 50]. In addition, the results show thatby analyzing optical measurements, eavesdroppers can doublethe range of the previous SOTA method used to recover soundfrom a device using EMR analysis [21].
VII. POTENTIAL IMPROVEMENTS
In this section, we suggest methods that eavesdropperscan use to optimize the quality of the recovered audio orincrease the range (i.e., distance between the eavesdropper and

12
a device’s power indicator LED), without changing the setupof the target location.
The potential improvements suggested below are presentedbased on the component they optimize.
Telescope. The amount of light that is captured by atelescope with a diameter of 2r is determined by the areaof its lens (πr2). As a result, using telescopes with a largerlens diameter enables the sensor to capture more light andoptimizes the SNR of the recovered audio signal.
Electro-Optical Sensor. The sensitivity of the system canbe enhanced by increasing the sensor’s internal gain. Eaves-droppers can use a sensor that supports higher internal gainlevels (note that the electro-optical sensor used in this study,PDA100A2 [58], outputs voltage in the range of [-10,10] andsupports a maximum internal gain of 70 dB). Alternatively, thesensitivity of the system can be enhanced by using an electro-optical sensor with a lower noise level. Another option formaximizing the SNR is to profile the electro-optical sensor’sself-noise (when the light is recorded) in order to filter its selfnoise.
Sound Recovery System. While many advanced denoisingmethods have been presented in the audio processing field, alarge amount of data is often required to train a model thatprofiles the noise in order to optimize the output’s quality.Such algorithms/models can be used in place of the simplemethods used in this research. In addition, various advanceddedicated algorithms for improving speech quality can also beused to extend the effective band of the recovered signal (e.g.,artificial bandwidth extension algorithms [67–71]). In addition,more sensitive ADC (with lower sound level) can be used tosample the electro-optical sensor.
VIII. COUNTERMEASURES
In this section, we describe several countermeasure methodsthat can be used to mitigate or prevent the Glowworm attack.
Manufacturer side. In most devices the power indicatorLED is connected directly to the power line (see Fig. 15a). Asa result, the device’s power indicator LED is highly affected bythe power consumption fluctuations that occur when speakersproduce sound. To counter this phenomenon, a few approachesshould be considered by hardware manufacturers: (1) Using acapacitor: A capacitor can be integrated in parallel to the powerLED indicator; in this case, the capacitor behaves as a low-passfilter (see Fig. 15b). This is a straightforward and inexpensivesolution for reducing AC fluctuations. However, in deviceswith high power consumption, the integrated capacitor mustbe large enough to supply a sufficient amount of current to thespeakers. (2) Using an OPAMP: This can be implemented byintegrating an additional OPAMP between the power line andthe power indicator LED (see Fig. 15c) or by using an existingGPIO port of an integrated microcontroller as a power supplyfor the power indicator LED (see Fig. 15d). In both cases, thiswill eliminate power line AC fluctuations by a factor of theOPAMP amplifier’s CMRR (common mode rejection ratio).
Consumer side. The attack can also be prevented by placingblack tape over a device’s power indicator LED. While thissolution decreases a device’s UX, it prevents the attackers fromobtaining optical measurements from vulnerable devices.
‘
Fig. 15. Circuits vulnerable to the Glowworm attack (a), a countermeasuresusing a capacitor (b), an additional OPAMP amplifier (c), and the existingOPAMP (d).
IX. RESPONSIBLE DISCLOSURE
We performed the following steps:1) We disclosed the details of the attack with the man-
ufacturers of the devices that were analyzed in thisresearch via their bug bounty programs and contact-usemail addresses: Google, Logitech, Creative, TP-Link,Raspberry Pi, Winner, and MIRACASE. The email sentto each of the manufacturers contained explanationsabout the research, the Glowworm attack, proof thattheir devices are vulnerable to the Glowworm attack(electric and optical spectrograms of chirp functions),and recovered speech signals.
2) We did not share the paper in order to keep the namesof the other manufacturers confidential. In addition,we decided to refrain from informing manufacturers ofdevices that were not tested in this research about theGlowworm attack. We made this decision in order toprevent the information from spreading before givingthe affected device manufacturers time to respond.
3) We encouraged the manufacturers to meet with us inorder to ensure that they understood the problem andassist them in developing a countermeasure.
4) We explained to the manufacturers that we sent ourfindings to a conference and our paper may becomepublic around November.
5) We refrained from: (1) uploading the paper to arXiv, (2)discussing our findings with other researchers, and (3)sending the research to non-academic conferences.
Google, TP-Link, and Creative responded to our disclosure,asked us for more details, sent the findings of this research totheir product team, and informed us that they would updateus regarding their next steps. AS of this writing, Logitech,Raspberry Pi, Winner, and MIRACASE have not respondedto our disclosure.
X. DISCUSSION, LIMITATIONS & FUTURE WORK
The purpose of this research was to raise awareness regard-ing the feasibility of recovering sound by analyzing opticalmeasurements obtained from an electro-optical sensor directedat a device’s power indicator LED. While we are the first todemonstrate this method in the academic realm, we wonderwhether our method is already known within the military andespionage realms. While we can only hypothesize about theanswer to this question, for the following reasons we believe

13
that we are not the first to exploit a device’s power indicatorLED to recover sound: (1) power indicator LEDs have beenintegrated into devices for many years, (2) power indicatorLEDs’ linear response to power consumption has been knownfor many years, (3) sound recovery is of interest to variousentities around the world, and (4) virtual meeting platformshave been used for many years, given the fact that theirprotocols are encrypted. In addition, the case of the "GreatSeal Bug" [72] proved that a new technology, the RFID, wasused by agencies to eavesdrop three decades before it wasscientifically discovered in 1973 [73].
We recommend that other hardware manufacturers em-pirically test whether their devices are vulnerable to theGlowworm attack. We hope that our findings will encouragehardware manufacturers to take our suggestions to empiri-cally test their devices and redesign their electrical circuits(according to the suggestions provided in Section VIII), inorder to prevent eavesdroppers from applying the Glowwormattack in the future. However, we are not certain that theywill implement our suggestions due to the financial impli-cations of doing so, as some of the solutions may increasethe manufacturer’s overall cost, decreasing the revenue orrequiring the manufacturer to increase the price of the product(which could make the device less attractive to consumers).While the cost of our countermeasures might seem negligible,given the likelihood that the devices are mass produced, theaddition of a component to prevent the attack could cost amanufacturer millions of dollars. Given the cost-driven natureof consumers and the profit-driven nature of manufacturers,known vulnerabilities are often ignored as a means of reducingcosts. This fact may leave many electrical circuits vulnerableto Glowworm attack for years to come.
We also note that the area of optical sound eavesdroppinghas progressed significantly in the past seven years: a fewstudies have presented innovative methods to recover speechusing data acquired from a high frequency video camera [18],LiDAR [19], and an electro-optical sensor [17]. Our attackcontinues the trend of recovering sound by exploiting opticalside effects, and we believe that other studies will address thistopic in the next few years.
We note that the risk posed by optical signals obtained froma device’s power indicator LED is not limited to sound recov-ery. Various attacks where the attacker analyzed a device’spower consumption have already been demonstrated. Theoptical signals obtained from a device’s power indicator LEDserve as a remote approximation of the power consumed by thedevice due to the fact that: (1) the intensity of LED is highlycorrelated with the power consumption, and (2) LEDs arehighly responsive to their input voltage. While, the intensityof a device’s power indicator LED may provide an accurateapproximation at high resolution (at GHz) regarding the powerconsumed by the device [74], the primary disadvantage comesfrom the sensors’ side: the frequency bandwidth of the electro-optical sensors we used in this research are limited to a fewMHz. As a result, only attacks that are based on power analysisand can be applied with a sampling rate lower than a fewMHz may be practical against the devices. However, it hasalready been shown that many attacks can be applied with a
Fig. 16. Two spectrograms extracted from Logitech speakers: Z200 (left)and Z120 (right). The results show that not all devices produced by the samemanufacturer are vulnerable to optical TEMPEST attacks.
very low sampling rate, e.g., RSA keys were recovered fromacoustic signals that were sampled at low sampling rates (atfew KHz). Such attacks could also be applied with opticalsignals obtained from a device’s power indicator LED
The Glowworm attack suffers from one main disadvantage:The quality of the sound recovered is proportional to thequality of the equipment used by the eavesdropper. In ourstudy, the cost of our equipment came to $1000 ($250 -telescope, $250 - electro-optical sensor, and $500 - ADC),an investment which allowed us to recover speech from adistance of 35 meters. In order to increase the attack rangeand recover higher quality sound, more expensive professionalequipment is required (e.g., a more sensitive ADC and electro-optical sensor, a professional telescope). Such equipmentwould enable eavesdroppers to recover sound from vulnerabledevices that have very weak LED intensity (e.g., Google NestMini, Creative Pebble speakers). In addition, some electricalcircuits are not vulnerable to the Glowworm attack becausethey contain voltage stabilizers and filters that distort/changethe known linear response of the intensity of the LED to powerconsumption. Interestingly, we found that while the powerindicator LED of Logitech S120 speakers leaks informationregarding the sound that is played from them, other speakerssold by the same manufacturer, Logitech Z200 speakers, donot leak such information, as can be seen in Fig. 16.
For future work, we suggest investigating the possibility of:(1) improving the Glowworm attack without the use of expen-sive equipment (e.g., improving the recovery model by usingadvanced models such as artificial bandwidth extension [67–71]) and (2) recovering non-acoustic information from devices(e.g, optical cryptanalysis via a device’s power indicator LED).
REFERENCES
[1] J. Friedman, “Tempest: A signal problem,” NSA Crypto-logic Spectrum, vol. 35, p. 76, 1972.
[2] M. G. Kuhn, “Optical time-domain eavesdropping risksof crt displays,” in Proceedings 2002 IEEE Symposiumon Security and Privacy. IEEE, 2002, pp. 3–18.
[3] M. Backes, M. Dürmuth, and D. Unruh, “Compromisingreflections-or-how to read lcd monitors around the cor-ner,” in 2008 IEEE Symposium on Security and Privacy(sp 2008). IEEE, 2008, pp. 158–169.
[4] M. Backes, T. Chen, M. Dürmuth, H. P. Lensch, andM. Welk, “Tempest in a teapot: Compromising reflectionsrevisited,” in 2009 30th IEEE Symposium on Security andPrivacy. IEEE, 2009, pp. 315–327.
14
[5] Y. Xu, J. Heinly, A. M. White, F. Monrose, and J.-M. Frahm, “Seeing double: Reconstructing obscuredtyped input from repeated compromising reflections,” inProceedings of the 2013 ACM SIGSAC conference onComputer & communications security, 2013, pp. 1063–1074.
[6] R. Raguram, A. M. White, Y. Xu, J.-M. Frahm,P. Georgel, and F. Monrose, “On the privacy risks ofvirtual keyboards: automatic reconstruction of typed in-put from compromising reflections,” IEEE Transactionson Dependable and Secure Computing, vol. 10, no. 3,pp. 154–167, 2013.
[7] R. Raguram, A. M. White, D. Goswami, F. Monrose, andJ.-M. Frahm, “ispy: automatic reconstruction of typedinput from compromising reflections,” in Proceedings ofthe 18th ACM conference on Computer and communica-tions security, 2011, pp. 527–536.
[8] D. Balzarotti, M. Cova, and G. Vigna, “Clearshot: Eaves-dropping on keyboard input from video,” in 2008 IEEESymposium on Security and Privacy (sp 2008). IEEE,2008, pp. 170–183.
[9] K. Mowery, S. Meiklejohn, and S. Savage, “Heat of themoment: Characterizing the efficacy of thermal camera-based attacks,” in Proceedings of the 5th USENIX con-ference on Offensive technologies, 2011, pp. 6–6.
[10] Q. Yue, Z. Ling, X. Fu, B. Liu, K. Ren, and W. Zhao,“Blind recognition of touched keys on mobile devices,”in Proceedings of the 2014 ACM SIGSAC Conferenceon Computer and Communications Security, 2014, pp.1403–1414.
[11] D. Shukla, R. Kumar, A. Serwadda, and V. V. Phoha,“Beware, your hands reveal your secrets!” in Proceedingsof the 2014 ACM SIGSAC Conference on Computer andCommunications Security, 2014, pp. 904–917.
[12] S. King, “Luminous intensity of an led as a functionof input power,” ISB J. Phys, vol. 2, no. 2, pp. Paper–number, 2008.
[13] J. Loughry and D. A. Umphress, “Information leakagefrom optical emanations,” ACM Transactions on Infor-mation and System Security (TISSEC), vol. 5, no. 3, pp.262–289, 2002.
[14] M. Guri, B. Zadov, and Y. Elovici, “Led-it-go: Leaking(a lot of) data from air-gapped computers via the (small)hard drive led,” in International conference on detectionof intrusions and malware, and vulnerability assessment.Springer, 2017, pp. 161–184.
[15] M. Guri, B. Zadov, A. Daidakulov, and Y. Elovici, “xled:Covert data exfiltration from air-gapped networks viaswitch and router leds,” in 2018 16th Annual Conferenceon Privacy, Security and Trust (PST). IEEE, 2018, pp.1–12.
[16] M. Guri, B. Zadov, D. Bykhovsky, and Y. Elovici, “Ctrl-alt-led: Leaking data from air-gapped computers via key-board leds,” in 2019 IEEE 43rd Annual Computer Soft-ware and Applications Conference (COMPSAC), vol. 1.IEEE, 2019, pp. 801–810.
[17] B. Nassi, Y. Pirutin, A. Shamir, Y. Elovici, and B. Zadov,“Lamphone: Real-time passive sound recovery from light
bulb vibrations,” Cryptology ePrint Archive, Tech. Rep.[18] A. Davis, M. Rubinstein, N. Wadhwa, G. J. Mysore,
F. Durand, and W. T. Freeman, “The visual microphone:passive recovery of sound from video,” 2014.
[19] S. Sami, Y. Dai, S. R. X. Tan, N. Roy, and J. Han,“Spying with your robot vacuum cleaner: Eavesdroppingvia lidar sensors,” in Proceedings of the 18th Conferenceon Embedded Networked Sensor Systems, ser. SenSys’20. New York, NY, USA: Association for ComputingMachinery, 2020, p. 354–367. [Online]. Available:https://doi.org/10.1145/3384419.3430781
[20] R. P. Muscatell, “Laser microphone,” Oct. 25 1983, uSPatent 4,412,105.
[21] J. Choi, H.-Y. Yang, and D.-H. Cho, “Tempest comeback:A realistic audio eavesdropping threat on mixed-signalsocs,” in Proceedings of the 2020 ACM SIGSACConference on Computer and Communications Security,ser. CCS ’20. New York, NY, USA: Association forComputing Machinery, 2020, p. 1085–1101. [Online].Available: https://doi.org/10.1145/3372297.3417241
[22] W. Van Eck, “Electromagnetic radiation from videodisplay units: An eavesdropping risk?” Computers &Security, vol. 4, no. 4, pp. 269–286, 1985.
[23] G. Camurati, S. Poeplau, M. Muench, T. Hayes, andA. Francillon, “Screaming channels: When electromag-netic side channels meet radio transceivers,” in Proceed-ings of the 2018 ACM SIGSAC Conference on Computerand Communications Security, 2018, pp. 163–177.
[24] D. R. Gnad, J. Krautter, and M. B. Tahoori, “Leaky noise:New side-channel attack vectors in mixed-signal iotdevices,” IACR Transactions on Cryptographic Hardwareand Embedded Systems, pp. 305–339, 2019.
[25] Z. Liu, N. Samwel, L. Weissbart, Z. Zhao, D. Lau-ret, L. Batina, and M. Larson, “Screen gleaning: Ascreen reading tempest attack on mobile devices ex-ploiting an electromagnetic side channel,” arXiv preprintarXiv:2011.09877, 2020.
[26] D. Agrawal, B. Archambeault, J. R. Rao, and P. Ro-hatgi, “The em side—channel (s),” in International work-shop on cryptographic hardware and embedded systems.Springer, 2002, pp. 29–45.
[27] K. Gandolfi, C. Mourtel, and F. Olivier, “Electromag-netic analysis: Concrete results,” in International work-shop on cryptographic hardware and embedded systems.Springer, 2001, pp. 251–261.
[28] J.-J. Quisquater and D. Samyde, “Electromagnetic anal-ysis (ema): Measures and counter-measures for smartcards,” in International Conference on Research in SmartCards. Springer, 2001, pp. 200–210.
[29] M. Backes, M. Dürmuth, S. Gerling, M. Pinkal, andC. Sporleder, “Acoustic side-channel attacks on printers.”in USENIX Security symposium, vol. 10, 2010, pp. 307–322.
[30] C. Song, F. Lin, Z. Ba, K. Ren, C. Zhou, and W. Xu,“My smartphone knows what you print: Exploringsmartphone-based side-channel attacks against 3d print-ers,” in Proceedings of the 2016 ACM SIGSAC Confer-ence on Computer and Communications Security, 2016,

15
pp. 895–907.[31] A. Hojjati, A. Adhikari, K. Struckmann, E. Chou, T. N.
Tho Nguyen, K. Madan, M. S. Winslett, C. A. Gunter,and W. P. King, “Leave your phone at the door: Sidechannels that reveal factory floor secrets,” in Proceedingsof the 2016 ACM SIGSAC Conference on Computer andCommunications Security, 2016, pp. 883–894.
[32] D. Asonov and R. Agrawal, “Keyboard acoustic ema-nations,” in IEEE Symposium on Security and Privacy,2004. Proceedings. 2004. IEEE, 2004, pp. 3–11.
[33] L. Zhuang, F. Zhou, and J. D. Tygar, “Keyboard acousticemanations revisited,” ACM Transactions on Informationand System Security (TISSEC), vol. 13, no. 1, pp. 1–26,2009.
[34] D. Genkin, A. Shamir, and E. Tromer, “Rsa key extrac-tion via low-bandwidth acoustic cryptanalysis,” in AnnualCryptology Conference. Springer, 2014, pp. 444–461.
[35] Y. Berger, A. Wool, and A. Yeredor, “Dictionary attacksusing keyboard acoustic emanations,” in Proceedings ofthe 13th ACM conference on Computer and communica-tions security, 2006, pp. 245–254.
[36] D. Genkin, M. Pattani, R. Schuster, and E. Tromer,“Synesthesia: Detecting screen content via remote acous-tic side channels,” in 2019 IEEE Symposium on Securityand Privacy (SP). IEEE, 2019, pp. 853–869.
[37] Y. Michalevsky, D. Boneh, and G. Nakibly,“Gyrophone: Recognizing speech from gyroscopesignals,” in 23rd USENIX Security Symposium(USENIX Security 14). San Diego, CA: USENIXAssociation, 2014, pp. 1053–1067. [Online]. Available:https://www.usenix.org/conference/usenixsecurity14/technical-sessions/presentation/michalevsky
[38] L. Zhang, P. H. Pathak, M. Wu, Y. Zhao, and P. Mo-hapatra, “Accelword: Energy efficient hotword detec-tion through accelerometer,” in Proceedings of the 13thAnnual International Conference on Mobile Systems,Applications, and Services. ACM, 2015, pp. 301–315.
[39] S. A. Anand and N. Saxena, “Speechless: Analyzingthe threat to speech privacy from smartphone motionsensors,” in 2018 IEEE Symposium on Security andPrivacy (SP), vol. 00, pp. 116–133. [Online]. Available:doi.ieeecomputersociety.org/10.1109/SP.2018.00004
[40] Z. Ba, T. Zheng, X. Zhang, Z. Qin, B. Li, X. Liu,and K. Ren, “Learning-based practical smartphone eaves-dropping with built-in accelerometer,” in Proceedings ofthe Network and Distributed Systems Security (NDSS)Symposium, 2020, pp. 23–26.
[41] H. Wang, T. T.-T. Lai, and R. Roy Choudhury, “Mole:Motion leaks through smartwatch sensors,” in Proceed-ings of the 21st Annual International Conference onMobile Computing and Networking, 2015, pp. 155–166.
[42] X. Liu, Z. Zhou, W. Diao, Z. Li, and K. Zhang,“When good becomes evil: Keystroke inference withsmartwatch,” in Proceedings of the 22nd ACM SIGSACConference on Computer and Communications Security,2015, pp. 1273–1285.
[43] P. Kocher, J. Jaffe, and B. Jun, “Differential poweranalysis,” in Annual international cryptology conference.
Springer, 1999, pp. 388–397.[44] P. Kocher, J. Jaffe, B. Jun, and P. Rohatgi, “Introduction
to differential power analysis,” Journal of CryptographicEngineering, vol. 1, no. 1, pp. 5–27, 2011.
[45] S. Mangard, E. Oswald, and T. Popp, Power analysisattacks: Revealing the secrets of smart cards. SpringerScience & Business Media, 2008, vol. 31.
[46] N. Roy and R. Roy Choudhury, “Listening througha vibration motor,” in Proceedings of the 14thAnnual International Conference on Mobile Systems,Applications, and Services, ser. MobiSys ’16. NewYork, NY, USA: ACM, 2016, pp. 57–69. [Online].Available: http://doi.acm.org/10.1145/2906388.2906415
[47] M. Guri, Y. Solewicz, A. Daidakulov, and Y. Elovici,“Speake(a)r: Turn speakers to microphones forfun and profit,” in 11th USENIX Workshopon Offensive Technologies (WOOT 17). Vancou-ver, BC: USENIX Association, 2017. [Online].Available: https://www.usenix.org/conference/woot17/workshop-program/presentation/guri
[48] A. Kwong, W. Xu, and K. Fu, “Hard drive ofhearing: Disks that eavesdrop with a synthesizedmicrophone,” in 2019 2019 IEEE Symposium on Securityand Privacy (SP). Los Alamitos, CA, USA: IEEEComputer Society, may 2019. [Online]. Available: https://doi.ieeecomputersociety.org/10.1109/SP.2019.00008
[49] “Facts about speech intelligibility,” https://www.dpamicrophones.com/mic-university/facts-about-speech-intelligibility.
[50] T. Wei, S. Wang, A. Zhou, and X. Zhang,“Acoustic eavesdropping through wireless vibrometry,”in Proceedings of the 21st Annual InternationalConference on Mobile Computing and Networking,ser. MobiCom ’15. New York, NY, USA:ACM, 2015, pp. 130–141. [Online]. Available:http://doi.acm.org/10.1145/2789168.2790119
[51] G. Wang, Y. Zou, Z. Zhou, K. Wu, and L. M. Ni, “Wecan hear you with wi-fi!” IEEE Transactions on MobileComputing, vol. 15, no. 11, pp. 2907–2920, Nov 2016.
[52] “Logitech s-120.” [Online]. Available:https://www.amazon.com/Logitech-S120-2-0-Stereo-Speakers/dp/B000R9AAJA/
[53] “Winner desktop speakers.” [Online]. Available: http://www.tonewinner.com/english/
[54] “Tp-link ue330 usb.” [Online]. Avail-able: https://www.amazon.com/TP-Link-Portable-Ethernet-Notebooks-UE330/dp/B01N9M32TA/
[55] “Miracase mhub500 usb hub splitter.” [Online].Available: https://www.amazon.com/TP-Link-Portable-Ethernet-Notebooks-UE330/dp/B01N9M32TA/
[56] “Winner speakers.” [Online]. Available: https://store.google.com/us/product/google_nest_mini?hl=en-US
[57] “Creative pebble speakers.” [Online]. Available: https://us.creative.com/p/speakers/creative-pebble
[58] “Pda100a2.” [Online]. Available: https://www.thorlabs.com/thorproduct.cfm?partnumber=PDA100A2

16
[59] “Ni 9234 datasheet.” [Online]. Available: https://www.ni.com/pdf/manuals/374238a_02.pdf
[60] “Mpu 6050 gy-521 3 axis gyro accelerometersensor module arduino.” [Online]. Available:http://xtcomp.co.za/image/catalog/GY-521.pdf
[61] F. Grondin, A. Vakili, and L. Demers, “Guitarpitch shifter,” 2014, http://www.guitarpitchshifter.com/about.html.
[62] N. Upadhyay and A. Karmakar, “Speech enhancementusing spectral subtraction-type algorithms: A compari-son and simulation study,” Procedia Computer Science,vol. 54, pp. 574–584, 2015.
[63] “Intelligibility,” https://en.wikipedia.org/wiki/Intelligibility_(communication).
[64] C. H. Taal, R. C. Hendriks, R. Heusdens, and J. Jensen,“An algorithm for intelligibility prediction of time–frequency weighted noisy speech,” vol. 19, no. 7. IEEE,2011, pp. 2125–2136.
[65] S. R. Quackenbush, T. P. Barnwell, and M. A. Clements,Objective measures of speech quality. Prentice Hall,1988.
[66] J. S. Garofolo, L. F. Lamel, W. M. Fisher, J. G. Fis-cus, and D. S. Pallett, “Darpa timit acoustic-phoneticcontinous speech corpus cd-rom. nist speech disc 1-1.1,”STIN, vol. 93, p. 27403, 1993.
[67] P. Jax and P. Vary, “On artificial bandwidth extension oftelephone speech,” Signal Processing, vol. 83, no. 8, pp.1707–1719, 2003.
[68] H. Pulakka, U. Remes, S. Yrttiaho, K. Palomaki, M. Ku-rimo, and P. Alku, “Bandwidth extension of telephonespeech to low frequencies using sinusoidal synthesis anda gaussian mixture model,” IEEE transactions on audio,speech, and language processing, vol. 20, no. 8, pp.2219–2231, 2012.
[69] V. Iyengar, R. Rabipour, P. Mermelstein, and B. R.Shelton, “Speech bandwidth extension method and ap-paratus,” Oct. 3 1995, uS Patent 5,455,888.
[70] S. Li, S. Villette, P. Ramadas, and D. J. Sinder,“Speech bandwidth extension using generative adversar-ial networks,” in 2018 IEEE International Conferenceon Acoustics, Speech and Signal Processing (ICASSP).IEEE, 2018, pp. 5029–5033.
[71] H. Pulakka and P. Alku, “Bandwidth extension of tele-phone speech using a neural network and a filter bank im-plementation for highband mel spectrum,” IEEE Trans-actions on Audio, Speech, and Language Processing,vol. 19, no. 7, pp. 2170–2183, 2011.
[72] G. Brooker and J. Gomez, “Lev termen’s great sealbug analyzed,” IEEE Aerospace and Electronic SystemsMagazine, vol. 28, no. 11, pp. 4–11, 2013.
[73] J. Landt, “The history of rfid,” IEEE potentials, vol. 24,no. 4, pp. 8–11, 2005.
[74] J. Loughry, “Optical tempest,” in 2018 InternationalSymposium on Electromagnetic Compatibility (EMC EU-ROPE). IEEE, 2018, pp. 172–177.
XI. SOUND RECOVERY ALGORITHM
The input to the algorithm is (1) optical−stream - a pointer to the opticalstream (the output of an ADC that samples the electro-optical sensor), (2)sample_freq - the frequency that the ADC samples, and (3) a equalizer−function - a function which is used for equalization. The five stages ofAlgorithm 1 for recovering sound are described below.
Algorithm 1 Recovering Audio from an Optical Signal1: INPUT: optical-stream, sample_freq, equalizer-function2: LightFreq = 1003: while (!isEmpty(optical-stream) do)4: /*Read from optical-stream to a buffer*/5: opt[] = read(optical-stream,sample_freq)6: rec_snd* = opt7: /*Filtering side effects*/8: for (i = LightFreq; i < sample_freq/2; i+=LightFreq)
do9: rec_snd** = bandstop(i,rec_snd**)
10: /*Scaling to [-1,1]*/11: min = min(rec_snd*), max = max(rec_snd*)12: for (i = 0; i < len(snd*); i+=1) do13: rec_snd*[i] = -1 + (rec_snd∗[i]−min)∗2
max−min
14: /*Noise reduction*/15: rec_snd* = spectral-subtraction(rec_snd*)16: /*Balancing*/17: rec_snd* = equalizer(rec_snd*,equalizer-function)18: play (rec_snd*)
XII. APPENDIX - SPECTROGRAMS OF RECOVEREDSPEECH
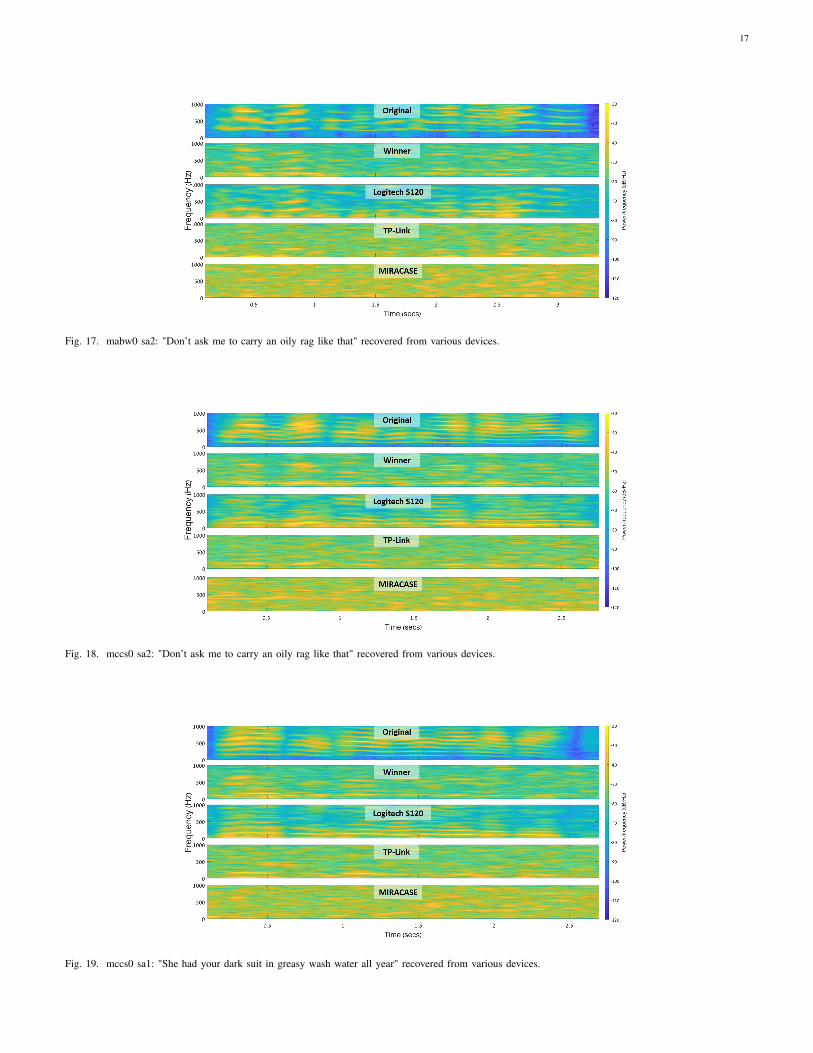
17
Fig. 17. mabw0 sa2: "Don’t ask me to carry an oily rag like that" recovered from various devices.
Fig. 18. mccs0 sa2: "Don’t ask me to carry an oily rag like that" recovered from various devices.
Fig. 19. mccs0 sa1: "She had your dark suit in greasy wash water all year" recovered from various devices.
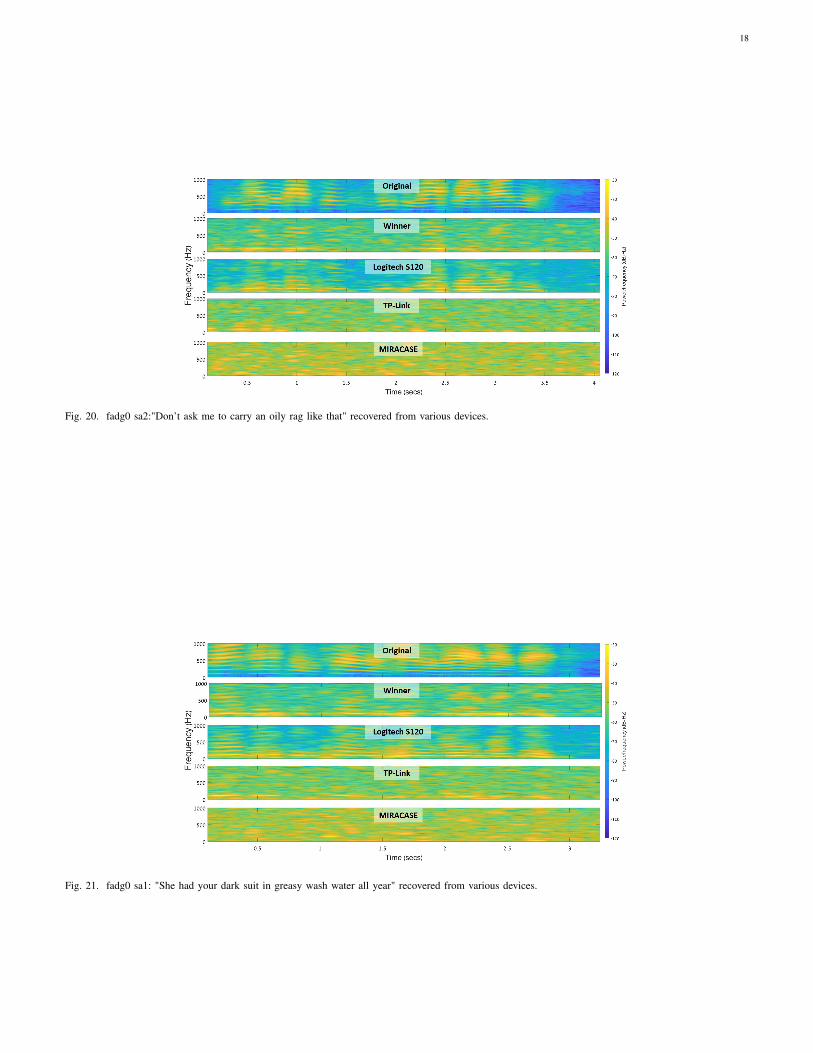
18
Fig. 20. fadg0 sa2:"Don’t ask me to carry an oily rag like that" recovered from various devices.
Fig. 21. fadg0 sa1: "She had your dark suit in greasy wash water all year" recovered from various devices.