gm competative exposure
TRANSCRIPT

Foreign Exchange Hedging
Strategies at General Motors
Competitive Exposures
by Sacha Singh|Shemair Lewis|
Martin Massiah|Diandra Touissant

Case Summary
In 2001, General Motors was the world’s
leading automaker
Market share of 15%
Annual sales of $184.6 billion
Earnings of $4.4 billion
GM had manufacturing operations in more
than 30 countries and its vehicles were sold in
around 200 countries.

Case Summary
Majority of sales to end customers were in North
America, however the importance of international
operations are growing.
This results in currency risks and competitive exposures
Japanese automakers were of major concern for GM
The depreciation of the yen lowered their relative cost
structure compared to U.S. and European automakers
Japanese firms’ advantage of lower costs could
erode GM’s market share and market value

Case Summary
Key objectives of GM’s foreign exchange (FX) risk
management policy:
Reduce cash flow and earnings volatility
Minimize management time and costs dedicated to FX
management
Align FX management with how GM operated its
automotive business

Case Summary
These objectives were supported by GM’s formal
hedging policy
Passive hedging strategy: hedge 50% of all
significant foreign exchange exposures from cash
flows associated with ongoing business

Why is GM worried about
the level of the yen?

Why worry
Due to GM’s international operations, the firm is
vulnerable to:
Currency Exposure: investment in a foreign
currency is subject to the changes in value of
that currency
Eg. GM’s foreign operations

Why worry
Investment exposure: equity stakes in Japanese
automakers
Affiliate Exposure
Long/(Short)
$ Billions
GM Ownership
Stake
Fuji (1.50) 20%
Isuzu (1.02) 49%
Suzuki (0.09) 20%

Why worry
Commercial Exposure:
Forecasted receivables less payables
Financing Exposure:
Yen-denominated loans
Bond issue of $500 million worth of outstanding yen-
denominated bonds
Competitive Exposure: exposure resulting from
competing against companies with different currencies
Eg. Japanese automakers and the depreciation of
the Yen

Impact of the Yen Depreciation
Major Japanese automakers had large
portions of their cost structure denominated in
yen
Any depreciation lowers their cost structure
in comparison to foreign competitors (eg.
GM)
Lower prices can achieve normal
profitability levels for Japanese firms
GM’s operations would be affected by
currency risk, eroding market share and market
value

Example
Cost of Manufacturing a Car = $40,000
Selling Price of Car = $50,000
45% of components sourced from Japan
Old Exchange Rate: $1= ¥100
New Exchange Rate: $1= ¥120

Example
Old exchange rate
($1= ¥100)
Components: 45% of
$40,000
Cost ($)= $18,000
Cost (¥)
=$18,000 x ¥100
=¥1,800,000
New exchange rate
($1= ¥120)
Cost in Yen: 1,800,000
Cost ($)
=¥1,800,000 ÷ ¥120
= $15,000
Change
$18,000 - $15,000
=$3,000

How Important is GM’s Competitive
Exposure to the Yen?

How important
Japanese automakers derived 56% and 43% of
their revenues from the U.S. Market in 1999 and
2000 respectively.
Feldstein noted: For every one-yen
depreciation against the dollar, Japanese
competitors’ collective operating profit grew
by more than $400 million

How important
GM’s exposure is a competitive one, rather
than a financial one
No projected receivable or payable and no
capital investment or loan to be repaid, yet
there was still a bottom-line impact due to
foreign exchange fluctuations
GM’s competitive exposure to the Yen is
crucial to their profits and market share

Depreciation in Yen leads to
Additional Gross Margin for Japanese
Automakers, who
Passed along some of the benefits to
consumers in lowered prices
Therefore gaining market share in
the U.S.
Which, ate into unit sales at GM
Lowered Gm’s profits
Reduced Gm’s market Value

How important
The average Japanese car had between 20% -
40% Japanese components
Suppliers, labour and plant expenses
Japanese incentives and lower sticker prices
from the depreciated yen were between 15%
and 45% of the cost savings

Example
Cost of Manufacturing a Car = $40,000
Selling Price of Car = $50,000
45% of components sourced from Japan
Cost of Japanese components (old
exchange rate): $18,000
New Exchange Rate: $15,000
Change in Profit Margin: $3,000

Example
Additional margin passed to customers (45%)
$3,000 x 0.45= $1350
New Selling Price: $50,000-$1350 = $48,650
Price Decrease: 2.7% (1350/50,000x100)
How would you go from
the information in the
case about competitive
interaction with
Japanese manufactures
to value exposure of GM

Value Exposure GM faces
Eroding:
Market share
Profitability / Unit Sales

Market Share
Examine how changes in the exchange rate
change the market share of your company
Japanese Market Share
Yen Depreciation

Market share exposure
GM faces currency risk due to lower costs for
Japanese firms would lead to lower required
prices to achieve the normal profitability levels,
thus eroding GMs market share and market
value

Unit Sales
Examine how changes in the exchange rate
change the unit sales of your company
Japanese Car Sales
Yen Depreciation

Unit Sales
5% in price could be expected to lower unit sales by 10%
(sales elasticity of 2)
Solution - In an effort to isolate the impact on GM, they
assumed that any market share losses to Japanese
automakers would be shared equally among and entirely by
3 Big automakers in Detroit.

Are there less information-
intensive methods that might
allow you to assess the
competitive exposures of GM,
specifically, or other firms
generally? How would you
implement such a method?

What is competitive exposure
Exposure resulting from competing against
companies with different currencies

Less information-intensive methods
Examine how FOREX volatility affects
Market Share
Cost Base
Debt
Revenue
Unit Sales
Profit

Market Share
Examine how changes in the exchange rate change the market share of your company
Look at how your market share expands and contracts in response to changes in the exchange rate
If you notice that you lose market share as your currency appreciates against another currency that your competitor uses, you can identify an exposure

Cost Base
Examine how changes in the
exchange rate change the
cost base of your company
Identify what currencies your
costs are denominated in
Compare the share of foreign
currency to your functional
currency and there is where
your exposure lies
57%24%
14%
5%
US$ XCD$ ¥ £
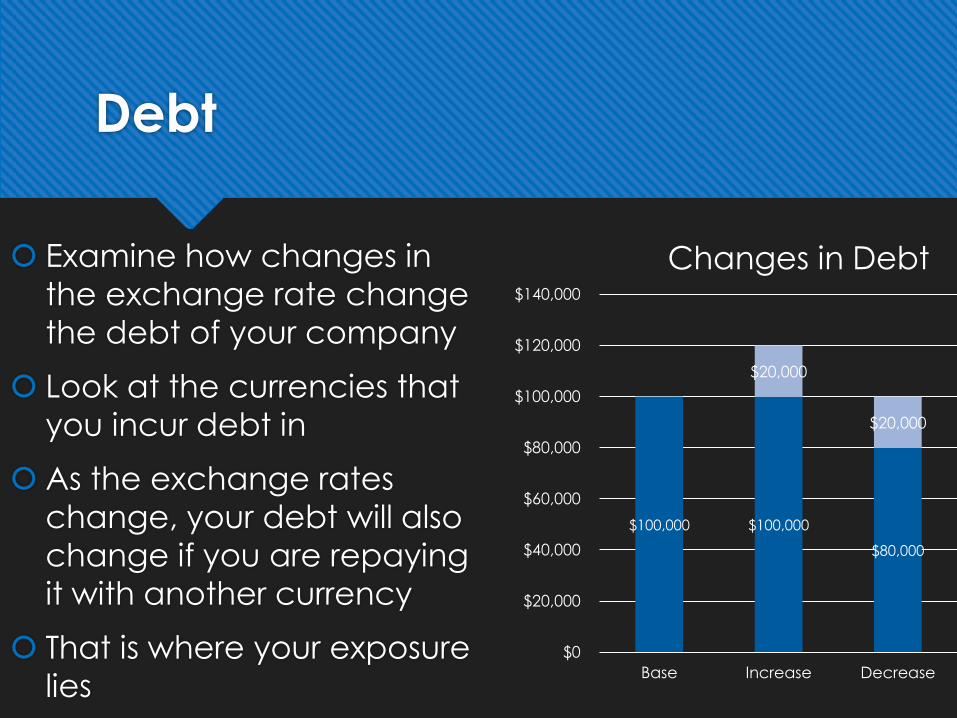
Debt
Examine how changes in
the exchange rate change
the debt of your company
Look at the currencies that
you incur debt in
As the exchange rates
change, your debt will also
change if you are repaying
it with another currency
That is where your exposure
lies
$100,000 $100,000
$80,000
$20,000
$20,000
$0
$20,000
$40,000
$60,000
$80,000
$100,000
$120,000
$140,000
Base Increase Decrease
Changes in Debt

Revenue
Examine how changes in the
exchange rate change the revenue of
your company
Identify how revenue changes at
different exchange rates
If you sell soursop ice-cream to parlors
in Europe, your revenue will decrease
as the Euro becomes weaker against
the EC dollar even if the unit sales
remain the same
This is where you can see your exposure

Units Sales
Examine how changes in the
exchange rate change the unit
sales of your company
As exchange rates change, your
product will become more
expensive or more affordable to
your customers
Your product may then be subject
to the laws of supply and demand.
This is where you will see your
exposure

Profit
Examine how changes in the exchange rate
change the profit of your company
Contracting Market Share
Drop in Car Sales
Short Fall in Profit


References
Academia.edu,. (2015). Financial Statement Analysis. Retrieved 24 March 2015, from http://www.academia.edu/621055/Financial_Statement_Analysis
Elvis Picardo, C. (2005). Economic Exposure Definition | Investopedia. Investopedia. Retrieved 24 March 2015, from http://www.investopedia.com/terms/e/economicexposure.asp
Managementparadise.com,. (2015). Foreign Exchange Hedging Strategies at General Motors by Balajiv Ganesh in Finance category on ManagementParadise.com. Retrieved 24 March 2015, from http://www.managementparadise.com/balajiv.ganesh/documents/7309/foreign-exchange-hedging-strategies-at-general-motors/
Measuring and Protecting against Economic Exposure. (2014). Boundless. Retrieved from https://www.boundless.com/users/233416/textbooks/money-banking-and-international-finance/transaction-and-economic-exposures-19/transaction-and-economic-exposures-40/measuring-and-protecting-against-economic-exposure-150-15248/
Public.kenan-flagler.unc.edu,. (2015). Assignment 3. Retrieved 24 March 2015, from http://public.kenan-flagler.unc.edu/faculty/browngr/macroweb/assignment_3.html
Suwanto, S. (2015). Harvard Business School Study Case: Foreign Exchange Hedging Strategies at General Motors (2004) | Futurum Corfinan. Futurumcorfinan.com. Retrieved 24 March 2015, from http://www.futurumcorfinan.com/2014/09/harvard-business-school-study-case-foreign-exchange-hedging-strategies-at-general-motors-2004/