goal: global opportunity asset locator · goal: global opportunity asset locator ... dollar and the...
TRANSCRIPT

May 17, 2016
GOAL: Global Opportunity
Asset Locator
Portfolio Strategy Research
Conviction themes for a ‘fat and flat’ market; equities to N over 12m
Sticking with ‘fat and flat’; downgrade equities to N for 12m
We downgrade equities to Neutral over 12 months on growth and
valuation concerns. Until we see sustained earnings growth, equities do
not look attractive, especially on a risk-adjusted basis. We expect
particularly poor returns in dollar terms, with our forecast of a stronger
dollar and the prospect of less negative equity/FX correlations.
Remain OW cash, but upgrade commodities to N over 3m
We remain Overweight cash on a 3-month basis, as we see potential for
higher cross-asset volatility. Key risks include less China growth, a general
pick-up of European political risk, a repricing of the Fed rate hike cycle, and
commodity price declines (in particular for metals). But we now expect less
downside to oil over 3 months, given supply disruptions, and upgrade
commodities to Neutral. Our key Overweight remains credit, where
valuations and fundamentals appear supportive. We remain Underweight
bonds and would hedge duration more actively, in particular in the US.
Conviction cross-asset themes in a trendless market
We highlight five conviction cross-asset themes for a volatile but trendless
market: (1) prefer credit to equity, (2) focus on cross-asset carry
opportunities, in particular EM, (3) position for pick-up in US inflation,
which should drive rotation within equities, (4) oil to outperform metals
and drive divergence in equities and credit, and (5) resurgence of
divergence, with a focus on FX, which seems best positioned to benefit.
Our asset allocation, return forecast and preferences with asset classes
Source: Goldman Sachs Global Investment Research.
Christian Mueller-Glissmann, CFA +44(20)7774-1714 [email protected] Goldman Sachs International
Ian Wright +44(20)7774-2600 [email protected] Goldman Sachs International
Peter Oppenheimer +44(20)7552-5782 [email protected] Goldman Sachs International
Jeffrey Currie (212) 357-6801 [email protected] Goldman, Sachs & Co.
Francesco Garzarelli +44(20)7774-5078 [email protected] Goldman Sachs International
Charles P. Himmelberg (917) 343-3218 [email protected] Goldman, Sachs & Co.
Silvia Ardagna +44(20)7051-0584 [email protected] Goldman Sachs International
Robin Brooks (212) 902-8763 [email protected] Goldman, Sachs & Co.
David J. Kostin (212) 902-6781 [email protected] Goldman, Sachs & Co.
Kathy Matsui +81(3)6437-9950 [email protected] Goldman Sachs Japan Co., Ltd.
Timothy Moe, CFA +852-2978-1328 [email protected] Goldman Sachs (Asia) L.L.C.
Goldman Sachs does and seeks to do business with companies covered in its research reports. As a result, investorsshould be aware that the firm may have a conflict of interest that could affect the objectivity of this report. Investorsshould consider this report as only a single factor in making their investment decision. For Reg AC certification and otherimportant disclosures, see the Disclosure Appendix, or go to www.gs.com/research/hedge.html. Analysts employed bynon-US affiliates are not registered/qualified as research analysts with FINRA in the U.S. This report is intended for distribution to GS institutional clients only.
The Goldman Sachs Group, Inc. Global Investment Research
Asset Class Return* Weight** Asset Class Return* Weight**
5 yr. Corp. Bonds -0.4 % OW 5 yr. Corp. Bonds 0.3 % OWUSD HY 0.4 ↑ 1 USD HY 4.2 ↑EUR IG 0.2 ↑ 2 EUR IG 0.7 ↑USD IG -0.8 ↓ 3 USD IG -1.1 ↓
Cash 0.0 OW Equities 8.0 N
Equities 2.1 N TOPIX 19.7 →
TOPIX 6.5 → 1 MSCI Asia Pac ex Japan 9.8 →
MSCI Asia Pac ex Japan 5.9 → 2 STOXX Europe 600 7.0 →
STOXX Europe 600 1.1 → 3 S&P 500 5.1 →
S&P 500 -0.2 → 4 Cash 0.2 NCommodities -5.6 N Commodities -2.2 N
10 yr. Gov. Bonds -1.7 UW 10 yr. Gov. Bonds -5.1 UWGermany -1.3 ↑ 1 Germany -4.8 ↑
US -2.1 ↓ 2 US -5.4 ↓* Total return forecasts in local currency, MXAPJ in USD. ** Arrows denote preferences within asset classes.
3-Month Horizon 12-Month Horizon
May 17, 2016 Global
Goldman Sachs Global Investment Research 2
Asset allocation: Sticking with ‘fat and flat’; equities to N over 12m
Markets have been calmer and cross-asset correlations with oil have fallen since our last
GOAL on March 21. Declines in bond yields, owing to a continued dovish Fed, a weaker
dollar and stronger commodity prices, have been the key cross-asset moves. This has lifted
bond and credit returns, but equities have not benefited much. Global earnings growth
revisions have been negative and equity valuations remain high, with the equity risk
premium a less useful predictor of returns owing to uncertainty over trend growth and
normalisation of bond yields (see GOAL – Global Strategy Paper No. 18: Valuation
investigation: Varying signals for the ERP, May 3, 2016).
We stick with our ‘fat and flat’ view for equities. After the rebound from the trough on
February 11, and with the S&P 500 at the upper end of its recent range, we downgrade
equities to Neutral over a 12-month horizon, in line with our 3-month view. Until we see
sustained signals of growth recovery, we do not feel comfortable taking equity risk,
particularly as valuations are near peak levels. Our equity strategists have become more
defensive, owing to heightened drawdown risk and growth scarcity (see US Weekly
Kickstart, May 13, 2016 and Strategy Expresso, May 16, 2016). While we see some upside
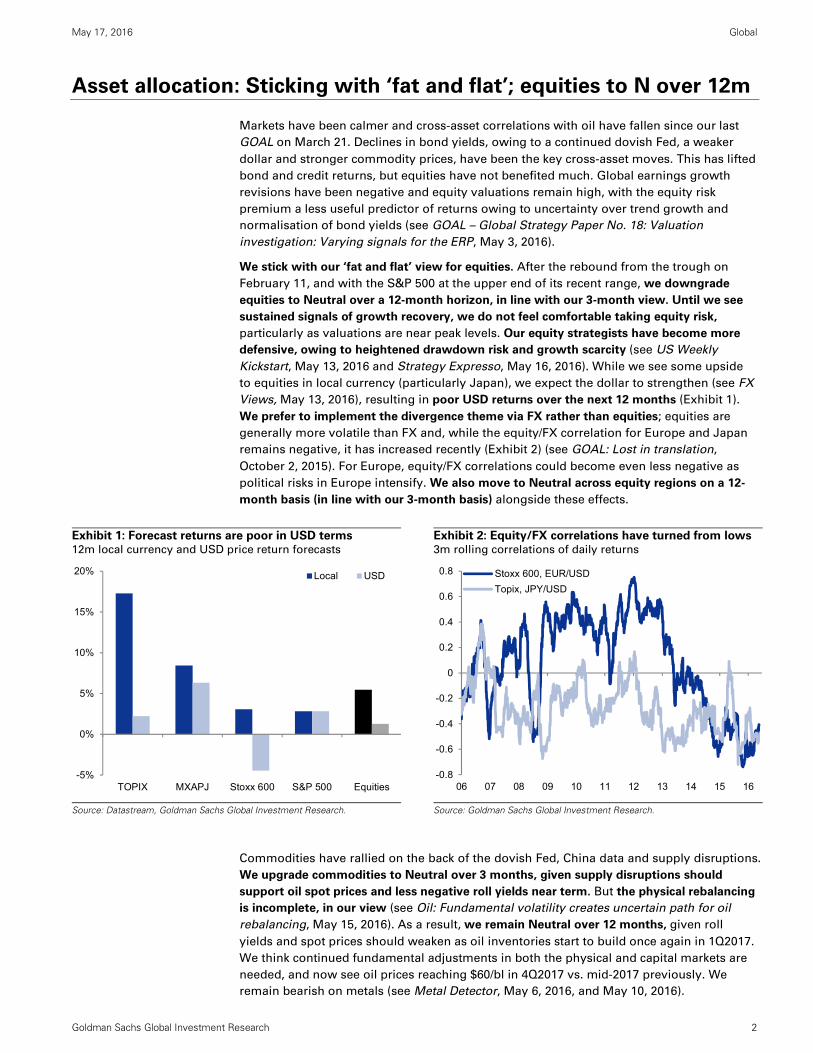
to equities in local currency (particularly Japan), we expect the dollar to strengthen (see FX
Views, May 13, 2016), resulting in poor USD returns over the next 12 months (Exhibit 1).
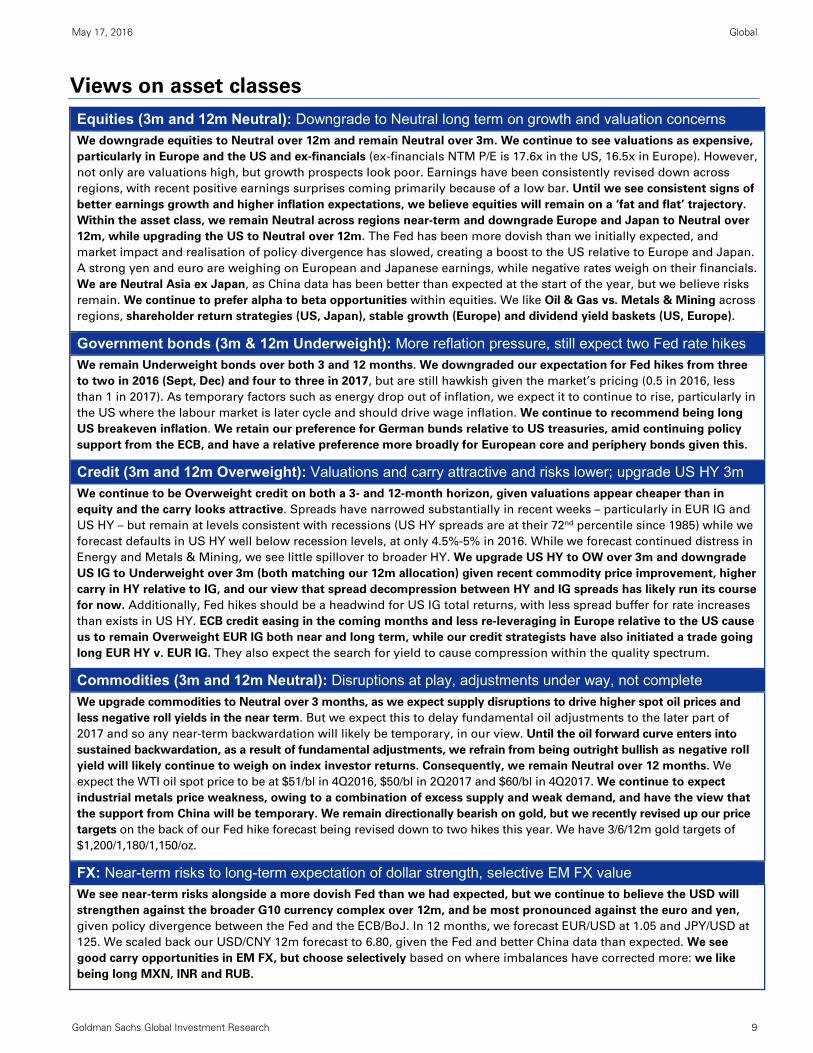
We prefer to implement the divergence theme via FX rather than equities; equities are
generally more volatile than FX and, while the equity/FX correlation for Europe and Japan
remains negative, it has increased recently (Exhibit 2) (see GOAL: Lost in translation,
October 2, 2015). For Europe, equity/FX correlations could become even less negative as
political risks in Europe intensify. We also move to Neutral across equity regions on a 12-
month basis (in line with our 3-month basis) alongside these effects.
Exhibit 1: Forecast returns are poor in USD terms 12m local currency and USD price return forecasts
Exhibit 2: Equity/FX correlations have turned from lows3m rolling correlations of daily returns
Source: Datastream, Goldman Sachs Global Investment Research.
Source: Goldman Sachs Global Investment Research.
Commodities have rallied on the back of the dovish Fed, China data and supply disruptions.
We upgrade commodities to Neutral over 3 months, given supply disruptions should
support oil spot prices and less negative roll yields near term. But the physical rebalancing
is incomplete, in our view (see Oil: Fundamental volatility creates uncertain path for oil
rebalancing, May 15, 2016). As a result, we remain Neutral over 12 months, given roll
yields and spot prices should weaken as oil inventories start to build once again in 1Q2017.
We think continued fundamental adjustments in both the physical and capital markets are
needed, and now see oil prices reaching $60/bl in 4Q2017 vs. mid-2017 previously. We
remain bearish on metals (see Metal Detector, May 6, 2016, and May 10, 2016).
-5%
0%
5%
10%
15%
20%
TOPIX MXAPJ Stoxx 600 S&P 500 Equities
Local USD
-0.8
-0.6
-0.4
-0.2
0
0.2
0.4
0.6
0.8
06 07 08 09 10 11 12 13 14 15 16
Stoxx 600, EUR/USD
Topix, JPY/USD

May 17, 2016 Global
Goldman Sachs Global Investment Research 3
We stay Overweight credit over both 3- and 12-month horizons. Our constructive view on
credit is increasingly one on spreads rather than total returns; post the recent bond rally, we
would start hedging duration risk more actively. We prefer US HY within the asset class over
3 months (in line with 12 months), while we would avoid US IG owing to limited total return
potential. We believe US HY credit still offers high potential carry and wide spreads provide a
buffer for higher rates. A stabilisation of commodity prices coupled with falling correlation
with oil also make US HY credit attractive on a risk-adjusted basis, in our view (see Global
Markets Daily, May 16, 2016). We stay Overweight EUR IG in advance of ECB credit easing
beginning next month. While not in our benchmark, we also prefer EUR HY to IG as investors
move up the risk curve in their search for yield (see also The Credit Trader).
We remain Underweight bonds but have lowered our bond yield forecasts in the major
advanced economies by an average 30-40 bp (see Macro Rates Views, May 10, 2016). This
reflects a downgrade in expected Fed Funds rates hikes from our US economists after
weaker-than-expected labour market data. They now expect two hikes this year (next one
most likely in September) followed by a further three hikes next year, compared with three
and four previously. We continue to expect absorption of duration risk by the ECB and
particularly by the BoJ, delivered in conjunction with negative rates.
Risks abound, OW cash allocation still appears sound
Given we do not see much value across asset classes and we see a variety of cross-asset
risks, we remain Overweight cash near term. We believe the market’s dovish pricing of the
Fed increases rate shock risk, in which case both equity and bonds could sell off. We are also
not convinced the EM rally is sustainable (see EM Spotlight: EM v. DM: A low hurdle, but
outperformance requires EM growth, May 6, 2016), which could weigh on commodities, in
particular metals. China growth concerns could also come back into focus, as we think the
support from policy will fade during 2H2016. Finally, we continue to see elevated European
political risk with uncertainty around the UK’s upcoming EU referendum.
Lost and found: Five conviction themes for a ‘fat and flat’ market
We highlight five conviction cross-asset themes for this volatile but trendless market.
Generally, our focus is shifting to carry strategies across assets and relative value
opportunities. We continue to prefer credit to equity, despite the strong rally in credit, with
the potential for further spread compression high, in our view. We see some attractive carry
opportunities in EM FX, credit and dividends. The main remaining directional conviction view
we have is a continued upward trend in US inflation; once this trend becomes more
established, we think there is potential for sector and style rotation within equities. On the
relative value side, we continue to favour oil vs. metals in equity and credit.
Exhibit 3: Our asset allocation, return forecasts and preferences within asset classes
Source: Goldman Sachs Global Investment Research.
Asset Class Return* Weight** Asset Class Return* Asset Class Return* Weight**
5 yr. Corp. Bonds -0.4 % OW 5 yr. Corp. Bonds -0.6 % 5 yr. Corp. Bonds 0.3 % OWUSD HY 0.4 ↑ 1 USD HY 0.9 1 USD HY 4.2 ↑EUR IG 0.2 ↑ 2 EUR IG 0.4 2 EUR IG 0.7 ↑USD IG -0.8 ↓ 3 USD IG -1.4 3 USD IG -1.1 ↓
Cash 0.0 OW Cash 0.1 Equities 8.0 N
Equities 2.1 N Equities 4.5 1 TOPIX 19.7 →
TOPIX 6.5 → 1 TOPIX 14.7 2 MSCI Asia Pac ex Japan 9.8 →
MSCI Asia Pac ex Japan 5.9 → 2 MSCI Asia Pac ex Japan 6.8 3 STOXX Europe 600 7.0 →
STOXX Europe 600 1.1 → 3 STOXX Europe 600 3.5 4 S&P 500 5.1 →
S&P 500 -0.2 → 4 S&P 500 1.5 Cash 0.2 NCommodities -5.6 N Commodities -5.9 Commodities -2.2 N
10 yr. Gov. Bonds -1.7 UW 10 yr. Gov. Bonds -3.3 10 yr. Gov. Bonds -5.1 UWGermany -1.3 ↑ 1 Germany -2.7 1 Germany -4.8 ↑
US -2.1 ↓ 2 US -3.9 2 US -5.4 ↓* Total return forecasts in local currency, MXAPJ in USD. ** Arrows denote preferences within asset classes.
6-Month Horizon3-Month Horizon 12-Month Horizon

May 17, 2016 Global
Goldman Sachs Global Investment Research 4
(1) Don’t give any credit to equity; prefer credit to equity
Fundamentals: Equity valuations look stretched (NTM P/E for S&P 500 = 16.6x, as at close
on May 16), while credit valuations are less so, particularly in HY (US HY spreads are at
their 72nd percentile since 1985). ECB credit easing and improving oil prices should be
supportive to credit. Historically, US HY has outperformed US equity following peaks in HY
credit spreads (Exhibit 5), and risk-adjusted outperformance has been even stronger. Since
2009, US HY credit has had a Sharpe ratio of 2 compared to 0.58 for the S&P 500, and the
outperformance resumed more recently (Exhibit 6). This mostly reflects lower volatility of
US HY total returns relative to equity, as it benefits from risk-on scenarios (spreads
compress) and risk-off scenarios (bond yields decline).
Implementation: We prefer long US HY credit to S&P 500. While CDX HY has
outperformed a comparable equity basket (see Credit is Moving: Should Equity be
Worried?, May 9, 2016), HY cash spreads still seem high relative to equity implied vol
(Exhibit 7). We also like long EUR HY v. IG (see Credit Notes: Reiterating our compression
view with a recommendation to go long iBoxx EUR HY v. IG, April 19, 2016).
Exhibit 4: US HY credit looks particularly attractive Equity to credit expected return ratio (S&P 500 for equity)
Exhibit 5: US HY outperforms following HY spread peaks BAML US HY Master II and S&P 500 after US HY spread peak
Source: BAML, Datastream, Goldman Sachs Global Investment Research.
Source: BAML, Datastream, Goldman Sachs Global Investment Research.
Exhibit 6: HY credit Sharpe ratios have been picking up Rolling 3m Sharpe ratios for US HY credit and S&P 500
Exhibit 7: HY spreads still seem high relative to equity vol 12m ATM SPX implied vol, US HY credit spread
Source: BAML, Datastream, Goldman Sachs Global Investment Research.
Source: BAML, Goldman Sachs Global Investment Research.
0.0
0.5
1.0
1.5
2.0
2.5
3.0
3.5
00 01 02 03 04 05 06 07 08 09 10 11 12 13 14 15 16
HY (B-rated)
IG (BBB-rated)
Credit more attractive
+3m +6m +3m +6m31-Oct-1987 538 7% 10% 2% 6%31-Jul-1989 598 -3% -6% -1% -3%31-Jan-1991 1014 18% 24% 12% 15%16-Oct-1998 678 7% 10% 18% 26%7-Dec-2000 913 10% 8% -6% -4%30-Oct-2001 973 4% 6% 5% 3%10-Oct-2002 1120 14% 20% 16% 9%17-May-2005 457 6% 5% 4% 7%17-Mar-2008 862 6% -1% 6% -8%15-Dec-2008 2182 11% 44% -12% 8%8-Jun-2010 727 6% 11% 4% 17%4-Oct-2011 910 9% 14% 14% 26%
16-Dec-2014 571 5% 6% 6% 7%11-Feb-2016 887 13% 13%* 13% 14%*
Average 888 8% 12% 6% 9%Median 875 7% 10% 6% 8%
*Values based on 16-May-2016 close. Shading indicates positive returns.
HY peak dateS&P 500 returnsHY returnsHY spread
at peak
-6
-3
0
3
6
9
12 13 14 15 16
US HY
SPX
300
400
500
600
700
800
900
13
15
17
19
21
23
25
27
Jan-12 Jan-13 Jan-14 Jan-15 Jan-16
S&P 500 12-month ATM implied volatility (%)
BAML US HY credit spread (RHS)

May 17, 2016 Global
Goldman Sachs Global Investment Research 5
(2) Carry on – the next phase of the search for yield
Fundamentals: The search for yield has driven up equity and bond valuations, and
investors have a preference for income-bearing assets in the current market environment.
Although dividend yields are elevated (Exhibit 8), the risk of capital loss makes us selective
towards equities as a carry story. In our view, other carry opportunities are more attractive.
Implementation: In addition to US HY credit, we like selective EM FX carry trades where
imbalances have adjusted and valuations are supportive, including RUB, INR and MXN
(Exhibits 9) (see EM FX Views: Good carry, bad carry, March 21, 2016). Both real and
nominal EM FX carry have remained elevated in the recent macro environment (Exhibit 10).
We also like writing OTM puts on EURO STOXX 50 longer-dated dividends as the implied
dividend vol term structure remains very steep (Exhibit 11) and dividend risks are well
discounted, in our view (n.b. put writers’ maximum loss is the strike minus the premium
received) (see Dividend Swap Monitor, April 13, 2016). Stable, more defensive high
dividend yield baskets in Europe (GSSTDIVY) and the US (GSTHDIVG) also appear
attractive to generate carry (see Strategy Matters: Searching for yield in a ‘Fat and Flat’
market, May 10, 2016, and US Weekly Kickstart, April 22, 2016).
Exhibit 8: Equity carry high, but risky; gov bonds low Yield/ carry across assets (percentile over last 10 years)
Exhibit 9: INR and RUB real carry looks attractive Real and nominal carry across EM FX
Source: Datastream, iBoxx, JP, Goldman Sachs Global Investment Research
Source: Goldman Sachs Global Investment Research.
Exhibit 10: EM FX carry good in the macro environment EM carry broken into nominal and real contribution, ann.
Exhibit 11: Implied dividend term structure is steep EURO STOXX 50 dividend put premia and vol term structure
Source: Goldman Sachs Global Investment Research.
Source: Bloomberg, Goldman Sachs Global Investment Research.
0%
10%
20%
30%
40%
50%
60%
70%
80%
90%
100%
-1%
0%
1%
2%
3%
4%
5%
6%
7%
8%
US
HY
EM
Deb
t
EU
R H
Y
EM
FX
Top
ix
Sto
xx 6
00
MX
AP
J
US
IG
S&
P 5
00
US
10y
UK
10y
EU
R I
G
Ge
rman
10
y
Japa
n 1
0y
Current yield
Percentile (RHS)
-1
1
3
5
7
9
11
CZ
K
HU
F
PL
N
RU
B
ZA
R
TR
Y
BR
L
MX
N
CL
P
CO
P
CN
Y
INR
IDR
KR
W
MY
R
TH
B
EM
Real carryInflation differentialNominal carry
-1
0
1
2
3
4
5
6
7
8
04 06 08 10 12 14 16
EM real carry
EM Inflation differential
EM nominal carry
0
2
4
6
8
10
12
14
16
18
0
2
4
6
8
10
12
2016 2017 2018 2019
85
90
95
ATM implied volatility (RHS)

May 17, 2016 Global
Goldman Sachs Global Investment Research 6
(3) Reflation flirtation continuation; positive inflation momentum
Fundamentals: While inflation expectations inflected in February (Exhibit 12), breakeven
inflation remains underpriced, in our view, particularly in the US (see Macro Rates Views:
Lower Rate Forecasts, But Reflation Theme Intact, May 10, 2016). We expect inflation to
continue to rise as the US labour market moves to full employment – pushing wage
inflation higher – and the drag from healthcare and energy prices gradually drops out
(Exhibit 13) (see US Views: Stepping Back, May 8, 2016). However, inflation swap pricing is
actually low enough that it implies the WTI oil price will be around $30/bl in 2018 (Exhibit
14). In our view, nominal bonds are expensive, reflecting this mispricing.
Implementation: Long US breakeven inflation via long US 10Y TIPs vs. US 10Y nominal
bonds. As US inflation picks up, we would gradually roll exposure from stable growth,
defensive and lower volatility to more cyclical sectors that have historically benefited from
such a shift (see GOAL: Reflation Flirtation: Near-term risks to relief rally, upgrade cash,
March 21, 2016). We expect bond proxy sectors to suffer, in particular (Exhibit 15). The Fed
raising interest rates would only contribute further to this repricing, in our view. In Europe
and Japan, however, with inflation momentum less strong, this rotation might take longer.
Exhibit 12: US breakeven inflation has troughed US 10-year breakeven inflation
Exhibit 13: We expect a continued pick-up in US CPI Contribution of major constituents to headline US inflation
Source: Datastream, Goldman Sachs Global Investment Research.
Source: Federal Reserve, Haver, Goldman Sachs Global Investment Research.
Exhibit 14: US inflation market is saying oil stays low WTI, GS forecasts, WTI forwards and implied WTI pricing
Exhibit 15: Cyclicals should pick up while defensives lagMSCI World sector correlations with US inflation since 2008
Source: Goldman Sachs Global Investment Research. As of Feb 2016.
Source: Datastream, Goldman Sachs Global Investment Research.
0.5
1.0
1.5
2.0
2.5
3.0
3.5
97 99 01 03 05 07 09 11 13 15
US 10-year breakeven inflation Average
-3.0
-1.5
0.0
1.5
3.0
4.5
6.0
7.5
Jan-10 Jul-11 Jan-13 Jul-14 Jan-16 Jul-17 Jan-19
Non energy industrial goodsEnergyFoodServicesHeadlineGS CPI ForecastMarket Pricing Implied from Inflation Swaps
%
30
55
80
105
13 14 15 16 17 18
WTI
GS Forecast
Oil Forwards
US Inflation Swap Implied Pricingof WTI for Core-CPI at 2%
$/bbl
-0.4 -0.2 0 0.2 0.4
Materials
Energy
Financials
Industrials
IT
Utilities
Cons Discr
Health Care
T/cm Svs
Cons Staples
5y5y inflation swap
Sectors which underperform
Sectors which outperform

May 17, 2016 Global
Goldman Sachs Global Investment Research 7
(4) Heavy metal, oil floats; pick-up of commodities dispersion
Fundamentals: In our view, the outlook for metals continues to be bearish as supply
curtailments come off in China and elsewhere (see Metal Detector, May 6, 2016). In
contrast, our commodities team sees oil moving to $60/bl in 4Q2017, albeit with mid-term
downside risks (see Oil: Fundamental volatility creates uncertain path for oil rebalancing,
May 15, 2016). As performance of the Oil & Gas and Metals & Mining/Basic Resources
sectors have closely tracked these prices (Exhibits 16 and 17), we like going long oil & gas
vs. metals in both equities and credit.
Implementation: This appears best done in equity, given lower transaction costs and lack
of indices in credit. Valuation and implied vol of the Stoxx Europe 600 Oil & Gas sector
(SXEP) is low relative to the Basic Resources sector (SXPP) (Exhibits 18 and 19). We think it
attractive to write SXPP calls to finance SXEP calls (maximum potential loss is unlimited).
Alternatively, as WTI implied vol is at the upper end of its range, while copper implied vol
is at the bottom end of its range, selling WTI puts could finance copper puts (maximum
potential loss is the WTI put strike minus premium plus the copper put premium).
Exhibit 16: We expect oil prices to continue to rebound…MSCI World Oil & Gas; WTI oil price, forecast in dotted line
Exhibit 17: …while metals prices continue to decline MSCI World Met. & Min.; Copper price, forecast in dotted line
Source: Datastream, Goldman Sachs Global Investment Research.
Source: Datastream, Goldman Sachs Global Investment Research.
Exhibit 18: Relative valuation is attractive in Europe… Stoxx 600 Oil & Gas v. Basic Resources NTM P/E
Exhibit 19: …and implied vol spread is attractively wide Stoxx 600 sector 3-month ATM implied volatility
Source: Datastream, I/B/E/S, Goldman Sachs Global Investment Research.
Source: Goldman Sachs Global Investment Research.
20
25
30
35
40
45
50
55
60
65
60
65
70
75
80
85
90
95
100
105
Jan-15 Jul-15 Jan-16 Jul-16 Jan-17
MSCI World Oil & Gas
WTI oil price (RHS, $/bl)
4000
4500
5000
5500
6000
6500
40
50
60
70
80
90
100
110
Jan-15 Jul-15 Jan-16 Jul-16 Jan-17
MSCI World Metals and Mining
Copper price (RHS, $/mt)
0.5
0.7
0.9
1.1
1.3
1.5
1.7
1.9
2.1
00 02 04 06 08 10 12 14 16
SXEP v. SXPP 12-month forward P/E
Average
Current
-10
0
10
20
30
40
50
0
10
20
30
40
50
60
70
80
90
100
05 06 07 08 09 10 11 12 13 14 15 16
Oil & Gas
Basic Resources
SXPP - SXEP Spread (RHS)

May 17, 2016 Global
Goldman Sachs Global Investment Research 8
(5) Resurgence of divergence; FX best placed
Fundamentals: We expect two Fed rate hikes this year and three in 2017, while policy
easing continues in Japan and Europe. With Japanese and European areas facing
questions about the efficacy of policy and concerns about growth and inflation, equity
valuations relative to the US have come down (Exhibit 20). Speculative dollar positioning
has come down even more sharply (Exhibit 21), leading our FX team to argue the dollar is
near a bottom (see Global Markets Daily: The Dollar Bottom, May 10, 2016).
Implementation: Europe and Japan equity/FX correlations have risen from their all-time
lows (Exhibit 2) (see GOAL: Lost in translation; Equity/FX correlations back to extremes,
October 2, 2015), and could become less negative as political risks in Europe play out and
growth concerns in both regions remain. This could result in currencies weakening without
equity outperforming. We think currencies are better positioned than equity to benefit
from policy divergence, and we think JPY/USD will in particular weaken in the coming
months (Exhibit 22). Historically, Japanese and European FX has been less volatile and less
prone to large, fast drawdowns than equity. Range-bound 10y bond yield differentials
make us less comfortable positioning for a divergence in rates (Exhibit 23).
Exhibit 20: QE premium has been entirely undone Stoxx 600 and Topix NTM P/E relative to S&P 500 NTM P/E
Exhibit 21: Dollar positioning has come down a lot Speculative USD longs (+) against currencies in CFTC CoT
Source: Datastream, I/B/E/S, Goldman Sachs Global Investment Research.
Source: CFTC, Bloomberg, Goldman Sachs Global Investment Research.
Exhibit 22: Yen has strengthened despite IR differentialsUS/Japan 2y interest rate differentials, USD/JPY (RHS)
Exhibit 23: Yield differentials have been range bound US/Japan, US/Germany 10y interest rate differentials
Source: Goldman Sachs Global Investment Research.
Source: Datastream, Goldman Sachs Global Investment Research.
0.7
0.8
0.9
1
1.1
1.2
1.3
1.4
1.5
0.75
0.8
0.85
0.9
0.95
1
10 11 12 13 14 15 16
SXXP v. SPX
TPX v. SPX (RHS)
-60
-50
-40
-30
-20
-10
0
10
20
30
40
50
10 11 12 13 14 15 16
EUR JPY GBP
AUD CAD CHF
MXN NZD Total
75
85
95
105
115
125
135
145
0
0.2
0.4
0.6
0.8
1
1.2
10 11 12 13 14 15 16
US-Japan 2y bond yield
USD/JPY (RHS)
-0.5%
0.0%
0.5%
1.0%
1.5%
2.0%
2.5%
3.0%
10 11 12 13 14 15 16
US-Japan 10y
US-Germany 10y
May 17, 2016 Global
Goldman Sachs Global Investment Research 9
Views on asset classes
Equities (3m and 12m Neutral): Downgrade to Neutral long term on growth and valuation concerns We downgrade equities to Neutral over 12m and remain Neutral over 3m. We continue to see valuations as expensive,
particularly in Europe and the US and ex-financials (ex-financials NTM P/E is 17.6x in the US, 16.5x in Europe). However,
not only are valuations high, but growth prospects look poor. Earnings have been consistently revised down across
regions, with recent positive earnings surprises coming primarily because of a low bar. Until we see consistent signs of
better earnings growth and higher inflation expectations, we believe equities will remain on a ‘fat and flat’ trajectory.
Within the asset class, we remain Neutral across regions near-term and downgrade Europe and Japan to Neutral over
12m, while upgrading the US to Neutral over 12m. The Fed has been more dovish than we initially expected, and
market impact and realisation of policy divergence has slowed, creating a boost to the US relative to Europe and Japan.
A strong yen and euro are weighing on European and Japanese earnings, while negative rates weigh on their financials.
We are Neutral Asia ex Japan, as China data has been better than expected at the start of the year, but we believe risks
remain. We continue to prefer alpha to beta opportunities within equities. We like Oil & Gas vs. Metals & Mining across
regions, shareholder return strategies (US, Japan), stable growth (Europe) and dividend yield baskets (US, Europe).
Government bonds (3m & 12m Underweight): More reflation pressure, still expect two Fed rate hikes We remain Underweight bonds over both 3 and 12 months. We downgraded our expectation for Fed hikes from three
to two in 2016 (Sept, Dec) and four to three in 2017, but are still hawkish given the market’s pricing (0.5 in 2016, less
than 1 in 2017). As temporary factors such as energy drop out of inflation, we expect it to continue to rise, particularly in
the US where the labour market is later cycle and should drive wage inflation. We continue to recommend being long
US breakeven inflation. We retain our preference for German bunds relative to US treasuries, amid continuing policy
support from the ECB, and have a relative preference more broadly for European core and periphery bonds given this.
Credit (3m and 12m Overweight): Valuations and carry attractive and risks lower; upgrade US HY 3m We continue to be Overweight credit on both a 3- and 12-month horizon, given valuations appear cheaper than in
equity and the carry looks attractive. Spreads have narrowed substantially in recent weeks – particularly in EUR IG and
US HY – but remain at levels consistent with recessions (US HY spreads are at their 72nd percentile since 1985) while we
forecast defaults in US HY well below recession levels, at only 4.5%-5% in 2016. While we forecast continued distress in
Energy and Metals & Mining, we see little spillover to broader HY. We upgrade US HY to OW over 3m and downgrade
US IG to Underweight over 3m (both matching our 12m allocation) given recent commodity price improvement, higher
carry in HY relative to IG, and our view that spread decompression between HY and IG spreads has likely run its course
for now. Additionally, Fed hikes should be a headwind for US IG total returns, with less spread buffer for rate increases
than exists in US HY. ECB credit easing in the coming months and less re-leveraging in Europe relative to the US cause
us to remain Overweight EUR IG both near and long term, while our credit strategists have also initiated a trade going
long EUR HY v. EUR IG. They also expect the search for yield to cause compression within the quality spectrum.
Commodities (3m and 12m Neutral): Disruptions at play, adjustments under way, not complete
We upgrade commodities to Neutral over 3 months, as we expect supply disruptions to drive higher spot oil prices and
less negative roll yields in the near term. But we expect this to delay fundamental oil adjustments to the later part of
2017 and so any near-term backwardation will likely be temporary, in our view. Until the oil forward curve enters into
sustained backwardation, as a result of fundamental adjustments, we refrain from being outright bullish as negative roll
yield will likely continue to weigh on index investor returns. Consequently, we remain Neutral over 12 months. We
expect the WTI oil spot price to be at $51/bl in 4Q2016, $50/bl in 2Q2017 and $60/bl in 4Q2017. We continue to expect
industrial metals price weakness, owing to a combination of excess supply and weak demand, and have the view that
the support from China will be temporary. We remain directionally bearish on gold, but we recently revised up our price
targets on the back of our Fed hike forecast being revised down to two hikes this year. We have 3/6/12m gold targets of
$1,200/1,180/1,150/oz.
FX: Near-term risks to long-term expectation of dollar strength, selective EM FX value We see near-term risks alongside a more dovish Fed than we had expected, but we continue to believe the USD will
strengthen against the broader G10 currency complex over 12m, and be most pronounced against the euro and yen,
given policy divergence between the Fed and the ECB/BoJ. In 12 months, we forecast EUR/USD at 1.05 and JPY/USD at
125. We scaled back our USD/CNY 12m forecast to 6.80, given the Fed and better China data than expected. We see
good carry opportunities in EM FX, but choose selectively based on where imbalances have corrected more: we like
being long MXN, INR and RUB.

May 17, 2016 Global
Goldman Sachs Global Investment Research 10
Asset class forecast returns and performance Forecasts and views on specific asset classes are attributed as follows:
Equities: Peter Oppenheimer, Kathy Matsui, Tim Moe, David Kostin; Credit: Charlie Himmelberg;
Bonds: Francesco Garzarelli; FX: Robin Brooks, Sylvia Ardagna; Commodities: Jeff Currie.
Exhibit 24: Goldman Sachs’ 3-, 6- and 12-month return forecasts by asset class
Source: Goldman Sachs Global Investment Research.
Exhibit 25: Performance of asset classes since our last GOAL report
Source: Datastream, Goldman Sachs Global Investment Research.
Local currency In USD Local currency In USD Local currency In USD
Equities 35 2.2 1.2 4.8 2.5 8.5 4.2
S&P 500 40 -0.2 -0.2 1.5 1.5 5.1 5.1
STOXX Europe 600 30 1.1 -0.1 3.5 0.5 7.0 -0.9
MSCI Asia Pac ex Japan 20 6.7 5.9 8.4 6.8 11.9 9.8
TOPIX 10 6.5 0.9 14.7 4.1 19.7 4.3
10 yr. Government Bonds 45 -1.7 -2.2 -3.3 -3.6 -5.1 -8.6US 50 -2.1 -2.1 -3.9 -3.9 -5.4 -5.4Germany 50 -1.3 -2.4 -2.7 -3.4 -4.8 -11.7
5 yr. Corporate Bonds 10 -0.4 -0.6 -0.6 -1.1 0.3 -1.2US: iBoxx USD Dom. Corporates 60 -0.8 -0.8 -1.4 -1.4 -1.1 -1.1BAML HY Master Index II 20 0.4 0.4 0.9 0.9 4.2 4.2Europe: iBoxx EUR Corporates 20 0.2 -0.9 0.4 -2.5 0.7 -6.7
Commodities (GSCI Enhanced) 5 -5.6 -5.6 -5.9 -5.9 -2.2 -2.2
Cash 5 0.0 -0.5 0.1 -1.4 0.2 -3.5US 50 0.2 0.2 0.3 0.3 0.6 0.6Germany 50 -0.1 -1.2 -0.1 -3.0 -0.3 -7.6
FX 3 month target Return 6 month target Return 12 month target ReturnEUR/$ 1.12 -1.1 1.10 -2.9 1.05 -7.3$/YEN 115 5.5 120 10.1 125 14.7
Asset Class12-month Total ReturnBenchmark
Weight6-month Total Return3-month Total Return
94
97
100
103
106
21-Mar 28-Mar 04-Apr 11-Apr 18-Apr 25-Apr 02-May 09-May 16-May
EquitiesS&P 500TopixMXAPJStoxx Europe 600
98
99
100
101
102
103
104
21-Mar 04-Apr 18-Apr 02-May 16-May
Government bonds
US 10 year Gov. bonds
German 10 year Gov. bonds
98
99
100
101
102
103
104
21-Mar 04-Apr 18-Apr 02-May 16-May
Credit
US IG Credit
European IG Credit
US HY Credit
92
94
96
98
100
102
104
106
108
21-Mar 04-Apr 18-Apr 02-May 16-May
Commodities

May 17, 2016 Global
Goldman Sachs Global Investment Research 11
Key macro forecasts
Exhibit 26: Our key forecasts across asset classes
Source: Datastream, iBoxx, S&P, Goldman Sachs Global Investment Research.
Exhibit 27: US GDP growth vs. our CAI
Exhibit 28: Euro area GDP growth vs. our CAI
Source: Goldman Sachs Global Investment Research.
Source: Goldman Sachs Global Investment Research.
Exhibit 29: Our forecasts for economic growth (real GDP) vs. consensus
Source: Consensus Economics, Goldman Sachs Global Investment Research.
Return in % over last Current12 m 3 m 1 m YTD Level 3m 6m 12 m Unit 3m 6m 12 m
EquitiesS&P 500 ($) -0.5 9.6 -0.5 2.0 2067 2050 2075 2125 Index -0.8 0.4 2.8Stoxx Europe 600 (€) -12.7 6.5 -1.4 -6.6 335 335 340 345 Index 0.1 1.6 3.1MSCI Asia-Pacific Ex-Japan ($) -19.0 7.7 -5.1 -2.0 400 420 420 425 Index 5.1 5.1 6.3Topix (¥) -16.0 2.9 -2.9 -13.7 1322 1400 1500 1550 Index 5.9 13.5 17.3
10 Year Government Bond YieldsUS 5.7 0.9 0.0 5.6 1.77 2.03 2.28 2.55 % 26 bps 51 bps 78 bpsGermany 6.3 1.2 0.0 5.5 0.14 0.28 0.43 0.65 % 14 bps 29 bps 51 bpsJapan 7.4 0.6 0.4 5.6 -0.11 -0.05 0.05 0.20 % 6 bps 16 bps 31 bpsUK 6.0 1.6 0.0 3.9 1.39 1.65 1.75 1.95 % 26 bps 36 bps 56 bps
5 year credit spreads*iBoxx USD 3.6 5.6 0.4 5.3 124 122 119 109 Bps -2 bps -5 bps -16 bpsBAML HY Master Index II -1.7 11.7 1.7 7.2 630 620 610 564 Bps -10 bps -20 bps -66 bpsiBoxx EUR 2.1 2.9 0.1 2.9 133 124 115 105 Bps -9 bps -19 bps -29 bps
CommoditiesWTI -30.2 35.5 13.2 14.0 48 49 51 50 $/bbl 2.7 6.9 4.8Copper -27.1 2.2 -3.4 -1.0 4645 4500 4200 4000 $/mt -3.1 -9.6 -13.9Aluminium -19.7 1.0 -0.9 1.6 1548 1450 1400 1350 $/mt -6.3 -9.6 -12.8Gold 3.6 5.5 3.2 20.2 1276 1200 1180 1150 $/troy oz -5.9 -7.5 -9.8Wheat -9.8 0.2 1.5 -1.6 475 490 490 490 Cent/bu 3.2 3.2 3.2Soybeans 12.5 19.7 10.4 21.8 1065 875 875 875 Cent/bu -17.8 -17.8 -17.8Corn -4.1 4.7 2.0 5.3 394 375 375 375 Cent/bu -4.8 -4.8 -4.8
FXEUR/USD -0.9 1.7 0.3 4.3 1.13 1.12 1.10 1.05 -1.1 -2.9 -7.3USD/JPY -8.8 -4.4 0.1 -9.5 109 115 120 125 5.5 10.1 14.7
* We show performance for credit and gov. bonds in total return terms, but current level and forecasts are for spreads and rates, respectively.
Forecasts Up/ (downside) in %
-3
-2
-1
0
1
2
3
4
5
6
2011 2012 2013 2014 2015 2016 2017
%
Annualised QoQ GDP GrowthGS ForecastCAI
Q2‐16 Q3‐16 Q4‐16 Q1‐17 Q2‐17 Q3‐17 Q4‐17 Q1‐18
2.6 2.3 2.3 2.0 2.0 2.0 2.0 2.0
QoQ GDP Growth Forecasts (% Annualised)
-3
-2
-1
0
1
2
3
4
5
6
2011 2012 2013 2014 2015 2016 2017
% Annualised QoQ GDP GrowthGS ForecastCAI
Q2‐16 Q3‐16 Q4‐16 Q1‐17 Q2‐17 Q3‐17 Q4‐17 Q1‐18
1.7 1.6 1.8 1.3 1.7 1.1 1.4 1.5
QoQ GDP Growth Forecasts (% Annualised)
2014 2015E 2017E 2018EGS GS GS Consensus* GS GS
USA 2.4 2.4 1.8 2.0 2.1 2.0Japan 0.0 0.5 0.5 0.6 0.7 0.7Euro Area 0.9 1.5 1.4 1.5 1.5 1.6UK 2.9 2.3 2.1 2.0 2.1 2.3BRICs 5.8 4.7 5.2 5.0** 5.9 5.9Advanced Economies 1.9 1.9 1.7 1.8 1.9 1.9World 3.4 3.1 3.2 3.0 3.6 3.7* Consensus Economics April 2016. **Consensus Economics March 2016.
% yoy2016E

May 17, 2016 Global
Goldman Sachs Global Investment Research 12
Macro monitor: EM/Japan macro surprises positive, from a low bar
Exhibit 30: Current activity indicator (CAI)
Exhibit 31: Financial condition indices (FCI)
Source: Goldman Sachs Global Investment Research. Source: Goldman Sachs Global Investment Research.
Exhibit 32: Inflation (CPI, yoy)
Exhibit 33: Macro surprise indices (MAP, 1-week avg)
Source: Goldman Sachs Global Investment Research. Source: Goldman Sachs Global Investment Research.
Exhibit 34: Manufacturing PMIs
Exhibit 35: GLI momentum and global IP
Source: Markit via Haver, Goldman Sachs Global Investment Research. Source: Goldman Sachs Global Investment Research.
-2
-1
0
1
2
3
4
5
Jan-12 Sep-12 May-13 Jan-14 Sep-14 May-15 Jan-16
Euro area UK US
92
94
96
98
100
102
104
Jan-12 Sep-12 May-13 Jan-14 Sep-14 May-15 Jan-16
USUKJapanEuro area
-1.5
-1.0
-0.5
0.0
0.5
1.0
1.5
2.0
2.5
3.0
3.5
4.0
Jan-12 Sep-12 May-13 Jan-14 Sep-14 May-15 Jan-16
Euro Area US UK Japan-2.5
-2.0
-1.5
-1.0
-0.5
0.0
0.5
1.0
1.5
2.0
2.5
Jan-12 Sep-12 May-13 Jan-14 Sep-14 May-15 Jan-16
Euro area Japan US EM
42
44
46
48
50
52
54
56
58
60
Jan-12 Sep-12 May-13 Jan-14 Sep-14 May-15 Jan-16
Euro areaUS (ISM)JapanUKEM -0.2
-0.1
0.0
0.1
0.2
0.3
0.4
0.5
Jan-12 Sep-12 May-13 Jan-14 Sep-14 May-15 Jan-16
GLI Momentum
Global IP (3mm %MoM, RHS)

May 17, 2016 Global
Goldman Sachs Global Investment Research 13
Equities (3- and 12-month Neutral)
Exhibit 36: Forecast returns and our recommended regional weightings within equities Total return forecasts (in local currency and in USD) and the allocation relative to benchmark on 3- and 12-month horizons
Source: Bloomberg, Datastream, Goldman Sachs Global Investment Research.
Exhibit 37: Dividend yields are high vs. real bond yields Dividend yields minus 10-year real government bond yields.
We use five-year average inflation as a proxy for inflation
expectations. The distribution uses data from 1990, Asia ex-
Japan from 1995
Exhibit 38: Valuation ranges of major market indices
12-month forward P/E over the past 10 years
Source: Datastream, Haver, Goldman Sachs Global Investment Research
Source: MSCI, I/B/E/S, Datastream, Goldman Sachs GIR.
Exhibit 39: Global valuation metrics and earnings growth P/E is NTM on consensus estimates, all other data is for 2015 or last twelve months.
Source: Worldscope, I/B/E/S, Datastream, FactSet, Goldman Sachs Global Investment Research.
Current Level Wgt Local USD Level Wgt Local USD Local USD 2017 2018
TOPIX 1322 1400 N 6 % 0 % 1550 N 17 % 2 % 20 % 4 % 1700 1800 12 %
MSCI Asia Pac ex Japan 400 420 N 6 % 5 % 425 N 8 % 6 % 12 % 10 % 450 480 7 %
STOXX Europe 600 335 335 N 0 % (1)% 345 N 3 % (4)% 7 % (1)% 350 360 3 %
S&P 500 2067 2050 N (1)% (1)% 2125 N 3 % 3 % 5 % 5 % 2200 2300 4 %
3-month Long-term forecast
CAGR to 2018 (local)
LevelTotal return 12-month
Price Return Price Return
-8.0
-6.0
-4.0
-2.0
0.0
2.0
4.0
6.0
Europe US Asia Ex-Japan Japan
+/- 1 Stdev Current Average
16.6 14.6
12.2
12.6
11.2
15.5
5
10
15
20
25
30
S&P 500 STOXX600
MXAPJ TOPIX MSCI EM MSCIWorld
+/- 1 Std.dev.CurrentMedian
High/low
P/E EV / EBITDA FCF Yield Div Yield P/B Net Income ROE Implied(X) (X) (%) (%) (X) Margin (%) (%) ERP (%)
S&P 500 16.8 10.9 4.5 2.2 2.7 8.9 14.2 5.8STOXX 600 14.5 9.6 4.8 3.6 1.6 6.6 7.9 8.5
MSCI Asia Pacific ex-Japan 12.3 6.6 7.8 3.3 1.4 8.6 10.4 9.4Topix 12.7 4.2 3.8 2.3 1.1 4.3 7.5 7.3
Note: TOPIX EPS is based on fiscal, not calendar, years (i.e 2015 represents the fiscal year ending in March 2016). As of May 13, 2016.
2016E 2017E 2016E 2017ES&P 500 9 12 1 12
Stoxx Europe 600 -2 15 1 13MSCI Asia Pacific ex-Japan 2 7 1 11
Topix 11 7 15 NA* TOPIX data based on March-ending fiscal year (the year after). The rest based on December-ending fiscal year.* Growth rates are based off local currency. US Consensus Bottom-Up reflects adjusted EPS. As of May 13, 2016.
Earnings growth forecast (%)GS top-down Consensus bottom-up

May 17, 2016 Global
Goldman Sachs Global Investment Research 14
Government bonds (3- and 12-month Underweight)
Exhibit 40: 10-year bond yields: Market vs. GS Sudoku Model*, spot and 3 months into the future
Source: Goldman Sachs Global Investment Research; *Close May 16, 2016. **CE stands for Consensus Economics inputs of macroeconomic fundamentals (latest available month), GS stands for GS Economic Research inputs (current month).
Exhibit 41: USD yield curve dynamics Exhibit 42: DEM yield curve dynamics
Source: Bloomberg, Goldman Sachs Global Investment Research. Source: Bloomberg, Goldman Sachs Global Investment Research.
Exhibit 43: Degree of 10-year bond mispricing according
to GS Sudoku
Exhibit 44: 10-year US yields vs. GS Sudoku fair value
Source: Goldman Sachs Global Investment Research. Source: Bloomberg, Goldman Sachs Global Investment Research.
CE GS CE GS GS
USA 1.76 -1.62 -2.12 2.57 2.82 0.31
Germany 0.16 -1.48 -1.68 1.33 1.49 0.18
Japan -0.10 -1.53 -1.44 0.58 0.54 -0.03
UK 1.41 -1.25 -1.44 2.48 2.64 0.20
Canada 1.31 -1.31 -1.99 2.27 2.77 0.56
Australia 2.30 -1.14 -1.50 3.40 3.74 0.34
Switzerland -0.29 -1.51 -1.82 0.68 0.87 0.21
Sweden 0.53 -0.90 -1.02 1.62 1.77 0.17
Actual* (%)Misvaluation against fair value**,
standard deviationsFair value**, %
Fair value change (due to change in fundamentals),
t + 3mth
0.0
0.5
1.0
1.5
2.0
2.5
3.0
3m 6m 1y 2y 3y 5y 7y 10y 20y 30y
%Actual (16/5/2016)
Actual, month before (15/4/2016)
Actual, quarter before (14/2/2016)
-0.8
-0.3
0.2
0.7
1.2
3m 1y 3y 5y 7y 9y 20y
%
Actual (16/5/2016)
Actual, month before (15/4/2016)
Actual, quarter before (14/2/2016)
-3.0
-2.0
-1.0
0.0
1.0
2.0
05 06 07 08 09 10 11 12 13 14 15 16
St.Dev.
USA Germany
Japan UK
1
2
3
4
09 10 11 12 13 14 15 16 17
+/- 1 std dev.US 10-yr yieldSudoku 'Fair' ValueCurrent Market PricingGS Forecast
%

May 17, 2016 Global
Goldman Sachs Global Investment Research 15
Credit (3- and 12-month Overweight)
Exhibit 45: From current spread levels, we expect
another 5bp of spread tightening in US IG and 35bp in
US HY by year-end, and 21bps in EUR IG
Exhibit 46: CRP indicates best opportunity in B and BB
rated bonds 5-year spread decomposition into our estimates of expected
losses and CRP (bp)
Source: iBoxx, BAML, Haver Analytics, Goldman Sachs Global Investment Research.
Source: Moody’s, iBoxx, BAML, Haver Analytics, Goldman Sachs Global Investment Research.
Exhibit 47: USD spread forecast for IG 5y Fin vs Non-Fin
Exhibit 48: EUR spread forecast for IG 5y Fin vs Non-Fin
Source: BAML, Haver Analytics, iBoxx, Goldman Sachs Global Investment Research.
Source: BAML, Haver Analytics, iBoxx, Goldman Sachs Global Investment Research.
Exhibit 49: Long term, we expect a rally from current US
HY levels
Exhibit 50: We expect the current benign default
environment to persist Our HY default rate forecasts vs. actual default rate
Source: BAML, Haver Analytics, iBoxx, Goldman Sachs Global Investment Research.
Source: Moody’s, Goldman Sachs Global Investment Research.

May 17, 2016 Global
Goldman Sachs Global Investment Research 16
Commodities (3- and 12-month Neutral)
Exhibit 51: S&P GSCI ® Enhanced Commodity Index total return forecasts
Source: S&P, Goldman Sachs Global Investment Research.
FX (USD strength to resume)
Exhibit 52: We expect the US dollar TWI to resume
strengthening against the G10 through the end of 2017
Exhibit 53: EUR, USD and JPY trade-weighted index
(TWI)
Source: Bloomberg, Goldman Sachs Global Investment Research.
Source: Goldman Sachs Global Investment Research.
CurrentWeight
(%) 2014 2015 2016 YTD¹ 3-months 6-months 12-months
S&P GSCI Enhanced Commodity Index 100.0 -31.1 -29.9 9.3 -5.6 -5.9 -2.2Energy 58.9 -42.2 -36.8 12.5 -5.5 -4.4 4.0Industrial Metals 8.6 -7.3 -24.3 1.4 -4.2 -9.4 -13.2Precious Metals 4.7 -4.1 -11.1 20.6 -5.6 -7.2 -9.5Agriculture 19.2 -9.3 -17.1 5.2 -7.6 -9.7 -12.2Livestock 8.6 27.0 -19.1 -0.5 -2.8 -3.4 -6.7
¹ YTD returns through May 16, 2016 close.
Return forecasts (%)Returns (%)
60
70
80
90
100
110
120
130
-1.5
-1.0
-0.5
0.0
0.5
1.0
1.5
2.0
2.5
3.0
99 01 03 05 07 09 11 13 15
2-year rate differential5-year rate differential10-year rate differentialUSD G10 trade-weighted index
60
70
80
90
100
110
120
130
140
Jan-12 Sep-12 May-13 Jan-14 Sep-14 May-15 Jan-16
Euro TWI
USD TWI
JPY TWI
Index(Jan-12=100)

May 17, 2016 Global
Goldman Sachs Global Investment Research 17
Equity Basket Disclosure
The ability to trade the baskets discussed in this research will depend upon market conditions, including liquidity and
borrow constraints at the time of trade.
Option specific disclosures
Price target methodology: Please refer to the analyst’s previously published research for methodology and risks
associated with equity price targets.
Pricing Disclosure: Option prices and volatility levels in this note are indicative only, and are based on our estimates of
recent mid-market levels (unless otherwise noted). All prices and levels exclude transaction costs unless otherwise
stated.
General Options Risks – The risks below and any other options risks mentioned in this research report pertain both to
specific derivative trade recommendations mentioned and to discussion of general opportunities and advantages of
derivative strategies. Unless otherwise noted, options strategies mentioned in this report may be a combination of the
strategies below and therefore carry with them the risks of those strategies.
Buying Options - Investors who buy call (put) options risk loss of the entire premium paid if the underlying security
finishes below (above) the strike price at expiration. Investors who buy call or put spreads also risk a maximum loss of
the premium paid. The maximum gain on a long call or put spread is the difference between the strike prices, less the
premium paid.
Selling Options - Investors who sell calls on securities they do not own risk unlimited loss of the security price less the
strike price. Investors who sell covered calls (sell calls while owning the underlying security) risk having to deliver the
underlying security or pay the difference between the security price and the strike price, depending on whether the
option is settled by physical delivery or cash-settled. Investors who sell puts risk loss of the strike price less the premium
received for selling the put. Investors who sell put or call spreads risk a maximum loss of the difference between the
strikes less the premium received, while their maximum gain is the premium received.
For options settled by physical delivery, the above risks assume the options buyer or seller, buys or sells the resulting
securities at the settlement price on expiry.

May 17, 2016 Global
Goldman Sachs Global Investment Research 18
Disclosure Appendix
Reg AC
We, Christian Mueller-Glissmann, CFA, Ian Wright, Peter Oppenheimer, Charles P. Himmelberg, David J. Kostin, Kathy Matsui and Timothy Moe, CFA,
hereby certify that all of the views expressed in this report accurately reflect our personal views about the subject company or companies and its or
their securities. We also certify that no part of our compensation was, is or will be, directly or indirectly, related to the specific recommendations or
views expressed in this report.
We, Jeffrey Currie, Francesco Garzarelli, Silvia Ardagna and Robin Brooks, hereby certify that all of the views expressed in this report accurately
reflect our personal views, which have not been influenced by considerations of the firm's business or client relationships.
Unless otherwise stated, the individuals listed on the cover page of this report are analysts in Goldman Sachs' Global Investment Research division.
Disclosures
Distribution of ratings/investment banking relationships
Goldman Sachs Investment Research global Equity coverage universe
Rating Distribution Investment Banking Relationships
Buy Hold Sell Buy Hold Sell
Global 32% 53% 15% 65% 58% 51%
As of April 1, 2016, Goldman Sachs Global Investment Research had investment ratings on 3,029 equity securities. Goldman Sachs assigns stocks as
Buys and Sells on various regional Investment Lists; stocks not so assigned are deemed Neutral. Such assignments equate to Buy, Hold and Sell for
the purposes of the above disclosure required by the FINRA Rules. See 'Ratings, Coverage groups and views and related definitions' below. The
Investment Banking Relationships chart reflects the percentage of subject companies within each rating category for whom Goldman Sachs has
provided investment banking services within the previous twelve months.
Disclosures required by United States laws and regulations
See company-specific regulatory disclosures above for any of the following disclosures required as to companies referred to in this report: manager
or co-manager in a pending transaction; 1% or other ownership; compensation for certain services; types of client relationships; managed/co-
managed public offerings in prior periods; directorships; for equity securities, market making and/or specialist role. Goldman Sachs trades or may
trade as a principal in debt securities (or in related derivatives) of issuers discussed in this report.
The following are additional required disclosures: Ownership and material conflicts of interest: Goldman Sachs policy prohibits its analysts,
professionals reporting to analysts and members of their households from owning securities of any company in the analyst's area of
coverage. Analyst compensation: Analysts are paid in part based on the profitability of Goldman Sachs, which includes investment banking
revenues. Analyst as officer or director: Goldman Sachs policy prohibits its analysts, persons reporting to analysts or members of their
households from serving as an officer, director, advisory board member or employee of any company in the analyst's area of coverage. Non-U.S. Analysts: Non-U.S. analysts may not be associated persons of Goldman, Sachs & Co. and therefore may not be subject to FINRA Rule 2241 or FINRA
Rule 2242 restrictions on communications with subject company, public appearances and trading securities held by the analysts.
Additional disclosures required under the laws and regulations of jurisdictions other than the United States
The following disclosures are those required by the jurisdiction indicated, except to the extent already made above pursuant to United States laws
and regulations. Australia: Goldman Sachs Australia Pty Ltd and its affiliates are not authorised deposit-taking institutions (as that term is defined in
the Banking Act 1959 (Cth)) in Australia and do not provide banking services, nor carry on a banking business, in Australia. This research, and any
access to it, is intended only for "wholesale clients" within the meaning of the Australian Corporations Act, unless otherwise agreed by Goldman
Sachs. In producing research reports, members of the Global Investment Research Division of Goldman Sachs Australia may attend site visits and
other meetings hosted by the issuers the subject of its research reports. In some instances the costs of such site visits or meetings may be met in part
or in whole by the issuers concerned if Goldman Sachs Australia considers it is appropriate and reasonable in the specific circumstances relating to
the site visit or meeting. Brazil: Disclosure information in relation to CVM Instruction 483 is available at
http://www.gs.com/worldwide/brazil/area/gir/index.html. Where applicable, the Brazil-registered analyst primarily responsible for the content of this
research report, as defined in Article 16 of CVM Instruction 483, is the first author named at the beginning of this report, unless indicated otherwise at
the end of the text. Canada: Goldman Sachs Canada Inc. is an affiliate of The Goldman Sachs Group Inc. and therefore is included in the company
specific disclosures relating to Goldman Sachs (as defined above). Goldman Sachs Canada Inc. has approved of, and agreed to take responsibility for,
this research report in Canada if and to the extent that Goldman Sachs Canada Inc. disseminates this research report to its clients. Hong Kong: Further information on the securities of covered companies referred to in this research may be obtained on request from Goldman Sachs
(Asia) L.L.C. India: Further information on the subject company or companies referred to in this research may be obtained from Goldman Sachs
(India) Securities Private Limited, Research Analyst - SEBI Registration Number INH000001493, 951-A, Rational House, Appasaheb Marathe Marg,
Prabhadevi, Mumbai 400 025, India, Corporate Identity Number U74140MH2006FTC160634, Phone +91 22 6616 9000, Fax +91 22 6616 9001. Goldman
Sachs may beneficially own 1% or more of the securities (as such term is defined in clause 2 (h) the Indian Securities Contracts (Regulation) Act,
1956) of the subject company or companies referred to in this research report. Japan: See below. Korea: Further information on the subject
company or companies referred to in this research may be obtained from Goldman Sachs (Asia) L.L.C., Seoul Branch. New Zealand: Goldman
Sachs New Zealand Limited and its affiliates are neither "registered banks" nor "deposit takers" (as defined in the Reserve Bank of New Zealand Act
1989) in New Zealand. This research, and any access to it, is intended for "wholesale clients" (as defined in the Financial Advisers Act 2008) unless
otherwise agreed by Goldman Sachs. Russia: Research reports distributed in the Russian Federation are not advertising as defined in the Russian
legislation, but are information and analysis not having product promotion as their main purpose and do not provide appraisal within the meaning of
the Russian legislation on appraisal activity. Singapore: Further information on the covered companies referred to in this research may be obtained
from Goldman Sachs (Singapore) Pte. (Company Number: 198602165W). Taiwan: This material is for reference only and must not be reprinted
without permission. Investors should carefully consider their own investment risk. Investment results are the responsibility of the individual
investor. United Kingdom: Persons who would be categorized as retail clients in the United Kingdom, as such term is defined in the rules of the
Financial Conduct Authority, should read this research in conjunction with prior Goldman Sachs research on the covered companies referred to
herein and should refer to the risk warnings that have been sent to them by Goldman Sachs International. A copy of these risks warnings, and a
glossary of certain financial terms used in this report, are available from Goldman Sachs International on request.
May 17, 2016 Global
Goldman Sachs Global Investment Research 19
European Union: Disclosure information in relation to Article 4 (1) (d) and Article 6 (2) of the European Commission Directive 2003/125/EC is available
at http://www.gs.com/disclosures/europeanpolicy.html which states the European Policy for Managing Conflicts of Interest in Connection with
Investment Research.
Japan: Goldman Sachs Japan Co., Ltd. is a Financial Instrument Dealer registered with the Kanto Financial Bureau under registration number Kinsho
69, and a member of Japan Securities Dealers Association, Financial Futures Association of Japan and Type II Financial Instruments Firms
Association. Sales and purchase of equities are subject to commission pre-determined with clients plus consumption tax. See company-specific
disclosures as to any applicable disclosures required by Japanese stock exchanges, the Japanese Securities Dealers Association or the Japanese
Securities Finance Company.
Ratings, coverage groups and views and related definitions
Buy (B), Neutral (N), Sell (S) -Analysts recommend stocks as Buys or Sells for inclusion on various regional Investment Lists. Being assigned a Buy
or Sell on an Investment List is determined by a stock's return potential relative to its coverage group as described below. Any stock not assigned as
a Buy or a Sell on an Investment List is deemed Neutral. Each regional Investment Review Committee manages various regional Investment Lists to a
global guideline of 25%-35% of stocks as Buy and 10%-15% of stocks as Sell; however, the distribution of Buys and Sells in any particular coverage
group may vary as determined by the regional Investment Review Committee. Regional Conviction Buy and Sell lists represent investment
recommendations focused on either the size of the potential return or the likelihood of the realization of the return.
Return potential represents the price differential between the current share price and the price target expected during the time horizon associated
with the price target. Price targets are required for all covered stocks. The return potential, price target and associated time horizon are stated in each
report adding or reiterating an Investment List membership.
Coverage groups and views: A list of all stocks in each coverage group is available by primary analyst, stock and coverage group at
http://www.gs.com/research/hedge.html. The analyst assigns one of the following coverage views which represents the analyst's investment outlook
on the coverage group relative to the group's historical fundamentals and/or valuation. Attractive (A). The investment outlook over the following 12
months is favorable relative to the coverage group's historical fundamentals and/or valuation. Neutral (N). The investment outlook over the
following 12 months is neutral relative to the coverage group's historical fundamentals and/or valuation. Cautious (C). The investment outlook over
the following 12 months is unfavorable relative to the coverage group's historical fundamentals and/or valuation.
Not Rated (NR). The investment rating and target price have been removed pursuant to Goldman Sachs policy when Goldman Sachs is acting in an
advisory capacity in a merger or strategic transaction involving this company and in certain other circumstances. Rating Suspended (RS). Goldman
Sachs Research has suspended the investment rating and price target for this stock, because there is not a sufficient fundamental basis for
determining, or there are legal, regulatory or policy constraints around publishing, an investment rating or target. The previous investment rating and
price target, if any, are no longer in effect for this stock and should not be relied upon. Coverage Suspended (CS). Goldman Sachs has suspended
coverage of this company. Not Covered (NC). Goldman Sachs does not cover this company. Not Available or Not Applicable (NA). The
information is not available for display or is not applicable. Not Meaningful (NM). The information is not meaningful and is therefore excluded.
Global product; distributing entities
The Global Investment Research Division of Goldman Sachs produces and distributes research products for clients of Goldman Sachs on a global
basis. Analysts based in Goldman Sachs offices around the world produce equity research on industries and companies, and research on
macroeconomics, currencies, commodities and portfolio strategy. This research is disseminated in Australia by Goldman Sachs Australia Pty Ltd
(ABN 21 006 797 897); in Brazil by Goldman Sachs do Brasil Corretora de Títulos e Valores Mobiliários S.A.; in Canada by either Goldman Sachs
Canada Inc. or Goldman, Sachs & Co.; in Hong Kong by Goldman Sachs (Asia) L.L.C.; in India by Goldman Sachs (India) Securities Private Ltd.; in
Japan by Goldman Sachs Japan Co., Ltd.; in the Republic of Korea by Goldman Sachs (Asia) L.L.C., Seoul Branch; in New Zealand by Goldman Sachs
New Zealand Limited; in Russia by OOO Goldman Sachs; in Singapore by Goldman Sachs (Singapore) Pte. (Company Number: 198602165W); and in
the United States of America by Goldman, Sachs & Co. Goldman Sachs International has approved this research in connection with its distribution in
the United Kingdom and European Union.
European Union: Goldman Sachs International authorised by the Prudential Regulation Authority and regulated by the Financial Conduct Authority
and the Prudential Regulation Authority, has approved this research in connection with its distribution in the European Union and United Kingdom;
Goldman Sachs AG and Goldman Sachs International Zweigniederlassung Frankfurt, regulated by the Bundesanstalt für
Finanzdienstleistungsaufsicht, may also distribute research in Germany.
General disclosures
This research is for our clients only. Other than disclosures relating to Goldman Sachs, this research is based on current public information that we
consider reliable, but we do not represent it is accurate or complete, and it should not be relied on as such. The information, opinions, estimates and
forecasts contained herein are as of the date hereof and are subject to change without prior notification. We seek to update our research as
appropriate, but various regulations may prevent us from doing so. Other than certain industry reports published on a periodic basis, the large
majority of reports are published at irregular intervals as appropriate in the analyst's judgment.
Goldman Sachs conducts a global full-service, integrated investment banking, investment management, and brokerage business. We have
investment banking and other business relationships with a substantial percentage of the companies covered by our Global Investment Research
Division. Goldman, Sachs & Co., the United States broker dealer, is a member of SIPC (http://www.sipc.org).
Our salespeople, traders, and other professionals may provide oral or written market commentary or trading strategies to our clients and principal
trading desks that reflect opinions that are contrary to the opinions expressed in this research. Our asset management area, principal trading desks
and investing businesses may make investment decisions that are inconsistent with the recommendations or views expressed in this research.
The analysts named in this report may have from time to time discussed with our clients, including Goldman Sachs salespersons and traders, or may
discuss in this report, trading strategies that reference catalysts or events that may have a near-term impact on the market price of the equity
securities discussed in this report, which impact may be directionally counter to the analyst's published price target expectations for such stocks. Any
such trading strategies are distinct from and do not affect the analyst's fundamental equity rating for such stocks, which rating reflects a stock's
return potential relative to its coverage group as described herein.
We and our affiliates, officers, directors, and employees, excluding equity and credit analysts, will from time to time have long or short positions in,
act as principal in, and buy or sell, the securities or derivatives, if any, referred to in this research.
The views attributed to third party presenters at Goldman Sachs arranged conferences, including individuals from other parts of Goldman Sachs, do
not necessarily reflect those of Global Investment Research and are not an official view of Goldman Sachs.
Any third party referenced herein, including any salespeople, traders and other professionals or members of their household, may have positions in
the products mentioned that are inconsistent with the views expressed by analysts named in this report.

May 17, 2016 Global
Goldman Sachs Global Investment Research 20
This research is not an offer to sell or the solicitation of an offer to buy any security in any jurisdiction where such an offer or solicitation would be
illegal. It does not constitute a personal recommendation or take into account the particular investment objectives, financial situations, or needs of
individual clients. Clients should consider whether any advice or recommendation in this research is suitable for their particular circumstances and, if
appropriate, seek professional advice, including tax advice. The price and value of investments referred to in this research and the income from them
may fluctuate. Past performance is not a guide to future performance, future returns are not guaranteed, and a loss of original capital may occur.
Fluctuations in exchange rates could have adverse effects on the value or price of, or income derived from, certain investments.
Certain transactions, including those involving futures, options, and other derivatives, give rise to substantial risk and are not suitable for all investors.
Investors should review current options disclosure documents which are available from Goldman Sachs sales representatives or at
http://www.theocc.com/about/publications/character-risks.jsp. Transaction costs may be significant in option strategies calling for multiple purchase
and sales of options such as spreads. Supporting documentation will be supplied upon request.
All research reports are disseminated and available to all clients simultaneously through electronic publication to our internal client websites. Not all
research content is redistributed to our clients or available to third-party aggregators, nor is Goldman Sachs responsible for the redistribution of our
research by third party aggregators. For research, models or other data available on a particular security, please contact your sales representative or
go to http://360.gs.com.
Disclosure information is also available at http://www.gs.com/research/hedge.html or from Research Compliance, 200 West Street, New York, NY
10282.
© 2016 Goldman Sachs.
No part of this material may be (i) copied, photocopied or duplicated in any form by any means or (ii) redistributed without the prior written consent of The Goldman Sachs Group, Inc.