goat 2019 - usda 2019 needs assessment survey results for the upcoming nahms goat 2019 study united...
TRANSCRIPT

Goat 2019 Needs Assessment Survey Results for the Upcoming NAHMS Goat 2019 Study
United States Department of Agriculture Animal and Plant Health Inspection Service Veterinary Services National Animal Health Monitoring System January 2018

2
The U.S. Department of Agriculture (USDA) prohibits discrimination in all its programs and activities on the basis of race, color, national origin, age, disability, and where applicable, sex, marital status, familial status, parental status, religion, sexual orientation, genetic information, political beliefs, reprisal, or because all or part of an individual’s income is derived from any public assistance program. (Not all prohibited bases apply to all programs.) Persons with disabilities who require alternative means for communication of program information (Braille, large print, audiotape, etc.) should contact USDA’s TARGET Center at (202) 720-2600 (voice and TDD).
To file a complaint of discrimination, write to USDA, Director, Office of Civil Rights, 1400 Independence Avenue, S.W., Washington, D.C. 20250-9410, or call (800) 795-3272 (voice) or (202) 720-6382 (TDD). USDA is an equal opportunity provider and employer.
Mention of companies or commercial products does not imply recommendation or endorsement by the U.S. Department of Agriculture over others not mentioned. USDA neither guarantees nor warrants the standard of any product mentioned. Product names are mentioned solely to report factually on available data and to provide specific information.
USDA–APHIS–VS–CEAH–NAHMS NRRC Building B, M.S. 2E7 2150 Centre Avenue Fort Collins, CO 80526-8117 970.494.7000 http://www.aphis.usda.gov/nahms #757.0118

3
Table of Contents Introduction 4 Survey Results 5 A. Respondent Demographics 5 B. Management and Health Topic Priorities 10 C. Participation Incentives 15 D. Greatest Risk or Burden to Operation/Industry 17 Study Objectives 18 A. Determination of Objectives 18 B. Release of Objectives 18 Appendix 1: Number and percentage of responses to the needs assessment survey by State, ranked high to low 19 Appendix 2: Lists of answer options for survey questions 21
Table 1—Survey choices for general management priorities ranked by total weighted points 21
Table 2—Survey choices for disease, disorder, or pathogen priorities ranked by total
weighted points 22 Table 3—Survey choices for participation incentives ranked by total weighted points 22 Table 4—Survey choices for greatest risk or burden to operation/industry 22

4
Introduction The Goat 2019 needs assessment survey was administered to identify critical information needs regarding goat management and health for the USDA’s National Animal Health Monitoring System (NAHMS) upcoming Goat 2019 study. The online survey gathered opinions from a variety of stakeholders regarding goat management priorities, health priorities, industry burdens, and participation incentives for the study. Findings from the survey will help NAHMS create study objectives that align with the industry’s goals and information needs. Additionally, the results of the needs assessment may be used by other stakeholders to further meet the needs of the goat industry. NAHMS is a nonregulatory program of the USDA created to help meet the Nation’s animal-health information needs. NAHMS studies provide data that help animal industries maintain the health and well-being of their animals and ultimately produce higher quality products with greater efficiency. Studies are designed to deliver baseline data and focus on areas of national importance not already adequately studied. The Goat 2019 needs assessment survey was an online questionnaire administered via online survey from July 31 through September 8, 2017. The online questionnaire was distributed via email lists; newsletters; and goat associations, including breed, fiber, dairy, meat, and pack goat associations. All individuals involved in the goat industry were encouraged to participate, regardless of goat ownership. Responses were received from 1,272 individuals, representing all sectors of the industry. In developing study objectives, NAHMS staff consider information collected during the needs assessment survey as well as information acquired from reviews of the existing scientific literature, discussions at industry and scientific meetings, and input from within USDA. The feasibility of incorporating an identified need into the study is carefully evaluated. In part, feasibility is determined by the priority of identified needs, the availability of effective study design methods, funding, and goat industry demographics. As a result, it is likely that some of the recommendations from the needs assessment may not be included in the Goat 2019 study. General methodology Data were cleaned and compiled using SAS. In some cases, categories (such as primary role in industry, goat type owned, and primary resource investment) were combined to create exclusive sector categories to further analyze the data. Please note that the results of this needs assessment survey are not statistically representative of any particular populations. Although NAHMS national commodity studies are based on a statistical sampling process to allow inference to a national population, the needs assessment surveys are intended to request input from a wide variety of stakeholders and are available online to anyone who wishes to submit a form.

5
Survey Results A. Respondent Demographics Respondents were asked to provide information on their primary role in the goat industry, their secondary role in the industry, the number of goats they owned, the type of goats raised, the industry in which they invested the majority of their resources, and what they believed represents the greatest risk or burden to the goat industry. Additionally, they were asked to rank their top three management priorities and the top three disease, disorder, or pathogen priorities that they would like to have included in the Goat 2019 study. Respondents were also asked to rank the top three possible incentives for study participation. Overall, 1,272 individuals responded to the needs assessment questionnaire. At least 1 response was received from all 50 States (fig. A.1). The highest number of responses was from Texas, representing 8.83 percent of all respondents. Florida, California, and Georgia were also strongly represented, composing 5.28, 5.04, and 4.89 percent of responses, respectively. Three respondents are not accounted for in the map: one respondent was from the United States Virgin Islands, a U.S. territory; one was from the Philippines; and one was from New Zealand. Figure A.1. General percentage of respondents by reported State of residence (n=1,269).
6
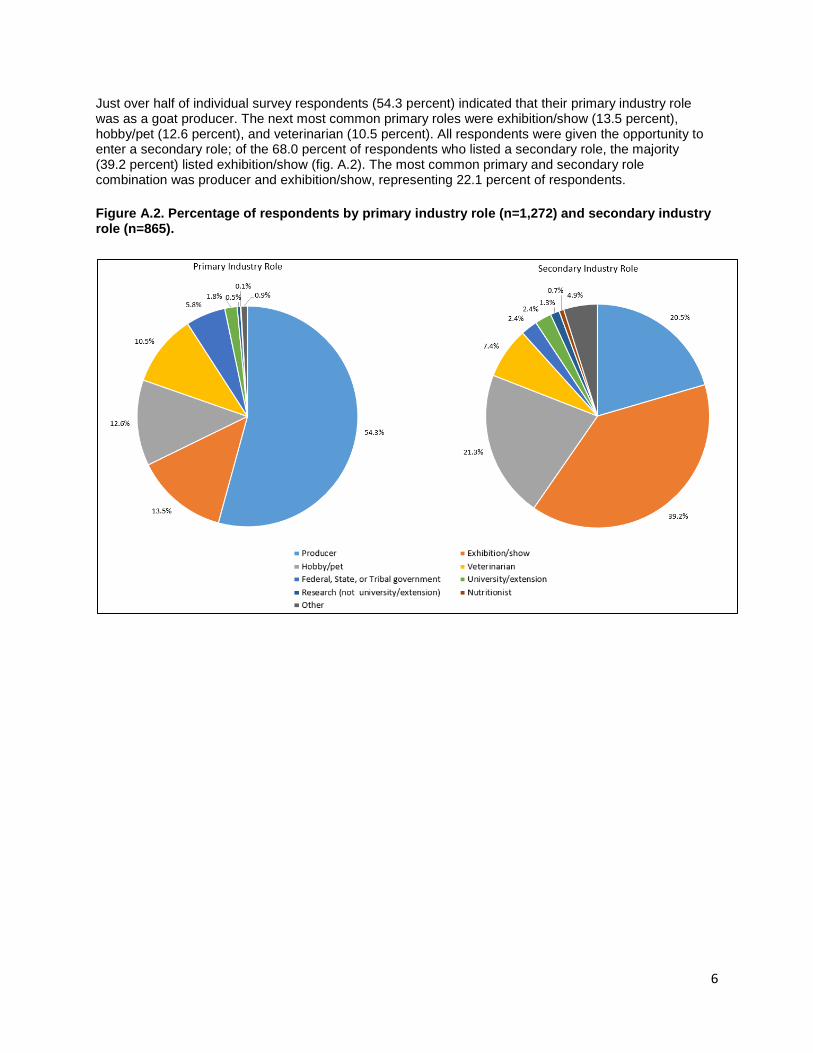
Just over half of individual survey respondents (54.3 percent) indicated that their primary industry role was as a goat producer. The next most common primary roles were exhibition/show (13.5 percent), hobby/pet (12.6 percent), and veterinarian (10.5 percent). All respondents were given the opportunity to enter a secondary role; of the 68.0 percent of respondents who listed a secondary role, the majority (39.2 percent) listed exhibition/show (fig. A.2). The most common primary and secondary role combination was producer and exhibition/show, representing 22.1 percent of respondents. Figure A.2. Percentage of respondents by primary industry role (n=1,272) and secondary industry role (n=865).

7
Since producers, exhibition/show enthusiasts, and hobby/pet owners all own goats and may have similar perspectives and priorities, primary industry roles were combined to further analyze the results of the Goat 2019 needs assessment. Once categories were combined, approximately 80 percent of respondents listed their primary industry involvement as goat owner, 10.6 percent were veterinarians/nutritionists, and 8.1 percent were involved in government or research related to the goat industry (fig. A.3). A low percentage of respondents that did not fit into any of the other categories were classified as “other.” Other respondents included goat enthusiasts, writers, and consumers of goat products. Figure A.3. Percentage of respondents by combined primary industry role (n=1,272).

8
More than three-fourths (80.4 percent) of respondents indicated that they owned at least one adult goat (more than 1 year old). Almost half (46.2 percent) of the respondents who owned goats reported a herd size of 20 to 99 goats (fig. A.4). The mean number of goats owned was 52.6, the median was 20.0, and the maximum number was 5,000 goats. Figure A.4. For respondents who owned goats, percentage of respondents by number of adult goats owned (n=1,056).
Respondents who owned goats were asked to indicate the type(s) of goats they raised. Respondents could choose multiple goat types. Almost two-thirds (63.3 percent) of goat owners raised meat goats. Milk goats and show goats were selected by 47.9 and 44.5 percent of respondents, respectively (fig. A.5). Figure A.5. For respondents who owned goats, percentage of respondents by goat type owned (n=1,056).
63.3%
47.9%44.5%
12.9%
4.4% 2.5% 1.3%0%
10%
20%
30%
40%
50%
60%
70%
Meat goats Dairy goats Show goats Vegetationcontrol goats
Fiber Goats Pack goats Other goatsPerc
ent o
f goa
t ow
ner r
espo
nden
ts
Goat type
23.2% 24.6%
46.2%
6.0%
0%
10%
20%
30%
40%
50%
<10 10-19 20-99 >100
Perc
ent o
f res
pond
ents
Number of adult goats (>1 year of age) owned

9
All respondents were asked to identify the sector of the goat industry in which they invested the majority of their resources (time, labor, and money). It was emphasized that respondents should choose only one response; however, if they invested their resources in two sectors equally, they could select other and specify the sectors. Responses that listed two sectors were categorized as “combination.” About one-third (33.6 percent) of all respondents selected the meat sector as their primary investment (fig. A.6). The meat sector was closely followed by the dairy and show or hobby sectors—26.7 and 26.6 percent, respectively. Figure A.6. Percentage of respondents by primary goat sector investments (n=1,241).
To help refine goat ownership categories for further analysis, primary goat sector investment was combined with primary goat type owned to create exclusive categories for primary goat type raised, divided into meat goats, dairy goats, other goats, and no goats. This new categorization of primary goat type raised allowed for further analysis of study priorities for each goat sector. Overall, 41.6 percent raised meat goats and 30.1 percent raised dairy goats (fig. A.7). Figure A.7. Percentage of respondents by primary goat type raised (n=1,272).
33.6%
26.7% 26.6%
2.7% 2.3%0.3%
2.9%4.9%
0%
10%
20%
30%
40%
Meatproduction
Dairyproduction
Show orhobby
Fiberproduction
Vegetationcontrol
Pack goats Other Combination
Prec
ent o
f res
pond
ents
Primary goat sector
41.6%
30.1%
11.3%17.0%
0%
10%
20%
30%
40%
50%
Meat goats Dairy goats Other goats No goats
Perc
ent o
f res
pond
ents
Primary goat type owned

10
B. Management and Health Topic Priorities To help guide development of NAHMS Goat 2019 study objectives, all respondents were asked to rank the top three management topics that they would like to see as a focus of the study. Also, respondents were asked to rank the top three disease, disorder, or pathogen issues that they would like to see as a focus of the study. Prioritization responses were weighted as follows: priority 1 responses were given three points; priority 2 responses two points; and priority 3 responses one point. For each question, the priority points for each topic were summed, and the responses were then ranked by priority weighting. Tables 1 and 2 in appendix 2 show the full list of topics provided for these questions, ranked by priority weighting. Additionally, each question was analyzed by combined primary industry role and primary goat type owned. B.1. Priority Management Topics Almost all respondents (99.1 percent) ranked their top three management priorities. After management priority responses were weighted, the number one priority was identified as the availability of approved pharmaceuticals and vaccines, which had a combined weight of 1,484 points and was the number one choice for 28.4 percent of all respondents (fig. B.1). Doe health/management was ranked second with 700 points and was the number one choice for 9.5 percent of all respondents. See table 1 in appendix 2 for a complete ranking of all management topics by total weighted points. Figure B.1. Top 10 management priorities ranked by total weighted points.
333
426
449
458
477
516
523
529
700
1484
0 500 1000 1500
Veterinarians - use and availability
Kid health/ management
Cost of disease and preventive practices
Marketing of milk, meat, fiber
Nutrition/ feed management
Biosecurity/ disease prevention
Antimicrobial use/ resistance
Infectious diseases
Doe health/ management
Availability of approved pharmaceuticals and vaccines
Total weighted points

11
Since approximately 80 percent of respondents were goat owners, management priorities were reviewed by primary industry role. Management priorities showed some similarity across primary industry role, with both goat owners and veterinarians/nutritionists ranking availability of approved pharmaceuticals and vaccines as their number one priority (table B.1). Government and university employees, however, ranked biosecurity/disease prevention as their number one priority. Goat owners ranked doe/health management as their second priority, and veterinarians/nutritionists ranked infectious diseases as their second priority. Table B.1. Top five management priorities by primary industry role (n=1,261):
Management priorities
Primary Industry Role
Goat owners (n=1,015)
Veterinarians/ nutritionists
(n=133)
Government and university
employees (n=101)
Other (n=12)
Availability of approved pharmaceuticals and vaccines 1 1 2 3
Doe health/management 2 2
Marketing of milk, meat, fiber 3
Antimicrobial use/resistance 4 3
Nutrition/feed management 5
Biosecurity/disease prevention 1 1
Infectious diseases 2 3
Cost of disease and preventive practices 4 5
Veterinarians—use and availability 5
Organic meat/milk production 4 Quality assurance/residue avoidance 5
Traceability/animal identification 4

12
Management priorities were similar across primary goat type raised (table B.2). Regardless of primary goat type raised, respondents ranked availability of approved pharmaceuticals and vaccines as their top priority. Meat goat and dairy goat owners ranked doe health/management as their second priority, whereas other goat owners ranked antimicrobial use/resistance as their second priority, and respondents who did not own goats ranked biosecurity/disease prevention as their second priority.
Table B.2. Top five management priorities by primary goat type raised (n=1,261):
For each of their top three management priorities, respondents were asked to provide a specific topic or question that could be addressed in the study. Topics and questions regarding the availability of approved pharmaceuticals and vaccines were focused on withdrawal times, off-label use of products, and impacts of the veterinary feed directive on goat owners. Biosecurity/disease prevention topics included how producers implement biosecurity practices, what diseases producers test for on their operation, and how operations that have visitors ensure public safety. Common topics included in doe health/management were current breeding protocols being used by producers, efficiency of breeding does in the United States, and common diseases seen in does. Infectious disease topics were focused around caseous lymphadenitis, Q fever, and disease diagnostics. Lastly, antimicrobial use/resistance questions tended to focus on anthelmintic resistance, appropriate use of antimicrobials, and the process for making decisions about treatment with antimicrobials.
Management priorities
Primary Goat Type Raised Meat
(n=527) Dairy
(n=383) Other
(n=142) No Goats (n=209)
Availability of approved pharmaceuticals and vaccines 1 1 1 1
Doe health/management 2 2
Antimicrobial use/resistance 3 2 4
Kid health/management 4
Marketing of milk, meat, fiber 5 5
Raw milk production 3
Biosecurity/disease prevention 4 4 2
Infectious diseases 3 3
Cost of disease and preventive practices 5
Veterinarians—use and availability 5

13
B.2. Priority Disease, Disorder, or Pathogen Issues Almost all respondents (96.7 percent) ranked their top three disease, disorder, or pathogen priorities. After all responses were weighted by priority ranking (priority 1 responses were given three points, priority 2 responses two points, and priority 3 responses one point), the overall highest priority issue was internal parasites, which had a combined weight of 2,232 points and was the number one choice for 47.4 percent of all respondents (fig. B.2). Caseous lymphadenitis was ranked second with 842 points and was the number one choice for 10.0 percent of all respondents. Figure B.2. Top 10 disease, disorder, or pathogen priorities ranked by total weighted points.
260
266
287
304
319
352
481
631
842
2232
0 500 1000 1500 2000 2500
Johne's disease
Pregnancy toxemia
Respiratory disease
Nutritional disorders
External parasites
Lameness
Mastitis
Caprine arthritis encephalitis
Caseous lymphadenitis
Internal parasites
Total weighted points

14
Once again, since the majority of respondents were producers, disease, disorder, or pathogen priorities were analyzed by primary industry role and primary goat type. Regardless of their primary industry role, respondents selected internal parasites as their top disease, disorder, or pathogen priority (table B.3). The second-ranked priority varied, however, based on primary industry role; caseous lymphadenitis was the second priority for goat owners and veterinarians, and Q fever (and its causative agent, Coxiella burnetti) was the second priority for government and university employees. Table B.3. Top five disease, disorder, or pathogen priorities by primary industry role (n=1,231):
Disease, disorder, or pathogen priorities
Primary Industry Role
Goat owners (n=994)
Veterinarians/ nutritionists
(n=131)
Government and university
employees (n=96)
Other (n=10)
Internal parasites 1 1 1 1
Caseous lymphadenitis 2 2 3
Caprine arthritis encephalitis 3 4 4 3
Mastitis 4 2
External parasites 5
Lameness 3
Nutritional disorders 5 4
Q fever 2
Abortions 5
Scours 5
15
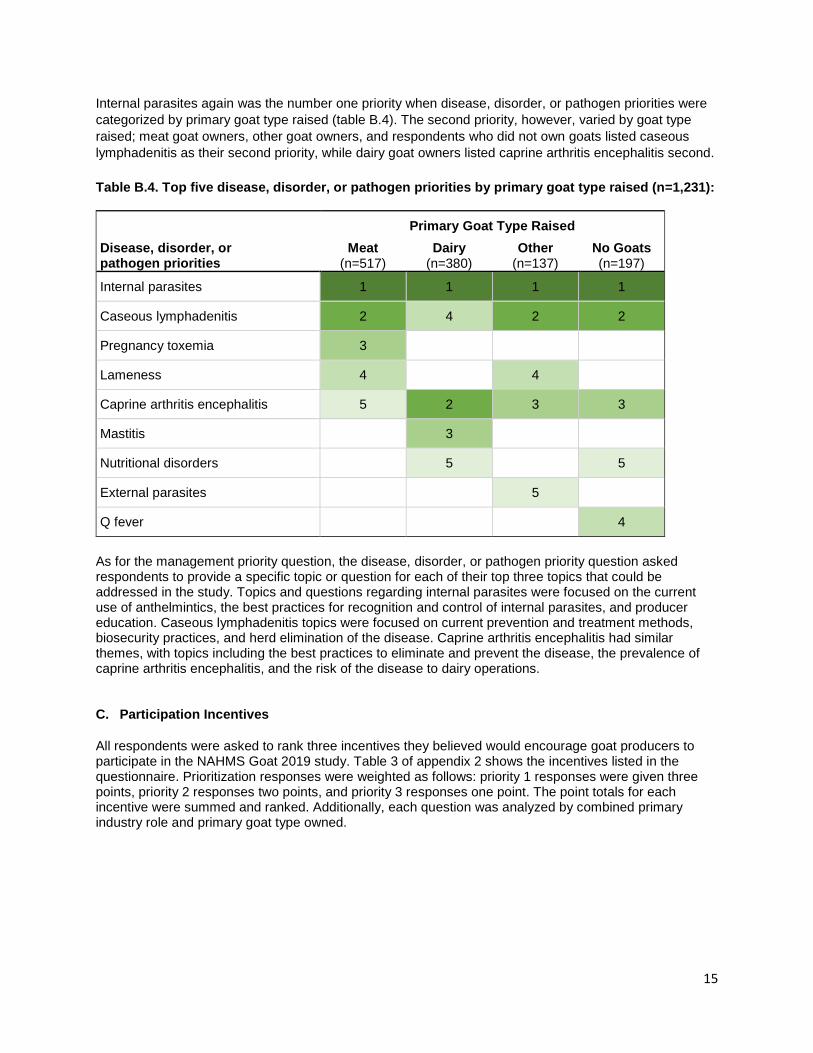
Internal parasites again was the number one priority when disease, disorder, or pathogen priorities were categorized by primary goat type raised (table B.4). The second priority, however, varied by goat type raised; meat goat owners, other goat owners, and respondents who did not own goats listed caseous lymphadenitis as their second priority, while dairy goat owners listed caprine arthritis encephalitis second. Table B.4. Top five disease, disorder, or pathogen priorities by primary goat type raised (n=1,231):
Disease, disorder, or pathogen priorities
Primary Goat Type Raised Meat
(n=517) Dairy
(n=380) Other
(n=137) No Goats (n=197)
Internal parasites 1 1 1 1
Caseous lymphadenitis 2 4 2 2
Pregnancy toxemia 3
Lameness 4 4
Caprine arthritis encephalitis 5 2 3 3
Mastitis 3
Nutritional disorders 5 5
External parasites 5
Q fever 4
As for the management priority question, the disease, disorder, or pathogen priority question asked respondents to provide a specific topic or question for each of their top three topics that could be addressed in the study. Topics and questions regarding internal parasites were focused on the current use of anthelmintics, the best practices for recognition and control of internal parasites, and producer education. Caseous lymphadenitis topics were focused on current prevention and treatment methods, biosecurity practices, and herd elimination of the disease. Caprine arthritis encephalitis had similar themes, with topics including the best practices to eliminate and prevent the disease, the prevalence of caprine arthritis encephalitis, and the risk of the disease to dairy operations. C. Participation Incentives All respondents were asked to rank three incentives they believed would encourage goat producers to participate in the NAHMS Goat 2019 study. Table 3 of appendix 2 shows the incentives listed in the questionnaire. Prioritization responses were weighted as follows: priority 1 responses were given three points, priority 2 responses two points, and priority 3 responses one point. The point totals for each incentive were summed and ranked. Additionally, each question was analyzed by combined primary industry role and primary goat type owned.

16
Most respondents (96.4 percent) ranked their top three participation incentives. After all responses were weighted, parasite testing/resistance testing was ranked as the number one participation incentive with 2,735 points and was the number one choice for 51.3 percent of all respondents (fig. C.1). The second and third ranked participation incentives were individual animal testing and feed/forage analysis with 1,805 and 1,158 points, respectively. Figure C.1. Incentives for encouraging study participation, ranked by total weighted points.
Regardless of primary industry role or primary goat type raised, the first ranked incentive was parasite testing/resistance testing and the second ranked incentive was individual animal testing (tables C.1 and C.2). University, government, and research-associated respondents ranked biosecurity assessment as their third incentive, whereas goat owners and veterinarians/nutritionists ranked feed/forage analysis third (table C.1). Table C.1. Participation incentives by primary industry role (n= 1,227):
Incentives
Primary Industry Role
Goat owners (n=987)
Veterinarians/ nutritionists
(n=132)
Government and university
employees (n=97)
Other (n=11)
Parasite/resistance testing 1 1 1 1
Individual animal testing 2 2 2 2
Feed/forage analysis 3 3 4 4
Soil testing for minerals 4 4 5 5
Biosecurity assessment 5 5 3 3
45
191
515
749
1158
1805
2735
0 500 1000 1500 2000 2500 3000
Other
Bulk milk testing
Biosecurity assessment
Soil testing for minerals
Feed/forage analysis
Individual animal testing
Parasite testing/resistance testing
Total weighted points

17
The only difference seen in respondents’ incentive ranks by primary goat type raised was that respondents who did not own goats ranked biosecurity assessment as their fourth choice, whereas all goat owners ranked soil testing for minerals as their fourth incentive choice (table C.2). Table C.2. Participation incentives by primary goat type raised (n=1,227):
Incentives
Primary Goat Type Raised Meat
(n=517) Dairy
(n=371) Other
(n=137) No Goats (n=202)
Parasite/resistance testing 1 1 1 1
Individual animal testing 2 2 2 2
Feed/forage analysis 3 3 3 3
Soil testing for minerals 4 4 4 5
Biosecurity assessment 5 5 5 4
D. Greatest Risk or Burden to Operation/Industry All respondents were asked to pick the response they believed represented the greatest risk or burden to their operation or their industry’s viability. Of the 86.5 percent of respondents that answered this question, 31.1 percent said management costs were their greatest burden (fig. D.1). About one-fourth of respondents identified disease (27.3 percent) or access to veterinarians and/or pharmaceuticals (23.0 percent) as the greatest risk or burden. Figure D.1. Greatest risk or burden to operation/industry (n=1,100).
3.5%
1.9%
13.3%
23.0%
27.3%
31.1%
0% 10% 20% 30% 40%
Other
Import/export of live animals or genetic material
Marketing
Access to veterinarians and/or pharmaceuticals
Disease
Management costs
Percent of respondents

18
Study Objectives A. Determination of Objectives To determine the information needs that the NAHMS Goat 2019 study might be able to fill, review of the existing scientific literature, discussions at industry and scientific meetings, and input from within USDA will be combined with the outcome of the needs assessment surveys. NAHMS will then assess the feasibility of meeting these needs. Study feasibility is determined by the availability of effective study design methods, funding, and goat industry demographics. B. Release of Objectives The objectives for the NAHMS Goat 2019 study will be determined by spring 2018. NAHMS will then develop a study design to collect necessary data to meet the defined objectives by incorporating both questionnaire and biological sample collection (if indicated to meet study objectives). Data collection for the study will begin in summer 2019, when enumerators from the National Association of State Departments of Agriculture visit selected goat operations to complete the study questionnaire. If necessary to meet the study objectives, Federal and/or State veterinary medical officers or animal health technicians will visit consenting operations for additional information collection, possibly including biological samples.

19
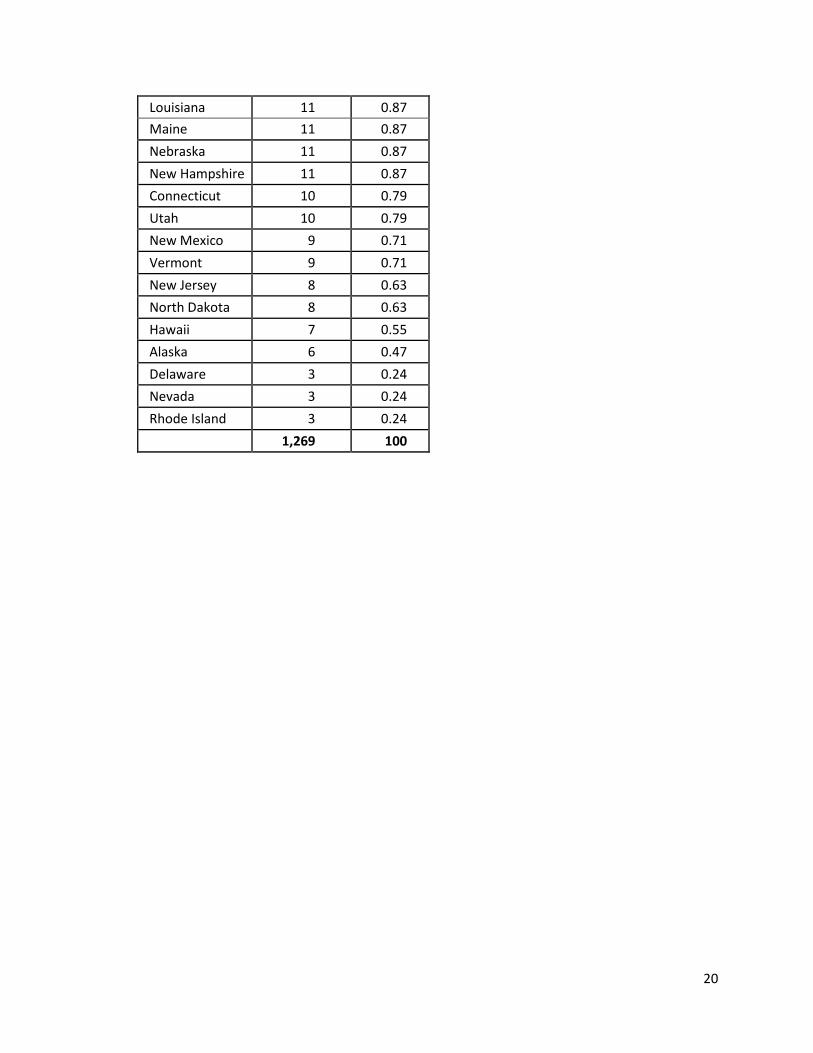
Appendix 1—Number and percentage of responses to the needs assessment survey by State, ranked high to low
State Number Percent Texas 112 8.83 Florida 67 5.28 California 64 5.04 Georgia 62 4.89 Wisconsin 49 3.86 Oklahoma 47 3.70 Pennsylvania 44 3.47 Missouri 41 3.23 Ohio 41 3.23 Washington 41 3.23 North Carolina 37 2.92 South Carolina 37 2.92 Minnesota 33 2.60 Virginia 32 2.52 Tennessee 31 2.44 Illinois 30 2.36 Oregon 29 2.29 Alabama 28 2.21 Indiana 28 2.21 New York 27 2.13 Iowa 26 2.05 Kentucky 25 1.97 Michigan 23 1.81 Colorado 22 1.73 Arkansas 20 1.58 Kansas 20 1.58 Idaho 19 1.50 Maryland 17 1.34 Mississippi 16 1.26 Montana 15 1.18 West Virginia 15 1.18 Wyoming 14 1.10 Massachusetts 13 1.02 Arizona 12 0.95 South Dakota 12 0.95
20
Louisiana 11 0.87 Maine 11 0.87 Nebraska 11 0.87 New Hampshire 11 0.87 Connecticut 10 0.79 Utah 10 0.79 New Mexico 9 0.71 Vermont 9 0.71 New Jersey 8 0.63 North Dakota 8 0.63 Hawaii 7 0.55 Alaska 6 0.47 Delaware 3 0.24 Nevada 3 0.24 Rhode Island 3 0.24 1,269 100

21
Appendix 2—Lists of answer options for survey questions
Table 1: Survey choices for general management priorities ranked by total weighted points
• Availability of approved pharmaceuticals and vaccines • Doe health/management • Infectious diseases • Antimicrobial use/resistance • Biosecurity/disease prevention • Nutrition/feed management • Marketing of milk, meat, fiber • Cost of disease and preventive practices • Kid health/management • Veterinarians—use and availability • Reproductive health/management • Raw milk production • Parasites/parasite resistance • Traceability/animal identification • Predator control • Veterinary feed directive • Organic meat/milk production • Importation of goat producers • Quality assurance/residue avoidance • Export markets • Foreign animal diseases • Other • Food safety

22
Table 2: Survey choices for disease, disorder, or pathogen priorities ranked by total weighted points
• Internal parasites • Caseous lymphadenitis • Caprine arthritis encephalitis • Mastitis • Lameness • External parasites • Nutritional disorders • Respiratory disease • Pregnancy toxemia • Johne's disease • Abortions • Scours • Reproductive disorders • Overeating disease • Q fever • Metabolic disease • White muscle disease • Soremouth (orf) • Other • Scrapie • Toxoplasmosis • Brucellosis • Cystic ovarian disease • Cache valley fever • Coccidiosis • Campylobacter • Salmonella • Mycoplasma • Meningeal worm • Border disease (hairy shaker disease)
Table 3: Survey choices for participation incentives ranked by total weighted points
• Parasite testing/resistance testing • Individual animal testing • Feed/forage analysis • Soil testing for minerals • Biosecurity assessment • Bulk milk testing • Other
Table 4: Survey choices for the greatest risk or burden to the industry
• Management costs • Disease • Access to veterinarians and/or pharmaceuticals • Marketing • Other • Import/export of live animals or genetic material