golder associates inc. ,. golder associates · pdf filegolder associates inc.,. golder...
TRANSCRIPT

Golder Associates Inc.
,. GolderAssociates913-8083.237913-8084.237
July 15, 1992
Mr. Richard E. Boice, P.E.U.S, Environmental Protection Agency, Region V77 West Jackson BoulevardChicago, Illinois 60604
Ms. Julia CarterIllinois Environmental Protection Agency2200 Churchill RoadSpringfield, Illinois 62706
RE: YEOMAN CREEK AND EDWARDS' FIELD LANDFILLSREVISED SOPS
Dear Mr. Boice and Ms. Carter:
Golder Associates submitted revised Standard Operating Procedures (SOPs) for analysisof PCBs in LNAPL and volatile organics in landfill gas to U.S. EPA on May 30, 1992. Ina U.S. EPA letter dated and received by telex/telecopy on July 1, 1992, deficiencies andrequired modifications for the SOPs submitted on May 30, 1992 were outlined. The letteralso indicated submission of revised SOPs within 15 days (July 16, 1992) was required.
During teleconferences between representatives of U.S. EPA, Golder Associates,Compuchem Laboratories, and Air Toxics laboratory on July 7 and 8, 1992, requiredrevisions and proposed changes to the two SOPs were discussed. CompuChem and AirToxics have revised the SOPs in accordance with the July 1, 1992 letter and discussionsheld on July 7 and 8, 1992.
In the event you have any questions or require further information, please do not hesitateto call.
Sincerely,
GOLDER ASSOCIATES INC.
laid J. PattersonPrincipal
RJP/djfAttachmentcc: Jerome C. Randolph, Esq.
Shell J. Bleiweiss, Esq.Peter LoMonaco, Esq.Pierre Talbert, Esq.Dale Vitale, Esq.Glen LenziDerrick VallanceJohn Bleck, P.E. (S32370i8.wpi/djf>
OFFICES IN AUSTRALIA. CANADA. GERMANY, HUNGARY. ITALY SWEDEN I.NITED KINGDOM UNITED STATE 5

13
Section No. 3.2.2.3Revision No. 4Data: July 7, 1992Page 1 of 2
Sample Preparation Procedure -402: Diluting Oil Samples forAnalysis of PCBS
1. 0 Summary
The oil sample is spiked with surrogate, diluted to volumewith hexane, acid washed with concentrated sulfurlc acid, andanalyzed by GC/ECD.
2. 0 Apparatus and Material*
2.1 15-ml glass graduated centrifuge tube
2.2 5-ml vials with Teflon-lined crimp tops
2.3 Serological pipets: 0.5-ml and 1.0 -ml volumes
2.4 Pipets: Pasteur, disposable glass
3 .0 Reaoants
3.1 Hexane; pesticide grade, distilled in glass
3.2 Concentrated sulfuric acid (l SO : reagent grade4 . 0 Standards
4.1 Surrogate solution 1426: tetrachloro-m-xylene (TCX) anddecachlorobiphenyl (DCS) at a concentration of 20 yg/mlin methanol
4.2 Spiking solution #4551: arochlor 1254 at a concentrationof 10.0 ug/ml in methanol
5. 0 Procedure
5.1 Aliquot 250 M! of the oil sample into a 15-ml glassgraduated centrifuge tube. Add 0.5 ml of #426 surrogatesolution, and then dilute the sample to 5.0 ml withhexane .
5.2 For sample spikes, aliquot 250 M! of the oil sample intoa 15-ml graduated centrifuge tube. Add 0.5 ml of #426surrogate and 1.0 ml of #4551 spike solutions, and dilutethe sampl* spike to 5.0 ml with hexane. For blank spikesaliquot 250 M! of hexane into a 15-ml graduatedcentrifuge tube. Add 0.5 ml of #426 surrogate and 1.0 mlof #4551 spike solutions, and dilute the blank spike to5.0 ml with hexane.
!VNI9iaO

Section No. 3.2.2.3Revision No. 4Date: July 7, 1992Page 2 of 2
5.3 Prepare a method blank by aliquoting 250 ^1 of hexane andadding 0.5 ml of #426 surrogate. Dilute the sample to5.0 ml with hexane.
5.4 Acid wash all samples with concentrated sulfuric acid.Add approximately 2.0 ml of concentrated sulfuric acid tothe sample*. Vortex each sample for one minute, thenallow layers to separate for 5-10 minutes. Pipet off thetop (hexane) layer to a clean tube.
5.5 If the top layer is not clear after the first acid wash,you may perform up to five additional acid washes persample. Record any comments about samples in the commentsection of the extraction worksheet; include anydifficulties with the acid wash. Add 2.0 ml of freshsulfuric acid to the top (hexane) layer and repeat step5.4.
5.6 If the top layer Is clear, transfer the sample to a 5-mlvial and seal it with a Teflon-lined crimp top. Labelthe bottle with CompuChem number, procedure code, andcompletion date. Complete all paperwork and post theextraction queue in the HP3000 computer system. Thesamples are now ready for GC analysis.
ORIGINAL

>- f - - --,
*J-
Standard Operating Procednre (SOP) Documentation Term
•trttfd Oparattv Prooaduraa (SOPa) daacrtba h datal howtaafca ara partarmadhapadAoarat.Bacauaa thay ara i»ad tor trahlfqaawaaaa tor laQaldocunianiaUoivt la Important »• SOPa raflaathanvMteurrartpraa0oaao(thalabontoryordap«ftmanL kiturTvwamuatkaapoarariJraoordiarwtiowretaer rated SOPa. whan thay baoama affaettva, and whan I la tin* tor SOPa to barawlawadlNa form rnuatJcoomparyalSOPatohajpuafaccrdtfMtMommloft
laata M aura tftff lha atetfarf araa ortW* term lifaHaatf SO* to OuaWy AMOTWIM «er approval
Procaduraappro^byQualtyAaauranfiaRapraaarttifca:
Prooadinr»eaK«dbyTachnlealCommuntcailona:
NOTF: On« yaar from (/>• tfMa Tae/M/ea/ Commun/c«/on« /tet^tf tWi tOP, U6 /n§n»y«« arar*qu/r«rf (e rtW«w tea pncl/cM inrf ravfta t/)«
ORIGINAL

Section .vo. 4.3.1Revision Mo. 4Date: July 13, 1992Pag* 1 of 12
Instrument Procedure IQl!
1.0 Introduction
Analysis of OrganochlorinePesticides and PCBs by Method 8080
For the analysis of polychlorinated biphenyls in oil,Compuchem employe a combination of analytical methodologybased on SW-846 (Method 8080, 3580) and the U.S. EPA ContractLab Program (CLP) 2/88 statement of Work.
2.0 SCQPC and Application
Method 8080 is ueed to determine the concentration of variousorganochlorine pesticides and polychlorinated biphenyls(PCBa). Table i indicates the compounds that may bedetermined by this method and Table 2 lists the appropriatedetection limits by matrix.Table l. Method 8080 Compounds
Analvta CAS Number
Aldrinalpha-BHCbeta-BHCdelta-BHCgamaa-BHCTechnical Chlordane *4,4'-ODD4,4'-DDE4,4'-DOTDieldrinEndosulfan IEndosulfan IIEndosulfan sulfateEndrinEndrin aldehydeHeptachlorHeptachlor epoxideMethoxychlorToxaphenePCB-1016PCB-1221PCB-1232PCB-1243PCB-1248PCB-1254PCB-1260
309-00-2319-34-6319-85-7319-86-858-89-9
72'72-50-60'
959-33213-
1031-72-
7421-76-
1024-72-
8001-12674-11104-11141-
126721109711096
•54-8•55-9•29-3•57-1•98-8•65-9•07-8•20-8•36-3•44-8'57-343-5•35-2'11-228-216-521-d29-669-582-5
ORIGINAL

Section No, 4.3.1Revision No. 4Date: July 13, 1992Page 2 of 12
Table 2. Method Detection Limits For Oil Matrix
Analyte (M9/9)
PCB-1016PCB-1221PCB-1232PCS- 12 4 2PCB-1240PCB-1254PCB-1260
2.07.03.05.02.0S.O2.0
3.0 Summary of Method
3.1 Method 8080 provides gas chromatographic condition* forthe detection of parts per billion (ppb) levels ofcertain organochlorine pesticides and PCBS. Prior to theuse of this method, appropriate sample extractiontechniques must be used (see appropriate samplepreparation procedure) . Both neat and diluted organicliquids (Method 3580, Waste Dilution) may be analyzed. Al to 5->il sample (depending on column type) is injectedinto a gas chromatograph (GC) using an autosamplar, andcompounds in the GC effluent are detected by an electroncapture detector (CcD) .
3.2 The sensitivity of the method usually depends on thelevel of interferences rather than on instrumentallimitations. To limit this interference , Method 3620(Florisil Column Cleanup) and 366O (Sulfur cleenup) areused. Furthermore, a sulfurlc acid wash cleanup(described in the sample preparation procedure) is usedIn samples that require analysis for PCBS only.
4.0 Definitiona
Where necessary, terms are defined in the procedure text.
ORIGINAL

Section Ho. 4.3.1Revision No. 4Data: July 13, 1992Pag* 3 of 12
5.0 Interferences
Contamination by carryover can occur whenever high-level andlow-level samples are analyzed sequentially* To minimizethis, the sampl* syringe must be rinsed out with solventbetween samples (hexane). In addition, when an unusuallyconcentrated sample is encountered, it should be followed byan analysis of a solvent blank to eliminate croas-contamination and carryover.
5.1 Solvents, reagents, glassware, and other sampleprocessing hardware may yield artifacts and/orinterferences to sample analysis. All of these material*must be demonstrated to be free from interferences underthe conditions of the analysis by analyzing methodblanks.
5.2 Phthalate esters can be a source of major Interferenceswhen using the BCD. These phthalates are easilyextracted or leached from common flexible plastics duringthe sample preparation procedures. Interferences fromphthalates can best be minimized by avoiding contact withany plastic materials* Exhaustive cleanup of reagentsand glassware may be required to eliminate backgroundphthalate contamination.
5.3 Glassware must always be scrupulously cleaned to avoidaccumulation of soap residue on the glassware, as well asto prevent the problems described above. Soap residue onglassware can cause degradation of certain analytes,especially aldrin, heptachlor, and endrin.
6.0 Apparatus and Materials
Oaa Chroaatograph
6.1 Gas chromatographi Analytical system complete with gaschromatograph suitable tor on-column injections and allrequired accessories/ including detectors, columnsupplies, gases, and syringes. A data system formeasuring peak heights and/or areas is recommended.
6.2 Columnat
6.2.1 Column is Supelcoport (100/120 mesh) coatedwith 1.5% 69-2250/1.95% SP-2401 packed in al.fl-m x 4-ma I.D. glass column or equivalent.
ORIGINAL

Section No. 4.3.1Revision No. 4Data: July 13, 1992Page 4 or 12
6.2.2 column 2: supelcoport (100/120 mash) coatedwith 3% OV-ioi in a i.a-m x 2-mm I.D. glasscolumn or equivalent.
6.2.3 Column 31 OB-608 wide-bore (0.53 ma ID) fusedsilica, 30 n long.
6.2.4 Column 4i RTX-1701, 30 n x 0.53 mm.
6.3 Detectors: Electron Capture (ECD)
7,0 Procedure
7.1 Extraction. Refer to the sample preparation procedure(-402) for details of sample extraction.
7.2 oas chromatography.
7.2.1 introduction of sample. All samples arescreened at a 10:i dilution on a packed columnto determine the approximate concentration ofthe samples. The screens are then used todetermine the dilution the sample is to beanalyzed at. The following table illustrateshow dilutions are prepared:
Dilution Vol. of sample(ul) Vol. of hexan* (ul)
2:15:110:120(1so:i100:1200:1
5002001005020105
500600900950980990995
For dilutions greater than 200:1, a serial dilution should be mad*.For example, a 1000:i dilution can be made by making a 10:1dilution of a 100:1 dilution. The first dilution should be thehigher dilution (ioo:i) to minimize the rlsx of contaminating thesyringe.
ORIGINAL

Section No. 4.3.1Revision No. 4Data; July 13, 1992Page 5 of 12
7.2.2 Operating Conditions:
Column 1iac: varian 3400 or 3700.Carrier ga«i Argon/Methane (95%/5%) at 15 ml/Bin.Injection Port: on column at 220'C.oven: isothermal in the range i90-2io»C. Adjustedso that the retention tine of DOT Is 12 minutes orlater.Injection port; Varlan 1/4-inch packed column portDetector: ECO at 300*C.Injection volume: 5.0
Column 2 ISame as column 1, except oven temperature adjustedso DOT is after n.5 minutes. Injection volume isi.o /ii. and ECO temperature is 200*c.
Column 3 and 4iOC: Varian 3400Carrier ga«i helium at 5 ml/min.Make-up gas: argon/methane.Injector tempi 200*C.Detector temp: 300*C.Injection volume: 1.0 /il.Initial oven temp is 150*Cinitial hold time is 0.50 minutes with program 1 hold
time of 6 minutesTemperature ramp is 5*C/ninFinal hold time is 10 minutes.
7.3 initial calibration and Quantisation
7.3.1 The external calibration technique is used. Athree-point Initial calibration is analyzed byinjecting three levels of all single componentanalytes and three levels of PCB-1016 and PCB-1260 (both PCBs are contained in one solution) .Single point calibrations are analysed for theremaining PCBs and toxaphene. The lowest levelis near, but above, the method detection Unit.Response factors are calculated by dividing thepeak area over the standard concentration foreach analyte at each standard concentration:
Response Factor - peak area
std. oono.
ORIGINAL

Section No* 4.3.1Revision Ho. 4Date: July 13, l>»2Pago « of ia
The three response factors are then ueed tocalculate a mean response factor and thepercent relative standard deviation (%RSD). Ifthe *RSD is lees than 20% over the workingrange, then linearity through the origin can beassumed, and the average response factor can beused in place of a calibration curve. Foraultiresponse PCB's/pestlcides, use the totalarea of all peaks used for quantitation. ifthe %RSD is greater than 20%, then correctiveaction must be taken and • new initialcalibration analyzed.
7,3.2 Corrective Action
The following Items should be checked;
• If response factors have randomvariations, check the column connectionsfor leaks and measure the flow rates.
s Make a hand Injection to eneure theautosampler is working properly.
• If response factors increase withconcentration, active sites are present inthe chromatography system. Analyse • highlevel standard at least 20 times moreconcentrated than the mid-level standardsto prevent column absorption.
• If response factors decrease withconcentration, check for contamination ofthe system by analyzing a blank. Columnmaintenance may be necessary*
s If retention times are shifting, thenchange the septa.
s Analyze a degradation standard to ensureDOT and Endrln are not degrading on theinjector.
In addition to the above standards for theinitial calibration, a degradation standardcontaining endrln and DOT must be analyzed atthe beginning of the calibration sequence, ifdegradation of either 4,4'-DOT or endrinexceeds 20%, then corrective action in the formof either column maintenance or cleaning the
ORIGINAL

Section No. 4.3.1Revision No. 4Date: July 13, 1992Page 7 of 12
Injector port must be taken before thecalibration can proceed. Calculate percentbreakdown as follows:
% DOTBreakdown
Total DOT degradation peak area (DDE+DDD)• —— --—— • --- . ———— ___---------_-_. — ....._Total DOT peak area (DDT+DDD+DDE)
% Endrin Breakdown * Total endrin degradation peak area(Endrln aldehyde + Endrin Ketone)————————————————————————————————————— x 100
Total endrin peak area (endrln •*• endrln aldehyde+ endrln ketone
Retention time shift must also oe monitored throughoutthe analytical sequence. The surrogates tetrachloro-m-xylene (TCX) and decachloroblphenyl (DCB) are added toall samples (see sample preparation procedure -402) andstandards. Retention tine shift must be leas than 2% forpacked columns, 1.5% for narrow-bore capillary columns,and 0.3% for mega-bore capillary columns. If theselimits are exceeded, the corrective action described musttake place, if the problem is minor, and retention timescan be re-established within the required windows,analysis can be continued following the successfulanalysis of a continuing calibration standard, if not, anew initial calibration must be analyzed, and all samplesthat were outside the retention time shift must be re-ana lyeed.
Table 3. initial Calibration standards and Concentrations
MIX A (4361, 4302, 4363)
Level in Standards (ug/ral)
Analyte 4361 (low) 4362 (mid) 4363 (high)
gamma-BHCHeptachlorAldringamma ChlordaneEndosulfan IDieldrlnEndosulfan II4,4*-DOTDDC (surrogate)
O.OOS0.0030.003O.OOS0.0030.0100.0200.0300.100
0.0100.0100.010O.O10O.O100.0200.0400.0600.100
0.0200.0200.0200.0200.0200.0400.0800.1200.100
ORIGINAL

Section No. 4,3.iRevision No. 4Data: July 13, 1992Page a or 12
4,4'-Methoxychlor 0.050
MIX B (4365, 4366, 4367)
0.100 0.200
alpha-fine 0.005beta-BHC 0.010delta-BHC 0.005Heptachlor epoxide 0.005alpha-Chlordane 0 . 0104,4'-DDE 0.010Endrin 0.0204, 4 '-ODD 0.020Endrin aldehyde 0.020Endosulfan sulfate 0.020DBC 0.100
MultipaoXed analytes
1016 0 . 1501260 0.15012211232124212481254
AroclorATOClorAroclorAr oclorAroclorAroclorAroclor
O^OIO0.0200.0100.0100.0200.0200.0400.0400.0400.0400.100
1.000.3000.3001.000.700.400.400.30
0.0400.0800.0400.0400.0800.0800.1600.1600.1600.1000,100
1.2001.200
Aroclor-1016/1260 is in on* solution.
7.4 Continuing Calibration.
7.4.1 A mid-level standard la analyzed after every 10•amplas in the analysis sequence. This isrotated among a MIX A, MIX B, or aroclor1016/1260 standard it tne samples are PCB only.The r«»pon»« factor for each analyte in thecontinuing calibration is calculated using thesane calculation used in the initialcalibration. The percent difference (%D)between the continuing calibration and theinitial calibration is then determined usingthe following equation:
to * R1-K2——— X 100R2
RI- Response factor of initial calibrationanalyte
ORIGINAL

Section NO. 4.3.1Revision Ho. 4Date: July 13, 1992Page 9 of 12
R2- Response factor of continuing calibrationanalyte
The *D must be lass than or equal to 15* forall analytes. if not, the investigativecorrective action dafieribed in section 7.3.2must be undertaken, and a new initialcalibration analyzed, samples injected after afailing continuing calibration must be re-analyBed.
7.4 Compound Identification
7.4.1 A single component analyte is reported aspresent in a sample if that compound isidentified within the appropriate retentiontime window (depending on column type) on twodissimilar types of columns, if an analyte isobserved within the retention time window ofone analytical columnr the sample is confirmedon a second column, if also identified herewithin the retention time window, the analyteis reported. Generally, the smaller of the twoquantitations is reported, but Interferencespresent on one column but not the other mayallow for the analyst to report the largerconcentration.
7.4.2 Multicomponent analytes are identified if atleast three peaks are within the appropriateretention tine windows on two dissimilarcolumns, and also through the use of patternmatching. The identification and quantitatlonof Aroeiors is very complex and many decisionsare based on the experience of the analyst. Ineach case, the chemical is made up of numerouscompounds* Therefore, only senior analystsshould attempt to identify FCBS and othermulti-peaked analytes.
7.4.3 PCBS quantitatlon is accomplished by comparingtotal areas of residue peaks to total areas orpeaks from the appropriate standard, based onretention tines. Use only the peaks that areattributed to that particular aroclor. The•ample should contain the three largest peaksin the aroclor standard and at least two otherminor peaks. Pattern recognition is done atCompuchem with the help of a computer programwhich compares the sample and the standardspeak for peak, based on retention time matches
ORIGINAL

Section No. 4.3.1Revision No. 4Data; July 13, 1992Pag* 10 of 12
and adds up the total number of common peaksfound and calculates the area ratios of thecommon peaks. It then runs a standarddeviation test on all the peaX ratios,calculates the mean ratio, and eliminates anypea* ratio outside of a 2X standard deviationwindow from the mean, and then recalculates themean and standard deviation. The RSD of thepattern match should be less than 33% for it tobe a valid fit. compound quantltation isachieved using the following formulas:
CA - A/As X SC X D X Ve
VS
CA - calculated amount (ug/1 for water, ug/Kgsoil)
A - Sample peak areaAs - standard poak areaSC - Standard ConcentrationD - DilutionVe - Volume of extractVe - Volume or weight of sample
7.5 setting Retention Time Windows
7.5.1 Retention time windows are set from the meanretention time of the three levels of eachanalyte from the initial calibration. A 2%window is used for packed columns, and 1.5% fornarrow-bore capillary columns.
8.0 Quality Control Summary
B.I Surrogates. The recovery of the surrogates TCX and DCBmust be within 20-130%. These limits were adopted fromthe 2/88 CLP statement of Work, and are advisory innature. CompuChem has an internal policy of re-extracting any samples that have less than 20% surrogaterecoveries. This is done to verify that the extractionprocedure is in control and no target analytea are lost,and that the cause of the low surrogate recovery la dueto a matrix effect.
8.2 Retention tine shift. All samples, standards, and QCsamples (blanks, matrix spikes, and matrix spikeduplicate) must be within the 2% window for packedcolumns, 1.5% for narrow-bore, and 0.5% for mega-borecolumns.
INI/U
Section No. 4.3.1Revision No. 4Date: July 13, 1992Page 11 of 12
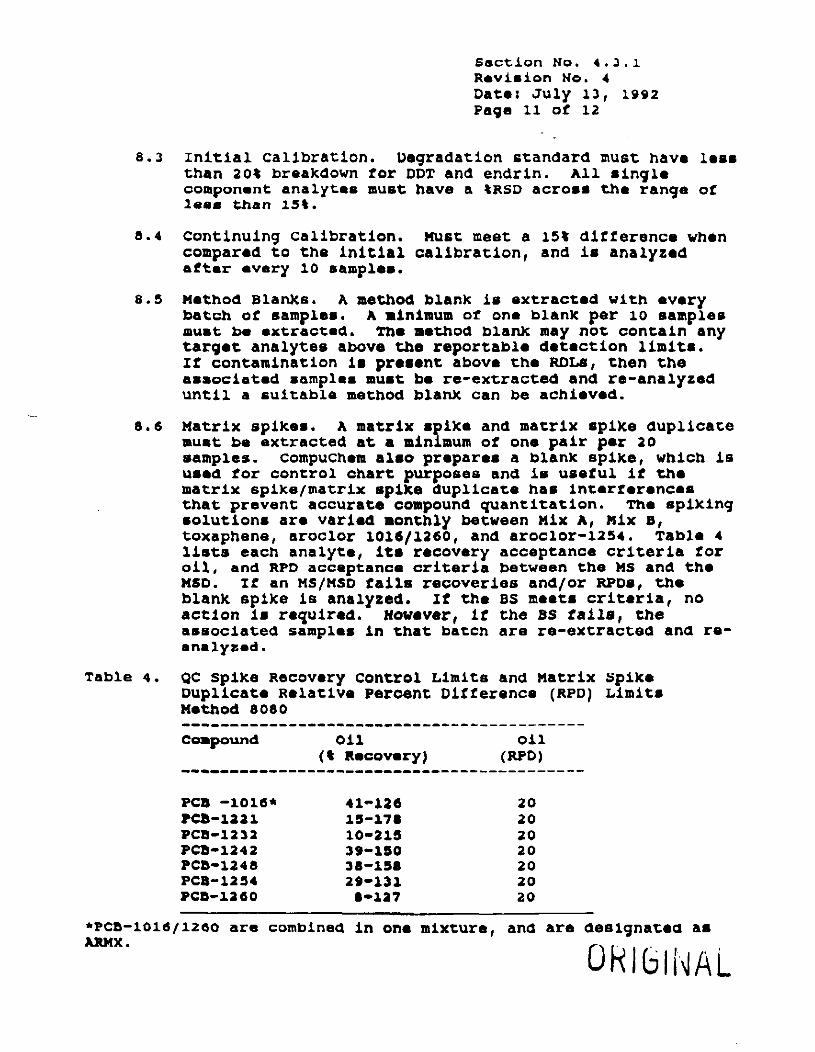
8.3 initial calibration. Degradation standard must have lessthan 20% breakdown for DOT and endrin. All singlecomponent analyses must have a %RSD across the range ofleee than 15%.
8.4 Continuing calibration. Must meet a 15% difference whencompared to the initial calibration, and is analyzedafter every 10 sample*.
8.5 Method BlanXe. A method blank is extracted with everybatch of samples. A minimum of one blank per 10 samplesmust be extracted. The method blanX may not contain anytarget analytes above the reportable detection limits,if contamination is present above the RDLS, then theassociated samples must be re-extracted and re-analyzeduntil a suitable method blank can be achieved.
8.6 Matrix spikes. A matrix spike and matrix spike duplicatemust be extracted at a minimum of one pair per 20samples, compuchem also prepares a blank spike, which isused for control chart purposes and is useful if thematrix spike/matrix spike duplicate has interferencesthat prevent accurate compound quantitation. The spikingsolutions are varied monthly between Mix A, Mix B,toxaphene, aroclor 1016/1260, and aroclor-1254. Table 4lists each analyte, its recovery acceptance criteria foroil, and RPD acceptance criteria between the MS and theMSD. if an M5/MSD fails recoveries and/or RPDs, theblank spike is analyzed. If the BS meets criteria, noaction is required. However, if the BS fails, theassociated samples in that batch are re-extracted and re-analysed.
Table 4. QC spike Recovery control Limits and Matrix spikeDuplicate Relative percent Difference (RPD) LimitsMethod 8080Compound
PCB -1016*PCB-1221PCB-1232PCB-1242PCB-1248PCB-1254PCB-1260
Oil(% Recovery)
41-12619-17S10-21939-19038-19829-1318-127
Oil(RPD)
20202020202020
*PCB-ioi6/i26O are combined In one mixture, and are designated asARMX.
ORIGINAL
Section No. 4.3.1Revision No. 4Data: July 13, 1992Page 12 of 12
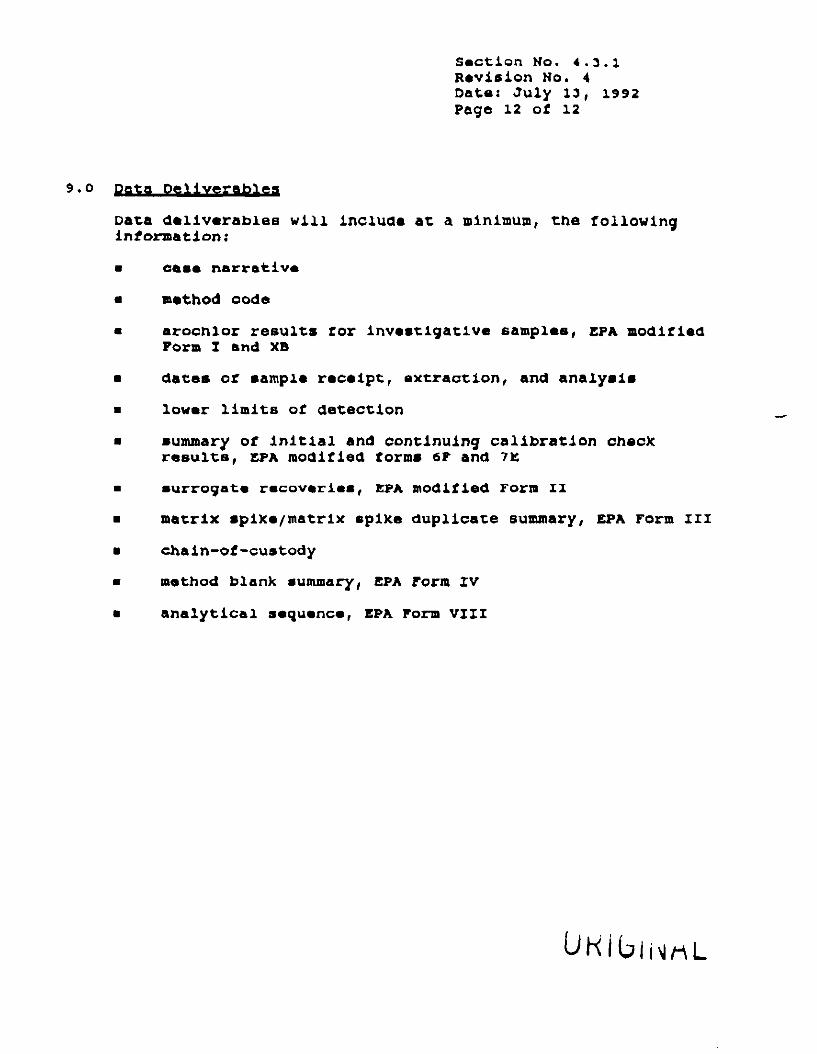
9. 0 Data Deliverables
deiiverabies will include at a minimum, the followingInformation:
• cese narrative
m method a ode
• arochlor results for investigative samples, EFA modifiedForm I and XB
e dates of sample receipt, extraction, and analysis
• lower limits of detection
• summary of Initial and continuing calibration chacKresults, EPA modified forms 6F and 7fc
• mirrogate recoveries, EPA modified Form II
• matrix spixe/matrlx spike duplicate summary, EPA Form in
• chain-of -custody
• method blank summary, EPA Form IV
• analytical sequence, EPA Form VIII

Standard Operating Procedure (SOP) Documentation Form
Standard Operating Procedures (SOPs) describe in detail how tasks are performed In specific areas.Decause they are used for training as well u for legal documentation, k is important that SOPs reflect themoat current practices of U w laborrtory or department In turn, we must keep carefuJ record* Of who wroteor rvviMd SOP*, when they became effective, and when • to time for SOPs to be reviewed. TMs form mustaccompany aN SOPs to help us record that Information.
/>/•••• fte sura mat t/ie t/Mtfetf area or tfiis form ft comp/efetf ftefore you prVe tne new orSOP lo Ouaffty Assurance for approval
Procedure approved by Quattty Assurance Representative: Oat*
Procedure received by Technical Communlcatlona: Date;
-y HIM?"^^ T T^^r^^^
NOTE: One yew from ine date recrin/cj/ Communfeatfont rece/verf t/)/s SOP, /efr m«naoe/» ereto revf*w /aft prect/cec entf revice rne SOP ifneeesMn/.
Annual Review Date: n n , ,- , , . ,UHlbllMA L

Yeoman CreekRevision No.: 5
Date: 7/14/92Page: 1 of 13
DETERMINATION OF VOLATILE ORGANIC COMPOUNDSBY CARBON MOLECULAR SIEVE ADSORPTION AND GC/MS
Scope and Application: This method is applicable to ambient air orlandfill gas collected on CMS cartridges.
Principle: TO2: A procedure for collection and determinationof selected volatile organic compounds which can be captured oncarbon molecular sieve (CMS) adsorbents and determined by thermaldesorption GC/MS techniques. Compounds which can be determined bythis method are selected nonpolar and nonreactive organics havingboiling points in the range of -15 to 120°C.
Method: Modified EPA method T02
Reference: EPA method TO2, April 1984, Rev. 1.0
Parameters to be Measured: See Table 1.
Apparatus: Sorbent Tube Desorber Conditions:
Injector Temp: 160 CSorbent Trap Temp: <30 to 300°CBake Oven Temp: 260°CValve Oven Temp: 150 CTransfer Line Temp: 150 C
LFGAS-1

Yeoman CreekRevision No.: 5
Date: 7/14/92Page: 2 of 13
Gas Chromatograph (GC) Conditions:
Injector Temp:Aux-Temperature:(transfer line)
Carrier Gas:
GC Oven Program
Initial Temperature:Initial Ramp Rate:Final Ramp Rate:Final Temperature:Hold Time:
200 c200°C
Helium at 7 cc/min
-10 C for 1 minute15°C/minute to 30°C6°C/minute to 150°C150°C10 minutes
G.C. Column: 0.53 mm x 30 m DB-624 fused silicacapillary column (FSCC) or equivalent
Mass Spectrometer (MS) Conditions:
Mass Range:Scan Rate:Electron Energy:Manifold Temperature:Source Temperature:
35-300 amu1 sec/scan70 eV100°C240°C
Tekmar LSC 2000 Purge and Trap,
Heated Glass Sparge VesselTekmar #8 trapPurge Time : 10 minutesPurge Temperature : 35°CDesorb Temperature : 260°CDesorb Time : 4 minutesBake Temperature : 260°cBake Time : 20 minutesPurge Flow : 30 mLs per minute UHP Helium
LFGAS-2

Yeoman CreekRevision No.: 5Date: 7/14/92Page: 3 of 13
Working Linear Range: " 10-1000 ng/cartridge
Method Detection Limits: See Table 2.
Interference and Corrective Action:
When interference with the primary quantitation ion occurs,quantitation on a secondary ion is carried out. High levelcartridge loadings may require thermal desorption into cleanTedlar bags.
Reagents and Calibration Standards:
Standards are prepared from EPA Certified Ultra Scientific andlaboratory certified Aldrich neat materials. The UltraScientific mix was purchased certified to 200 nG/uL andblended down to cover a working range of 10 to 1000 ng spike.Standards prepared in neat form are first subject to capillaryGC/FID analysis to determine purity. The percent purity mustbe greater than 96% or correction factors are used. Followingthe purity check, the standards are blended into the workingrange by taking known aliquotes and using density basedcalculations.
LFGAS-3

Yeoman CreekRevision No.: 5
Date: 7/14/92Page: 4 of 13
Table 1
Primary SecondaryInternal Standards: Ouan. Ion fm/z) Ouan.Ion(s] fm/z)
bromochloromethane 128 49, 511,4-difluorobenzene 114 63, 88chlorobenzene-D5 117 119,82
Surrogates:
1,2-dichloroethane-D4 65 102toluene-08 98 70, 1004-bromofluorobenzene 95 174,176
Target Analvtes:
chloromethane 50 521,1-dichloroethene 96 61, 98vinyl chloride 62 641,3-butadiene 39 54bromomethane 94 96trichlorofluoromethane 101 103methylene chloride 49 84, 86chloroform 83 85, 471,1,1-trichloroethane 97 99, 61carbon tetrachloride 117 119benzene 78 771,2-dichloroethane 62 64trichloroethene 130 132, 951,2-dichloropropane 63 41, 62toluene 91 92tetrachloroethene 164 129, 131,1661,2-dibromoethane 107 109chlorobenzene 112 77, 114o-xylene 106 106ethyl benzene 91 106
LFGAS-4

Yeoman CreekRevision No.; 5
Date: 7/14/92Page: 5 of 13
Note: All target analytes listed in Table 1 above have retentionvolumes in excess of 100 liters per cartridge at 37°C exceptvinyl chloride for which the value is "30 liters/cartridgeand chloromethane (retention volume on CMS unknown).
Mass Spectrometer Calibration: The mass spectrometer iscalibrated with perfluorotributylamine (FC43).
Prior to the analysis of standards, blanks or samples, 50 ng of 4-bromofluorobenzene is injected into the GC and the following ionabundance criteria must be met:
m/z BFB Ion Abundance Criteria
50 8.0 - 40.0 percent of mass 9575 30.0 - 66.0 percent of mass 9595 100 percent relative abundance96 5.0-9.0 percent of mass 95173 less than 2.0 percent of mass 95174 50.0 - 120.0 percent of mass 95175 4.0 - 9.0 percent of 174176 93.0 - 101.0 percent of mass 174177 5.0 - 9.0 percent of mass 176
A. Initial Calibration
Calibration is done at six different concentrations: 10,50, 100, 250, 500, and 1000 nG. The percent relativestandard deviation (%RSD) for each target analyte must bewithin 25% for the initial calibration.
LFGAS-5

Yeoman CreekRevision No.: 5Date: 7/14/92Page: 6 of 13
Analysis of initial and continuing calibration standardsrequires several steps as described below:
1. Load a clean T02 cartridge (or an investigativesample cartridge) onto the concentrator and leakcheck connections by placing a small amount ofmethanol on each fitting. The appearance of bubblesindicates a leak and fittings need to be tightened,
2. Load the internal standard and surrogates onto theCMS cartridge by injecting 2 uL of the mixture intothe heated port on the tube desorber. The valve isin the LOAD position.
3. After 1 minute,switch the valve from LOAD toDESORB, turn on the heater control (the tubedesorber is ballistically heated to 260°C) and placethe front cover on the aluminum block. Step theTekmar P&T to PURGE. The volatile compounds areswept from the CMS cartridge into the P&T for 10minutes. During this time the trap of the P&T is at35°C. Water and methanol pass thru the trap and outto vent while the VOC's remain trapped.
Note: Prior to starting the P&T DESORB, the GC shouldbe at -10 C and the data system should be ready toacquire data.
4. After the initial 10 minute purge, the sorbent trapof the P&T is ballistically heated to 260°C and thevolatile compounds are swept through the transferline and onto the GC column.
LFGAS-6

Yeoman CreekRevision No.: 5Date: 7/14/92Page: 7 of 13
B. Continuing Calibration
The daily standard (represented by the lower end of theinitial calibration, i.e., 50 nG) is required once every12 hours before any blanks or samples are analyzed. Thecontinuing calibration is validated using a 50 nGcalibration check of all target compounds identified onpage 4. The percent difference (%D) between the initialcalibration and the continuing calibration checkcompounds cannot exceed 30 percent. If these criteriaare met, analyses can proceed; otherwise, the standard isto be reanalyzed. If the %D criteria cannot be met, anew initial calibration is required.
C. Method Blank
The method blank (a clean T02 cartridge analyzed in thesame way a standard or sample is analyzed) is run beforeany samples are analyzed. Blank analysis is repeateduntil the trap and the system are shown to be clean. Atthis point the system is ready to analyze samples.
D. Sample Storage, Preparation and AnalysisTHCarbotrap 300 CMS cartridges are purchased from
Supelco, Inc. (Beliefonte, PA) . The cartridges areprepared for field sampling by baking in a muffle furnaceat 350°C for 4 hours while purging with UHP Nitrogen.One cartridge in 20 is certified to be clean of targetcompound contamination using EPA Method T02. If anytarget compound is found at greater than the analyticaldetection limit the batch of cartridges is considered tohave failed the purity check and must be baked a secondtime. When all target compounds are present at less thanthe detection limit the cartridges are prepared forshipping by packaging in Teflon sealed glass culturetubes. A small amount of coconut shell charcoal is
LFGAS-7

Yeoman CreekRevision No.: 5
Date: 7/14/92Page: 8 of 13
placed in the bottom of each culture tube followed bycotton balls to cushion the cartridge from the glasswalls. A unique tube identification number is fixed tothe outside of the transport tube along with theexpiration date of the cartridge. (The cartridgeexpiration date is 14 days from certification. If fieldsampling does not occur within this time frame thecartridges are returned to the lab for recertification) .The cartridges are shipped to the field wrapped in bubblepak and placed in a cooler.
Investigative and field QA/QC sample cartridges will be repackagedin the transport tubes and shipped to the laboratory in coolers at4°C under strict chain-of-custody and stored in the laboratory understrict-chain-of-custody until analysis at 4°C. Sample analysis isperformed after all the above criteria have been met. Any analysesmust be performed within a 12 hour period following BFB tune time.
Investigative samples are analyzed in an identical manner ascalibration standards.
Investigative sample cartridges are stored in a refrigerator at 4°Cupon receipt and are analyzed within 14 days of sample collection.
LFGAS-8

Yeoman CreekRevision No.: 5Date: 7/14/92Page: 9 of 13
E. Data Validation
Qualitative identification of compounds determined by thismethod is based upon retention time, and on comparison of thesample mass spectrum, after background correction, withcharacteristic ions in a reference mass spectrum (reverselibrary search). Relative retention times (RRT) of samplecomponents must be within ±0.06 RRT units of the RRT of thestandard component. Relative intensities of the characteristicions present in the sample spectrum must agree within 30% ofthe relative intensities of these ions in the referencespectrum.
Quantitative analysis of target compounds is based upon theintegrated ion abundance from the extracted ion currentprofile of the primary characteristic ion for that compound.Quantitation is accomplished using the internal standardtechnique indicated in the section below. Backup cartridgesshould contain less than 10% of the amount of compounds ofinterest found in the primary cartridge.
LFGAS-9

Yeoman CreekRevision No.: 5Date: 7/14/92Page: 10 of 13
Analytical Measurements:
area of target cmpd. char, ion amount of I.s.RRF = ———————————————————————— x ——————— ——— - —— — -•
area of I.S. characteristic ion amount of target cmpd
area of target cmpd. char, ion amount of I.s.Amount = ————————————————-—————————— x ——————— —————
area of I.S. characteristic ion RRF
IS = Internal StandardRFF = Relative Response Factor
Analytical Reporting
Results will be reported in nG/cartridge and mG/m where:
mG MG (nG) (0.001)
m L Liters sampled
Data Deliverables:
Data deliverables will include at a minimum:
case narrative;method code;results for investigative samples;dates of sample receipt, extraction, and analysis;lower limits of detection;summary of initial calibration and continuingcalibration check results;
LFGAS-10

Yeoman CreekRevision No.: 5Date: 7/14/92Page: 11 of 13
surrogate recoveries;matrix spike/matrix spike duplicate summary;GC/MS tuning information summary; andchain-of-custody.
Quality Control Retirements:
4-BFB: must be analyzed every 12 hours and before thestandard is run and must pass the above referenced criteria.
Method Blank: must be analyzed before any samples aredetermined, and no target analyte can exceed the reportinglimit for that analyte with the exception of methylenechloride, a common laboratory contaminant, which may bepresent at levels up to 50 ng/cartridge.
Initial Calibration: must cover six points and result in a%RSD of less than 25% for all target compounds.
Continuing Calibration: The 50 nG calibration standard mustbe analyzed once every 12 hour shift. The continuingcalibration check compounds (all the target analytes) must notexceed 30% di f f erence when compared with the mean RRFsobtained in the initial calibration else recalibration isrequired.
Internal Standard: Internal standard responses must be withina factor of 50% when compared with the responses obtained inthe continuing calibration sample.
Surrogate Control Limits: Lower Upper
l,2-dichloroethane-D4 70 - 130%toluene-08 70 - 130%4-bromofluorobenzene 70 - 130%
LFGAS-11

Yeoman CreekRevision No.: 5
Date: 7/14/92Page: 12 of 13
Relative Retention Times: Target analytes must elute withiniO.06 retention time units of the elution time of thestandard analyzed each day.
Matrix spike and matrix spike duplicate analysis are carriedout on a field sample collected in triplicate. The lab willpre-spike two cartridges per level with all target analytes.Therefore, MS/MSD analysis will require collection of threecartridges at different levels in duplicate for a total of sixcartridges. The tubes will be iced and shipped to the fieldfor sampling. Recoveries for target compounds are expected tobe within + 50% of the multilevel calibration.
Safety Precautions:
Safety glasses are required when handling compressed gascylinders and when working in the laboratory.
Cylinders are strapped in a secure fashion.
LFGAS-12

TABLE 2TARGET PARAMETERS
LANDFILL GAS
Yeoman CreekRevision No.: 5
Date: 7/14/92Page: 13 of 13
Target Analyte
Vinyl Chloride
1,3-Butadiene
Bromomethane
Trichloroftuoromethane
Methylene Chloride
Chloroform
1,1,1-Trichloroethane
Carbon Tetrachloride
1,2-Dichloroethane
Trichloroethene
1,2-Dichloropropane
Toluene
Tetachloroethene
1 ,2-Dibromoetha i , e
Chlorobenzene
o-Xylene
Ethylbenzene
Benzene
Chloromethan*
1,1-Dichloroethene
CAS RegistryNumber
75-1-4
106-99-0
74-83-9
75-69-4
75-9-2
67-66-3
71-55-6
56-23-5
107-6-2
79-1-6
78-87-5
108-88-3
127-18-4
106-93-4
108-90-7
1330-20-7
10O414
71-43-2
74-87-3
75-35-4
Minimum ReportingLimit, nG/Cartridge
10
10
10
10
10
10
10
1010
10
10
10
5
10
5
5
5
5
10
10
NOTES: Study performed 4/2/92 in accordance with 40 CFR Part 136, Appendix B
<83220858.wpl/l«j)
LFGAS-13