golder associates ltd. - british...
TRANSCRIPT
Golder Associates Ltd. 220 - 1755 Springfield Road Kelowna, British Columbia, Canada V1 Y 5% Telephone (250) 860-8424 FaX (250) 860-9874
REPORT ON
----f
S
2002 ANNUAL OPERATIONS AND MONITORING REPORT
WESTSIDE LANDFILL WESTBANK, BRITISH COLUMBIA
Submitted to:
Regional District of Central Okanagan 1450 K.L.O. Road
Kelowna, British Columbia VlW 3z4
DISTRIBUTION:
2 Copies - Regional District of Central Okanagan 1 Copy - 2 Copies - Golder Associates Ltd.
Ministry of Water, Land and Air Protection - Penticton
February 24,2003 012-4184 (5200)
50
OFFICES ACROSS NORTH AMERICA, SOUTH AMERICA, EUROPE, ASIA, AUSTRALASIA
February 2003 - 1 - 012-4184 (5200)
EXECUTIVE SUMMARY
This annual operations and monitoring report for the Westside Landfill is required under the Operational Certificate (OC) PR#12217 issued by Ministry of Water, Land and Air Protection (MWLAP). This report includes results of measurements of municipal solid waste volumes for remaining capacity calculations, operational plans and budgets, and groundwater and landfill gas monitoring results.
Based on year 2002 weigh scale data, the total remaining capacity for the Westside Landfill, as of year end 2002, was approximately 614,000 m3. The landfill is expected to reach final capacity in the year 2014.
The Regional District of Central Okanagan (RDCO) will continue to provide operations staff at the landfill. The contract for site work including compaction, heavy equipment operation, and perimeter litter removal is held by Ansell Construction of Kelowna. The operational plan for 2002 is to continue filling in accordance with the OC.
Based on the results of the 2002 landfill gas and groundwater monitoring program, the following conclusions can be made:
During the 2002 sampling period, wells BH1, BH2, BH4 and BH5 (downgradient of the landfill) all showed elevated concentrations of several parameters relative to Dobbin’s Well (background). Parameters which were elevated above background conditions included conductivity, alkalinity, chloride, ammonia, arsenic, barium, boron, calcium, iron, magnesium, manganese, potassium, sodium and strontium.
Concentrations at BH1, located within the landfill, were the most elevated above background conditions, followed by BH4, BH2, BH5 and Shannon Lake Mobile Home Park (SLMHP), respectively.
In general, the concentrations of indicator parameters in downgradient wells have remained relatively constant during 2002.
There were a number of parameters during the 2002 monitoring program which had concentrations that exceed the BC Contaminated Sites Regulation - Drinking Water Standards (CSR-DW), Aquatic Life Standards (CSR-AW) as well as Guidelines for Canadian Drinking Water Quality (CGDWQ) on various occasions. Specifically, the exceedances in 2002 were:
Golder Associates
. I
012-4184 (5200) February 2003 - iii -
Based on the relatively low methane gas concentrations measured during the landfill gas monitoring to date, a landfill gas collection system is not considered warranted at this time. We recommend that the current landfill gas monitoring program be continued.
Based on the limited nature of the groundwater exceedances and that the exceedances are generally confined to areas near the landfill, a leachate collection system is not considered warranted at this time.
As a landfill volume survey for the landfill has not been completed since July 2000, Golder recommends that a volume survey be completed for the landfill in 2003.
Golder Associates
February 2003 - ii - 012-4184 (5200)
TDS (based on conductivity) at BH1, BH2, BH4 and SLMHP (exceeded CGDWQ),
a Chloride at BH1 and BH4 (exceeded both CSR-DW and GCDWQ), 3 Iron at BHl, BH2 (exceeded both CSR-DW and GCDWQ), a Manganese at BH1, BH2, BH4, and BH5 (exceeded both CSR-DW and
GCDWQ), and pH at BH1, BH4 and SLMHP (exceeded GCDWQ).
While several of the elevated parameters in SLMPH are similar to those in monitors closer to the landfill, there is insufficient information to conclude whether the impacts are related to the landfill or not.
Combustible gas measurements were slightly elevated in BH1, BH2 and BHlOl (shallow and deep). Decreased concentrations of oxygen and elevated concentrations of carbon dioxide at BH1, BH2, MN 99-1, MN 99-2, MN 99-3, MN 99-4, BHlOl (deep and shallow), BH102 and BH 103 were also suggestive of biodegradation of waste. While combustible gas concentration appear to be similar to or slighlty higher than in previous monitoring, the combustible gas results are not considered a health or safety concern.
Based on the landfill gas and groundwater monitoring results to date, Golder Associates Ltd. makes the following recommendations.
Based on the groundwater monitoring results to date, Golder recommends that the currently prescribed monitoring program be continued with some modification. The currently prescribed monitoring program is stated in Section 3.0 of this report. We suggest that the required groundwater elevation monitoring for BH6 and well be eliminated. BH6 has not been located in the field for several years, an Well can not be accessed due to the installed pump works. In addition, we recommend that water from SLMPH be analysed for Total Dissolve Solids (TDS) so that values will not need to be inferred from conductivity results.
Based on the concentrations of chloride, conductivity and inferred TDS at the SLMHP well, we recommend that the SLMHP be supplied with municipal water (Lakeview Irrigation District).
Golder Associates
s33
s33
I
February 2003 . iv . 012-4184 (5200)
TABLE OF CONTENTS
SECTION PAGE
1 . 0 2.0
INTRODUCTION ......................................................................................... 1 MUNICIPAL SOLID WASTE MEASUREMENT ......................................... 2 2.1 Waste Volumes and Density .................................................................. 2 2.2 Service Population and Waste Discharge Rates .................................... 3 2.3 Design Volume and Remaining Capacity ............................................... 3 OPERATIONAL PLANS AND BUDGETS .................................................. 4 3.1 Operational Plan for 2003 ...................................................................... 4 3.2 Operation and Maintenance Expenditures .............................................. 4 3.3 Changes to Reports, Plans and Specifications ....................................... 4 3.4 Review of Closure Plan .......................................................................... 4 3.5 Closure Cost Estimate ............................................................................ 4
4.1 Permit Requirements ............................................................................. 5 4.2 Methodology .......................................................................................... 5 4.3 Groundwater Monitoring Results ............................................................ 6 4.4 Landfill Gas Monitoring Results .............................................................. 9 4.5 Discussion of Groundwater and Landfill Gas Monitoring ...................... 10
5.0 RECOMMENDATIONS ............................................................................. 11 6.0 LIMITATIONS AND USE OF REPORT .................................................... 12 7.0 CLOSURE ................................................................................................. 13
3.0
4.0 GROUNDWATER AND LANDFILL GAS MONITORING ........................... 5
Golder Associates
,
February 2003 - v - 012-4184 (5200)
LIST OF TABLES Table 1 Table 2 Table 3 Table 4 Table 5 Table 6 Table 7
Summary of Landfill data for 2002, Westside Landfill Estimated Lifespan of the Westside Landfill Closure and Operational Cost Budget, Westside Landfill Summary of Groundwater Monitoring Requirements, Westside Landfill Monitoring Well and Groundwater Elevations, Westside Landfill General Groundwater Chemistry, Westside Landfill Summary of Soil Gas Monitoring Results, Westside Landfill
LIST OF FIGURES Figure 1 Figure 2 Figure 3 Figure 4A Figure 4B
Location Plan, Westside Landfill Site Plan, Westside Landfill Yearly Waste Discharge Rates, Westside Landfill Groundwater Elevations, Westside Landfill - Borehole 1, 2,4, 7 Groundwater Elevations, Westside Landfill - Borehole 3 ,5 , 8
LIST OF APPENDICES Appendix I Trend Analysis Graphing (Various Parameters)
Golder Associates
February 2003 - 1 - 012-4184 (5200)
1 .O INTRODUCTION
This annual operation and monitoring report for the Westside Landfill is required under the Operational Certificate (OC) PR#12217 issued by Ministry of Water, Land and Air Protection (MWLAP). As outlined in Section 3.0 of the OC, the following information is included in this report:
total volume and/or weight of material discharged;
service population and waste discharge rates with trend analysis compared to 1990 baseline discharge rate;
authorized design volume;
estimates of remaining site life and capacity;
an operational plan for the next 12 months;
operating and maintenance expenditures for the landfill;
groundwater, leachate and landfill gas monitoring data and interpretation;
amount of leachate collected, treated and disposed;
changes from authorized reports, plans and specifications including changes to the contingency plan;
amount of landfill gas collected and its disposition;
review of closure plan and associated estimated costs, including an update of the schedule of reserve funds or security to be collected each year until closure, to pay estimated costs of closure, the 25 year post closure period and contingency for remediation; and
any other data relevant to the OC.
W e have divided the above elements into three sections in this report: Municipal Solid Waste Measurement, Operational Plans and Budgets, and Groundwater and Landfill Gas Monitoring.
Golder Associates
February 2003 - 2 - 012-4184 (5200)
As part of this report, information was supplied from the Regional District of Central Okanagan (RDCO) (including solid waste measurement data) and Earth Tech Canada Inc. (Earth Tech) (including previous landfill survey results).
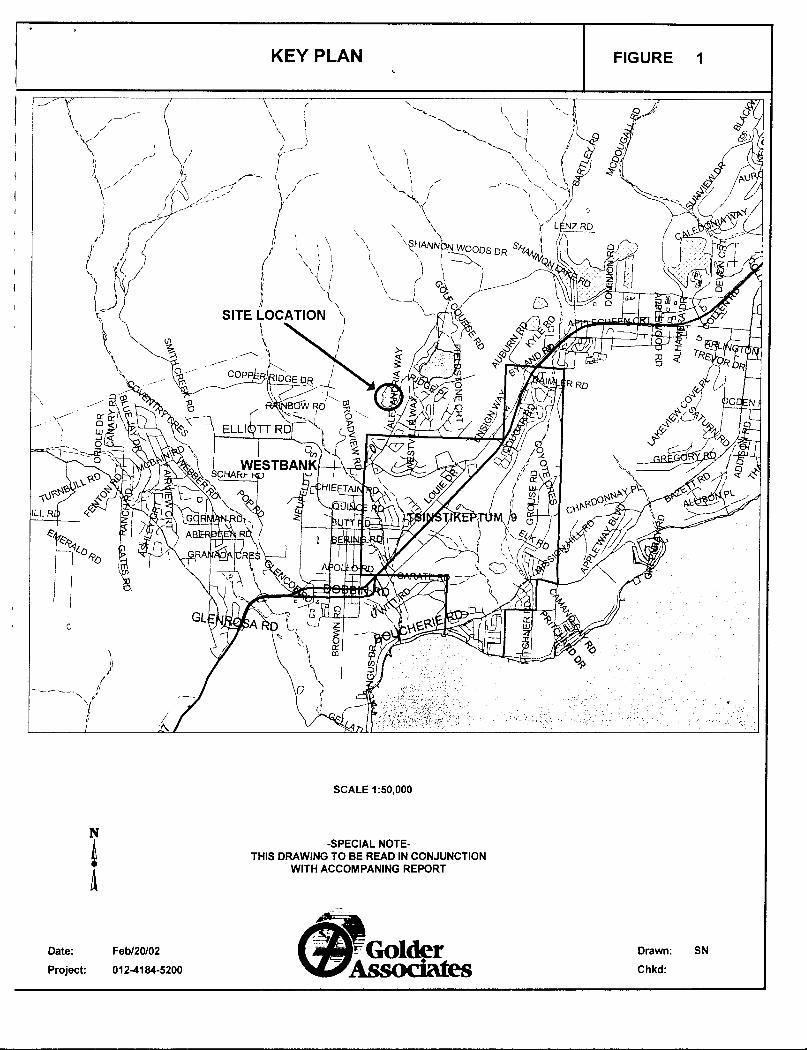
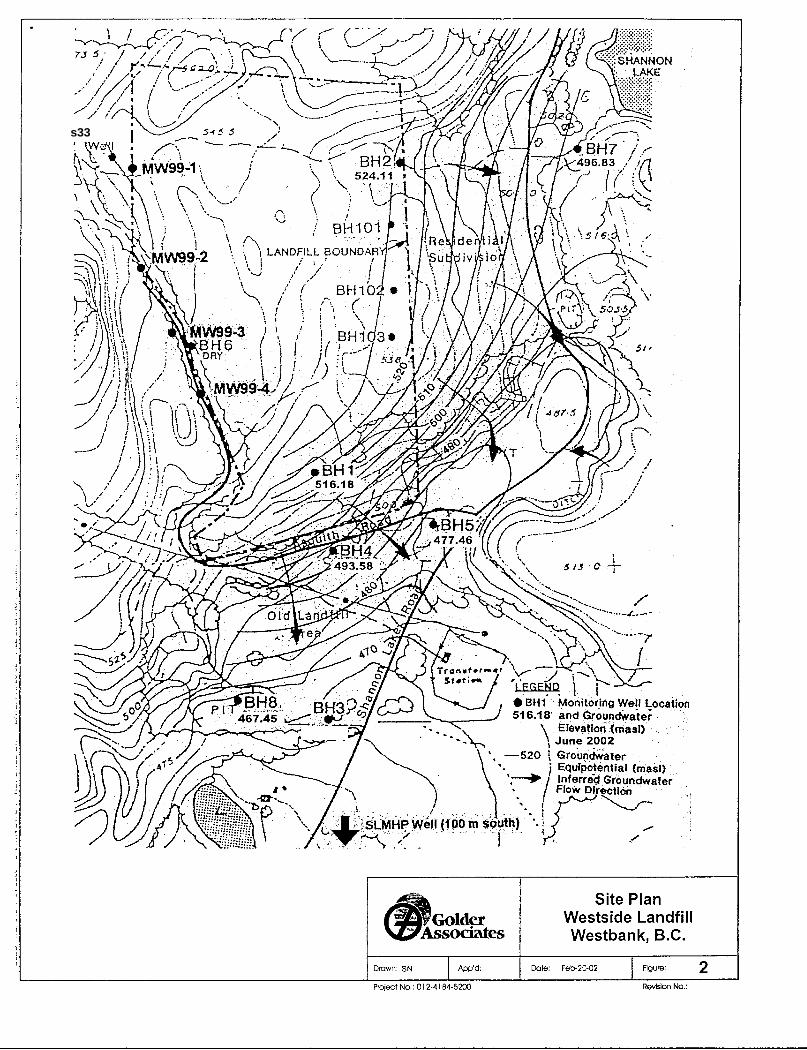
A location plan and site plan for the Westside Landfill are presented as Figures 1 and 2 respectively.
2.0 MUNICIPAL SOLID WASTE MEASUREMENT
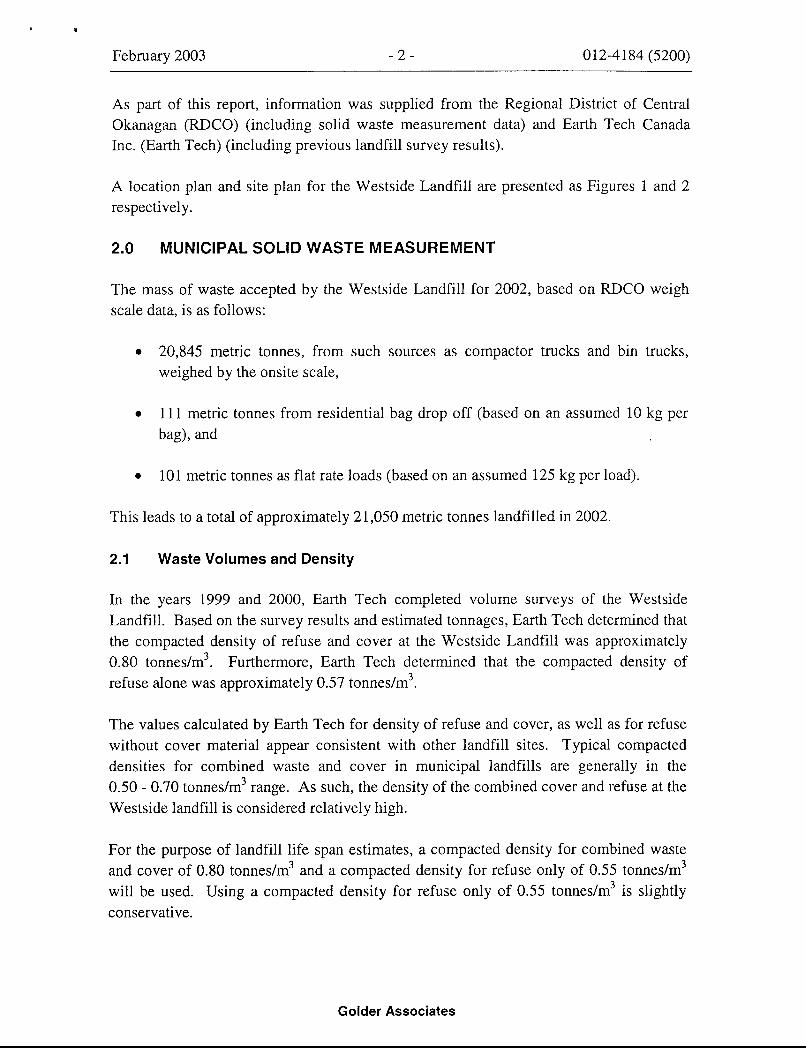
The mass of waste accepted by the Westside Landfill for 2002, based on RDCO weigh scale data, is as follows:
0 20,845 metric tonnes, from such sources as compactor trucks and bin trucks, weighed by the onsite scale,
11 1 metric tonnes from residential bag drop off (based on an assumed 10 kg per bag), and
0 101 metric tonnes as flat rate loads (based on an assumed 125 kg per load).
This leads to a total of approximately 2 1,050 metric tonnes landfilled in 2002.
2.1 Waste Volumes and Density
In the years 1999 and 2000, Earth Tech completed volume surveys of the Westside Landfill. Based on the survey results and estimated tonnages, Earth Tech determined that the compacted density of refuse and cover at the Westside Landfill was approximately 0.80 tonnes/m3. Furthermore, Earth Tech determined that the compacted density of refuse alone was approximately 0.57 tonnes/m3.
The values calculated by Earth Tech for density of refuse and cover, as well as for refuse without cover material appear consistent with other landfill sites. Typical compacted densities for combined waste and cover in municipal landfills are generally in the 0.50 - 0.70 tonnes/m3 range. As such, the density of the combined cover and refuse at the Westside landfill is considered relatively high.
For the purpose of landfill life span estimates, a compacted density for combined waste and cover of 0.80 tonnes/m3 and a compacted density for refuse only of 0.55 tonnes/m3 will be used. Using a compacted density for refuse only of 0.55 tonnes/m3 is slightly conservative.
Golder Associates

February 2003 - 3 - 0 12-4 184 (5200)
A summary of the densities and waste volumes calculated for 2002 are presented in Table 1.
2.2 Service Population and Waste Discharge Rates
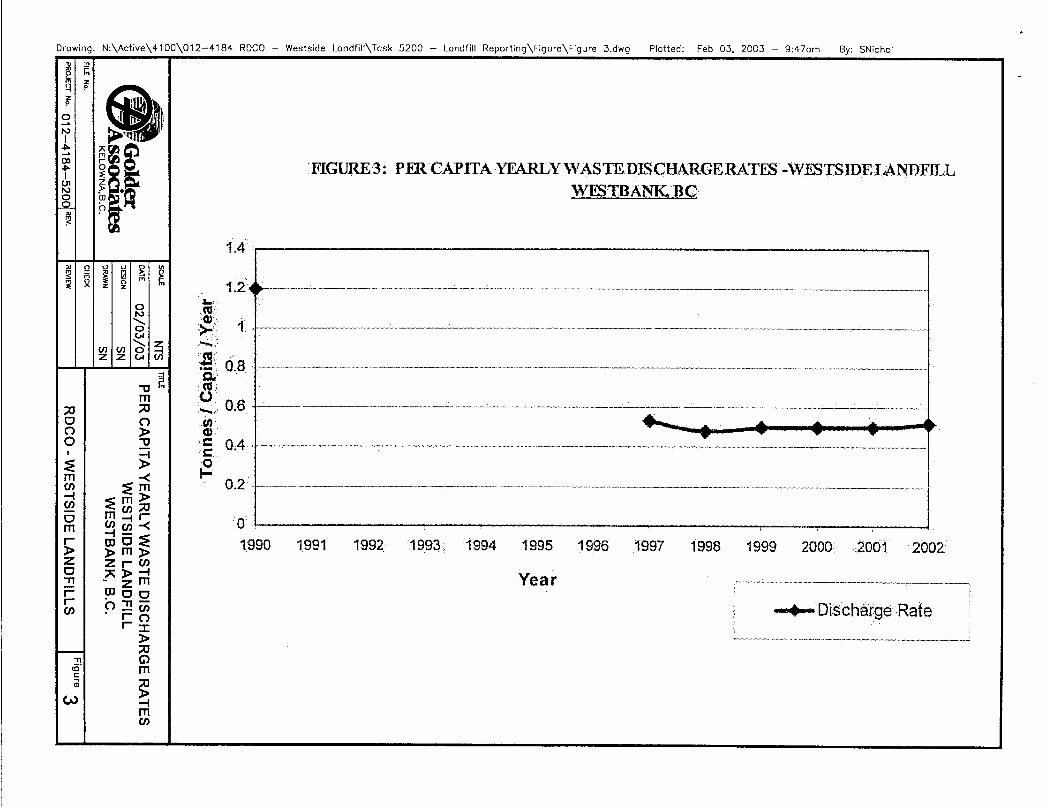
The service population for the Westside Landfill was estimated by the RDCO to be 37,895 persons in 1999. It is expected that the population has increased by 2 percent per year and therefore we estimate that the service population was 40,214 for 2002. The reported mass of refuse accepted by the landfill for 2002 was 21,057 tonnes. Therefore, based on the service population and the estimated tonnage received, the per capita waste discharge rate was 524 kg/person for 2002. This represents a 56 percent reduction from the 1990 baseline rate of 1,200 kg/person per year. The attached Figure 3 shows the generation rates since 1990.
A 50 percent reduction in per-capita waste volumes was required relative to 1990 rates by the end of the year 2000 under the Regional Solid Waste Management Plan. This generation rate requirement continues to be met through 2002.
2.3 Design Volume and Remaining Capacity
A survey completed by Earth Tech staff in July 2000 indicated that approximately 737,400m3 of available volume remained at the landfill. This volume was based on a model completed by Earth Tech, which assumed a 3:l slope for the perimeter of the landfill to an ultimate height of 555 m (geodetic). Earth Tech staff then projected the remaining volume of the landfill at year end 2000, at 713,147 m3.
Golder has approximated the total volume landfilled for 2001 and 2002 in order to determine the remaining capacity of the landfill and estimate the closure date. These calculations were based on the refuse totals provided by the RDCO for the year 2001 and 2002 and are summarized in Table 2.
The estimated lifespan on the Westside landfill has been updated based on 2002 refuse totals and is presented in Table 2. We have assumed a population growth rate of 2 percent, and the waste production rate of 0.505 tonnes per capita per year, which is based on an average of the 1997-2002 data. As discussed, it is assumed that waste is compacted to a density of 0.55 tonnes/m3. Using these assumptions, the Westside Landfill is estimated to reach final capacity in the year 2014. This is consistent with past annual reports.
Golder Associates
,
February 2003 -4- 012-4184 (5200)
3.0 OPERATIONAL PLANS AND BUDGETS
3.1 Operational Plan for 2003
The RDCO will continue to provide operations staff at the landfill. The contract for site work including compaction, heavy equipment operation, and perimeter litter removal is held by Ansell Construction of Kelowna.
The operational plan for 2003 is to continue filling in accordance with the OC.
3.2 Operation and Maintenance Expenditures
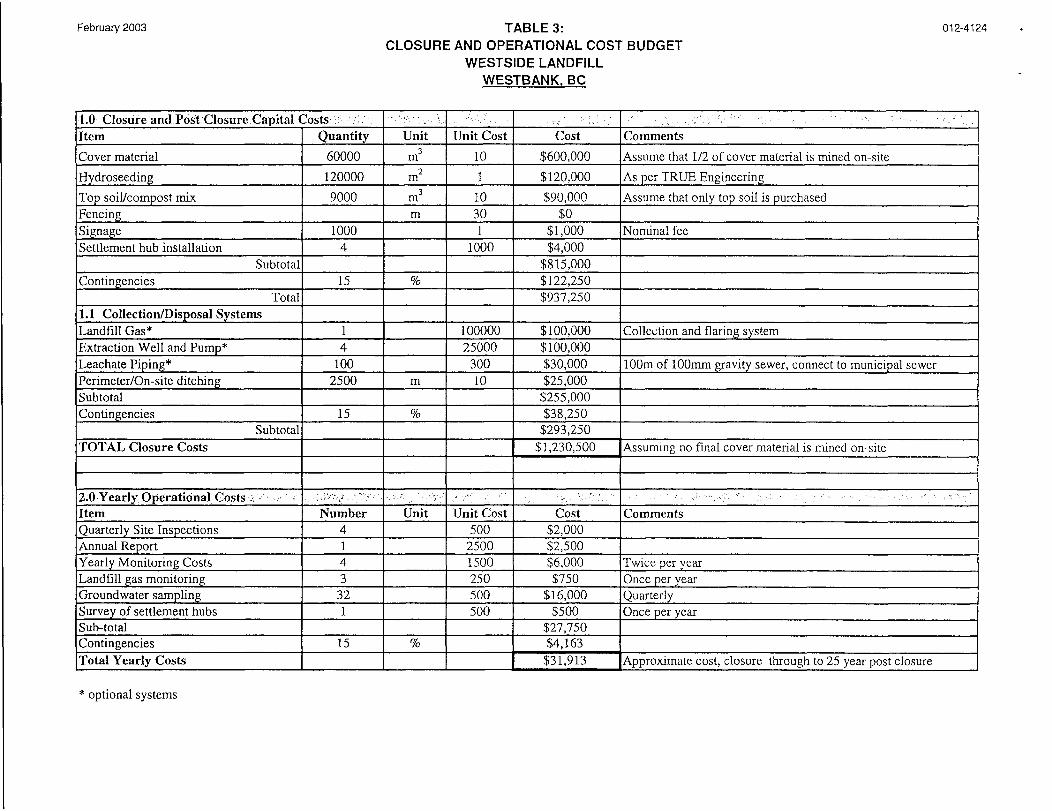
The 2003 operational and maintenance budget for the landfill has not been provided to Golder staff by the RDCO. However, based on calculations completed by Earth Tech in 2000, the annual operational budget for landfill monitoring is approximately $27,600 per year.
3.3 Changes to Reports, Plans and Specifications
No changes to the operation plans have been identified by Mr. Charlie Cameron of the RDCO.
3.4 Review of Closure Plan
The design for the closure plan for the Westside Landfill was completed in September 1997. No changes to the closure plan have been completed at this point.
3.5 Closure Cost Estimate
The closure cost estimate of $1,230,500, as previously estimated by Earth Tech, has not changed since previous annual reports. We note that the cost requirements for landfill gas collection depends on the results of future monitoring of wells in the area of the landfill. The costs outlined are for passive venting. Table 3, outlines the expected closure costs, and is included with this report.
Golder Associates
February 2003 - 5 - 012-4184 (5200)
4.0 GROUNDWATER AND LANDFILL GAS MONITORING
The purpose of the program is to monitor the potential impacts that the landfill may have on the local groundwater quality and the potential for landfill gas migration.
4.1 Permit Requirements
The groundwater monitoring requirements for the Westside Landfill were revised in 200 1 from those stated in the OC (OC No. PR 12217, dated May 28, 1997). The revisions to the permit were outlined in a letter issued on May 3, 2001 by MWLAP. The current groundwater and landfill gas monitoring requirements are presented in Table 4.
4.2 Methodology
Groundwater Monitorinq
The 2002 groundwater monitoring program for the Westside Landfill was carried out by Golder staff. The Well represents background groundwater conditions and monitoring wells BH1, BH2, BH4 and BH5 represent downgradient groundwater conditions. The Shannon Lake Mobile Home Park (SLMHP) well represents a private water well within 1,000 m of the landfill and is further downgradient of the site.
Groundwater samples collected from the wells in the 2002 monitoring program were submitted to Car0 Environmental Services of Kelowna, B.C. for chemical analyses. Collected groundwater samples from BHI, BH2, BH4, BH5 and SLMHP wells were analyzed for several or all of the following inorganic parameters: pH, conductivity, alkalinity, chloride, sulphate, ammonia nitrogen, nitrate nitrogen, phosphorus, and dissolved metals.
At a frequency of once every two years, groundwater samples are also analysed for organic paramaters such as extractable petroleum hydrocarbons, volatile organic compounds as well as acid and base neutral extractables, biological oxygen demand (BOD) and chemical oxygen demand (COD). Analysis for these parameters was not scheduled for 2002 but is scheduled for 2003.
Groundwater analytical results were compared to both aquatic life and drinking water standards and guidelines. The aquatic life standards used are those of the BC Contaminated Sites Regulations (CSR-AW). The drinking water standards and guidelines used are those in both the BC Contaminated Sites Regulations (CSR-DW) and Guidelines for Canadian Drinking Water Quality (GCDWQ).
Golder Associates
s33
s33
February 2003 - 6 - 0 12-4 184 (5200)
Soil Vapour Monitorinq
The 2002 soil vapour monitoring program was conducted by Golder staff at wells MW99-1, MW99-2, MW99-3, MW99-4 and at wells BH1, BH2, BH4, BH5, BHlOl (shallow/deep), BH102 and BH103 on July 18, 2002 and December 18, 2002. Gases were measured with a Gastech gas monitor (Gastech). The instrument contains a mechanical pump which is used to purge the gas monitoring well until maximum concentrations are recorded. Each instrument had been calibrated prior to use at the site to either hexane or methane.
4.3 Groundwater Monitoring Results
Groundwater monitoring results are discussed below with specific subsections for:
i) groundwater elevation data, ii) monitoring results relative to background concentrations, iii) monitoring results relative to historic data (trend analysis), iv) monitoring results relative to drinking water and aquatic life standards and
guidelines, v) monitoring results for SLMHP well.
As noted previously, the Well is considered to represent background groundwater conditions and monitoring wells BH1, BH2, BH4 and BH5 represent downgradient groundwater conditions. In addition, the SLMHP well is present further downgradient of the site.
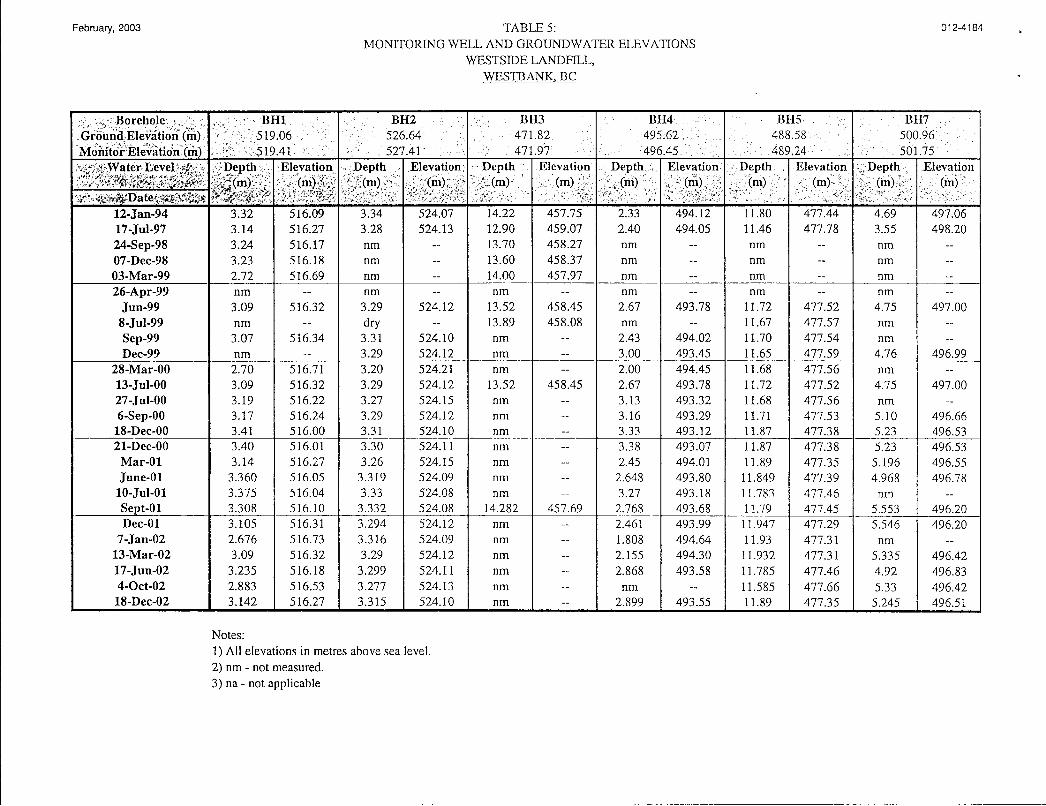
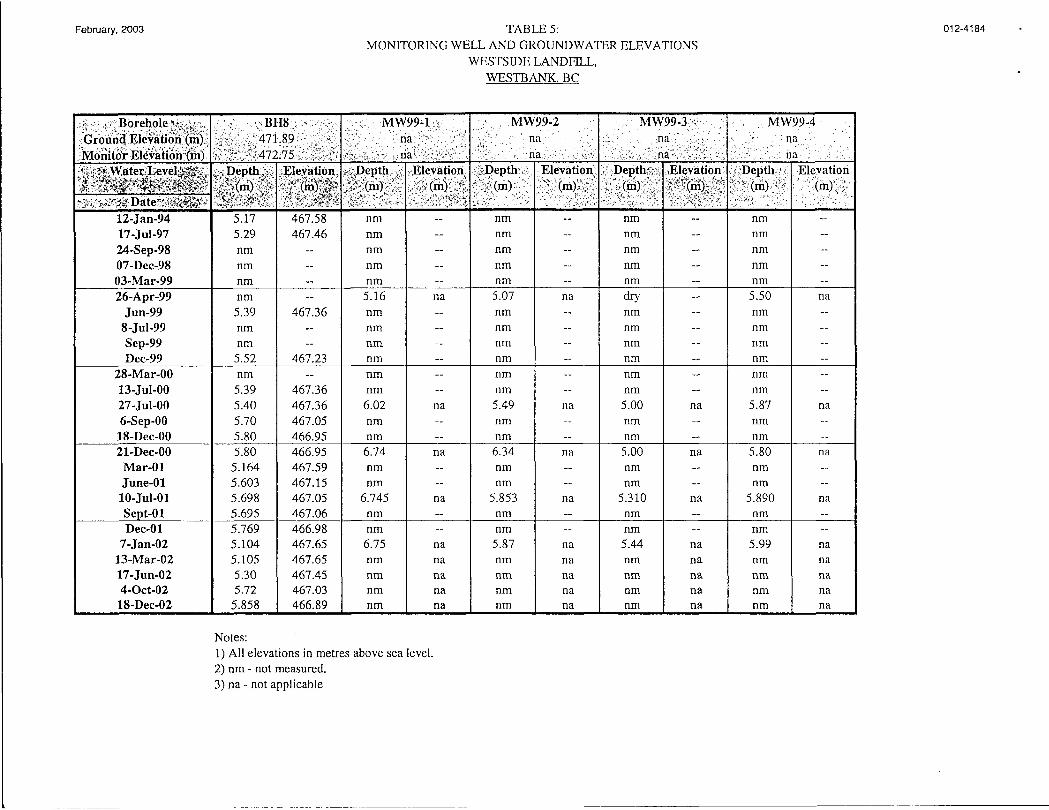
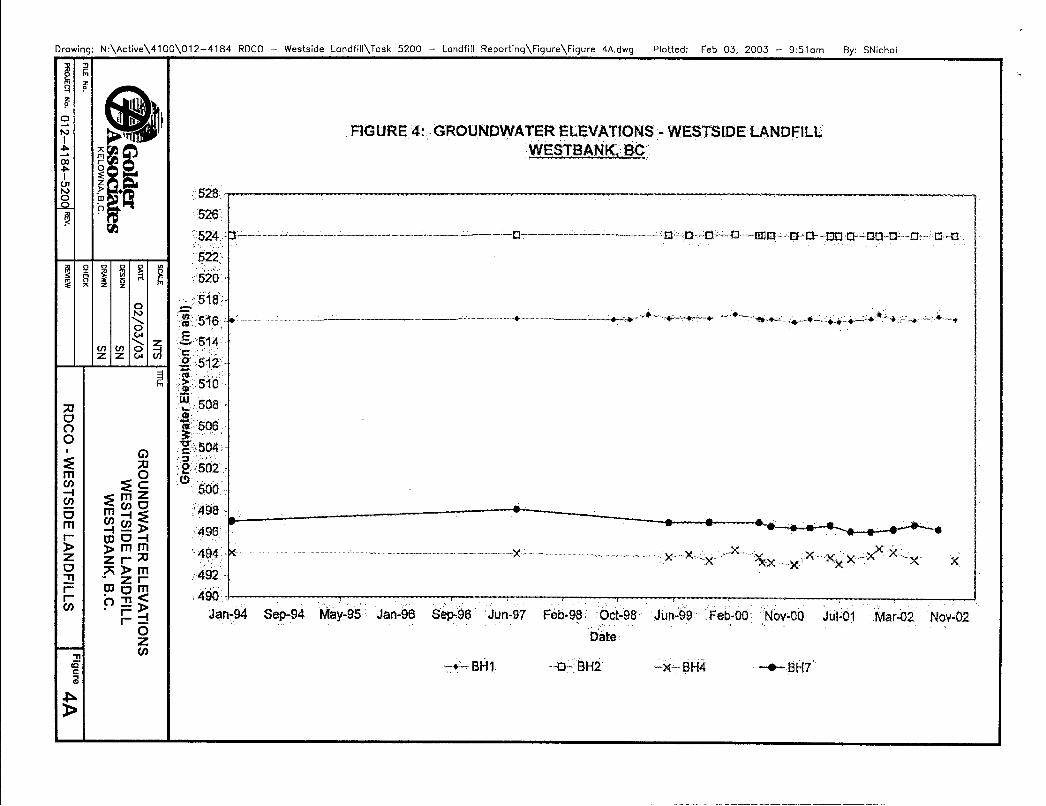
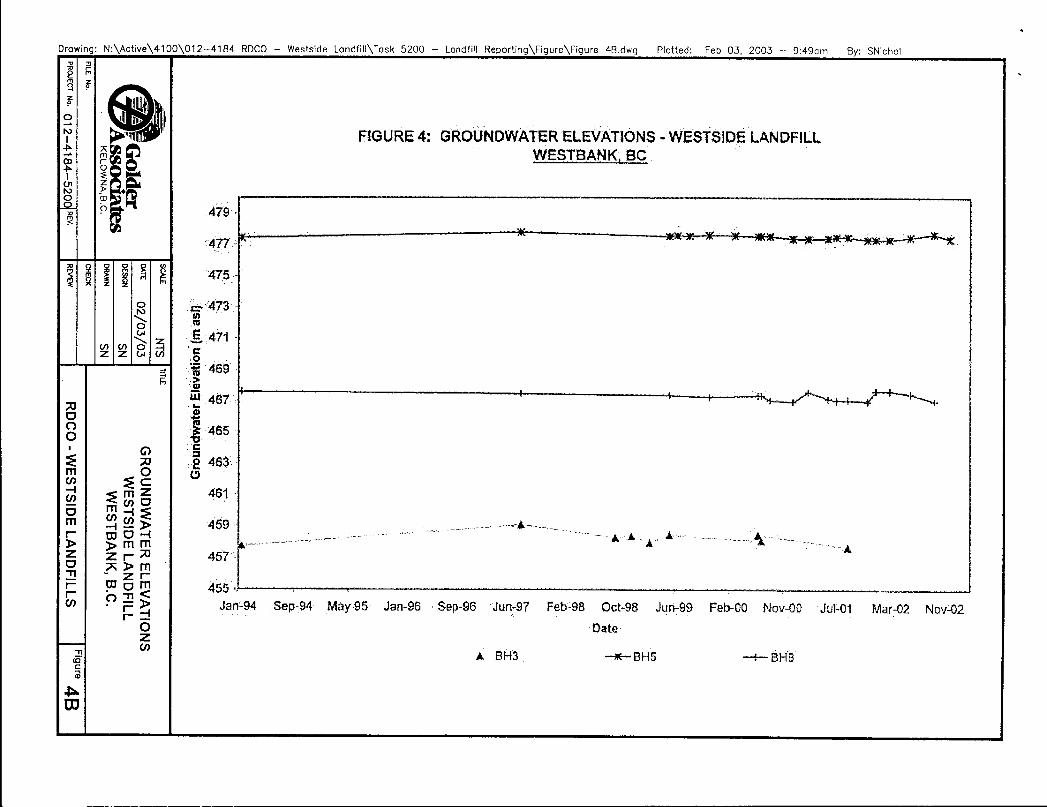
Groundwater Elevation Data
The results of groundwater elevations measured between 1994 and 2002 are presented in Table 5. Historical groundwater elevations are presented in graphical form as Figure 4A and 4B. As shown, groundwater elevations show seasonal fluctuations but are otherwise relatively consistent. During the 2002 monitoring program, water levels were measured in wells BH1, BH2, BH4, BH5, BH7 and BH8. The 2002 groundwater elevation data is generally consistent with previous groundwater elevation data.
Based on the groundwater elevations measured in the 2002 monitoring program and the general topography of the area, it is inferred that groundwater flows in an easterly direction at the northeast portion of the site and in a southerly direction at the southern portion of the site, as shown on Figure 2. This is consistent with previous results.
Golder Associates
s33
February 2003 - 7 - 012-4184 (5200)
Monitoring Results Relative to Background Concentrations
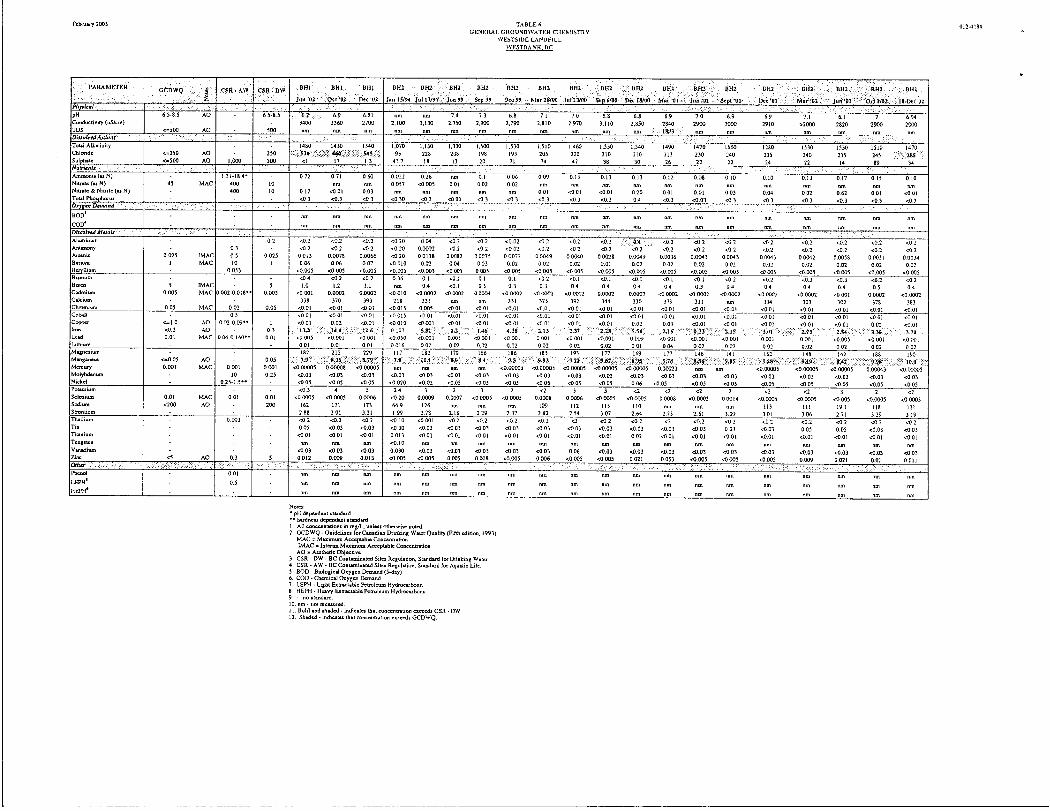
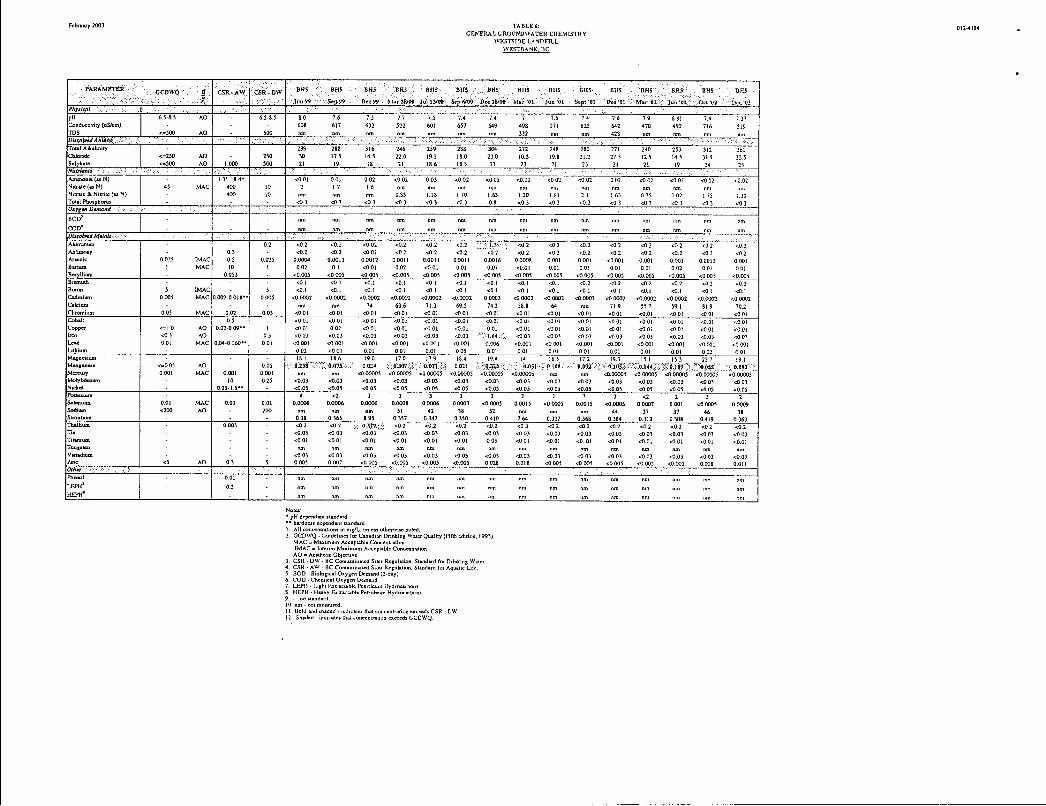
The analytical results for samples collected from 1994 through 2002 are presented in Table 6 (General Groundwater Chemistry).
The chemical data for the background well Well) have been relatively consistent over the seven monitoring events (1994, 1997, 1999, July 2000, September 2000, 2001 and 2002). Concentrations of the indicator parameters are generally very low or below laboratory method detection limits (MDL) at Well.
Similar to previous monitoring results, it appears that the landfill is having an effect on the local groundwater quality. In the monitoring wells presented below, the listed parameters were elevated above background concentrations:
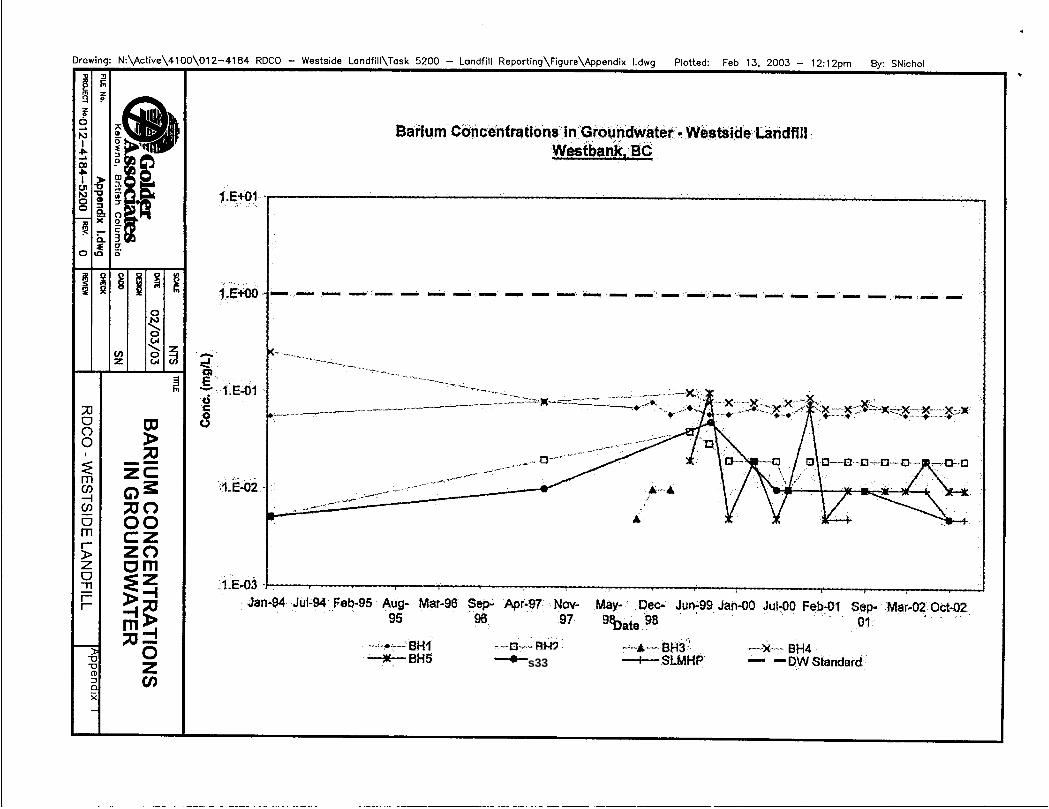
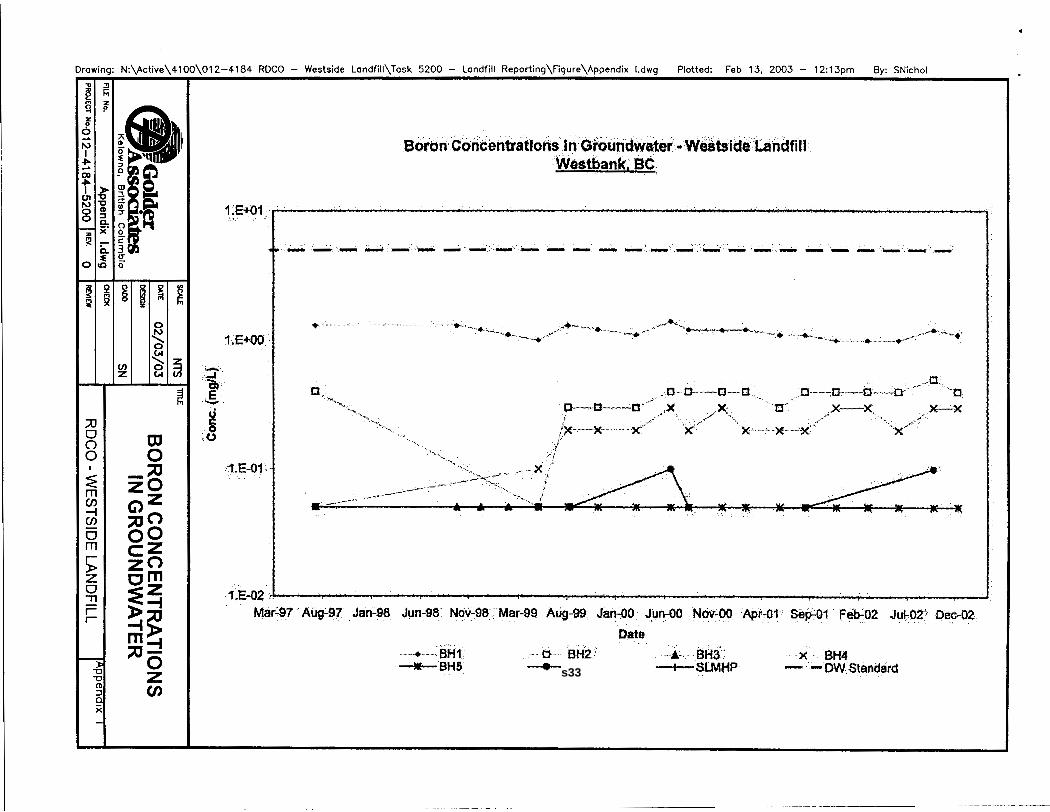
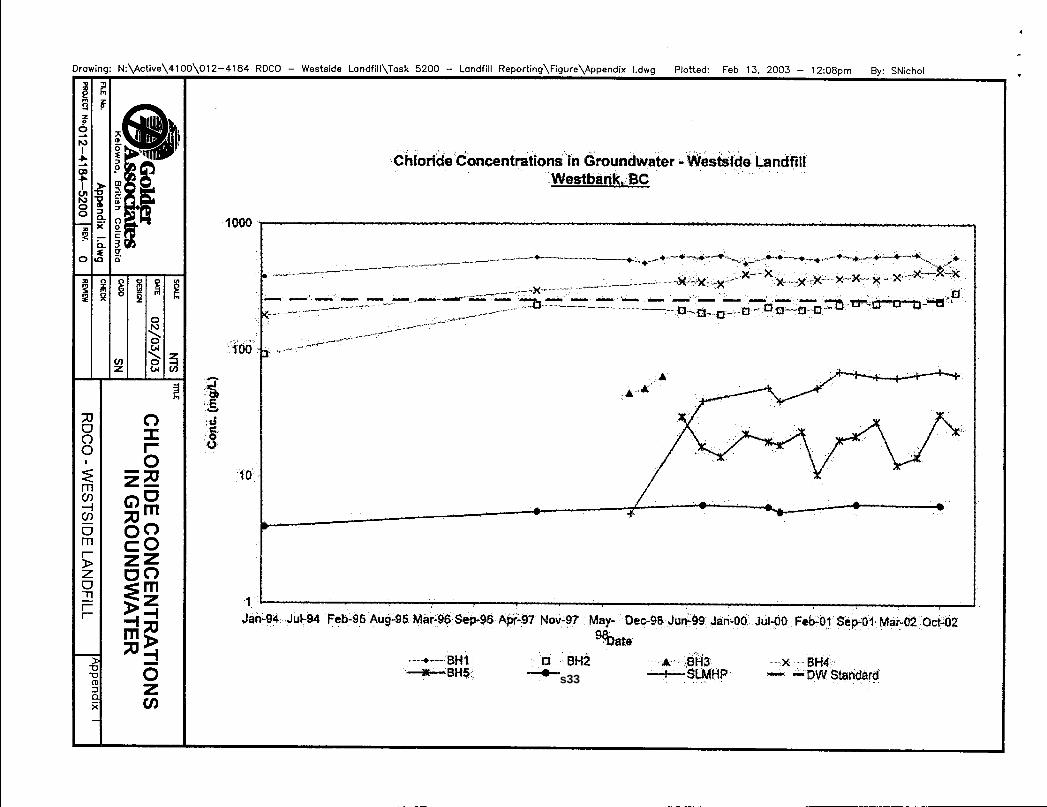
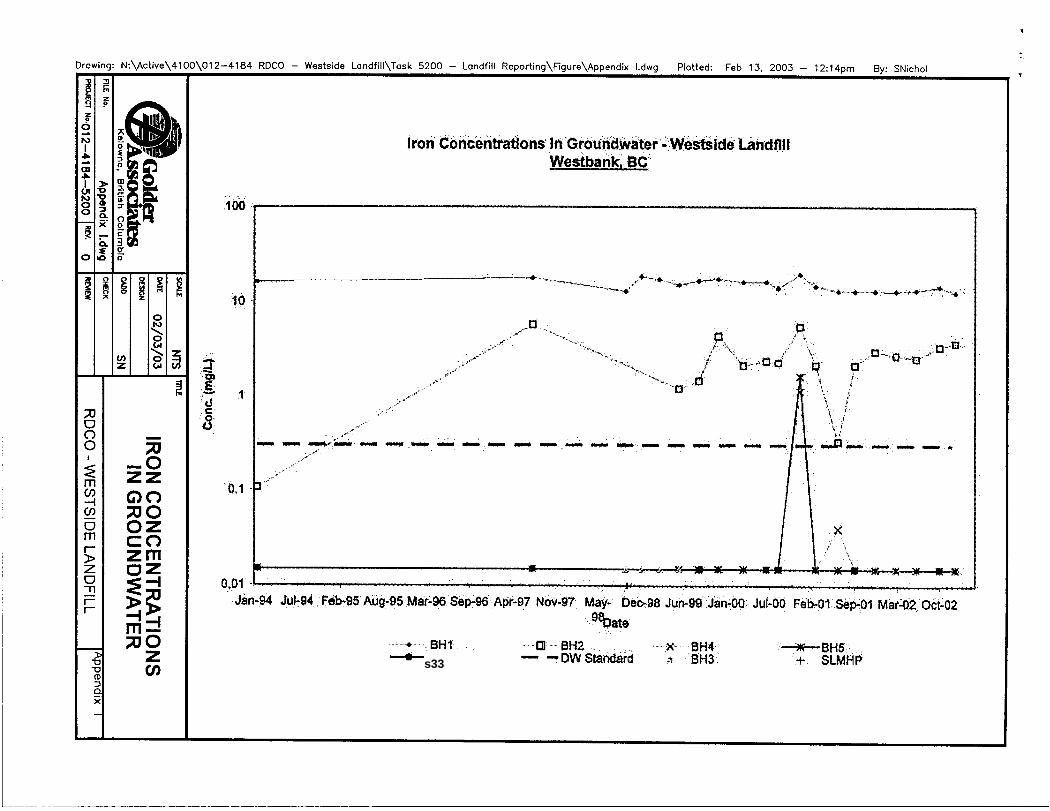
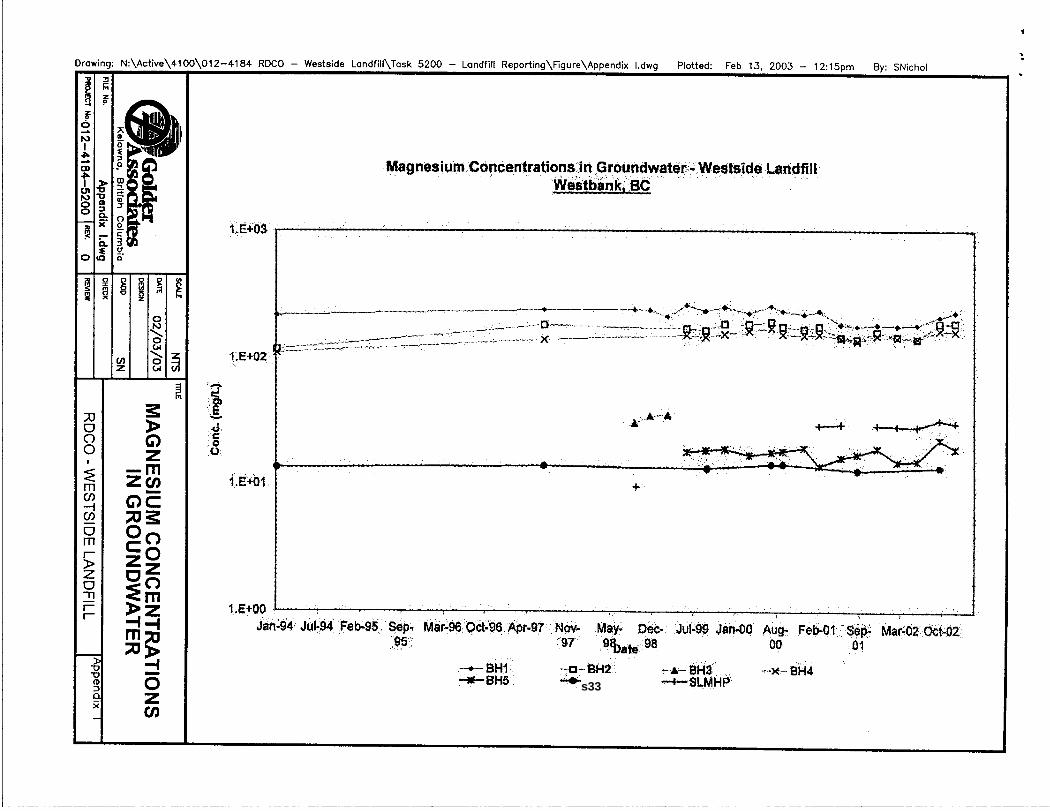
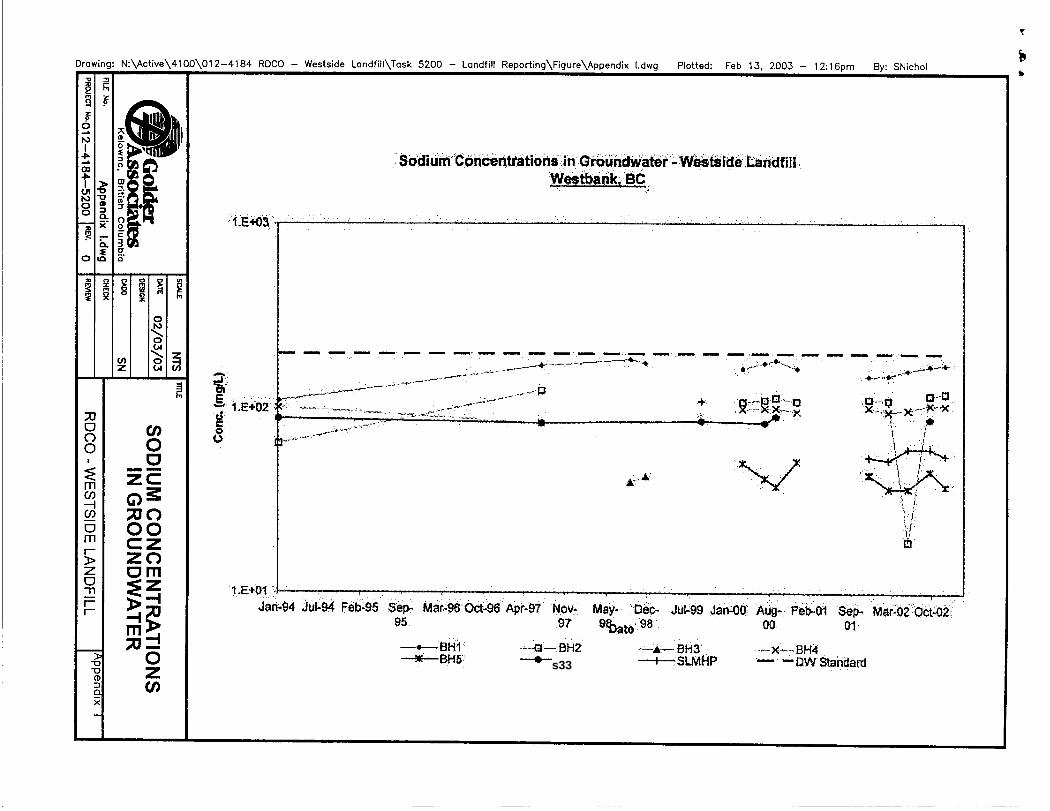
0 BH 1, conductivity, alkalinity, ammonia, arsenic, barium, boron, calcium, chloride, iron, magnesium, manganese, potassium, sodium, and strontium;
0 BH2, conductivity, alkalinity, ammonia, arsenic, barium, boron, calcium, chloride, iron, magnesium, manganese, and strontium;
BH4, conductivity, alkalinity, barium, boron, calcium, chloride, magnesium, manganese, potassium, sodium, and strontium;
0 BH5, calcium, chloride, magnesium, manganese, and potassium;
0 SLMHP, conductivity, alkalinity, arsenic, calcium, chloride, magnesium, and potassium.
Based on the above, groundwater with concentrations elevated the most above background concentrations is found in monitoring wells BH1, BH2 and BH4. Groundwater from monitoring well BH5 and SLMHP exhibits concentrations only slightly to moderately elevated above background concentrations.
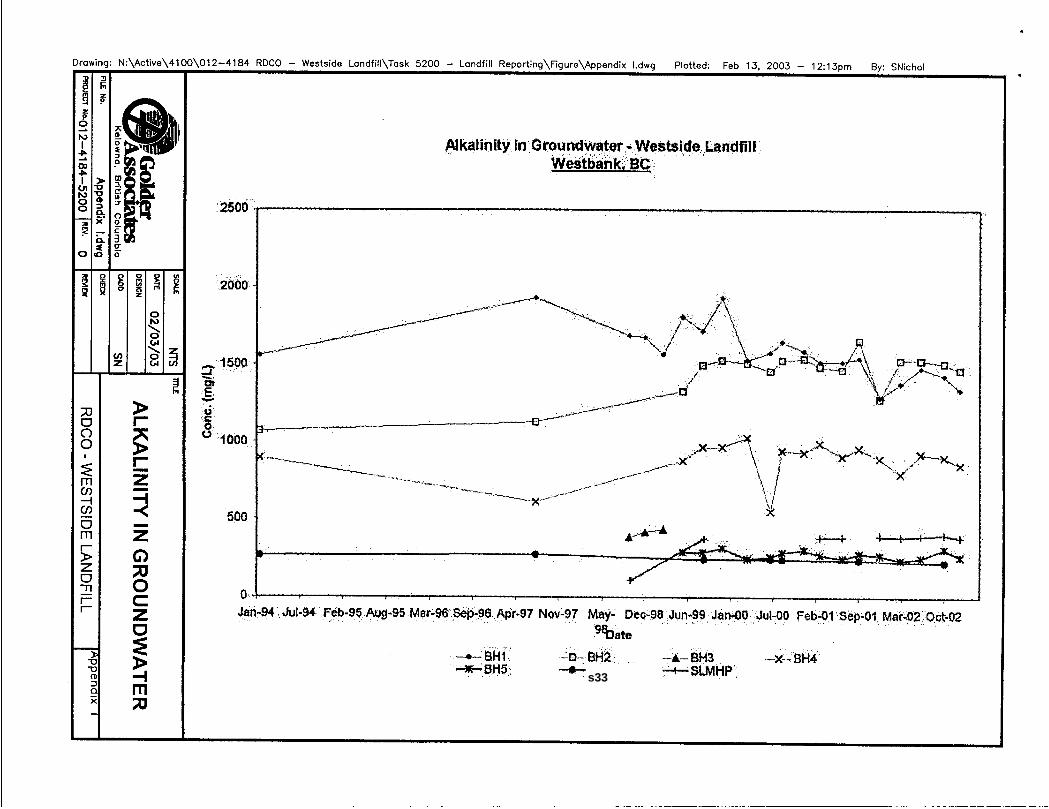
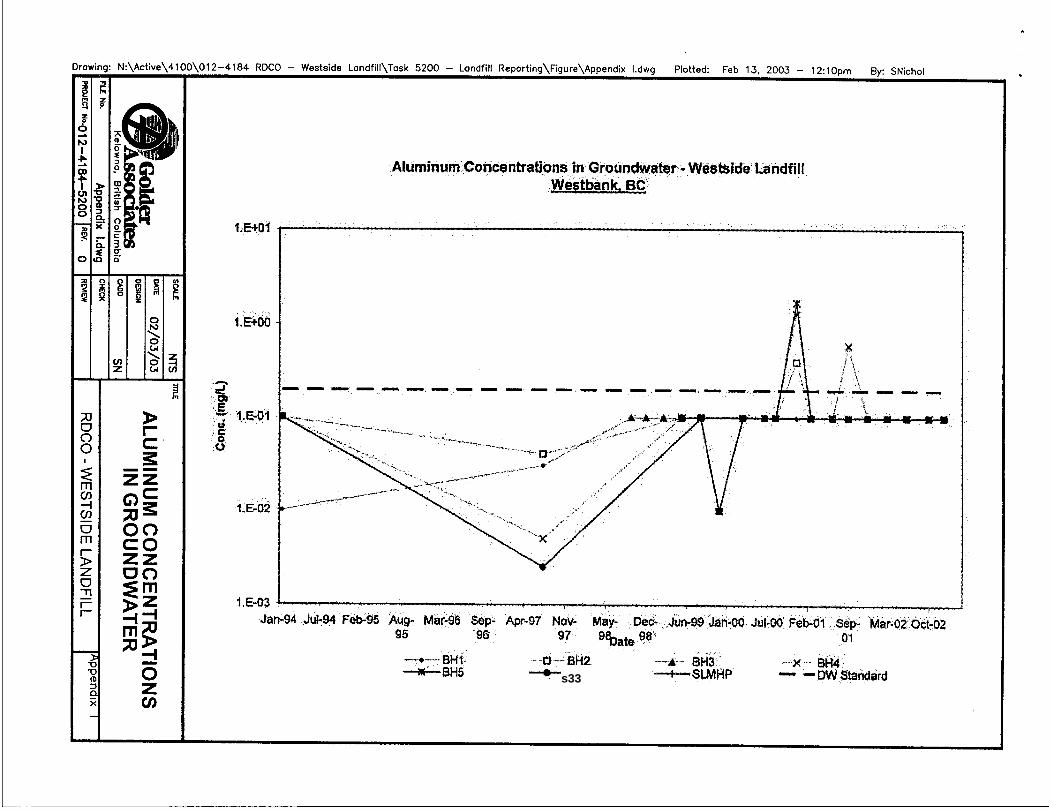
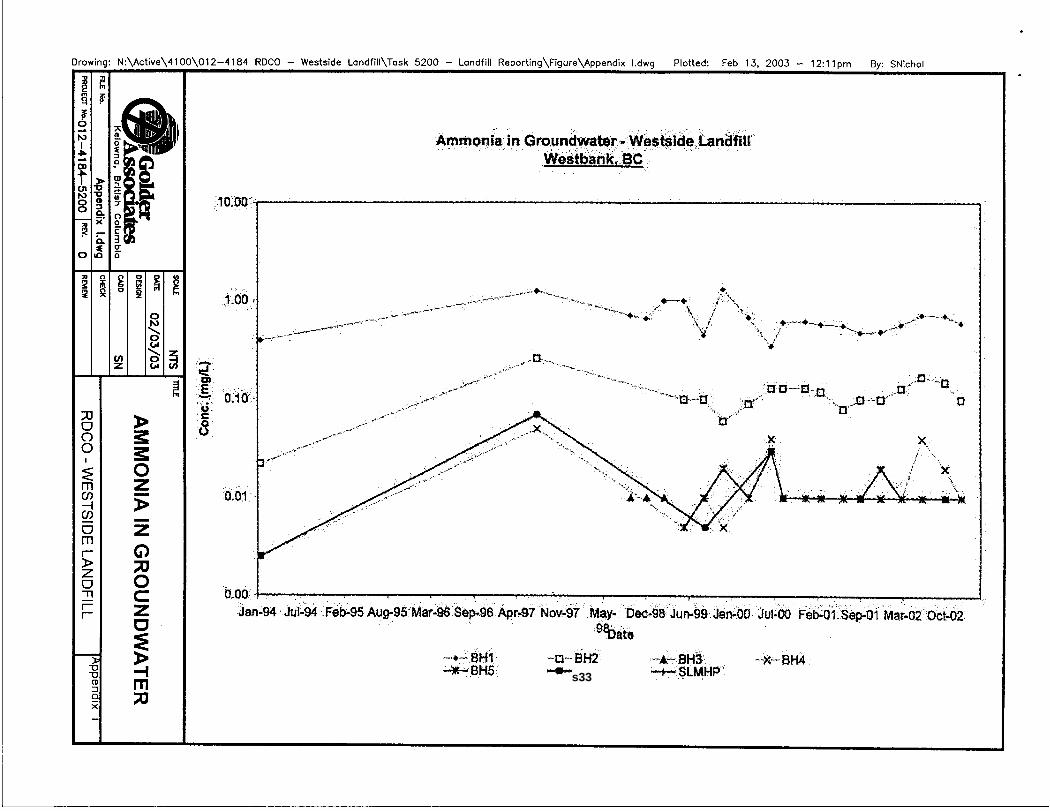
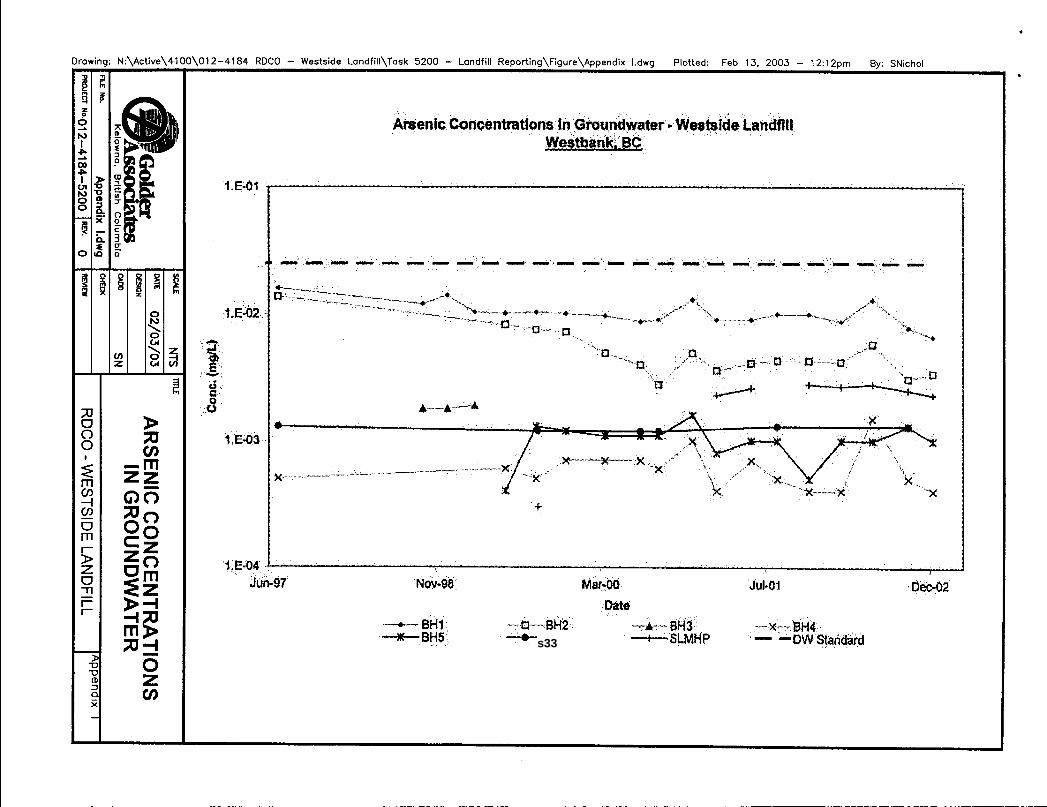
Monitoring results relative to historic data (trend analysis)
For reference purposes, trend analysis graphing is presented in Appendix I. Concentrations of the various analyzed inorganic parameters in groundwater from BHl, BH2 and BH4 all showed marked increases between 1994 and 1997. Since 1998 however, concentrations of most analyzed parameters in groundwater from these three monitoring wells have only shown slight fluctuation and appear to have reached a relatively steady state.
Golder Associates
s33
s33
February 2003 - 8 - 012-4184 (5200)
The concentrations of indicator parameters at BH5 do not show an increase between 1994 and 2001, but rather appear to have been relatively constant (with minor fluctuations) for this time period.
Discussion on trends in concentrations noted in groundwater samples from the SLMHP is presented below.
Monitoring Results Relative to CSR Drinking Water (DW) and Aquatic Life (AW) Standards and Guidelines
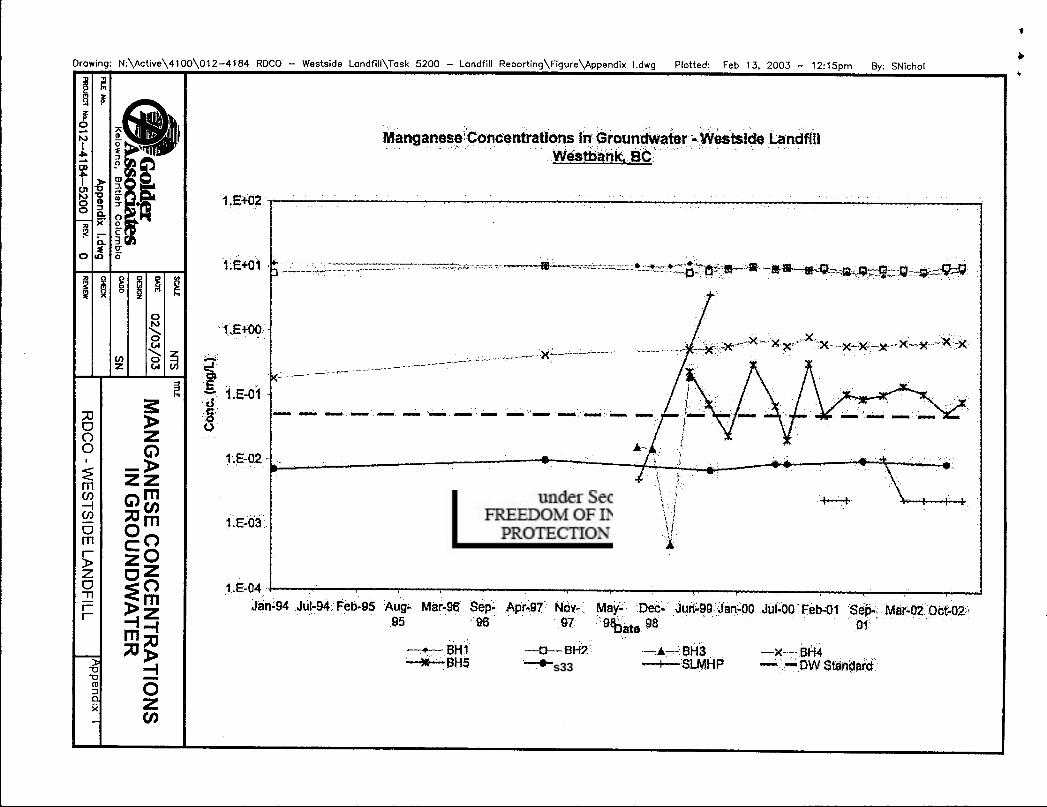
Concentrations of a number of parameters at BH1, BH2, BH4 and BH5 in 2002 exceeded both the CSR-DW and GCDWQ (note: the CSR-DW and GCDWQ for specific parameters are generally identical). No samples exhibited concentrations of analyzed parameters exceeding the CSR-AW Standards. The following list presents the parameters that consistently exceeded the CSR-DW and/or the GCDWQ in the year 2002 at specific monitoring location.
BH1, TDS, chloride, iron, and manganese;
0 BH2, TDS, iron and manganese;
BH4, TDS, chloride and manganese;
BH5, manganese; and
SLMHP,TDS.
We note that the TDS values have been inferred based on conductivity measurements (ie conductivity x 0.667). Furthermore, the standards for chloride, iron and manganese are for aesthetic purposes and are not human health based.
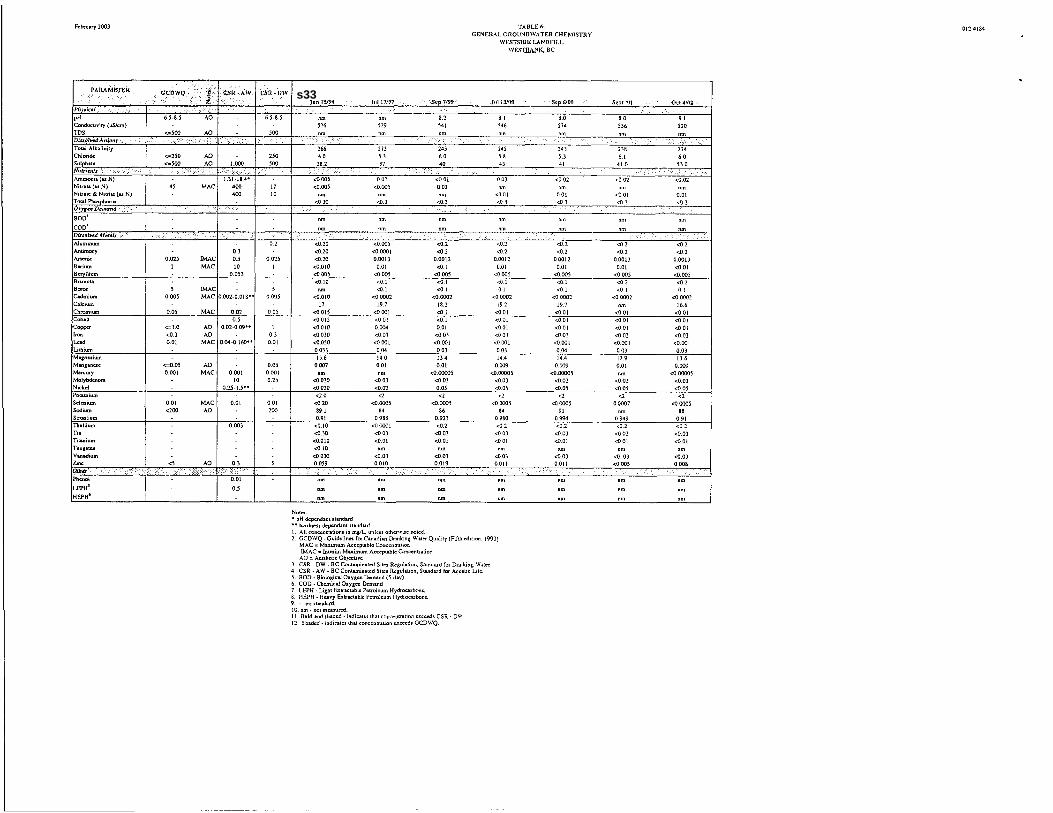
Monitoring Results for SLMHP Well
Golder Associates
Water samples from SLMHP were analyzed primarily for the parameters of chloride and conductivity for the years 1997 through 2000 as per permit requirements. For this time period, only a limited number of samples were also analyzed for parameters such as nutrients, and metals. However, beginning in 2001, water samples from SLMHP were also analyzed for nutrients, select dissolved metals in addition to chloride and conductivity (as per the amended operational permit).
. February 2003 - 9 - 0 12-4 184 (5200)
For SLMHP drinking water, a general increasing trend in concentrations of analyzed parameters has been noted for the period from 1998 to 2000. Specific parameters noted to have increased include conductivity, alkalinity, calcium, chloride, nitrate and nitrite and magnesium. Since the year 2000 however, concentrations of analyzed parameters have generally stabilized or have only increased slightly.
We note, based on the inferred TDS concentration, drinking water from the SLMHP does exceed the GCDWQ.
During one of the four sampling events in 2002, SLMHP well water was also noted to exhibit a low pH value of 6.1. The value was below the range given by the GCDWQ (6.5 - 8.5), but only marginally. All other samples collected from SLMHP well water exhibited a pH value in the range of 7.2 to 7.4 for 2002 and the measured low pH appears to be an anomalous value.
Both chloride and conductivity are potential indicator parameters for leachate, and it is possible that the increasing concentrations of these parameters at the SLMHP well may be related to landfill leachate from the old or existing landfill areas. However, none of the other landfill indicator parameters have shown a similar increase. In addition, nitrate and nitrite concentrations have increased at SLMHP, but are typically low in wells impacted by leachate. The available information is insufficient to conclude whether or not leachate from the Westside landfill has reached the SLMHP.
4.4 Landfill Gas Monitoring Results
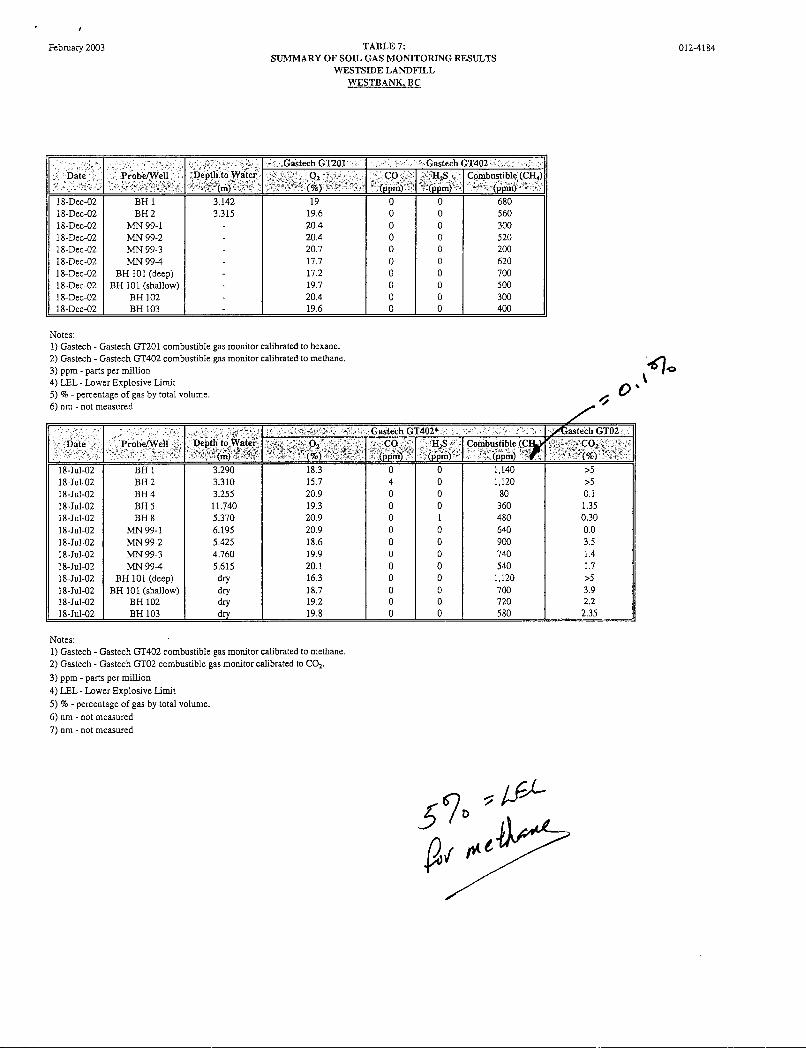
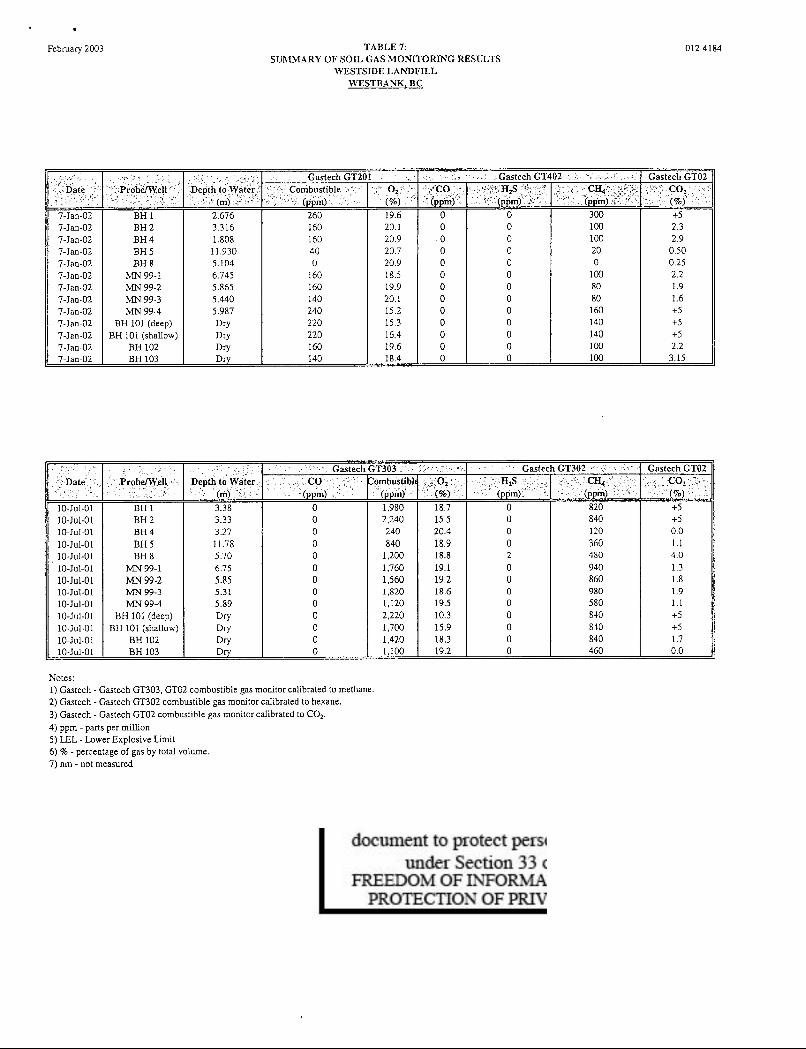
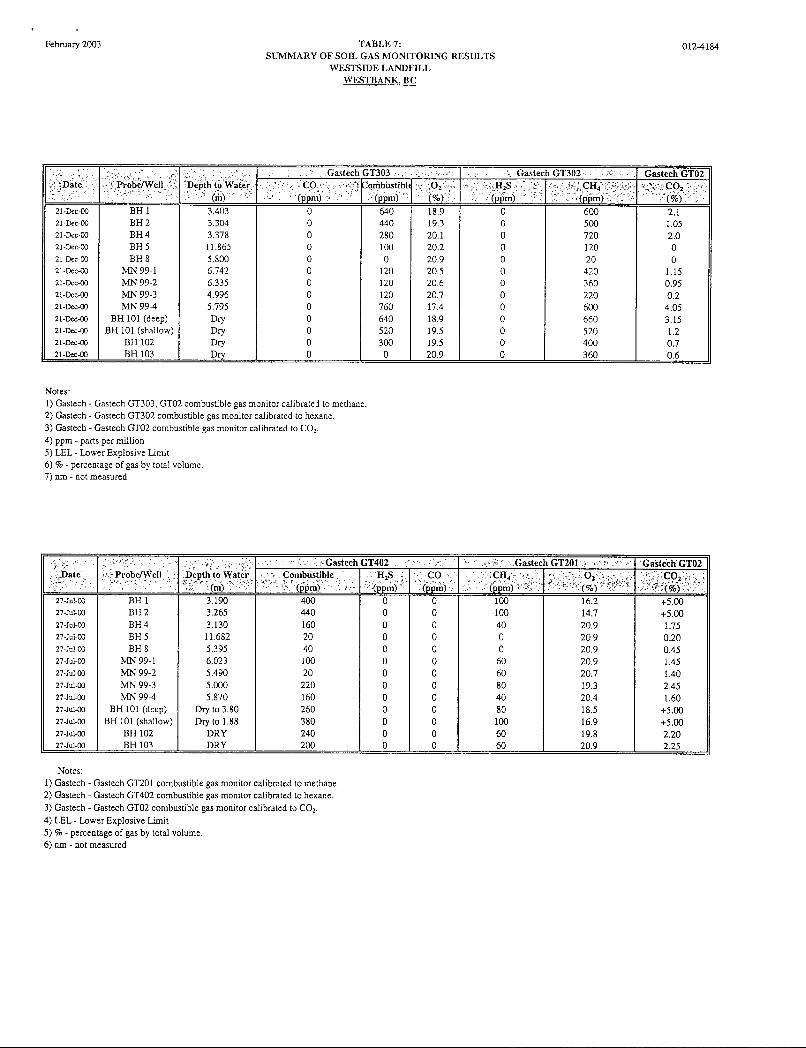
Soil vapour readings were taken on July 18, 2002, in monitoring wells MW99-1 through MW99-4, BHl, BH2, BH4, BH5, BH8, BHlOl (shallow and deep), BH102 and BH103. Soil vapour readings were also taken on December 18, 2002 in monitoring wells MW99-1 through MW99-4, BH1, BH2 and BHlOl (shallow and deep). Soil vapour readings are summarized in Table 7.
Combustible Gas (methane) - Methane concentrations were highest in July 2002 (compared to December 2002) and ranged from 900 to 1,140 ppm (or 1.8 to 2.3 percent of the lower explosive limit (LEL)) of combustible gas were detected at BH1, BH2, BH 99-2 and BH 101 (deep) using the Gastech instrument during the July 2002 monitoring event. Readings at the other locations during the July monitoring event ranged from 80 to 740 ppm, or 0.2 to 1.5 percent LEL (concentrations of less than 80 ppm are considered to be representative of background conditions for this instrument). Readings during the December 2002 monitoring event ranged from 200 to 680 ppm, or 0.4 to 1.4 percent LEL.
Golder Associates
February 2003 - 1 0 - 012-4184 (5200)
Oxy= - Oxygen concentrations were close to atmospheric levels in most wells and ranged from 16.3 to 20.9% in all wells for both 2002 sampling events (atmospheric concentration of oxygen is 20.9%). The lower concentrations of oxygen were generally noted in boreholes located in close proximity to and downgradient of the landfill, such as BHl, BH2 and BH101.
Carbon Dioxide - Elevated concentrations (> S percent) of C02 were detected at BHl, BH2 and BH 101 (deep) during the July 2002, sampling event. These are the same wells noted above which showed relatively low oxygen concentrations.
Carbon dioxide concentrations in December of 2002 were not monitored as the proper instrument was not available for the sampling event.
Hydrogen Sulphide - Concentrations of H2S in all but one monitoring well were 0 ppm for both the July and December sampling events. The only sample that showed a detectable concentration of H2S (1 ppm) was collected from BH8 during the July sampling event.
4.5 Discussion of Groundwater and Landfill Gas Monitoring
Based on the results of the 2002 monitoring program, the following statements can be made regarding the ongoing groundwater and landfill gas monitoring program at the Westside Landfill:
During the 2002 sampling period, wells BH1, BH2, BH4 and BHS (downgradient of the landfill) all showed elevated concentrations of several parameters relative to Well (background). Parameters which were elevated above background conditions included conductivity, alkalinity, chloride, ammonia, arsenic, barium, boron, calcium, iron, magnesium, manganese, potassium, sodium and strontium.
Concentrations at BH1, located within the landfill, were the most elevated above background conditions, followed by BH4, BH2, BHS and Shannon Lake Mobile Home Park (SLMHP), respectively.
In general, the concentrations of indicator parameters in downgradient wells have remained relatively constant during 2002.
Golder Associates
s33

February 2003 - 11 - 012-4184 (5200)
0 There were a number of parameters during the 2002 monitoring program which had concentrations that exceed the BC Contaminated Sites Regulation - Drinking Water Standards (CSR-DW), Aquatic Life Standards (CSR-AW) as well as Guidelines for Canadian Drinking Water Quality (CGDWQ) on various occasions. Specifically, the exceedances in 2002 were:
TDS (based on conductivity) at BHI, BH2, BH4 and SLMHP (exceeded
Chloride at BHI and BH4 (exceeded both CSR-DW and GCDWQ), Iron at BH1, BH2 (exceeded both CSR-DW and GCDWQ), Manganese at BH1, BH2, BH4, and BH5 (exceeded both CSR-DW and GCDWQ), and pH at BH1, BH4 and SLMHP (exceeded GCDWQ).
CGDWQ),
Concentrations of several parameters have increased in the SLMHP well since the first round of monitoring in 1998. However, it appears that concentrations of these indicator parameters leveled off in 2001 and 2002. This includes conductivity, alkalinity, calcium, chloride and magnesium. Based on the inferred TDS concentration, SLMHP well water exceeds the GCDWQ for TDS. Furthermore, SLMHP well water exhibited a low pH for one of the four 2002 sampling events that was not within the GCDWQ. While several of the elevated parameters are similar to those in monitors closer to the landfill, there is insufficient information to conclude whether the impacts are related to the landfill or not.
Combustible gas measurements were slightly elevated in BHI, BH2 and BHlOl (shallow and deep). Decreased concentrations of oxygen and elevated concentrations of carbon dioxide at BH1, BH2, MN 99-1, MN 99-2, MN 99-3, MN 99-4, BHlOl (deep and shallow), BH102 and BH 103 were also suggestive of biodegradation of waste. While combustible gas concentration appear to be similar to or slighlty higher than in previous monitoring, the combustible gas results are not considered a health or safety concern.
5.0 RECOMMENDATIONS
Based on the groundwater monitoring results to date, Golder recommends that the currently prescribed monitoring program be continued with some modification. The currently prescribed monitoring program is stated in Section 3.0 of this report. We suggest that the required groundwater elevation monitoring for BH6 and well be eliminated. BH6 has not been located in the field for several years, and Well can not be accessed due to the installed pump works. In addition, we r that water from SLMPH be analysed for TDS so that values will not need to be inferred from the conductivity results.
Golder Associates
s33

February 2003 - 1 2 - 012-4184 (5200)
Based on the concentrations of chloride, conductivity and inferred TDS at the SLMHP well, we recommend that the SLMHP be supplied with municipal water (Lakeview Irrigation District).
Based on the relatively low methane gas concentrations measured during the landfill gas monitoring to date, a landfill gas collection system is not considered warranted at this time. We recommend that the current landfill gas monitoring program be continued.
Based on the limited nature of the groundwater exceedances and that the exceedances are generally confined to areas near the landfill, a leachate collection system is not considered warranted at this time.
As a landfill volume survey for the landfill has not been completed since July 2000, Golder recommends that a volume survey be completed for the landfill in 2003.
6.0 LIMITATIONS AND USE OF REPORT
This report was prepared for the exclusive use of Regional District of the Central Okanagan. Any use which a third party makes of this report, or any reliance on or decisions to be made based on it are the responsibility of such third parties. Golder accepts no responsibility for damages, if any, suffered by any third party as a result of decisions made or actions taken based on this report.
The report, which includes all appendices and attachments, is based on data and information collected during the investigation conducted by Golder Associates Ltd.’s personnel. It provides a level of assurance commensurate with the level of study. The report is based solely on the site conditions at the time of the site investigation conducted in 2002, as described in this report.
In evaluating the site, Golder has relied in good faith on information provided by the individuals and agencies noted in this report. We accept no responsibility for any deficiency, misstatements or inaccuracies contained in this report as a result of omissions, misinterpretations of fraudulent acts of the persons or agencies interviewed.
The assessment of environmental conditions and possible hazards at this site has been made using the results of chemical analysis of discrete groundwater samples from a limited number of locations. The site conditions between sampling locations have been inferred based on conditions observed at borehole, monitoring well and test pit locations. Subsurface conditions may vary from these sample locations. Additional study, including further subsurface investigation, can reduce the inherent uncertainties associated with this type of study.
Golder Associates
February 2003 - 13 - 012-4184 (5200)
However, it is never possible, even with exhaustive sampling and testing, to dismiss the possibility that part of a site may be contaminated and remain undetected.
This investigation was performed according to current professional standards and practices in the environmental field. If new information is discovered during future work, including excavations, borings or other activities or studies, Golder should be requested to reevaluate the conclusions of this report, and to provide amendments as required.
7.0 CLOSURE
We trust that this report provides you with the information that you require at this time. Should you require additional information or have any questions, please feel free to contact the undersigned at your earliest convenience.
GOLDER ASSOCIATES LTD.
M&k D. Newman-Bennett, G.I.T. Hydrogeologist
W. Scott Orth, M.Sc., P.Geo. Associate, Office Manager
MDNB/WS O/j mf N:\/\ct~vr\~100\012-4i8~ RIXO - WcsLsidc bndIill\TTaJk 5200 - Landfill Rcponing\Drah\ZOOZ repon\rpl-I 113-2002 Annual Monitoring Rcpon.doc
Golder Associates
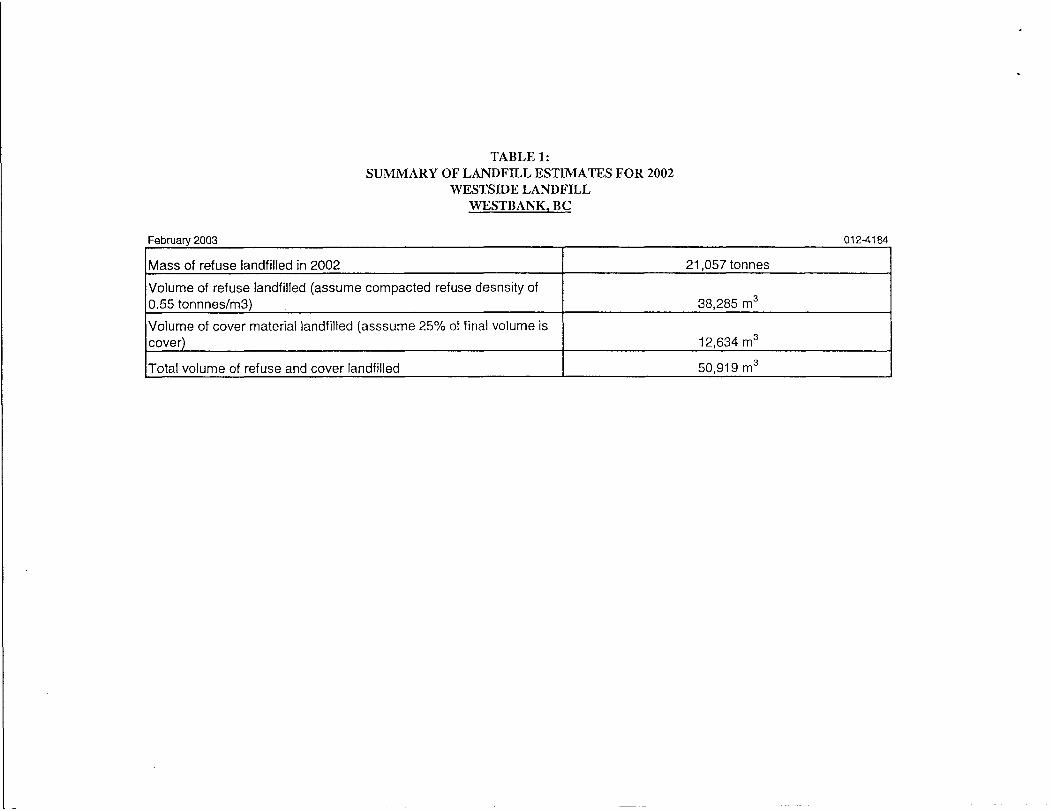
TABLE 1: SUMMARY OF LANDFILL ESTIMATES FOR 2002
WESTSIDE LANDFILL WESTBANK, BC
Mass of refuse landfilled in 2002
Volume of refuse landfilled (assume compacted refuse desnsity of 0.55 ton n n es/m 3)
Volume of cover material landfilled (asssume 25% of final volume is cover)
Total volume of refuse and cover landfilled
21,057 tonnes
38,285 m3
12,634 m3
50,919 m3
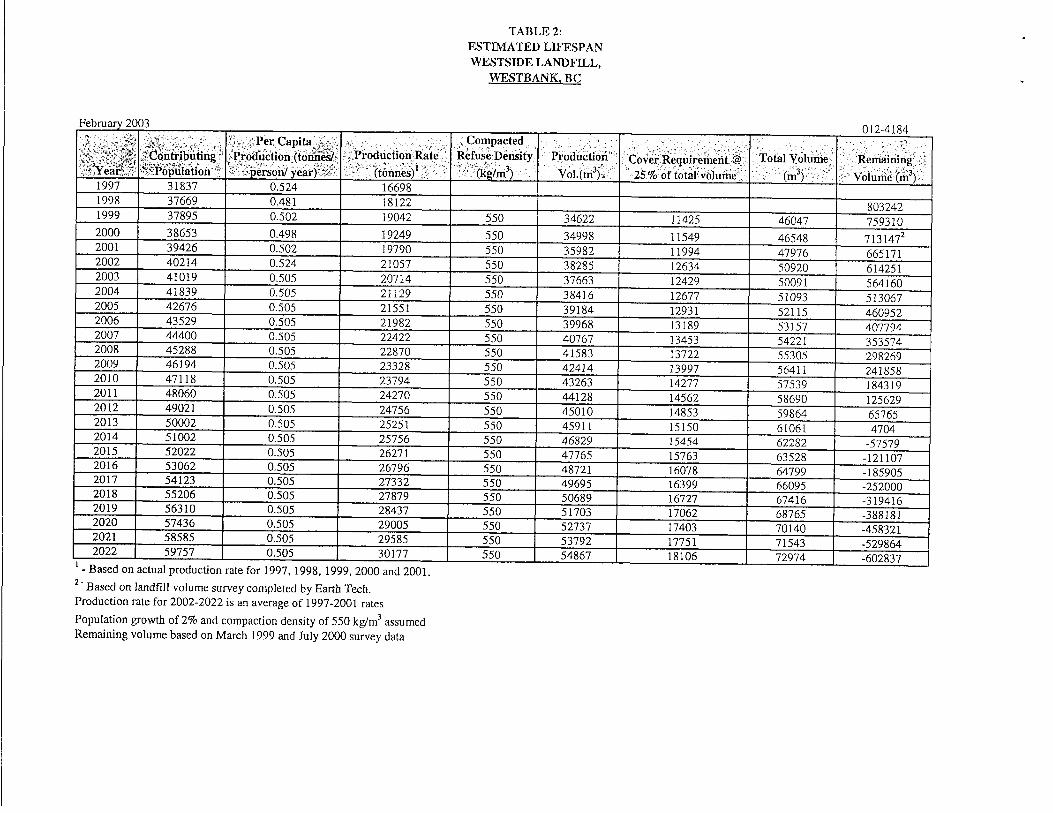
TABLE 2: ESTIMATED LIF’ESPAN WESTSIDE LANDFILL,
WESTBANK, BC
Februarv 2003 ,..̂ ,.-.
Based on landfill volume survey completed by Earth Tech. Production rate for 2002-2022 is an average of 1997-2001 rates Population growth of 2% and compaction density of 550 kg/m3 assumed Remaining volume based on March 1999 and July 2000 survey data
2 -
February 2003
Subtotal Contingencies
Subtotal
TABLE 3: CLOSURE AND OPERATIONAL COST BUDGET
W ESTSI DE LAND FILL WESTBANK, BC
$255,000 15 % $38,250
$293,250
012-4124
Survey of settlement hubs Sub-total Contingencies Total Yearly Costs
1 500 $500 Once per year $27,750
15 % $4,163 $3 1,913 Approxlmate cost, closure through to 25 year post closure
I I I 1
ITOTAL Closure Costs I I I 1 $1,230,500 1Assuming no final cover material is mined on-site
* optional systems

TABLE 4: SUMMARY OF GROUNDWATER MONITORING REQUIREMENTS
WESTSIDE LANDFILL WESTBANK, BC
Measurement of groundwater elevations
February 2003 01 2-41 8 L
BH1, BH2, BH4, BH5, BH6, BH7, BH8 and Quarterly SLMHP
Measurement of groundwater elevations Yearly Analysis of groundwater samples for Group 1 parameters Quarterly Analysis of groundwater samples for Group 1 parameters Yearly
Analysis of groundwater samples for conductivity and chloride Yearly
Analysis of groundwater for Group 2 parameters
Conduct landfill gas monitoring program for Group 3 parameters Semi-annual
Every 2 years (2003, 2005 etc.)
BH3
BH1, BH2, BH4, BHS, and SLMHP
stic well, besides SLMHP, being used for drinking water within 1,000m of landfill
BH1, and BH4
All monitoring wells in area of landfill
Group 1 Parameters: pH, conductivity, total alkalinity, chloride, sulphate, ammonia nitrogen, nitrate nitrogen, aluminum, antimony, arsenic, barium, beryllium, bismuth, cadmium, calcium, chromium, cobalt, copper, iron, lead, lithium, magnesium, manganese, molybdenum, nickel, phosphorus, potassium, selenium, strontium, thallium, tin, titanium, tungsten, vanadium and zinc.
Group 2 Parameters: total dissolved solids (TDS), boron, light hydrocarbons, extractable petroleum hydrocarbons, volatile organic compounds and acid and baseheutral extractables, Biological Oxygen Demand (BOD), Chemical Oxygen Demand (COD).
Group 3 Parameters: methane, hydrogen sulphide gas, carbon dioxide and oxygen.
s33
s33
February, 2003 I
12-Jan-94
24-Sep-98 07-Dec-98 03-Mar-99 26-A pr-99
Jun-99
Sep-99 Dec-99
28-Mar-00
17-Jul-97
8-Jul-99
13-JuI-00 27-Jul-00 6-Sep-00 18-Dec-00 21-Dec-00 Mar-01 June-01
Sept-01 Dec-01
7-Jan-02 13-Mar-02 17-Jun-02
18-Dec-02
10-Jul-01
4-Oct-02
- 3.32 516.09 3.14 3.24 3.23 2.72 nrn 3.09 nrn 3.07 nm 2.70 3.09 3.19 3.17 3.41 3.40 3.14
3.360 3.375 3.308 3.105 2.676 3.09 3.235 2.883 3.142
5 16.27 516.17 516.18 516.69
516.32
5 16.34
516.71 516.32 5 16.22 516.24 516.00 516.01 516.27 5 16.05 5 16.04 516.10 516.31 5 16.73 5 16.32 516.18 516.53 5 16.27
_ _
_ _
_ _
TABLE 5: MONITORING WELL AND GROUNDWATER ELEVATIONS
WESTSIDE LANDFILL, WESTBANK, BC
UH3
Deptl I. (m) '1 - 14.2: 12.9( 13.7( 13.6( 14.0( nrn
13.5: 13.8' nm nrn nm
13.5: nrn nrn nm nrn n m nrn nm
14.28 nrn n m nrn n m nrn nrn -
32 37 Elevation
(m);: ^ ^
457.75 459.07 458.27 458.37 457.97
458.45 458.08
_ _
_ _ -- _ _
458.45 _ _ _ _ _ _
BH5 495.62 BH4 1 488.58 45
Depth , (m)
' * , 1 ,
2.33 2.40 nrn nrn nrn n m 2.67 nm 2.43 3.00 2.00 2.67 3.13 3.16 3.33 3.38 2.45
2.648 3.27 2.768 2.461 1.808 2.155 2.868 nm
2.899
_ _ 493.78
494.02 _ _
11.72 11.67 11.70
-_
477.52 477.57 477.54
493.45 I 11.65 I 477.59 494.45 I 11.68 I 477.56 493.78 11.72 477.52 493.32 11.68 477.56 493.29 11.71 477.53 493.12 11.87 477.38 493.07 11.87 477.38 494.01 11.89 477.35 493.80 11.849 477.39 493.18 11.783 477.46 493.68 11.79 477.45 493.99 11.947 477.29 494.64 11.93 477.31 494.30 11.932 477.3 1 493.58 11.785 477.46
11.585 477.66 493.55 11.89 477.35
--
01 2-4184
BH7 500.96
3.55 498.20 nrn n m
_ _ _ _
nrn -- nm --
4.75 497.00 nrn
4.76 496.99
4.75 497.00
5.10 496.66 5.23 496.53 5.23 496.53 5.196 496.55 4.968 496.78
_ _ n m -_
nrn -_
nm -_
_ _ nm 5.553 496.20
496.83 496.42
Notes: 1) All elevations in metres above sea level. 2) nrn - not measured. 3) na - not applicable
February, 2003 012-4164 TABLE 5: MONITORING WELL AND GROUNDWATER ELEVATIONS
WESTSIDE LANDFILL, WESTBANK, BC
MW99-3 -b MW99-4 na
th Elevatio
- - 5.17 5.29 nm nm nm
12-Jan-94
24-Sep-98 07-Dee-98 03-Mar-99 26-Apr-99
Jun-99
17-Jul-97
8-Jul-99 Sep-99 Dee-99
28-Mar-00 13-Jul-00 27-Jul-00 6-Sep-00 18-Dee-00
Mar-01 June-01
Sept-01 Dec-01
7-Jan-02 13-Mar-02 17-Jun-02
18-Dec-02
21-Dee-00
10-Jul-01
4-Oct-02
467.58 467.46
_- _ _ --
nm nm nm nm nm 5.07 nm nm nm nrn nm nm 5.49 nrn nm 6.34 nrn nm
5.853 nm
nm nm nm nm nm 5.16 nm nrn nm nm nm nm 6.02 nm nm 6.74 nm nm
6.745 nm
nm nm nm nm nm 5.50 nm nm nm nm nm nm 5.87 nm nm 5.80
nm 5.890 nm
nm
nm 5.39 nm nm 5.52 nm 5.39 5.40 5.70 5.80 5.80 5.164 5.603 5.698 5.695 5.769 5.104 5.105 5.30 5.72 5.858
-- 467.36
-- _ _
467.23
467.36 467.36 467.05 466.95 466.95 467.59 467.15 467.05 467.06 466.98 467.65 467.65 467.45 467.03 466.89
_ _
5.00 nrn
nm -- nm --
5.310 na nm --
nm 6.75 nm nm nm nm
_ _ na na na na na -
nm 5.87 nm nm nm nm
_ _ na na na na na
nm 5.99 nm nm nm nm
_- nm 5.44 na nrn na nm na nm na
na
-_ na na na na na
Notes: 1) All elevations in metres above sea level. 2) nm - not measured. 3) na - not applicable
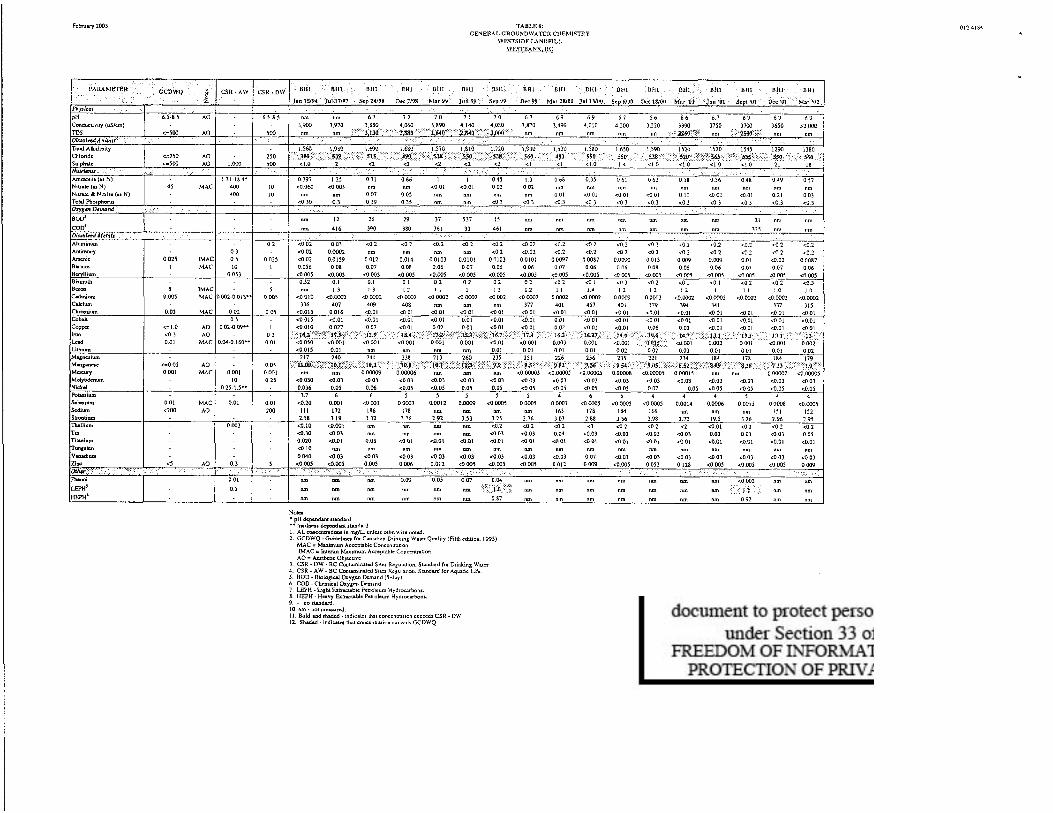
TABLE6: GWERAL CROUNDWATI37 CHEMI.STRY
WESTSIDE LANDFILL I V E T B A N K . IIC
5 0 W5
0 os
1 0 3 0 01
0 05 0 WI 0 2s
F e h y lW3
MAC OW2-0018*. OW5
0 0 5 MAC 0 0 2 005 0 5
-1.0 A 0 002.009.. d 3 A 0 0 1 0 0 1 MAC 004-0160** 0 0 1
0 1 2 0 7 1 O M )
0 1 1 d o 1 003 d J 3 d 3 d l
"" ""8
"m "m "m
"m "m "m
m 2 < 0 2 < 0 2 d 2 4 1 4 1 0013 OW18 00066 006 006 0 0 7
<OW5 d W 5 <OW5 <04 4 2 '02 I O I 1 1 1
<OW1 o m o o m 118 370 193
mol 4 0 1 d o 1
4 0 1 002 <001 <001 <no1 <OOI
001 001 0 0 1 I 8
douW5 OOw08 dwW1 d 0 1 4 0 3 d 0 3
161 111 I73 2 8 8 3 0 1 121 401 4 1 '02 003 4 0 3 4 0 3 4 0 1 4 . 0 1 4 0 1
TABLE6. GENl<RAL CIOUND\VATER Cl lEhl lMRY
~ V W S I D E U N U F I L L \VISTllANK, IIC
"m "m m "m "m 0057 d W 5 001 002 0 02 rim nm m WII nm nm nm
nm nnl nm nm nm 001 d o 1 <001 0 2 0 001 001 003 Ow 002 061 0 Dl 'OOI
' 0 2 '02 <o I c 0 2 0 00138 00082 OW75 00072 00049 O O f f l O O w 2 8 O w 4 9 00036 00041 00043 00043 O W 2 OOOS8 0 M ) l i 00034
<OOIO o m O M 003 002 om om 001 0 0 2 om om om 002 0 0 2 001 0 0 2 002 mw5 'OW5 <OW5 OW5 <om5 'OW3 COW5 d W 5 d W 5 mw5 <oms <OW5 <OW5 <OW5 d W 5 mw5 <OW5 0 3 6 0 1 '01 0 1 01 4 2 r O 1 t O I < O l cO1 C U I ' 0 2 ~ 0 2 4 3 dl <02 '02
< O O N < o m 2 dm ooool dw0i < o w 0 2 <ow02 o m 00007 <ow02 cow02 mw02 <ow02 <ow02 mwi 0 0 ~ 2 04 0 4 0 5 0 4
303 302 378 I 8 3 d o 1 5 OW1 d o 1 d l 0 1 cool <001 4 0 1 '001 4 0 1 c o o l 4 0 1 coo1 cOOl <001 d o 1 4 0 1 <OD1
0 4
3%
nm 04 '01 0 3 03 0 3 04 0 4 04 0 4 4 3 0 4
218 331 m nm 131 375 392 344 330 319 311 mn
003 d o 3 4 0 3 d o l 4 0 3 4 0 3 < 4020 d m d o 5 4 0 5 4 0 3 COO5 cOO5 405 006 ~0 OS d o 5 4 OS d o 5 4 0 3 4 0 5 4 0 ) d o 5
0 3 2 0 O w 0 9 O O w 7 4 w 0 S < O w 0 5 OOW8 OOW6 d w O 5 d w 0 5 OOW8 d w O 5 00014 < O w 0 3 cow05 m W 5 d 0 M ) S mm5 M P 126 mL" nm 109 112 115 110 nm nm nm 111 I l l 191 118 121 159 278 2 1 8 2,9 2 3 7 2 8 1 2S4 307 2 M 2 7 1 261 3 0 9 301 306 271 3?9 119
c030 4 0 1 -3303 4 0 3 cool <003 4 0 3 d 0 3 4 0 3 '003 d o l 001 d o 3 005 005 4 8 1 4 0 3
d l 0 am nm nm n m om nm nm am nm nm nm 0030 4 0 3 4 0 3 4 0 3 4 0 1 d 0 3 006 d o 3 4 0 3 <DO1 COO3 d o 3 d03 d o l 4 0 3 4 0 3 4 0 3
2 4 1 2 3 2 Q 1 3 ~ < 2 a 2 2 <I 3 2 2
4 1 0 cowl 4 1 <01 < 0 2 < O l Q dl <01 <1 '02 4 2 4 2 d l 2 4 2 c o 2 4 2
0013 4 0 1 401 e001 coo1 4 0 1 mol d o l 0 0 2 4 0 1 0101 4 0 1 <001 4 0 1 d o l d o l mol "I" m nm nm "m
"In ""1 N" ""1 "I"
"m nm "m m "m
"m "m "m "rn "m
nm om nm n m nm nm om m om nm om om
nm nm nm nm nm nm nm nm m nm m nm
nm nm nrn nm nrn nm nm nm nm nm nm nm
0124181
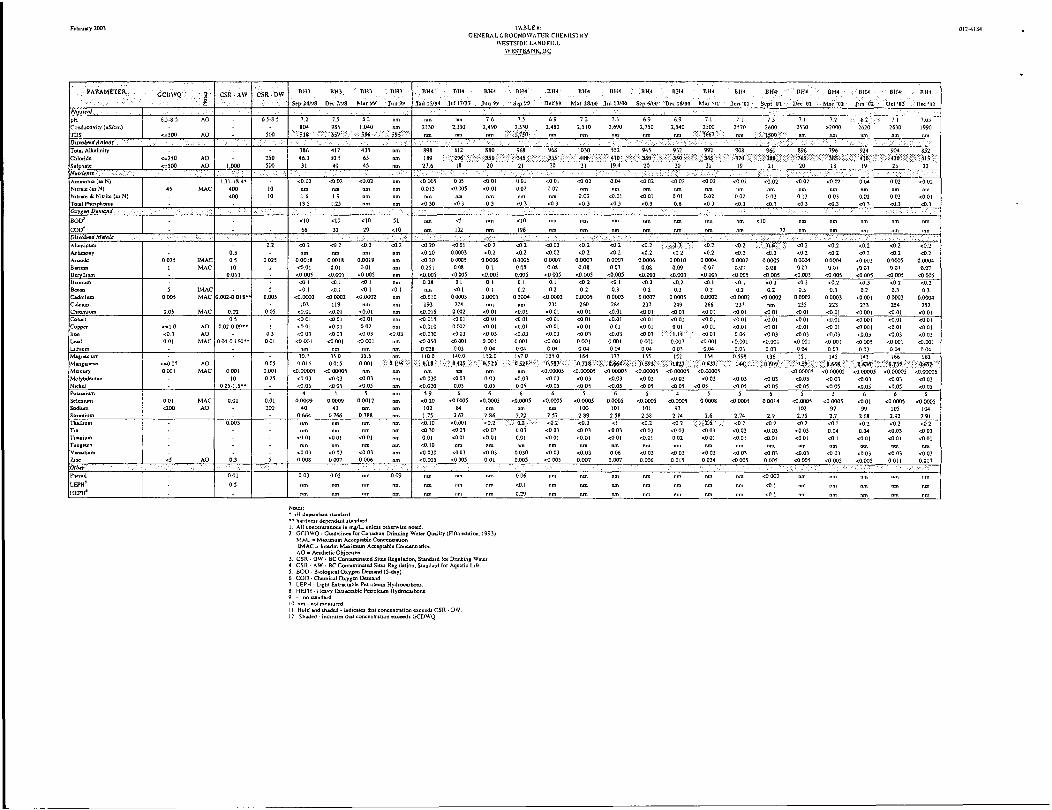
TABLE6 GWERAI. CROUNO\VA~EI1 CIIBLIISTIlY
\VESTSIDE LANDFILL \VFXI%ANK. UC
0124184
0 OS 0 WI 0.Z
0 01 200
""I "0, "rn "m . "rn "rn "rn "rn "rn I l r n ""7 "", "rn "rn "rn ""
TABLE(: GENERAL GROUND\VATER CHEMLSTRY
\V&SI'SIOEIhNDFK.L \VFSIllANK. IIC
012d154
T I R I F L . . _ _ _ GENELUL CROUND\VAl’ER CHEMISTRY
\YIL”SIOE U N O l 7 L L \ V W l I A N K . BC
0124184
s33
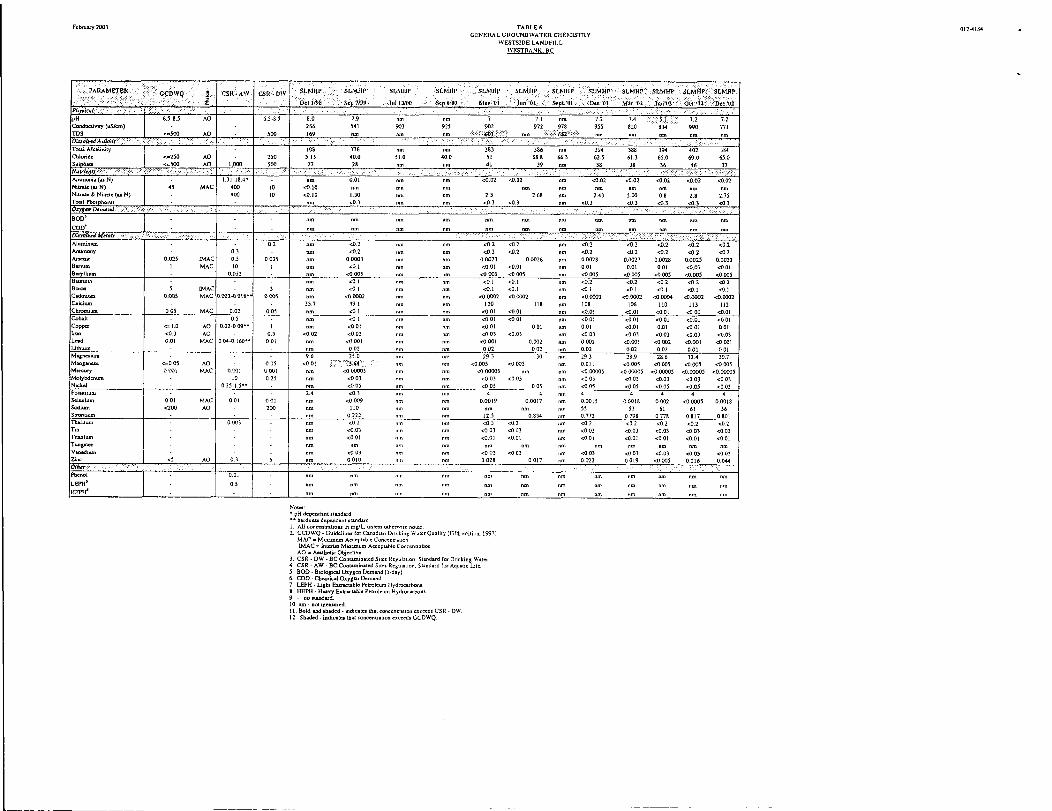
TABLE 6: GENERAL CROUNDIVATER CHEhllSTRY
WEFTSIDE LANDFILL 1VFISTBANK. BC
1
February 2003
Date
18-Dec-02 18-Dec-02 18-Dec-02 18-Dec-02 18-Dec-02 18-Dec-02 18-Dec-02 18-Dec-02 18-Dec-02 18-Dec-02
-4 >
BH 1 BH 2
MN 99-1 MN 99-2 MN 99-3 MN 99-4
BH 101 (deep) BH 101 (shallow)
BH 102 BH 103
3 142 3 315
TABLE 7: SUMMARY OF SOIL GAS MONITORING RESULTS
WESTSJDE LANDFILL WESTBANK, BC
19.6 20.4 20.4 20.7 17.7 17.2 19.7 20.4
Notes: 1) Gastech - Gastech GT201 combustible gas monitor calibrated to hexane. 2) Gastech - Gastech GT402 combustible gas monitor calibrated to methane. 3) ppm - parts per million 4) LEL - Lower Explosive Limit 5) 90 - percentage of gas by total volume. 6) nm - not measured
18-Jul-02
18-Jul-02 18-Jul-02 18-Jul-02 18-Jul-02 18-Jul-02 18-Jul-02 18-Jul-02
18-Jul-02 BH 1 BH 2 BH 4 BH 5 BH 8
MN 99-1 MN 99-2 MN 99-3 MN 9 9 4
18-Jul-02 BH 102 18-Jul-02 BH 103
3 290 3 310 3 255 11 740 5 370 6 195 5 425 4 760 5 615 dry dry dry dry
18 3 15 7 20 9 19 3 20 9 20 9 18 6 19 9 20 1 16 3 18 7 19 2 19 8
0 0 0 0 0 0 0 0 0
-
0 4 0 0 0 0 0 0 0 0 0 0 0
Gastech <:.L'HS :+ "(ppm)"
0 0 0 0 0 0 0 0 0 0
102*
:(ppm) - 0 0 0 0 1 0 0 0 0 0 0 0 0
H2 8':-
560 300 520 200 620 700 500 300 400
1,140 1,120
80 360 480 640 900 740 540
1,120 700 720 580
Notes: 1) Gastech - Gastech GT402 combustible gas monitor calibrated to methane. 2) Gastech - Gastech GT02 combustible gas monitor calibrated to COP 3) ppm - paas per million 4) LEL - Lower Explosive Limit 5) 5% - percentage of gas by total volume. 6) nm - not measured 7) nm -not measured
01 2-41 84
\ 0'
>5 >5 0.1 1.35 0.30 0.0 3.5 1.4 1.7 >5 3.9 2.2 2.35
February 2003
BH 2 BH 4 BH 5 BH 8
MN 99-1 MN 99-2 MN 99-3 MN 99-4
BH 101 (deep) BH 101 (shallow)
BH 102 BH 103
’ Date -
7-Jan-02 7-Jan-02 7-Jan-02 7-Jan-02 7-Jan-02 7-Jan-02 7-Jan-02 7-Jan-02 7-Jan-02 7-Jan-02 7-Jan-02 7-Jan-02 7-Jan-02
< a
3.316 1.808 11.930 5.104 6.745 5.865 5.440 5.987 Dry Dry Dry Dry
Date
10-Jul-01
10-Jul-01 10-Jul-0 1
10-Jul-01
10-Jul-01 10-Jul-01 10-Jul-01
IC-Jul-01
10-Jul-01
10-Jul-01
160 160 40 0
160 160 140 240 220 220 160 140
20.1 20.9 20.7 20.9 18.5 19.9 20.1 15.2 15.3 16.4 19.6 18.4
BH 1 I 3.38
100 100 20 0
100 80 80 160 140 140 100 100
2.3 2.9
0.50 0.25 2.2 1.9 1.6 t 5 t 5 t5 2.2 3.15
10-Jul-01
TABLE 7: SUMMARY OF SOIL GAS MONITORING RESULTS
WESTSIDE LANDFILL WESTBANK, B C
. .. BH 101 (shallow) Dry
012-4 184
. co I (ppm)
0
Gastech GT201
Combustibl
1,980 ( P P d
BH 2 BH 4 BH 5 BH 8
h4N 99-1 MN 99-2 MN 99-3 MN 9 9 4
BH 101 (deeo)
3.33 3.27 11.78 5.70 6.75 5.85 5.31 5.89 Dry
0 0 0 0 0 0 0 0 0 0 0 0
Notes: 1) Gastech - Gastech GT303. GT02 combustible gas monitor calibrated to methane. 2) Gastech - Gastech GT302 combustible gas monitor calibrated to hexane. 3) Gastech - Gastech GT02 combustible gas monitor calibrated to CO1. 4) ppm - parts per million 5) LEL - Lower Explosive Limit 6) % - percentage of gas by total volume. 7) nm - not measured
2,240 240 840
1,200 1.760 1,560 1,820 1,120 2,220 1,700 1.420 1.100
0 1 0 I 300 I ts
10-Jul-01 BH 102 10-Jul-0 1 BH 103
1 1 1 0 0
0 0 0
Dry Dry
0 2
(%) 18 7 15 5 20 4 18 9 18 8 19 1 19 2 18 6 19 5 10 3 15 9 18 3 19 2
=
Gastei HIS
bpm) 0 0 0 0 2 0 0 0 0 0 0 0 0
GT302
cH4 h
(ppm) 820 840 1.20 360 480 940 860 980 580 840 840 840 460
Gastech GT02 co, - (%) t5 +5 0 0 1 1 4 0 1 3 1 8 1 9 1 1 t 5 +5 1 7 0 0
February 2003
18.9 19.3 20.1 20.2 20.9 20.5 20.6 20.7 17.4 18.9 19.5 19.5 20.9
-Date
21-Dec-00 21 D e c a l 21-Dec-00 21 -Dec 00 21 Dec-00 21-Dec-00 21-Dec-W 21-Dec-00 21-DecM) 21-Dec-00 21-Dec-00 2 1 -DecM) 21-Dec-00
0 0 0 0 0 0 0 0 0 0 0 0 0
1 P r o b h e l l
BH 1 BH 2 BH 4 BH 5 BH 8
MN 99-1 MN 99-2 MN 99-3 MN99-4
BH 101 (deep) BH 101 (shallow)
BH 102 BH 103
< .
Depth to Water
3 403 (m) ”
3.304 3.378 11.865 5.800 6.742 6.335 4.996 5.795 Dry Dry Dry Dry
TABLE 7: SUMMARY OF SOIL GAS MONITORING RESULTS
WESTSIDE LANDFILL WESTBANK, BC
Gastect co
‘ (ppm) 0 0 0 0 0 0 0 0 0 0 0 0 0
Notes: I ) Gastech - Gastech GT303, GT02 combustible gas monitor callbraled to methane 2) Gastech - Gastech GT302 combustible gas monitor calibrated to hexane. 3) Gastech - Gastech GT02 combustible gas monitor calibrated to CO,. 4) ppm - parts per million 5 ) LEL - Lower Explosive Limit 6) 90 -percentage of gas by total volume. 7) nm - not measured
-Dafe
27-Jul-W 27-Jul-00 27-JulM) 27-Jul-W 27-Jul# 27-Jul-W 27-Jul-00 27-Jul-00 27-1ul-00 27-Jd-00 27-Jd-W 27-JulM) 27-Jul-W
Notes
.- I 3
F o b q e l i
BH 1 BH 2 BH 4 BH 5 BH 8
MN 99-1 MN 99-2 MN 99-3 MN 9 9 4
BH 101 (deep) BH 101 (shallow)
BH 102 BH 103
640 440 280 100 0
120 120 120 760 640 520 300 0
3.265 3.130 11.682 5.395 6.023 5.490 5.ooo 5.870
Dry to 3.80 Dry to 1.88
DRY DRY
440 160 20 40 100 20
220 160 260 380 240 200
0 0 0 0 0 0 0 0 0 0 0 0 - -
1 Gaste CH4
ippm) I‘. 100 100 40 0 0 60 60 EO 40 80 100 60 60
GT302
”” ’ l i * r x c ~ * I *a L2 8
a(ppm) . 600 500 720 120 20
420 360 220 600 660 5 20 400 360
16.2 14.7 20.9 20 9 20.9 20.9 20.7 19.3 20.4 18.5 16.9 19.8 20.9
0124 184
Gastech GT02 7;” ..coz
(%) 2 1 1 05 2 0 0 0
1 15 0.95 0 2
4 05 3 15 1 2 0 7 0 6
e..*
Gastech GT02
-*+???.., -.f (%)
+5 00 +5 00 175 0 20 0 45 1 45 1 40 2 45 160 +5 00 +5 00 2 20 2 25
1) Gastech - Gastech GTZOl combustible gas monitor calibrated to methane. 2) Gastech - Gastech GT402 combustible gas monitor calibrated to hexane. 3) Gastech - Gastech GT02 combustible gas monitor calibrated to C02. 4) E L - Lower Explosive Limit 5) % -percentage of gas by total volume. 6) nm - not measured
KEY PLAN .
N
I
FIGURE 1
Date: Feb/20/02
Project: 01 241 84-5200
SCALE 1:50,000
SPECIAL NOTE- THIS DRAWING TO BE READ IN CONJUNCTION
WITH ACCOMPANING REPORT
Drawn: SN
Chkd:
Site Plan Wests ide Landf i I I Westbank, B.C.
Drawn SN ~~~ ~
W d Dote Feb-2M2 Figure 2
s33
mwins N:\Active\4100\012-4184 RDCO - Westside Londfill\Task 5200 - Landfill Reporting\Figure\Figure 3.dwg Plotted: Feb 03, 2003 - 9:470m By: SNichol
0 P I
v) Z
W 2 m A 0 D 0 2
O L 1990 1991 1992 1993, 1994 3995 1996 7997 1998 '1993 2000 ZOO? 2002
Year I
+Discharge Rate I !
\012-4184 RDCO - Westside Londfill\Task 5200 - Landfill Reporting\Figure\Figure 4A.dwg Plotted: Feb 03, 2003 - 9:51arn By: SNichol
FIGURE 4: GROUNDWATER ELEVATIONS * WESTSIDE LAMBFILL W'ESTBANKS
4
N:\Active\41
FSGURE 4: GRQU'NDWATER ELEVATIONS - WESTSIDE LANDFILL WESTBANK, BC
479 ' .y m
-477 u w CI
475,
= 473 UI m
\Ol2-4184 RDCO - Westside Landfill\Task 5200 - Landfill Reporting\Figure\Figure 4B.dwg Plotted: Feb 03, 2003 - 9:49om By: SNichol
461
455 'L- a
Jan-94 %p-94 May-95 Jan-96 Sep-96 Jura-97 Feb-98 Oct-93 Jun-99 Feb-OO fikw-00 J&Ul Mar-02 No\I-02
Date
A Bkf3 + BH5 --G BH8
APPENDIX I Trend Analysis Graphing (Various Parameters)
r

Drawinc N:\Active\4100\012-4184 RDCO - Westside Landfill\Task 5200 - Landfill Reporting\Figure\Appendix Ldwg Plotted: Feb 13, 2003 - 12:14pm By: SNichol
4mb
'9500'
g 2500 E *
0 . Jai
s33
Drawin N:\Active\ 4 ’ \012-4184 RDCO - Westside Landfill\Task 5200 - Landfill Reporting\Figure\Appendix I.dwg Plotted: Feb 13, 2003 - 12: 13pm By: SNichol
500
Alkalinity in Grauodwater - Wesfside Landfill Weitbank, BC
s33
Drawinl N:\Active\4100\012-4184 RDCO - Westside Landfill\Task 5200 - Landfill Reporting\Figure\Appendix I.dwg Plotted: Feb 13, 2003 - 12:lOpm By: SNichol
?.mi
l.E*CEO
1. E02
I. ~ - 0 3
Aluminum Concentrations in Groundwater* WGsbide Landfill Westknk, 812
s33
Drowini N:\Active\4100\012-4184 RDCO - Westside Landfill\Task 5 2 0 0 - Landfill Reporting\Figure\Appendix I.dwg Plotted: Feb 13. 2003 - 12:l 1 pm By: SNichol
Ammonia in E
s33
awing: N:\Active\41
1 \012-4184 RDCO - Westside Landfill\Tosk 5200 - Landfill Reporting\Figure\Appendix I.dwg Plotted: Feb 13. 2003 - 12:12pm By: SNichol
l.E-03
1.E-OR Jt
-. I_
I
37 NQV-98 M i T G JUl-01 be002 Date
--- EiH1, -3#- BH5 s33
Drawinc N:\Active\4 1
m b
\Ol2-4184 RDCO - Westside Landfill\Task 5200 - Landfill Reporting\Figure\Appendix I.dwg Plotted: Feb 13. 2003 - 1 2 1 2prn By: SNichol
3 ,EM
l.E-0
I-E-0 , 1
Jan-94 Jut-94 Feb-95 Aug- Mar-96 3%~- Apr-97 Nav- May- Dec- Jut99 Jan-00 Jul-00 Fabf01 Sep Mar-02 Oct-02 09 95 96 97 9%ab BB
-*- BH1 --%- BHS
-e- ci-- BH2 ...--A BH 3 --xu-- BH4 +Dob + SLMWP d - DW Standard
.
s33
N:\Active\4
0
I;
1\01 2-4184 RDCO - Westside Landfill\Task 5200 - Landfill Reporting\Figure\Appendix I.dwg Plotted: Feb 13. 2003 - 12:13pm By: SNichol
1 :EM1
I .E+OOi
3 a E ci v
D
.
s33

"1.E4-02
1\012-4184 RDCO - Westside Landfill\Task 5200 - Landfill Reporting\Figure\Appendix I.dwg Plotted: Feb 13, 2003 - 12:13pm By: SNichol
---A--. -- K---. IE3H4 I- +-- EIH1 --a -- BH2 -+"- 8H5 *Dobbi 4 S L M H P - --DW Standard
.
s33
ng: N:\Active\41 r
T l! 0 I r 0
\012-4184 RDCO - Westside Londfill\Tosk 5200 - Landfill Reporting\Figure\Appendix Ldwg Plotted: Feb 13. 2003 - 12:08pm BY: SNichol
Chlorfcfe Concentrations fn Groundwater - Westssfde LandRIi Westbank, BC
1 Jan-94 JuC94 Feb-96 Aug-95 Mar-96 Sep-96 Apr-97 Nov-St May- Dee-98 Ju&Q Jaw00 Jul-00 FebO? 8cp-
%te
-+- -BH D BM2 A" . X BH4 + BH 4 -t--SLMFIP - - DW Sfamrcl s33
Drawinc N:\Active\4100\012-4184 RDCO - Westside Landfill\Task 5200 - Landfill Reporting\Figure\Appendix I.dwg Plotted: Feb 13, 2003 - 1214prn By: SNichol
x. 0
n -0 zz
loit
10
I
0.1
0,Ol
iron Concentrations' In Groundwater - Westkltde 'Landfllt Westbank, BE
. I i !(
8 .
. .-
I--&
I 1 Jan-94 Jut94 F8b-95 Aug-95 Mar-% Sep-gti Apr-87 Nov-F)? May- Deb98 Jun-gS. Jan-OO Jut-OD Feb-01 Sep-01 Mar42 Oct-02
98et(t
- + BHf BH2 X BH4 + - -DWSkflda?d b BM3
--.m--BH5 +. SLMNP s33
' N:\Active\4 1
I
z f - P a
\012-4184 RDCO - Westside Landfill\Task 5200 - Landfill Reporting\Figure\Appendix I.dwg Plotted: Feb 13. 2003 - 1 2 1 5prn By: SNichol
1.E+
+
I
n 9 4 Jul-94. Feb-95 Sep- Mar46 Oct-96 Apr-97 Nav; May- €3- Jul.99 Jsn-OO Aug FeBQ Mar-02 Oct-M 00 "97 913 95
--c- BHI -0-Bf42 -A- EH3 -X- BH4 JIC. 8x5 +Do +SUVIHP s33
N:\Active\4 1 1\01 2-41 8 4 RDCO - Westside Landfill\Task 5200 - Landfill Reporting\Figure\Appendix I.dwg Plotted: Feb 13, 2003 - 12: 15prn By: SNichol
f
s33

Drawinc
I
d rn v) -i v)
i
c
N:\Active\4100\012-4184 RDCO - Westside Landfill\Task 5200 - Landfill Reporting\Figure\Appendix I.dwg Plotted: Feb 13, 2003 - 12:16pm B ~ : SNichol
\ s33
A 0 0 0
I
- 3 7: 5 n - - c
N:\Active\41 \012-4184 RDCO - Westside Landfill\Task 5200 - Landfill Reporting\Figure\Appendix I.dwg Plotted: Feb 13, 2003 - 1216prn By: SNichol
5 .E+ FebOl Sep- Mar-02
00 01 95 97 9a),& 98
---+--BWI --0- BH2 -4- BH3 ---3C--BH4 - --DW Standard +BH5 --+--D +SLh&P s33

Drawinc N:\Active\4100\012-4184 ROC0 - Westside Landfill\Task 5200 - Landfill Reporting\Figure\Appendix I.dwg Plotted: Feb 13, 2003 - 12:17pm By: SNichol
0
f I
0 z v,
aier 0 tan
ii E rrr
s33