good hope elementary school - perrisesd.org
TRANSCRIPT

Good Hope Elementary SchoolSchool Accountability Report Card, 2011–2012Perris Elementary School District
An annual report to the
community about teaching,
learning, test results,
resources, and measures of
progress in our school.
»
Published bySCHOOL WISE PRESS

Good Hope Elementary School School Accountability Report Card, 2011–2012Perris Elementary School District
»Contents
ONLINE USERS: CLICK ON A TITLE TO JUMP TO THAT SECTION
This School Accountability Report Card (SARC) provides information that can be used to evaluate and compare schools. State and federal laws require all schools to publish a SARC each year.
The information in this report represents the 2011–2012 school year, not the current school year. In most cases, this is the most recent data available. We present our school’s results next to those of the average elementary school in the county and state to provide the most meaningful and fair comparisons. To find additional facts about our school online, please use the DataQuest tool offered by the California Department of Education.
Please note that words that appear in a smaller, bold typeface are links in the online version of this report to more information. You can find a list of those linked words and their Web page URLs at:http://www.schoolwisepress.com/sarc/links_2012_en.html
Reports about other schools are available on the California Department of Education Web site. Internet access is available in local libraries.
If you have any questions related to this report, or would like to request a hardcopy version, please contact our school office.
How to Contact Our School24050 Theda StreetPerris, CA 92570Principal: Allyson MalloryPhone: (951) 657-5181
How to Contact Our District143 East 1st St.Perris, CA 92570Phone: (951) 657-3118http://www.perris.k12.ca.us/
Published by
SCHOOL WISE PRESS466 Green Street, Suite 303San Francisco, CA 94133Phone: (415) 432-7800www.schoolwisepress.com
©2012 Publishing 20/20
Principal’s Message
Measures of Progress
Student Achievement
Students
Climate for Learning
Leadership, Teachers, and Staff
Resources
School Expenditures
Adequacy of Key Resources 2012–2013
Data Almanac

»
Good Hope Elementary SchoolSchool Accountability Report Card, 2011–2012Perris Elementary School District
Perris Elementary School District
Grade range and calendar
K–6TRADITIONAL
Academic Performance Index
698County Average: 815State Average: 814
Student enrollment
710County Average: 719State Average: 535
Principal�s Message
Welcome to Good Hope Elementary School, home of the Mighty Mustangs! Our mission is “Building Learners for Life” while empowering students to achieve academic and personal excellence. Staff members and parents work diligently together toward this goal because we care about our children.
Our school has adopted a professional learning community philosophy. We believe that we all contribute to the success of each student on our campus and that every student can and will learn. Teachers work collaboratively to review data, set goals, and plan instruction of essential standards. Students are also involved in setting learning goals and are provided opportunities to reflect on their own learning.
We are committed to increasing students’ reading proficiency. We set high academic expectations and teachers follow a standards-based curriculum and monitor student progress using six- to eight-week assessments.
Our school qualified for a state Quality Educational Investment Act (QEIA) grant. Over the next two years, we will reduce the class size for grades four through six to a maximum of 25 students in each classroom.
Parents and community members are important to our academic program. We welcome your participation in our school activities and encourage you to join our GHV (Good Hope Volunteers), School Site Council (SSC), Family Involvement Action Team (FIAT) and English Language Advisory Committee (ELAC). Our staff looks forward to working with you for another year of academic success.
Allyson Mallory, PRINCIPAL

Good Hope Elementary School School Accountability Report Card for 2011–2012 Page 2
Major Achievements• This year our Academic Performance Index (API), based on the spring 2012 results of our California
Standards Tests given to grades two through six, was 698. This is a 21-point increase for Good Hope. These 2011-2012 results indicate that we met Adequate Yearly Progress (AYP) in ELA and Math for all subgroups except English Language Learners.
• During the 2011–2012 school year, we continued to focus on family involvement. Once-a-month our Family Involvement Action Team (FIAT) held “Read with Me Wednesday” activities. During this time parents and community members are welcome to visit our school and read with the children. After read-ing, they participate in an informative workshop training them to better support their child’s learning at home. This year FIAT continues to assist the school and encourage family involvement.
• Every classroom displays a college flag over the doorway, symbolizing the high expectation for learning at Good Hope Elementary. These flags are mounted when a grade level achieves their academic learning goal. We are proud to say that all grade levels achieved the award of mounting their flags. Continuing the theme of college-bound scholars, our sixth grade students attended Long Beach State University for a tour of the campus, a meet and greet with student athletes and watch a soccer game. This exposure increased our students’ motivation to go to college.
• For the 2011–2012 school year, our students had the opportunity to participate in our annual festivals, Carnival, Talent Show, and Black History Day parade. This was a tremendous gathering of students, staff, and community. Several parents and community workers volunteered their time to help make this a suc-cessful event.
Focus for Improvement• This year our teachers will continue to use grade-level expectations as defined by the California Content
Standards to design their lessons and inform their instruction. In order to advance student achieveint in language arts and math, teachers schoolwide will continue to improve their direct instruction, grow stu-dent engagement, and increase rigor. To support teacher improvement, staff will work together to analyze and use student data to inform meaningful classroom instruction. We will continue to use effective instructional strategies to engage student learning and ensure “first best instruction” in classrooms.
• We will continue to build a schoolwide professional learning community by attending professional devel-opment and implementing Learning Walks. Learning Walks enable teachers to visit each others’ class-rooms and observe the instructional practices that increase student achievement. This collaboration inspires teamwork and gives teachers ideas on how to affect student learning.
• This year we are introducing Data Discussions three times a year. During this time staff will focus on the individual student and use benchmark data to make informed decisions to address unique student needs.
• All teachers track student progress and use this information to reteach skills and/or provide additional help in reading and math to struggling students. During targeted and differentiated Intervention time, academic goals are set and measured by districtwide and classroom six- to eight-week assessments.
• We are implementing a Read Naturally program for approximately 250 at-risk students designed to build fluency and reading comprehension skills. Participating students go to the Read Naturally lab for 30 minutes everyday.
Perris Elementary School District

Good Hope Elementary School School Accountability Report Card for 2011–2012 Page 3
Academic Performance IndexThe Academic Performance Index (API) is California’s way of comparing schools based on student test scores. The index was created in 1999 to help parents and educators recognize schools that show progress and identify schools that need help. It is also used to compare schools in a statewide ranking system. The California Department of Education (CDE) calculates a school’s API using student test results from the California Standards Tests and, for high schools, the California High School Exit Exam (CAHSEE). APIs range from 200 to 1000. The CDE expects all schools to eventually obtain APIs of at least 800. Additional
information on the API can be found on the CDE Web site.
Good Hope Elementary’s API was 698 (out of 1000). This is an increase of 21 points compared with last year’s API. All students took the test. You can find three years of detailed API results in the Data Almanac that accompanies this report.
API RANKINGS: Based on our 2010–2011 test results, we started the 2011–2012 school year with a base API of 677. The state ranks all schools according to this score on a scale from 1 to 10 (10 being highest). Compared with all elementary schools in California, our school ranked 1 out of 10.
SIMILAR SCHOOL RANKINGS: We also received a second ranking that compared us with the 100 schools with the most similar students, teachers, and class sizes. Compared with these schools, our school ranked 1 out of 10. The CDE recalculates this factor every year. To read more about the specific elements included in this calculation, refer to the CDE Web site.
API GROWTH TARGETS: Each year the CDE sets specific API “growth targets” for every school. It assigns one growth target for the entire school, and it sets additional targets for ethnic groups, English Learners, special education students, or socioeconomic subgroups of students that make up a significant portion of the student body. Schools are required to meet all of their growth targets. If they do, they may be eligible to apply for awards through the California School Recognition Program and the Title I Achieving Schools Program.
We met our assigned growth targets during the 2011–2012 school year. Just for reference, 59 percent of elementary schools statewide met their growth targets.
MEASURES OF PROGRESS
CALIFORNIA
APIACADEMIC PERFORMANCE INDEX
Met schoolwide growth target YesMet growth target for prior school year No
API score 698Growth attained from prior year +21Met subgroup* growth targets Yes
SOURCE: API based on spring 2012 test cycle. Growth scores alone are displayed and are current as of November 2012.
*Ethnic groups, English Learners, special ed students, or socioeconomic groups of students that make up 15 percent or more of a school’s student body. These groups must meet AYP and API goals. N/A - Results not available.
200 300 400 500 600 700 800 900 1000
Learning disabled
English Learners
Low income
White/Other
Hispanic/Latino
STUDENT SUBGROUPS
STATE AVERAGE
ALL STUDENTS IN THIS SCHOOL
API, Spring 2012
698
814
695
795
698
678
526
SOURCE: API based on spring 2012 test cycle. State average represents elementary schools only.NOTE: Only groups of students that represent at least 15 percent of total enrollment are calculated and displayed as student subgroups.
Perris Elementary School District

Good Hope Elementary School School Accountability Report Card for 2011–2012 Page 4
Adequate Yearly ProgressIn addition to California’s accountability system, which measures student achievement using the API, schools must also meet requirements set by the federal education law known as No Child Left Behind (NCLB). This law requires all schools to meet a different goal: Adequate Yearly Progress (AYP).
We met 15 out of 17 criteria for yearly progress. Because we fell short in two areas, we did not make AYP. Our school is also on the federal watchlist known as Program Improvement (PI). See the next page for background on this matter and an explanation of the consequences.
To meet AYP, elementary schools must meet three criteria. First, a certain percentage of students must score at or above Proficient levels on the California Standards Tests (CST), the California Modified Assessment (CMA), and the California Alternate Performance Assessment (CAPA): 78.4 percent on the English/language arts test and 79.0 percent on the math test. All ethnic, English Learners, special education, and socioeconomic subgroups of students also must meet these goals. Second, the schools must achieve an API of at least 740 or increase the API by one point from the prior year. Third, 95 percent of the student body must take the required standardized tests.
If even one subgroup of students fails to meet just one of the criteria, the school fails to meet AYP. While all schools must report their progress toward meeting AYP, only schools that receive federal funding to help economically disadvantaged students are actually penalized if they fail to meet AYP goals. Schools that do not make AYP for two or more years in a row in the same subject enter Program Improvement (PI). They must offer students transfers to other schools in the district and, in their second year in PI, tutoring services as well.
The table at left shows our success or failure in meeting AYP goals in the 2011–2012 school year. The green dots represent goals we met; red dots indicate goals we missed. Just one red dot means that we failed to meet AYP.
NOTE: Dashes indicate that too few students were in the category to draw meaningful conclusions. Federal law requires valid test scores from at least 50 students for statistical significance.
FEDERAL
AYPADEQUATE YEARLY PROGRESS
Met AYP NoMet schoolwide participation rate YesMet schoolwide test score goals YesMet subgroup* participation rate YesMet subgroup* test score goals NoMet schoolwide API for AYP YesProgram Improvement school in 2012
Yes
SOURCE: AYP is based on the Accountability Progress Report of October 2012. A school can be in Program Improvement based on students’ test results in the 2011–2012 school year or earlier.
*Ethnic groups, English Learners, special ed students, or socioeconomic groups of students that make up 15 percent or more of a school’s student body. These groups must meet AYP and API goals.N/A - Results not available.
Adequate Yearly Progress, Detail by Subgroup
● MET GOAL ● DID NOT MEET GOAL � NOT ENOUGH STUDENTS
English/Language Arts Math
DID 95%OF STUDENTS TAKE THE CST,
CMA OR CAPA?
DID 78.4%OF STUDENTS
SCOREPROFICIENT OR ADVANCED ON THE CST, CMA,
& CAPA?
DID 95%OF STUDENTS TAKE THE CST,
CMA OR CAPA?
DID 79.0%OF STUDENTS
SCOREPROFICIENT OR ADVANCED ON THE CST, CMA,
& CAPA?
SCHOOLWIDE RESULTS ● ● ● ●
SUBGROUPS OF STUDENTS
Low income ● ● ● ●
Students learning English ● ● ● ●
STUDENTS BY ETHNICITY
Hispanic/Latino ● ● ● ●SOURCE: AYP release of October 2012, CDE.
Perris Elementary School District
Good Hope Elementary School School Accountability Report Card for 2011–2012 Page 5
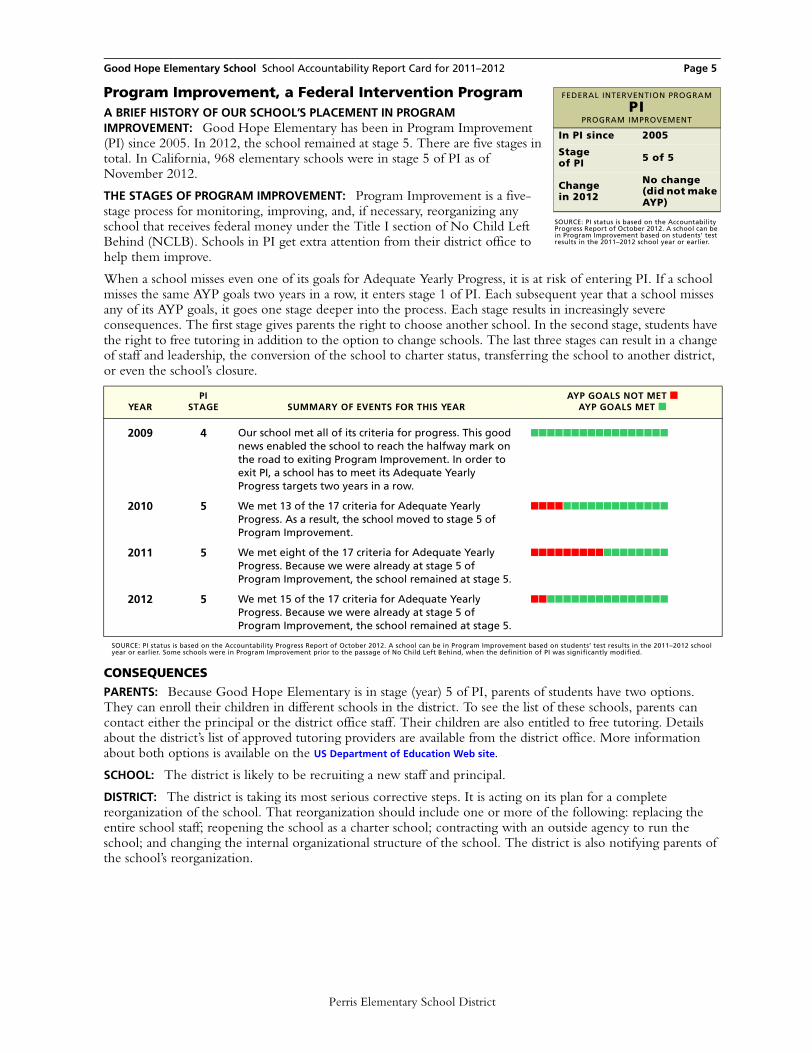
Program Improvement, a Federal Intervention ProgramA BRIEF HISTORY OF OUR SCHOOL’S PLACEMENT IN PROGRAM IMPROVEMENT: Good Hope Elementary has been in Program Improvement (PI) since 2005. In 2012, the school remained at stage 5. There are five stages in total. In California, 968 elementary schools were in stage 5 of PI as of November 2012.
THE STAGES OF PROGRAM IMPROVEMENT: Program Improvement is a five-stage process for monitoring, improving, and, if necessary, reorganizing any school that receives federal money under the Title I section of No Child Left Behind (NCLB). Schools in PI get extra attention from their district office to help them improve.
When a school misses even one of its goals for Adequate Yearly Progress, it is at risk of entering PI. If a school misses the same AYP goals two years in a row, it enters stage 1 of PI. Each subsequent year that a school misses any of its AYP goals, it goes one stage deeper into the process. Each stage results in increasingly severe consequences. The first stage gives parents the right to choose another school. In the second stage, students have the right to free tutoring in addition to the option to change schools. The last three stages can result in a change of staff and leadership, the conversion of the school to charter status, transferring the school to another district, or even the school’s closure.
CONSEQUENCESPARENTS: Because Good Hope Elementary is in stage (year) 5 of PI, parents of students have two options. They can enroll their children in different schools in the district. To see the list of these schools, parents can contact either the principal or the district office staff. Their children are also entitled to free tutoring. Details about the district’s list of approved tutoring providers are available from the district office. More information about both options is available on the US Department of Education Web site.
SCHOOL: The district is likely to be recruiting a new staff and principal.
DISTRICT: The district is taking its most serious corrective steps. It is acting on its plan for a complete reorganization of the school. That reorganization should include one or more of the following: replacing the entire school staff; reopening the school as a charter school; contracting with an outside agency to run the school; and changing the internal organizational structure of the school. The district is also notifying parents of the school’s reorganization.
YEARPI
STAGE SUMMARY OF EVENTS FOR THIS YEARAYP GOALS NOT MET ■
AYP GOALS MET ■
2009 4 Our school met all of its criteria for progress. This good news enabled the school to reach the halfway mark on the road to exiting Program Improvement. In order to exit PI, a school has to meet its Adequate Yearly Progress targets two years in a row.
■■■■■■■■■■■■■■■■■
2010 5 We met 13 of the 17 criteria for Adequate Yearly Progress. As a result, the school moved to stage 5 of Program Improvement.
■■■■■■■■■■■■■■■■■
2011 5 We met eight of the 17 criteria for Adequate Yearly Progress. Because we were already at stage 5 of Program Improvement, the school remained at stage 5.
■■■■■■■■■■■■■■■■■
2012 5 We met 15 of the 17 criteria for Adequate Yearly Progress. Because we were already at stage 5 of Program Improvement, the school remained at stage 5.
■■■■■■■■■■■■■■■■■
SOURCE: PI status is based on the Accountability Progress Report of October 2012. A school can be in Program Improvement based on students’ test results in the 2011–2012 school year or earlier. Some schools were in Program Improvement prior to the passage of No Child Left Behind, when the definition of PI was significantly modified.
FEDERAL INTERVENTION PROGRAM
PIPROGRAM IMPROVEMENT
In PI since 2005
Stage of PI 5 of 5
Change in 2012
No change (did not make AYP)
SOURCE: PI status is based on the Accountability Progress Report of October 2012. A school can be in Program Improvement based on students’ test results in the 2011–2012 school year or earlier.
Perris Elementary School District

Good Hope Elementary School School Accountability Report Card for 2011–2012 Page 6
Here you’ll find a three-year summary of our students’ scores on the California Standards Tests (CST) in selected subjects. We compare our students’ test scores with the results for students in the average elementary school in California. On the following pages we provide more detail for each test, including the scores for different subgroups of students. In addition, we provide links to the California Content Standards on which these tests are based. If you’d like more information about the CST, please contact our principal or our teaching staff. To find grade-level-specific scores, you can refer to the Standardized Testing and Reporting (STAR) Web site. Other tests in the STAR program can be found on the California Department of Education (CDE) Web site.
STUDENT ACHIEVEMENT
BAR GRAPHS BELOW SHOW THESE PROFICIENCY GROUPS (LEFT TO RIGHT):FAR BELOW BASIC BELOW BASIC BASIC PROFICIENT ADVANCED
California Standards Tests
TESTED SUBJECT2011–2012
LOW SCORES HIGH SCORES
2010–2011 LOW SCORES HIGH SCORES
2009–2010 LOW SCORES HIGH SCORES
ENGLISH/LANGUAGE ARTS
Our schoolPercent Proficient or higher
33% 26% 32%
Average elementary schoolPercent Proficient or higher
59% 56% 55%
MATH
Our schoolPercent Proficient or higher
44% 39% 47%
Average elementary schoolPercent Proficient or higher
63% 63% 60%
SCIENCE
Our schoolPercent Proficient or higher
35% 29% 31%
Average elementary schoolPercent Proficient or higher
59% 58% 56%
SOURCE: The scores for the CST are from the spring 2012 test cycle. State average represents elementary schools only. Whenever a school reports fewer than 11 scores for a particular subgroup at any grade level, the CDE suppresses the scores when it releases the data to the public. Missing data makes it impossible for us to compile complete schoolwide results. Therefore, the results published in this report may vary from other published CDE test scores.
Perris Elementary School District

Good Hope Elementary School School Accountability Report Card for 2011–2012 Page 7
Frequently Asked Questions About Standardized TestsWHERE CAN I FIND GRADE-LEVEL REPORTS? Due to space constraints and concern for statistical reliability, we have omitted grade-level detail from these test results. Instead we present results at the schoolwide level. You can view the results of far more students than any one grade level would contain, which also improves their statistical reliability. Grade-level results are online on the STAR Web site. More information about student test scores is available in the Data Almanac that accompanies this report.
WHAT DO THE FIVE PROFICIENCY BANDS MEAN? Test experts assign students to one of these five proficiency levels, based on the number of questions they answer correctly. Our immediate goal is to help students move up one level. Our eventual goal is to enable all students to reach either of the top two bands, Advanced or Proficient. Those who score in the middle band, Basic, have come close to attaining the required knowledge and skills. Those who score in either of the bottom two bands, Below Basic or Far Below Basic, need more help to reach the Proficient level.
HOW HARD ARE THE CALIFORNIA STANDARDS TESTS? Experts consider California’s standards to be among the most clear and rigorous in the country. Just 59 percent of elementary school students scored Proficient or Advanced on the English/language arts test; 63 percent scored Proficient or Advanced in math. You can review the California Content Standards on the CDE Web site.
ARE ALL STUDENTS’ SCORES INCLUDED? No. Only students in grades two through eleven are required to take the CST. When fewer than 11 students in one grade or subgroup take a test, state officials remove their scores from the report. They omit them to protect students’ privacy, as called for by federal law.
CAN I REVIEW SAMPLE TEST QUESTIONS? Sample test questions for the CST are on the CDE’s Web site. These are actual questions used in previous years.
WHERE CAN I FIND ADDITIONAL INFORMATION? The CDE has a wealth of resources on its Web site. The STAR Web site publishes detailed reports for schools and districts, and assistance packets for parents and teachers. This site includes explanations of technical terms, scoring methods, and the subjects covered by the tests for each grade. You’ll also find a guide to navigating the STAR Web site as well as help for understanding how to compare test scores.
Perris Elementary School District

Good Hope Elementary School School Accountability Report Card for 2011–2012 Page 8
The graph to the right shows how our students’ scores have changed over the years. We present each year’s results in a vertical bar, with students’ scores arrayed across five proficiency bands. When viewing schoolwide results over time, remember that progress can take many forms. It can be more students scoring in the top proficiency bands (blue); it can also be fewer students scoring in the lower two proficiency bands (brown and red).
You can read the California standards for English/
language arts on the CDE’s Web site.
BAR GRAPHS BELOW SHOW THESE PROFICIENCY GROUPS (LEFT TO RIGHT):FAR BELOW BASIC BELOW BASIC BASIC PROFICIENT ADVANCED
English/Language Arts (Reading and Writing)
GROUP LOW SCORES HIGH SCORES PROFICIENT OR
ADVANCED
STUDENTS TESTED
COMMENTS
SCHOOLWIDE AVERAGE 33% 97% SCHOOLWIDE AVERAGE: About 26 percent fewer students at our school scored Proficient or Advanced than at the average elementary school in California.
AVERAGE ELEMENTARY SCHOOL IN THE COUNTY
58% 94%
AVERAGE ELEMENTARY SCHOOL IN CALIFORNIA
59% 94%
BAR GRAPHS BELOW SHOW TWO PROFICIENCY GROUPS (LEFT TO RIGHT):
FAR BELOW BASIC, BELOW BASIC, AND BASIC PROFICIENT AND ADVANCED
Subgroup Test Scores
GROUP LOW SCORES HIGH SCORES PROFICIENT OR
ADVANCED
STUDENTS TESTED
COMMENTS
Boys 29% 240 GENDER: About eight percent more girls than boys at our school scored Proficient or Advanced.
Girls 37% 250
English proficient 45% 182 ENGLISH PROFICIENCY: English Learners scored lower on the CST than students who are proficient in English. Because we give this test in English, English Learners tend to be at a disadvantage. English Learners 26% 308
Low income 33% 490 INCOME: We cannot compare scores for these two subgroups because the number of students tested who were not from low-income families was either zero or too small to be statistically significant. Not low income NO DATA AVAILABLE N/A N/A
Learning disabled DATA STATISTICALLY UNRELIABLE N/S 23 LEARNING DISABILITIES: We cannot compare scores for these two subgroups because the number of students tested with learning disabilities was too small to be statistically significant. Not learning disabled 34% 466
Hispanic/Latino 33% 455 ETHNICITY: Test scores are likely to vary among students of different ethnic origins. The degree of variance will differ from school to school. Measures of the achievement gap are beyond the scope of this report.
SOURCE: The scores for the CST are from the spring 2012 test cycle. County and state averages represent elementary schools only. Whenever a school reports fewer than 11 scores for a particular subgroup at any grade level, the CDE suppresses the scores when it releases the data to the public. Missing data makes it impossible for us to compile complete schoolwide results. Therefore, the results published in this report may vary from other published CDE test scores.N/A: Not applicable. Either no students took the test, or to safeguard student privacy the CDE withheld all results because very few students took the test in any grade.N/S: Not statistically significant. While we have some data to report, we are suppressing it because the number of valid test scores is not large enough to be meaningful.
Three-Year Trend:
AdvancedProficientBasicBelow BasicFar Below Basic
English/Language Arts
Percentage of studentswho took the test:2010: 96%2011: 95%2012: 97%
SOURCE: CDE STAR research file: 2010, 2011, and 2012.
100
80
60
40
20
0
20
40
60
80
100
2010 2011 2012
Perc
enta
ge
of
stu
den
ts
Perris Elementary School District

Good Hope Elementary School School Accountability Report Card for 2011–2012 Page 9
The graph to the right shows how our students’ scores have changed over the years. We present each year’s results in a vertical bar, with students’ scores arrayed across five proficiency bands. When viewing schoolwide results over time, remember that progress can take many forms. It can be more students scoring in the top proficiency bands (blue); it can also be fewer students scoring in the lower two proficiency bands (brown and red).
You can read the math standards on the CDE’s Web site.
BAR GRAPHS BELOW SHOW THESE PROFICIENCY GROUPS (LEFT TO RIGHT):FAR BELOW BASIC BELOW BASIC BASIC PROFICIENT ADVANCED
Math
GROUP LOW SCORES HIGH SCORES PROFICIENT OR
ADVANCED
STUDENTS TESTED
COMMENTS
SCHOOLWIDE AVERAGE 44% 97% SCHOOLWIDE AVERAGE: About 19 percent fewer students at our school scored Proficient or Advanced than at the average elementary school in California.
AVERAGE ELEMENTARY SCHOOL IN THE COUNTY
63% 92%
AVERAGE ELEMENTARY SCHOOL IN CALIFORNIA
63% 90%
BAR GRAPHS BELOW SHOW TWO PROFICIENCY GROUPS (LEFT TO RIGHT):
FAR BELOW BASIC, BELOW BASIC, AND BASIC PROFICIENT AND ADVANCED
Subgroup Test Scores
GROUP LOW SCORES HIGH SCORES PROFICIENT OR
ADVANCED
STUDENTS TESTED
COMMENTS
Boys 41% 243 GENDER: About six percent more girls than boys at our school scored Proficient or Advanced.
Girls 47% 251
English proficient 53% 182 ENGLISH PROFICIENCY: English Learners scored lower on the CST than students who are proficient in English. Because we give this test in English, English Learners tend to be at a disadvantage. English Learners 38% 312
Low income 44% 494 INCOME: We cannot compare scores for these two subgroups because the number of students tested who were not from low-income families was either zero or too small to be statistically significant. Not low income NO DATA AVAILABLE N/A N/A
Learning disabled DATA STATISTICALLY UNRELIABLE N/S 27 LEARNING DISABILITIES: We cannot compare scores for these two subgroups because the number of students tested with learning disabilities was too small to be statistically significant. Not learning disabled 45% 466
Hispanic/Latino 45% 459 ETHNICITY: Test scores are likely to vary among students of different ethnic origins. The degree of variance will differ from school to school. Measures of the achievement gap are beyond the scope of this report.
SOURCE: The scores for the CST are from the spring 2012 test cycle. County and state averages represent elementary schools only. Whenever a school reports fewer than 11 scores for a particular subgroup at any grade level, the CDE suppresses the scores when it releases the data to the public. Missing data makes it impossible for us to compile complete schoolwide results. Therefore, the results published in this report may vary from other published CDE test scores.N/A: Not applicable. Either no students took the test, or to safeguard student privacy the CDE withheld all results because very few students took the test in any grade.N/S: Not statistically significant. While we have some data to report, we are suppressing it because the number of valid test scores is not large enough to be meaningful.
Three-Year Trend:
AdvancedProficientBasicBelow BasicFar Below Basic
Math
Percentage of studentswho took the test:2010: 98%2011: 97%2012: 97%
SOURCE: CDE STAR research file: 2010, 2011, and 2012.
100
80
60
40
20
0
20
40
60
80
100
2010 2011 2012
Perc
enta
ge
of
stu
den
ts
Perris Elementary School District

Good Hope Elementary School School Accountability Report Card for 2011–2012 Page 10
The graph to the right shows how our students’ scores have changed over the years. We present each year’s results in a vertical bar, with students’ scores arrayed across five proficiency bands. When viewing schoolwide results over time, remember that progress can take many forms. It can be more students scoring in the top proficiency bands (blue); it can also be fewer students scoring in the lower two proficiency bands (brown and red).
The science standards test was administered only to fifth graders. Of course, students in all grade levels study science in these areas: physical science, life science, earth science, and investigation and experimentation. For background, you can review the science standards by going to the CDE’s Web site.
BAR GRAPHS BELOW SHOW THESE PROFICIENCY GROUPS (LEFT TO RIGHT):FAR BELOW BASIC BELOW BASIC BASIC PROFICIENT ADVANCED
Science
GROUP LOW SCORES HIGH SCORES PROFICIENT OR
ADVANCED
STUDENTS TESTED
COMMENTS
SCHOOLWIDE AVERAGE 35% 96% SCHOOLWIDE AVERAGE: About 24 percent fewer students at our school scored Proficient or Advanced than at the average elementary school in California.
AVERAGE ELEMENTARY SCHOOL IN THE COUNTY
56% 92%
AVERAGE ELEMENTARY SCHOOL IN CALIFORNIA
59% 93%
BAR GRAPHS BELOW SHOW TWO PROFICIENCY GROUPS (LEFT TO RIGHT):
FAR BELOW BASIC, BELOW BASIC, AND BASIC PROFICIENT AND ADVANCED
Subgroup Test Scores
GROUP LOW SCORES HIGH SCORES PROFICIENT OR
ADVANCED
STUDENTS TESTED
COMMENTS
Boys 31% 49 GENDER: About ten percent more girls than boys at our school scored Proficient or Advanced.
Girls 41% 44
English proficient 54% 46 ENGLISH PROFICIENCY: English Learners scored lower on the CST than students who are proficient in English. Because we give this test in English, English Learners tend to be at a disadvantage. English Learners 17% 47
Low income 35% 93 INCOME: We cannot compare scores for these two subgroups because the number of students tested who were not from low-income families was either zero or too small to be statistically significant. Not low income NO DATA AVAILABLE N/A N/A
Learning disabled NO DATA AVAILABLE N/A 3 LEARNING DISABILITIES: We cannot compare scores for these two subgroups because the number of students tested with learning disabilities was either zero or too small to be statistically significant. Not learning disabled 37% 90
Hispanic/Latino 35% 85 ETHNICITY: Test scores are likely to vary among students of different ethnic origins. The degree of variance will differ from school to school. Measures of the achievement gap are beyond the scope of this report.
SOURCE: The scores for the CST are from the spring 2012 test cycle. County and state averages represent elementary schools only. Whenever a school reports fewer than 11 scores for a particular subgroup at any grade level, the CDE suppresses the scores when it releases the data to the public. Missing data makes it impossible for us to compile complete schoolwide results. Therefore, the results published in this report may vary from other published CDE test scores.N/A: Not applicable. Either no students took the test, or to safeguard student privacy the CDE withheld all results because very few students took the test in any grade.N/S: Not statistically significant. While we have some data to report, we are suppressing it because the number of valid test scores is not large enough to be meaningful.
Three-Year Trend:
AdvancedProficientBasicBelow BasicFar Below Basic
Science
Percentage of studentswho took the test:2010: 97%2011: 98%2012: 96%
SOURCE: CDE STAR research file: 2010, 2011, and 2012.
100
80
60
40
20
0
20
40
60
80
100
2010 2011 2012
Perc
enta
ge
of
stu
den
ts
Perris Elementary School District

Good Hope Elementary School School Accountability Report Card for 2011–2012 Page 11
Other Measures of Student AchievementTeachers use many different forms of assessment to evaluate students’ skills in the classroom. Informal assessment occurs during every instructional day. Teachers monitor student learning throughout their instruction. Every six-to-eight weeks teachers administer district benchmarks. The data gathered from these tests enables teachers to determine student progress and guide their teaching. In addition, short-cycle assessments are administered every two-to-three weeks to monitor student progress on specific grade-level standards.
In the spring, our school administers the state mandated California Standards Tests. Students in grades two through six are assessed in English language arts and mathematics, and our fourth graders are assessed in writing.
English Learners take the California English Language Development Test (CELDT) each year, and the results are mailed home. This test is used initially to identify English Learners and then to monitor language development. Fourth grade students take the California Writing Assessment each spring. Parents receive progress reports three times a year. During the first reporting period, teachers hold parent conferences.
Perris Elementary School District

Good Hope Elementary School School Accountability Report Card for 2011–2012 Page 12
Students’ English Language SkillsAt Good Hope Elementary, 36 percent of students were considered to be proficient in English, compared with 70 percent of elementary school students in California overall.
Languages Spoken atHome by English LearnersPlease note that this table describes the home languages of just the 453 students classified as English Learners. At Good Hope Elementary, the language these students most often speak at home is Spanish. In California it’s common to find English Learners in classes with students who speak English well. When you visit our classrooms, ask our teachers how they work with language differences among their students.
EthnicityMost students at Good Hope Elementary identify themselves as Hispanic/Latino. In fact, there are about 23 times as many Hispanic/Latino students as White students, the second-largest ethnic group at Good Hope Elementary. The state of California allows citizens to choose more than one ethnic identity, or to select “two or more races” or “decline to state.” As a consequence, the sum of all responses rarely equals 100 percent.
Family Income and EducationThe free or reduced-price meal subsidy goes to students whose families earned less than $41,348 a year (based on a family of four) in the 2011-2012 school year. At Good Hope Elementary, 92 percent of the students qualified for this program, compared with 58 percent of students in California.
The parents of 18 percent of the students at Good Hope Elementary have attended college and two percent have a college degree. This information can provide some clues to the level of literacy children bring to school. One precaution is that the students themselves provide this data when they take the battery of standardized tests each spring, so it may not be completely accurate. About 69 percent of our students provided this information.
STUDENTS
LANGUAGE SKILLSOUR
SCHOOLCOUNTYAVERAGE
STATEAVERAGE
English-proficient students 36% 71% 70%
English Learners 64% 29% 30%
SOURCE: Language census for the 2011–2012 school year. County and state averages represent elementary schools only.
LANGUAGEOUR
SCHOOLCOUNTYAVERAGE
STATEAVERAGE
Spanish 99% 95% 84%
Vietnamese 0% 1% 3%
Cantonese 0% 0% 1%
Hmong 0% 0% 1%
Filipino/Tagalog 0% 1% 1%
Korean 0% 0% 1%
Khmer/Cambodian 0% 0% 0%
All other 1% 3% 9%
SOURCE: Language census for the 2011–2012 school year. County and state averages represent elementary schools only.
ETHNICITYOUR
SCHOOLCOUNTYAVERAGE
STATEAVERAGE
African American 3% 6% 6%
Asian American/Pacific Islander
0% 5% 11%
Hispanic/Latino 92% 62% 53%
White 4% 24% 25%
SOURCE: California Longitudinal Pupil Achievement Data System (CALPADS), October 2011. County and state averages represent elementary schools only.
FAMILY FACTORSOUR
SCHOOLCOUNTYAVERAGE
STATEAVERAGE
Low-income indicator 92% 62% 58%
Parents with some college 18% 53% 57%
Parents with college degree 2% 25% 33%
SOURCE: The free and reduced-price lunch information is gathered by most districts in October. This data is from the 2011–2012 school year. Parents’ education level is collected in the spring at the start of testing. Rarely do all students answer these questions.
Perris Elementary School District

Good Hope Elementary School School Accountability Report Card for 2011–2012 Page 13
Average Class SizesBecause funding for class-size reduction was focused on the early grade levels, our school’s class sizes, like those of most elementary schools, differ across grade levels.
The average class size at Good Hope Elementary varies across grade levels from a low of 18 students to a high of 25. Our average class size schoolwide is 22 students. The average class size for elementary schools in the state is 22 students.
SafetySafety is an important focus at Good Hope Elementary School. Our policies ensure a safe and secure campus. Playground supervisors monitor student activities and enforce school rules. We maintain a closed campus. We welcome parents and guardians on campus and require all visitors to sign in at the office and wear a visitor’s badge.
Good Hope Elementary has a safety plan that is updated annually by the site emergency preparedness committee. Staff members are instructed on the essential components. All students and staff practice monthly fire and earthquake drills. This includes duck and cover and evacuation drills. We practice our complete schoolwide disaster plan annually. We maintain an accessible storage unit on campus with the supplies necessary for an emergency.
DisciplineWe have a schoolwide discipline plan. At the beginning of the year, student assemblies address appropriate behavior expectations through Positive Behavior Support. We work toward teaching students social skills, leading by example, and providing positive reinforcement. Teachers handle most disciplinary issues in their classrooms; severe offenses are referred to the office. Consequences for poor behavior can include in-school suspension, formal suspension, or loss of privileges. We use expulsion only in extreme situations. In addition, teachers make their own classroom behavior rules, which include a system of rewards and consequences.
Through our school’s positive recognition program, ACE, we honor students for Academics, Citizenship, and Effort. The principal presents these awards at monthly assemblies. We also recognize students when they are ‘caught’ being good by rewarding them with Mighty Mustang Dollars. Our honor roll recognizes students in grades three through six based on report card grades issued every trimester.
HomeworkEach teacher is responsible for providing homework on a daily or weekly basis. Many teachers send home a packet on Monday for students to complete during the week. Teachers also require students to read at home and, at times, to work on extended projects. In March students complete a science fair project. Teachers provide information to parents and students about this activity, which can be completed at home.
ScheduleWe have a 175-day modified traditional schedule. The instructional day is 8 a.m. to 2:15 p.m. for students in grades one through six. Kindergarten students follow the morning 8 a.m. to 1:05 p.m. extended day schedule. Every Tuesday is an early dismissal day, and all classes end one hour earlier. Office hours are from 7:30 a.m. to 3:30 p.m. We offer a breakfast and lunch program. Classes after school are offered to students who need extra help academically, and every Friday we hold a schoolwide assembly before school.
CLIMATE FOR LEARNING
AVERAGE CLASS SIZE BY GRADEOUR
SCHOOLOUR
DISTRICT
Kindergarten 21 23
First grade 21 23
Second grade 18 23
Third grade 20 21
Fourth grade 24 25
Fifth grade 24 26
Sixth grade 25 28
SOURCE: California Department of Education, SARC Research File. District averages represent elementary schools only.
Perris Elementary School District

Good Hope Elementary School School Accountability Report Card for 2011–2012 Page 14
Parent InvolvementGood Hope Elementary School welcomes parent and community involvement. Parents can join our SSC, which works with the principal and teachers to make school decisions. Parents of English Learners are vital to our ELAC. Our newly formed GHV always needs parents willing to help with school activities. Parents assist teachers on field trips, in the classroom, and during schoolwide activities. Newsletters and other written communications encourage family involvement. Please call Good Hope at (951) 657-5181 to find out how you can volunteer at our school.
Good Hope Elementary School has recently formed FIAT, which focuses on schoolwide academic goals. This group is made up of staff, family, and community volunteers who offer support in assisting our students with achieving high academic standards.
Perris Elementary School District

Good Hope Elementary School School Accountability Report Card for 2011–2012 Page 15
LeadershipMs. Mallory, our principal, has ten years of experience in the field of education, four years as a teacher, and six years as a site administrator.
Many groups help to make decisions that affect our school. Parents, staff, and the principal form the SSC, which makes many important decisions based on the school plan. Our ELAC includes many parents of English Learners, one bilingual teacher, and the assistant principal. This committee gives input to the SSC. Grade-level leaders make up the school Leadership Team. This team works with the principal and assistant principal to make decisions at our school. Teachers help to determine schoolwide goals and make decisions that affect daily instruction. They also give input to the SSC, as appropriate. Our FIAT is a team of parents and staff who help support the academic learning of our students at Good Hope. Our GHV assists with fund-raising activities and social events that help unite the Good Hope staff and the Perris community.
This year, we started an event called “Coffee with the Principal”. This is a time for community stakeholders to join Ms. Mallory to discuss questions, concerns, and/or ideas to improve student learning.
PLEASE NOTE: Comparative data (county average and state averages) for some of the data reported in the SARC is unavailable as of November 2012.
“HIGHLY QUALIFIED” TEACHERS: The federal law known as No Child Left Behind (NCLB) requires districts to report the number of teachers considered to be “highly qualified.” These “highly qualified” teachers must have a full credential, a bachelor’s degree, and, if they are teaching a core subject (such as reading, math, science, or social studies), they must also demonstrate expertise in that field. The table above shows the percentage of core courses taught by teachers who are considered to be less than “highly qualified.” There are exceptions, known as the High Objective Uniform State Standard of Evaluation (HOUSSE) rules, that allow some veteran teachers to meet the “highly qualified” test who wouldn’t otherwise do so.
CREDENTIAL STATUS OF TEACHERS: Teachers who lack full credentials are working under the terms of an emergency permit, an internship credential, or a waiver. They should be working toward their credential, and they are allowed to teach in the meantime only if the school board approves. None of our teachers was working without full credentials.
More facts about our teachers, called for by the Williams legislation of 2004, are available on our Accountability Web page, which is accessible from our district Web site. You will find specific facts about misassigned teachers
and teacher vacancies in the 2012–2013 school year.
LEADERSHIP, TEACHERS, AND STAFF
Indicators of Teachers Who May Be Underprepared
KEY FACTOR DESCRIPTIONOUR
SCHOOLCOUNTYAVERAGE
STATEAVERAGE
Core courses taught by a teacher not meeting NCLB standards
Percentage of core courses not taught by a “highly qualified” teacher according to federal standards in NCLB
0% N/A 0%
Fully credentialed teachers
Percentage of staff holding a full, clear authorization to teach at the elementary or secondary level
100% N/A N/A
Teachers lacking a full credential
Percentage of teachers without a full, clear credential
0% N/A N/A
SOURCE: This information provided by the school district. Data on NCLB standards is from the California Department of Education, SARC research file.
Perris Elementary School District

Good Hope Elementary School School Accountability Report Card for 2011–2012 Page 16
Districtwide Distribution of Teachers Who Are Not “Highly Qualified”Here, we report the percentage of core courses in our district whose teachers are considered to be less than “highly qualified” by NCLB’s standards. We show how these teachers are distributed among schools according to the percentage of low-income students enrolled.
When more than 40 percent of the students in a school are receiving subsidized lunches, that school is considered by the California Department of Education to be a school with higher concentrations of low-income students. About 70 percent of the state’s schools are in this category. When less than 25 percent of the students in a school are receiving subsidized lunches, that school is considered by the CDE to be a school with lower concentrations of low-income students. About 19 percent of the state’s schools are in this category.
DISTRICT FACTOR DESCRIPTION
CORE COURSES
NOT TAUGHT BY
HQT IN DISTRICT
Districtwide Percentage of core courses not taught by “highly qualified” teachers (HQT)
0%
Schools with more than 40% of students from lower-income homes
Schools whose core courses are not taught by “highly qualified” teachers
0%
Schools with less than 25% of students from lower-income homes
Schools whose core courses are not taught by “highly qualified” teachers
0%
SOURCE: Data is from the California Department of Education, SARC research file.
Perris Elementary School District

Good Hope Elementary School School Accountability Report Card for 2011–2012 Page 17
Staff DevelopmentOur teachers receive staff development in the areas of direct instruction, student engagement, and increasing rigor. The principal, assistant principal, and coach are support systems for the teachers during the implementation of these components.
The district has also provided a Universal Design training focused on strategies to increase student engagement while addressing all language needs.
Evaluating and Improving TeachersThe principal and assistant principal observes all teachers regularly, according to state laws. The district requires annual evaluation of probationary teachers. Permanent-status teachers are evaluated every other year. Teachers who need assistance receive a written plan for addressing areas of concern. Beginning teachers can benefit from peer observations and mentor teachers, who provide help with curriculum planning, student assessment, and classroom organization and discipline.
Substitute TeachersThe district recruits substitute teachers. We provide training for substitutes on a variety of topics. There is a process in place for requesting substitutes. When we cannot find a substitute for a class, the students are divided among the other classrooms of the same grade level. Teachers are required to have detailed lesson plans that substitutes can follow, thereby minimizing loss of learning time.
Specialized Resource StaffThe table to the right lists the number of full-time equivalent qualified support personnel who provide counseling and other pupil support services in our school. These specialists often work part time at our school and some may work at more than one school in our district. For more details on statewide ratios of counselors, psychologists, or other pupil
services staff to students, see the California Department of Education (CDE) Web site. Library facts and frequently asked questions are also available there.
YEARPROFESSIONAL
DEVELOPMENT DAYS
2011–2012 0.0
2010–2011 0.0
2009–2010 N/A
SOURCE: This information is supplied by the school district.
STAFF POSITIONSTAFF (FTE)
Academic counselors 0.0
Behavioral/career counselors
0.0
Librarians and media staff
0.0
Psychologists 0.0
Social workers 0.0
Nurses 0.0
Speech/language/hearing specialists
1.0
Resource specialists 0.0
SOURCE: Data provided by the school district.
Perris Elementary School District

Good Hope Elementary School School Accountability Report Card for 2011–2012 Page 18
Specialized Programs and StaffA nurse is on campus one to two days a week and is always on call for emergencies. We provide special education services and have an educational specialist, a speech-and-language specialist, and one Special Day Class teacher and one Learning Center teacher.
This year we will provide Supplemental Educational Support, a tutoring program, which last year served approximately 80 students. The tutors came from community groups interested in tutoring students. Parents and/or guardians completed an application and selected a tutor from a list provided. Students were selected using a process established by the district.
We offer an afterschool program called SHINE (Students Headed for Independence, Knowledge, and Excellence). The program provides enrichment opportunities, tutoring, and homework help for students. The program serves approximately 90 students and operates from after school day until 6 p.m.every school day.
Gifted and Talented Education (GATE)Our Gifted and Talented Education (GATE) program is designed to enrich and expand the education of students who exhibit higher-level thinking skills, intellectual curiosity, creativity, and a positive self-concept as well as an understanding and appreciation of the needs of others. We identify possible GATE students in grades three through six on the basis of various criteria. We group GATE students together in their classrooms where they receive specialized and customized instruction. Our reading program specifically provides challenging lessons and activities. All GATE students can participate in GATE academies that are offered by the district and taught by credentialed teachers.
Special Education ProgramWe have a full-time Education Specialist teacher and one assistant to work with our special education students. We have a half-time speech therapist and a school psychologist on campus two and a half days a week.
There are two Special Day Classes on our campus that follow the inclusion model: a kindergarten through second grade class and a third through sixth grade Learning Center class. Each class has a credentialed special education teacher and two instructional assistants. Students in special education classrooms use the same curriculum as other students; instruction is modified according to Individualized Education Programs (IEPs).
English Learner ProgramAll English Learners are taught by teachers who have credentials in Cross-cultural Language and Academic Development (CLAD). All English Learners receive English Language Development (ELD) instruction at their ELD level for 30 minutes per day. In addition, all teachers use strategies to make learning comprehensible for English Learners, which has been the focus of staff development this year.
Bilingual instructional assistants help English Learners in the classroom. We provide extra support for English Learners and newcomers to work on oral language skills until they can successfully work independently in the classroom. We encourage the parents of English Learners to join our ELAC and participate in our various workshops and programs.
This year, we are continuing to increase our emphasis on implementing strategies that improve student achievement for all subgroups, especially our English Learners. Our teachers are trained in Universal Design strategies intended to encourage language development. They are also identifying specific language domains in which students require additional support. By targeting instruction in these domains, teachers will provide the necessary support for students to attaining at least one level of improvement in English language proficiency.
Perris Elementary School District

Good Hope Elementary School School Accountability Report Card for 2011–2012 Page 19
BuildingsOur campus is more than 40 years old. Overall, Good Hope Elementary School is in good condition, and we provide regular maintenance and improve such things as roofs and rest room facilities and fixtures. We have replaced exterior wooden siding and many classroom carpets. We recently finished painting the campus. We receive excellent support from the district maintenance department for larger projects. A district team and assigned staff at the school monitor the facilities on an ongoing basis.
In 2008–2009 six new classrooms were added to our campus. Eight-foot fencing and an electric gate were added to enhance campus safety and security. New air-conditioning, new roofing, re-asphalting, and new cement work enhanced our campus. We have already completed the renovation of our cafeteria/multipurpose room, which included new flooring and a sound system.
During the summer of 2009, we remodeled our school’s restrooms. During the summer of 2012, our school received some improvements to the existing plaster and paint throughout the school.
More facts about the condition of our school buildings are available in an online supplement to this report called for by the Williams legislation of 2004. What you will find is an assessment of more than a dozen aspects of our buildings: their structural integrity, electrical systems, heating and ventilation systems, and more. The important purpose of this assessment is to determine if our buildings and grounds are safe and in good repair. If anything needs to be repaired, this assessment identifies it and targets a date by which we commit to make those repairs. The guidelines for this assessment were written by the Office of Public School Construction (OPSC) and were brought about by the Williams legislation. You can look at the six-page Facilities Inspection Tool used for the assessment on the Web site of the OPSC.
LibraryWe have a large library and a half-time media clerk. Teachers bring their classes to the library so that students can check out books to read in class and at home. Students also use the library for research projects, and there is a resource area for teachers. We receive an annual allocation of money to purchase books.
ComputersInternet-connected computers are available in the computer lab. We provide support for students who need extra help, and we use the computer lab to help them practice reading and fluency skills. All classrooms have computers with Internet access. All staff members have access to the Internet, and each teacher has an email address. This year all classrooms were equipped with laptops, document readers and projectors.
TextbooksWe choose our textbooks from lists that have already been approved by state education officials. For a list of some of the textbooks we use at our school, see the Data Almanac that accompanies this report.
We have also reported additional facts about our textbooks called for by the Williams legislation of 2004. This online report shows whether we had a textbook for each student in each core course during the 2012–2013 school year and whether those textbooks covered the California Content Standards.
CurriculumFor many years, panels of scholars have decided what California students should learn and be able to do. Their decisions are known as the California Content Standards, and they apply to all public schools in the state. The textbooks we use and the tests we give are based on these content standards, and we expect our teachers to be firmly focused on them. Policy experts, researchers, and educators consider our state’s standards to be among the most rigorous and challenging in the nation.
You can find information about the content standards for each subject at each grade level on the Web site of the California Department of Education (CDE). California adopted new Common Core Standards for English/language arts and math in August 2010. However, the full implementation of those standards is still a few years off. Please refer to the CDE FAQs for details about the new standards.
RESOURCES
Perris Elementary School District

Good Hope Elementary School School Accountability Report Card for 2011–2012 Page 20
We receive both state and federal funding. Federal funding was used to fund our program resource clerk and bilingual instructional assistants. Additional funding provides for staff training, instructional materials for the classrooms, parent education, and afterschool classes for students who need extra help. There are also funds in a school/library grant that are used primarily for instructional materials and library books for the school library. A schoolwide fund-raiser provides support for field trips, schoolwide incentives, student rewards, Red Ribbon Week activities, assemblies, and end-of-the-year activities.
Spending per Student (2010–2011)To make comparisons possible across schools and districts of varying sizes, we first report our overall spending per student. We base our calculations on our average daily attendance (ADA), which was 698 students.
We’ve broken down expenditures by the type of funds used to pay for them. Unrestricted funds can be used for any lawful purpose. Restricted funds, however, must be spent for specific purposes set out by legal requirements or the donor. Examples include funding for instructional materials, economic impact aid, and teacher- and principal-training funds.
Total Expenditures, by Category (2010–2011)Here you can see how much we spent on different categories of expenses. We’re reporting the total dollars in each category, not spending per student.
SCHOOL EXPENDITURES
TYPE OF FUNDS OUR SCHOOLDISTRICT
AVERAGE *SCHOOL
VARIANCESTATE
AVERAGESCHOOL
VARIANCE
Unrestricted funds ($/student) $4,455 $5,588 -20% $5,434 -18%
Restricted funds ($/student) $1,877 $2,145 -12% $2,889 -35%
TOTAL ($/student) $6,332 $7,733 -18% $8,323 -24%
SOURCE: Information provided by the school district. * Districts allocate most of their costs to school sites and attribute other costs to the district office. When calculating the district average for school level spending per student, we include these district related costs in the denominator. This will often cause most schools to fall below the district average.
CATEGORYUNRESTRICTED
FUNDSRESTRICTED
FUNDS TOTALPERCENTAGE OF
TOTAL*
Teacher salaries (all certificated staff) $2,021,151 $688,464 $2,709,615 61%
Other staff salaries $337,226 $74,632 $411,858 9%
Benefits $681,853 $191,797 $873,650 20%
Books and supplies $57,381 $244,326 $301,707 7%
Equipment replacement N/A N/A N/A N/A
Services and direct support $11,886 $111,103 $122,989 3%
TOTAL $3,109,497 $1,310,322 $4,419,819
SOURCE: Information provided by the school district. * Totals may not add up to exactly 100% because of rounding.
Perris Elementary School District

Good Hope Elementary School School Accountability Report Card for 2011–2012 Page 21
Compensation per Staff with Teaching Credentials (2010–2011)The total of what our certificated staff members earn appears below. A certificated staff person is a school employee who is required by the state to hold teaching credentials, including full-time, part-time, substitute or temporary teachers, and most administrators. You can see the portion of pay that goes to salary and three types of benefits.
To make comparisons possible across schools and districts of varying sizes, we first report our compensation per full-time equivalent (FTE) certificated staff member. A teacher/administrator/pupil services person who works full time counts as 1.0 FTE. Those who work only half time count as 0.5 FTE. We had 38 FTE teachers working in our school.
Total Certificated Staff Compensation (2010–2011)Here you can see how much we spent on different categories of compensation. We’re reporting the total dollars in each category, not compensation per staff member.
CATEGORY OUR SCHOOLDISTRICT
AVERAGE *SCHOOL
VARIANCESTATE
AVERAGESCHOOL
VARIANCE
Salaries $71,306 $74,280 -4% $74,075 -4%
Retirement benefits $5,724 $6,013 -5% $6,062 -6%
Health and medical benefits $7,989 $8,314 -4% $10,417 -23%
Other benefits N/A $27 N/A $635 N/A
TOTAL $85,018 $88,635 -4% $91,189 -7%
SOURCE: Information provided by the school district.* Districts allocate most of their staff costs to school sites, but attribute other staff costs to the district office. One example is a reading resource teacher or librarian who works at all school sites. When calculating the district average for compensation per staff member, we include these district related costs in the denominator. This will often cause most schools to fall below the district average.
CATEGORY TOTALPERCENTAGE OF TOTAL*
Salaries $2,709,615 84%
Retirement benefits $217,498 7%
Health and medical benefits $303,564 9%
Other benefits N/A N/A
TOTAL $3,230,677
SOURCE: Information provided by the school district. * Totals may not add up to exactly 100% because of rounding.
TECHNICAL NOTE ON DATA RECENCY: All data is the most current available as of November 2012. The CDE may releaseadditional or revised data for the 2011–2012 school year after the publication date of this report. We rely on the followingsources of information from the California Department of Education: California Longitudinal Pupil Achievement Data System(CALPADS) (October 2011); Language Census (March 2012); California Standards Tests (spring 2012 test cycle); AcademicPerformance Index (November 2012 growth score release); Adequate Yearly Progress (October 2012). DISCLAIMER: School Wise Press, the publisher of this accountability report, makes every effort to ensure the accuracy of thisinformation but offers no guarantee, express or implied. While we do our utmost to ensure the information is complete, wemust note that we are not responsible for any errors or omissions in the data. Nor are we responsible for any damages caused bythe use of the information this report contains. Before you make decisions based on this information, we strongly recommendthat you visit the school and ask the principal to provide the most up-to-date facts available.
rev20121213_33-67199-6032502e/20093
Perris Elementary School District

Good Hope Elementary School School Accountability Report Card for 2011–2012 Page 22
Perris Elementary School District

Good Hope Elementary School School Accountability Report Card for 2011–2012
»
Page 23
Adequacy of Key Resources 2012�2013
Here you’ll find key facts about our teachers, textbooks, and facilities during the school year in progress, 2012–2013. Please note that these facts are based on evaluations our staff conducted in accordance with the Williams legislation.
Perris Elementary School District

Good Hope Elementary School School Accountability Report Card for 2011–2012
Perris Elementary School District
TEACHERS
Teacher Vacancies
The Williams legislation asked districts to disclose how frequently full-time teachers were not permanently assigned to a classroom. There are two general circumstances that can lead to the unfortunate case of a classroom without a full-time, permanently assigned teacher. Within the first 20 days of the start of school, we can be surprised by too many students showing up for school, or too few teachers showing up to teach. After school starts, however, teachers can also be surprised by sudden changes: family emergencies, injuries, accidents, etc. When that occurs, it is our school’s and our district’s responsibility to fill that teacher’s vacancy with a qualified, full-time and permanently assigned replacement. For that reason, we report teacher vacancies in two parts: at the start of school, and after the start of school.
KEY FACTOR 2010–2011 2011–2012 2012–2013
TEACHER VACANCIES OCCURRING AT THE BEGINNING OF THE SCHOOL YEAR
Total number of classes at the start of the year 39 34 34
Number of classes which lacked a permanently assigned teacher within the first 20 days of school
0 0 0
TEACHER VACANCIES OCCURRING DURING THE SCHOOL YEAR
Number of classes where the permanently assigned teacher left during the year
0 0 0
Number of those classes where you replaced the absent teacher with a single new teacher
0 0 0
NOTES: This report was completed on Thursday, October 11, 2012.
Page 24

Good Hope Elementary School School Accountability Report Card for 2011–2012
Perris Elementary School District
Teacher Misassignments
A “misassigned” teacher is one who lacks the appropriate subject-area authorization for a class she is teaching.
Under the terms of the Williams settlement, schools must inform the public of the number of their teachers who are misassigned. It is possible for a teacher who lacks the authorization for a subject to get special permission—in the form of an emergency permit, waiver, or internship authorization—from the school board or county office of education to teach the subject anyway. This permission prevents the teacher from being counted as misassigned.
KEY FACTOR DESCRIPTION 2010–2011 2011–2012 2012–2013
Teacher Misassignments
Total number of classes taught by teachers without a legally recognized certificate or credential
0 0 0
Teacher Misassignments in Classes that Include English Learners
Total number of classes that include English learners and are taught by teachers without CLAD/BCLAD authorization, ELD or SDAIE training, or equivalent authorization from the California Commission on Teacher Credentialing
0 0 0
Other Employee Misassignments
Total number of service area placements of employees without the required credentials
0 0 0
NOTES: This report was completed on Thursday, October 11, 2012.
Page 25

Good Hope Elementary School School Accountability Report Card for 2011–2012
Perris Elementary School District
TEXTBOOKS
The main fact about textbooks that the Williams legislation calls for described whether schools have enough books in core classes for all students. The law also asks districts to reveal whether those books are presenting what the California content standards calls for. This information is far more meaningful when viewed along with the more detailed description of textbooks contained in our School Accountability Report Card (SARC). There you’ll find the names of the textbooks used in our core classes, their dates of publication, the names of the firms that published them, and more.
ARE THERE TEXTBOOKS OR INSTRUCTIONAL MATERIALS IN USE?
ARE THERE ENOUGH BOOKS FOR EACH STUDENT?
SUBJECT STANDARDS ALIGNED?
FROM THE MOST RECENT OFFICIAL
ADOPTION? FOR USE IN CLASS?
PERCENTAGE OF STUDENTS HAVING
BOOKS TO TAKE HOME?
English Yes Yes Yes 100%
Math Yes Yes Yes 100%
Science Yes Yes Yes 100%
Social Studies Yes Yes Yes 100%
NOTES: This report was completed on Tuesday, October 30, 2012. This information was collected on Tuesday, October 30, 2012.
Page 26
Good Hope Elementary School School Accountability Report Card for 2011–2012
Perris Elementary School District
FACILITIES
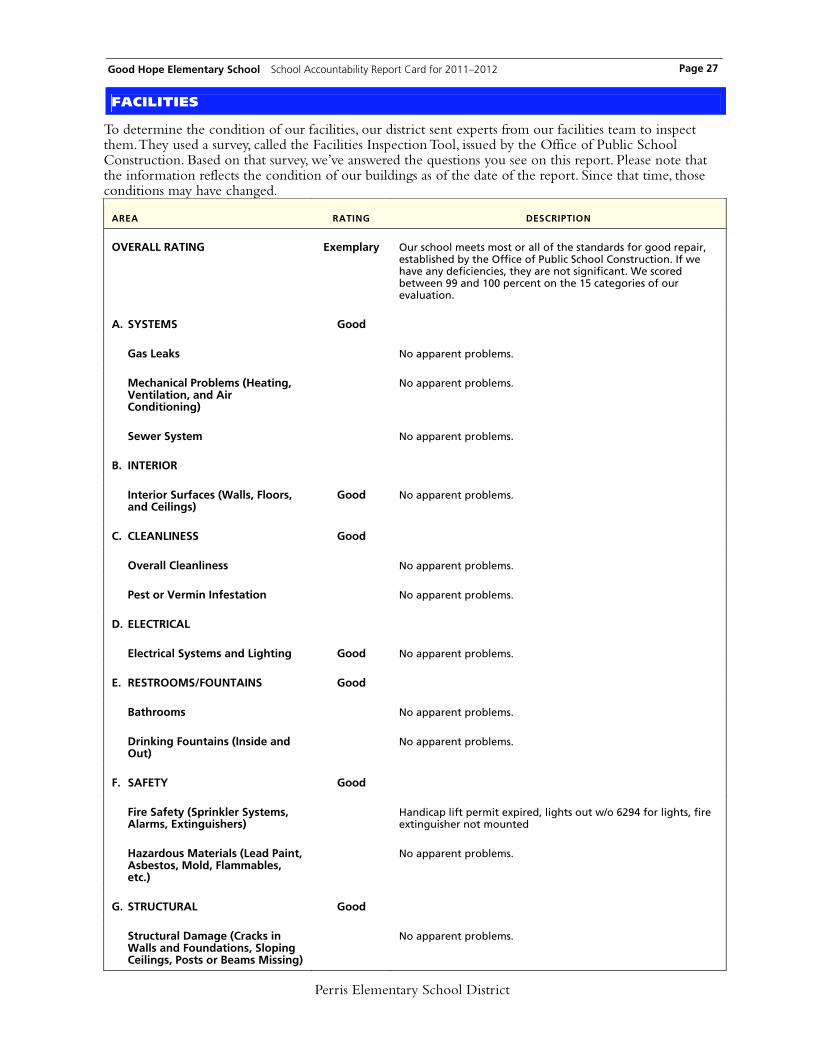
To determine the condition of our facilities, our district sent experts from our facilities team to inspect them. They used a survey, called the Facilities Inspection Tool, issued by the Office of Public School Construction. Based on that survey, we’ve answered the questions you see on this report. Please note that the information reflects the condition of our buildings as of the date of the report. Since that time, those conditions may have changed.
AREA RATING DESCRIPTION
OVERALL RATING Exemplary Our school meets most or all of the standards for good repair, established by the Office of Public School Construction. If we have any deficiencies, they are not significant. We scored between 99 and 100 percent on the 15 categories of our evaluation.
A. SYSTEMS Good
Gas Leaks No apparent problems.
Mechanical Problems (Heating, Ventilation, and Air Conditioning)
No apparent problems.
Sewer System No apparent problems.
B. INTERIOR
Interior Surfaces (Walls, Floors, and Ceilings)
Good No apparent problems.
C. CLEANLINESS Good
Overall Cleanliness No apparent problems.
Pest or Vermin Infestation No apparent problems.
D. ELECTRICAL
Electrical Systems and Lighting Good No apparent problems.
E. RESTROOMS/FOUNTAINS Good
Bathrooms No apparent problems.
Drinking Fountains (Inside and Out)
No apparent problems.
F. SAFETY Good
Fire Safety (Sprinkler Systems, Alarms, Extinguishers)
Handicap lift permit expired, lights out w/o 6294 for lights, fire extinguisher not mounted
Hazardous Materials (Lead Paint, Asbestos, Mold, Flammables, etc.)
No apparent problems.
G. STRUCTURAL Good
Structural Damage (Cracks in Walls and Foundations, Sloping Ceilings, Posts or Beams Missing)
No apparent problems.
Page 27
Good Hope Elementary School School Accountability Report Card for 2011–2012
Perris Elementary School District
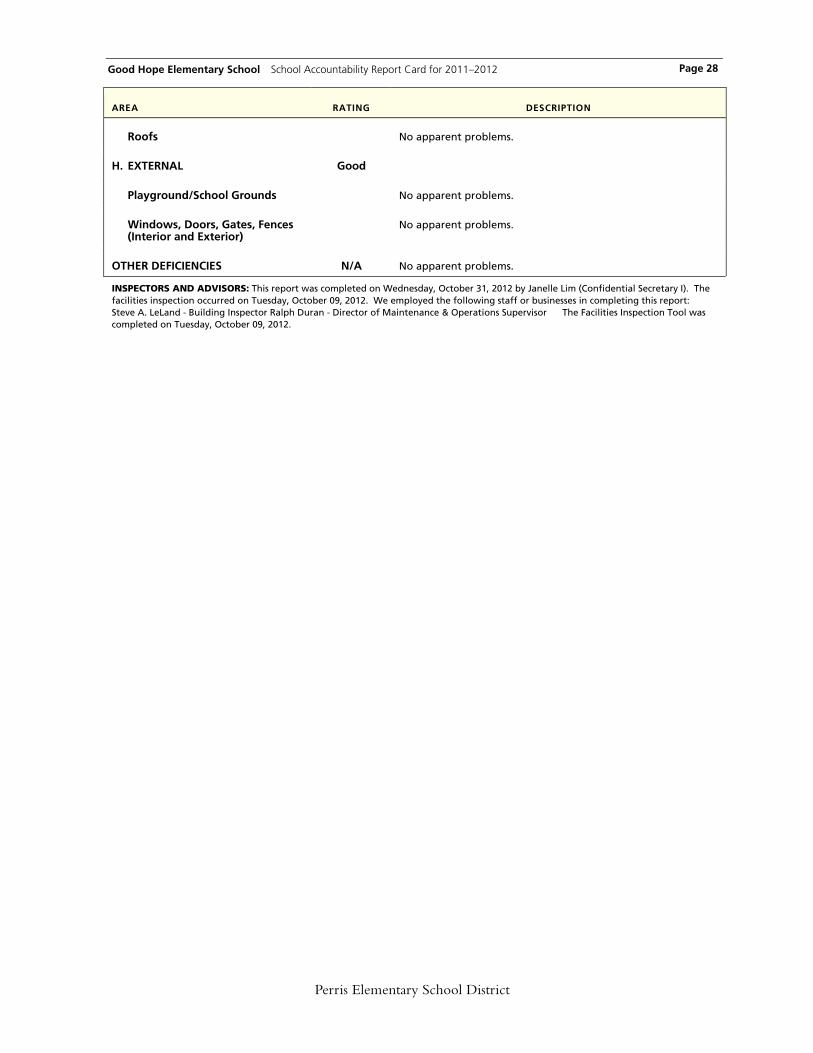
AREA RATING DESCRIPTION
Roofs No apparent problems.
H. EXTERNAL Good
Playground/School Grounds No apparent problems.
Windows, Doors, Gates, Fences (Interior and Exterior)
No apparent problems.
OTHER DEFICIENCIES N/A No apparent problems.
INSPECTORS AND ADVISORS: This report was completed on Wednesday, October 31, 2012 by Janelle Lim (Confidential Secretary I). The facilities inspection occurred on Tuesday, October 09, 2012. We employed the following staff or businesses in completing this report: Steve A. LeLand - Building Inspector Ralph Duran - Director of Maintenance & Operations Supervisor The Facilities Inspection Tool was completed on Tuesday, October 09, 2012.
Page 28

Good Hope Elementary School School Accountability Report Card for 2011–2012
»
Page 29
Data Almanac
This Data Almanac provides additional information about students, teachers, student performance, accountability, and district expenditures.
Perris Elementary School District
Good Hope Elementary School School Accountability Report Card for 2011–2012 Page 30
STUDENTS AND TEACHERS
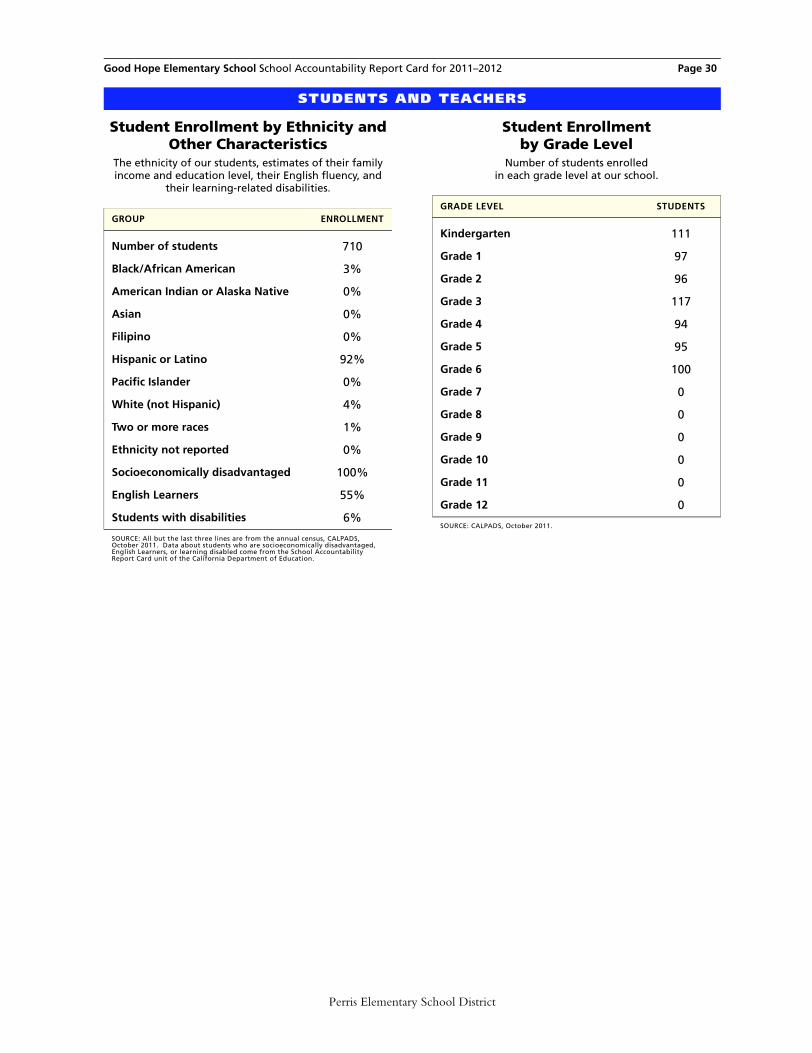
Student Enrollment by Ethnicity and Other Characteristics
The ethnicity of our students, estimates of their family income and education level, their English fluency, and
their learning-related disabilities.
Student Enrollment by Grade Level
Number of students enrolled in each grade level at our school.
GROUP ENROLLMENT
Number of students 710
Black/African American 3%
American Indian or Alaska Native 0%
Asian 0%
Filipino 0%
Hispanic or Latino 92%
Pacific Islander 0%
White (not Hispanic) 4%
Two or more races 1%
Ethnicity not reported 0%
Socioeconomically disadvantaged 100%
English Learners 55%
Students with disabilities 6%
SOURCE: All but the last three lines are from the annual census, CALPADS, October 2011. Data about students who are socioeconomically disadvantaged, English Learners, or learning disabled come from the School Accountability Report Card unit of the California Department of Education.
GRADE LEVEL STUDENTS
Kindergarten 111
Grade 1 97
Grade 2 96
Grade 3 117
Grade 4 94
Grade 5 95
Grade 6 100
Grade 7 0
Grade 8 0
Grade 9 0
Grade 10 0
Grade 11 0
Grade 12 0
SOURCE: CALPADS, October 2011.
Perris Elementary School District

Good Hope Elementary School School Accountability Report Card for 2011–2012 Page 31
Average Class Size by Grade Level
Average Class Size by Grade Level, DetailThe number of classrooms that fall into each range of class sizes.
GRADE LEVEL 2009–2010 2010–2011 2011–2012
Kindergarten 19 17 21
Grade 1 21 21 21
Grade 2 18 20 18
Grade 3 20 20 20
Grade 4 24 25 24
Grade 5 31 24 24
Grade 6 33 28 25
Grade 7 N/A N/A N/A
Grade 8 N/A N/A N/A
Combined K–3 N/A N/A N/A
Combined 3–4 N/A N/A N/A
Combined 4–8 N/A N/A N/A
Other N/A N/A N/A
SOURCE: CALPADS, October 2011. Information for 2009-2010 provided by the school district.
2009–2010 2010–2011 2011–2012
GRADE LEVEL 1–20 21–32 33+ 1–20 21–32 33+ 1–20 21–32 33+
Kindergarten 6 0 0 5 0 0 1 5 0
Grade 1 3 4 0 5 0 0 4 0 0
Grade 2 6 0 0 8 0 0 5 0 0
Grade 3 4 2 0 5 0 0 6 0 0
Grade 4 0 6 0 0 4 0 0 4 0
Grade 5 0 3 1 0 5 0 0 4 0
Grade 6 0 4 0 0 4 0 0 4 0
Combined K–3 0 0 0 N/A N/A N/A N/A N/A N/A
Combined 3–4 0 0 0 N/A N/A N/A N/A N/A N/A
Combined 4–8 0 0 0 N/A N/A N/A N/A N/A N/A
Other 0 0 0 N/A N/A N/A N/A N/A N/A
SOURCE: CALPADS, October 2011. Information for 2009-2010 provided by the school district.
Perris Elementary School District
Good Hope Elementary School School Accountability Report Card for 2011–2012 Page 32
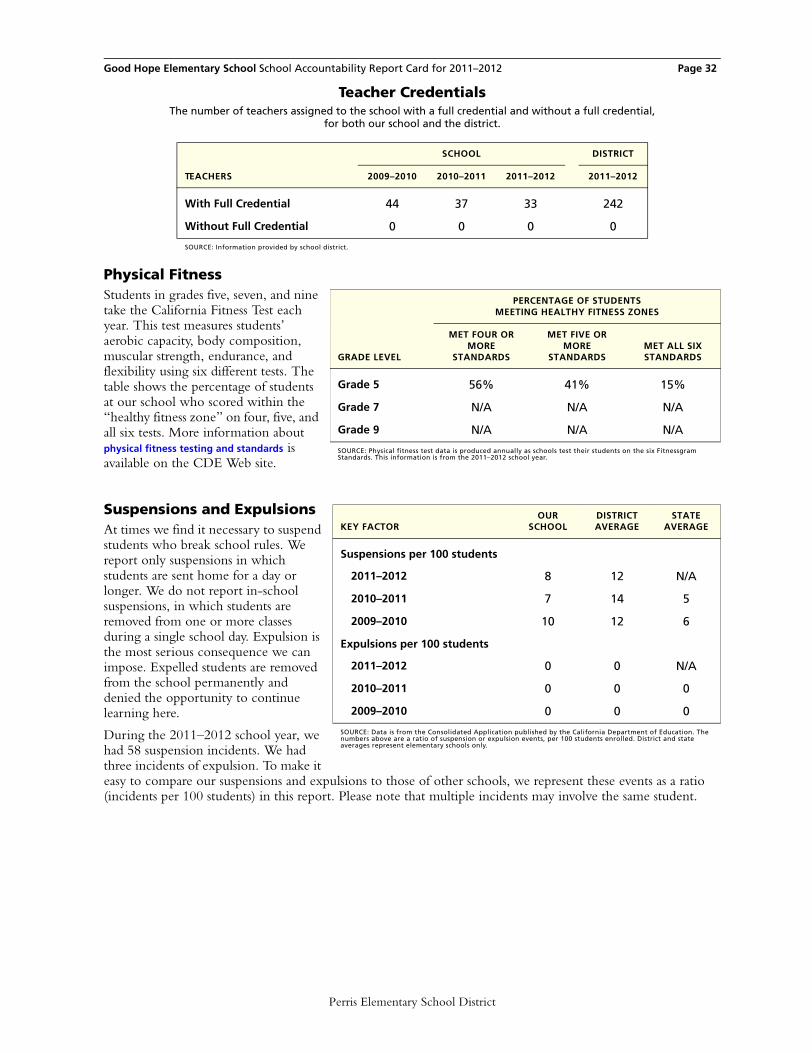
Teacher CredentialsThe number of teachers assigned to the school with a full credential and without a full credential,
for both our school and the district.
Physical FitnessStudents in grades five, seven, and nine take the California Fitness Test each year. This test measures students’ aerobic capacity, body composition, muscular strength, endurance, and flexibility using six different tests. The table shows the percentage of students at our school who scored within the “healthy fitness zone” on four, five, and all six tests. More information about physical fitness testing and standards is available on the CDE Web site.
Suspensions and ExpulsionsAt times we find it necessary to suspend students who break school rules. We report only suspensions in which students are sent home for a day or longer. We do not report in-school suspensions, in which students are removed from one or more classes during a single school day. Expulsion is the most serious consequence we can impose. Expelled students are removed from the school permanently and denied the opportunity to continue learning here.
During the 2011–2012 school year, we had 58 suspension incidents. We had three incidents of expulsion. To make it easy to compare our suspensions and expulsions to those of other schools, we represent these events as a ratio (incidents per 100 students) in this report. Please note that multiple incidents may involve the same student.
SCHOOL DISTRICT
TEACHERS 2009–2010 2010–2011 2011–2012 2011–2012
With Full Credential 44 37 33 242
Without Full Credential 0 0 0 0
SOURCE: Information provided by school district.
PERCENTAGE OF STUDENTS MEETING HEALTHY FITNESS ZONES
GRADE LEVEL
MET FOUR OR MORE
STANDARDS
MET FIVE OR MORE
STANDARDSMET ALL SIX STANDARDS
Grade 5 56% 41% 15%
Grade 7 N/A N/A N/A
Grade 9 N/A N/A N/A
SOURCE: Physical fitness test data is produced annually as schools test their students on the six Fitnessgram Standards. This information is from the 2011–2012 school year.
KEY FACTOROUR
SCHOOLDISTRICTAVERAGE
STATEAVERAGE
Suspensions per 100 students
2011–2012 8 12 N/A
2010–2011 7 14 5
2009–2010 10 12 6
Expulsions per 100 students
2011–2012 0 0 N/A
2010–2011 0 0 0
2009–2010 0 0 0
SOURCE: Data is from the Consolidated Application published by the California Department of Education. The numbers above are a ratio of suspension or expulsion events, per 100 students enrolled. District and state averages represent elementary schools only.
Perris Elementary School District
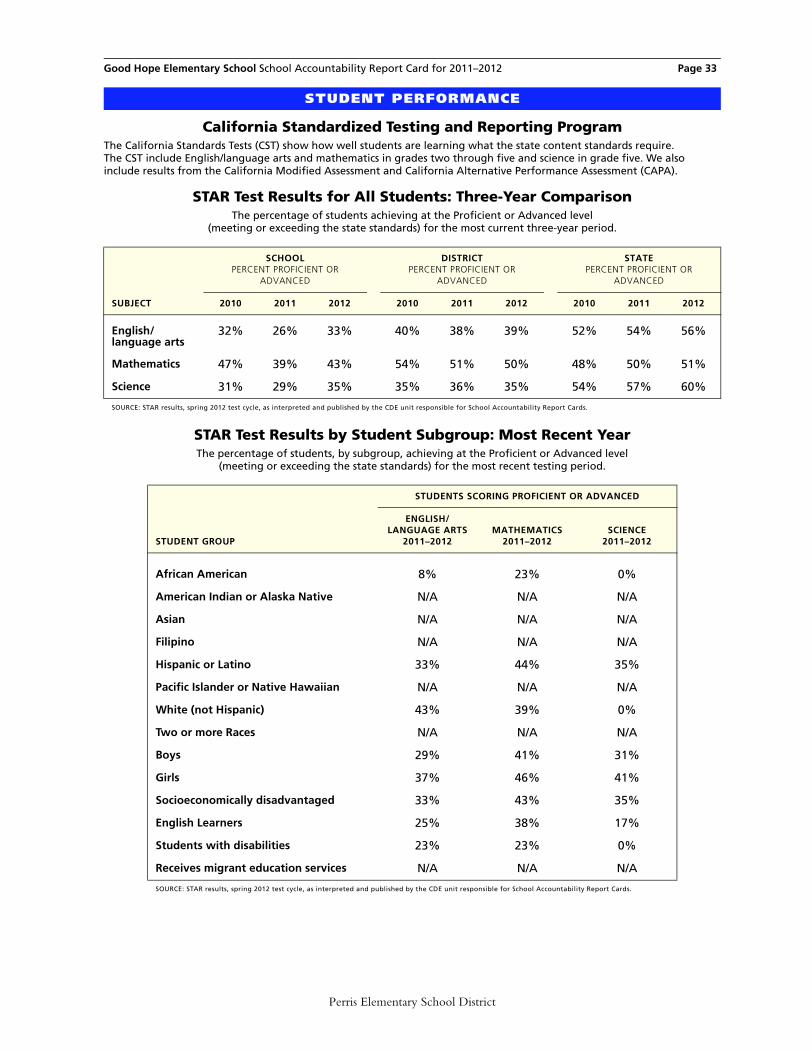
Good Hope Elementary School School Accountability Report Card for 2011–2012 Page 33
California Standardized Testing and Reporting ProgramThe California Standards Tests (CST) show how well students are learning what the state content standards require. The CST include English/language arts and mathematics in grades two through five and science in grade five. We also include results from the California Modified Assessment and California Alternative Performance Assessment (CAPA).
STAR Test Results for All Students: Three-Year ComparisonThe percentage of students achieving at the Proficient or Advanced level
(meeting or exceeding the state standards) for the most current three-year period.
STAR Test Results by Student Subgroup: Most Recent YearThe percentage of students, by subgroup, achieving at the Proficient or Advanced level
(meeting or exceeding the state standards) for the most recent testing period.
STUDENT PERFORMANCE
SCHOOLPERCENT PROFICIENT OR
ADVANCED
DISTRICTPERCENT PROFICIENT OR
ADVANCED
STATEPERCENT PROFICIENT OR
ADVANCED
SUBJECT 2010 2011 2012 2010 2011 2012 2010 2011 2012
English/language arts
32% 26% 33% 40% 38% 39% 52% 54% 56%
Mathematics 47% 39% 43% 54% 51% 50% 48% 50% 51%
Science 31% 29% 35% 35% 36% 35% 54% 57% 60%
SOURCE: STAR results, spring 2012 test cycle, as interpreted and published by the CDE unit responsible for School Accountability Report Cards.
STUDENTS SCORING PROFICIENT OR ADVANCED
STUDENT GROUP
ENGLISH/LANGUAGE ARTS
2011–2012MATHEMATICS
2011–2012SCIENCE
2011–2012
African American 8% 23% 0%
American Indian or Alaska Native N/A N/A N/A
Asian N/A N/A N/A
Filipino N/A N/A N/A
Hispanic or Latino 33% 44% 35%
Pacific Islander or Native Hawaiian N/A N/A N/A
White (not Hispanic) 43% 39% 0%
Two or more Races N/A N/A N/A
Boys 29% 41% 31%
Girls 37% 46% 41%
Socioeconomically disadvantaged 33% 43% 35%
English Learners 25% 38% 17%
Students with disabilities 23% 23% 0%
Receives migrant education services N/A N/A N/A
SOURCE: STAR results, spring 2012 test cycle, as interpreted and published by the CDE unit responsible for School Accountability Report Cards.
Perris Elementary School District

Good Hope Elementary School School Accountability Report Card for 2011–2012 Page 34
California Academic Performance Index (API)The Academic Performance Index (API) is an annual measure of the academic performance and progress of schools in California. APIs range from 200 to 1000, with a statewide target of 800. Detailed information about the API can be found on the CDE Web site at http://www.cde.ca.gov/ta/ac/ap/.
API Ranks: Three-Year ComparisonThe state assigns statewide and similar-schools API ranks for all schools. The API ranks range from 1 to 10. A statewide rank of 1 means that the school has an API in the lowest 10 percent of all elementary schools in the state, while a statewide rank of 10 means that the school has an API in the highest 10 percent of all elementary schools in the state. The similar-schools API rank reflects how a school compares with 100 statistically matched schools that have similar teachers and students.
API Changes by Subgroup: Three-Year ComparisonAPI changes for all students and student subgroups: the actual API changes in points added or lost for the past three years, and the most recent API. Note: “N/A” means that the student group is not numerically significant.
ACCOUNTABILITY
API RANK 2009–2010 2010–2011 2011–2012
Statewide rank 1 1 1
Similar-schools rank 1 4 1
SOURCE: The API Base Report from June 2012.
ACTUAL API CHANGE API
SUBGROUP 2009–2010 2010–2011 2011–2012 2011–2012
All students at the school +33 -29 +21 698
Black/African American N/A -8 N/A N/A
American Indian or Alaska Native N/A N/A N/A N/A
Asian N/A N/A N/A N/A
Filipino N/A N/A N/A N/A
Hispanic or Latino +25 -26 +21 695
Pacific Islander N/A N/A N/A N/A
White (non Hispanic) N/A -69 +99 795
Two or more races N/A N/A N/A N/A
Socioeconomically disadvantaged +32 -29 +24 698
English Learners +34 -25 +12 678
Students with disabilities N/A +36 -75 526
SOURCE: The API Growth Report as released in the Accountability Progress Report in November 2012. Students from all elementary, middle and high schools are included in the district and state columns for comparison.
Perris Elementary School District

Good Hope Elementary School School Accountability Report Card for 2011–2012 Page 35
API Scores by SubgroupThis table includes Academic Performance Index results for our school, our district, and the state.
SCHOOL DISTRICT STATE
SUBGROUPNUMBER OF STUDENTS API
NUMBER OF STUDENTS API
NUMBER OF STUDENTS API
All students 451 698 3,822 744 4,664,264 788
Black/African American 10 N/A 320 722 313,201 710
American Indian or Alaska Native 0 N/A 10 N/A 31,606 742
Asian 0 N/A 27 848 404,670 905
Filipino 0 N/A 14 828 124,824 869
Hispanic or Latino 423 695 3,277 743 2,425,230 740
Pacific Islander 0 N/A 26 749 26,563 775
White (non Hispanic) 18 795 146 777 1,221,860 853
Two or more races 0 N/A 0 N/A 88,428 849
Socioeconomically disadvantaged 451 698 3,799 744 2,779,680 737
English Learners 326 678 2,354 727 1,530,297 716
Students with disabilities 39 526 369 626 530,935 607
SOURCE: The API Growth Report as released in the Accountability Progress Report in November 2012. Students from all elementary, middle and high schools are included in the district and state columns for comparison.
Perris Elementary School District

Good Hope Elementary School School Accountability Report Card for 2011–2012 Page 36
Federal Adequate Yearly Progress (AYP) and Intervention ProgramsThe federal law known as No Child Left Behind requires that all schools and districts meet all three of the following criteria in order to attain Adequate Yearly Progress (AYP): (a) a 95-percent participation rate on the state’s tests (b) a CDE-mandated percentage of students scoring Proficient or higher on the state’s English/language arts and mathematics tests (c) an API of at least 740 or growth of at least one point.
AYP for the DistrictWhether the district met the federal requirement for AYP overall,
and whether the district met each of the AYP criteria.
Intervention Program: District Program Improvement (PI)Districts receiving federal Title I funding enter Program Improvement (PI) if they do not make AYP for two consecutive years in the same content area (English/language arts or mathematics)and for each grade span or on the same indicator (API or graduation rate). After entering PI, districts advance to the next level of intervention with each additional year that they do not make AYP.
AYP CRITERIA DISTRICT
Overall No
Graduation rate N/A
Participation rate in English/language arts Yes
Participation rate in mathematics Yes
Percent Proficient in English/language arts No
Percent Proficient in mathematics No
Met Academic Performance Index (API) Yes
SOURCE: The AYP Report as released in the Accountability Progress Report in October 2012.
INDICATOR DISTRICT
PI stage 3 of 3
The year the district entered PI 2004
Number of schools currently in PI 8
Percentage of schools currently in PI 100%
SOURCE: The Program Improvement Report as released in the Accountability Progress Report in October 2012.
Perris Elementary School District

Good Hope Elementary School School Accountability Report Card for 2011–2012 Page 37
Total expenses include only the costs related to direct educational services to students. This figure does not include food services, land acquisition, new construction, and other expenditures unrelated to core educational purposes. The expenses-per-student figure is calculated by dividing total expenses by the district’s average daily attendance (ADA). More information is available on the CDE’s Web site.
District Salaries, 2010–2011This table reports the salaries of teachers and administrators in our district for the 2010–2011 school year. This table compares our average salaries with those in districts like ours, based on both enrollment and the grade level of our students. In addition, we report the percentage of our district’s total budget dedicated to teachers’ and administrators’ salaries. The costs of health insurance, pensions, and other indirect compensation are not included.
DISTRICT EXPENDITURES
CATEGORY OF EXPENSE OUR DISTRICT SIMILAR DISTRICTS ALL DISTRICTS
FISCAL YEAR 2010–2011
Total expenses $41,114,671 $8,497,573,732 $46,278,595,991
Expenses per student $7,709 $7,789 $8,323
FISCAL YEAR 2009–2010
Total expenses $41,630,677 $8,704,399,331 $47,205,560,698
Expenses per student $7,653 $7,973 $8,452
SOURCE: Fiscal Services Division, California Department of Education.
SALARY INFORMATIONDISTRICTAVERAGE
STATEAVERAGE
Beginning teacher’s salary
$38,842 $41,246
Midrange teacher’s salary $69,720 $67,400
Highest-paid teacher’s salary
$84,056 $85,481
Average principal’s salary (elementary school)
$101,066 $107,739
Superintendent’s salary $176,489 $180,572
Percentage of budget for teachers’ salaries
42% 42%
Percentage of budget for administrators’ salaries
6% 5%
SOURCE: School Accountability Report Card unit of the California Department of Education.
rev20130108_33-67199-6032502e/20093
Perris Elementary School District

School Accountability Report Card for 2011–2012
TITLE SUBJECTDATE OF
PUBLICATION ADOPTION
DATE
HM Reading: A Legacy of Literacy Language Arts 2003 2003
Harcourt HSP California Math Mathematics 2009 2009
Harcourt California Science Science 2006 2007
Harcourt Social Studies: California Reflections Social Studies 2006 2006
TEXTBOOKS
Textbook Adoption List
Perris Elementary School District
Page 38