good practice benchmarking of the rail infrastructure managers · 2018-07-10 · this report...
TRANSCRIPT

Good practice benchmarking of the rail
infrastructure managers
PRIME 2016 Benchmarking Report
Report developed under cooperation between PRIME KPI&Benchmarking
Subgroup and European Commission Directorate for Mobility and Transport
June 2018

Foreword by PRIME Co-Chairs
2
The goal of PRIME members is to provide safe, reliable and
efficient railway infrastructure for transporting people and goods.
The KPI subgroup was set up with the goal to monitor and
benchmark performance and by doing so to strive for better results.
We are pleased that after four years of preparatory work, the
PRIME KPI subgroup has delivered its first benchmarking report –
covering the years 2012-2016.
The PRIME benchmarking framework is:
• comprehensive – including a selection of indicators covering a
broad range of topics and
• has been developed by the industry itself and focussing on what
is useful from the infrastructure managers' business perspective.
We believe that these two elements have been key features to
ensure its wide support.
For the infrastructure managers, it helps to understand where each
organisation stands and where there is potential for improvement.
For the European Commission, there is an invaluable opportunity to
receive feedback and to monitor the progress with respect to EU
policy priorities. This first report focuses on a small number of high
level KPI’s. It will be progressively enlarged by new KPI’s and
enriched by new analysis of IM performance. The KPI subgroup
has also set up a database and IT tool which can be used for
analysing the trends and support management decisions on a daily
basis.
We believe that in the long term, PRIME data and definitions can
serve the needs of a large range of industry experts and public
authorities. Without measuring and sharing the results, it is
impossible to distinguish success from failure and to demonstrate
to the wider public that the rail sector is improving its service
provision.
Each organisation comes with its own history as well as often
different governance and financing models. Therefore, there is no
single measure of success that we should seek to impose. But we
believe that the KPI approach is very appropriate in this context and
there is always room for improvement and mutual learning.
We would like to thank the PRIME KPI subgroup chairs – Jan
Pettersson from Trafikverket and Rui Coutinho from IP Portugal -
as well as the members of this group from 15 organisations and EC
for this outstanding achievement. Finally, we would urge all PRIME
members to join the benchmarking framework so that our database
becomes, in the coming years, the most renowned source of
complete and reliable data!
PRIME co-chairs
Alain Quinet Matthew Baldwin
SNCF Réseau European Commission, DG MOVE,
Deputy Director General Deputy Director General

Table of contents
• Purpose of this report
• Context
• Benchmarking results
• Appendix
3

This report provides an overview of KPI data and results –
It serves as a starting point for further benchmarking
Purpose of this report (1/4)
Who is PRIME?
PRIME was created in 2013 as a cooperation platform between the European Commission and the European Rail
Infrastructure Managers, with the view to facilitate the provision of efficient and effective rail services. PRIME has in
total 35 member organisations and 12 of them have participated in the preparation of in this report.
OBJECTIVE OF PRIME PERFORMANCE BENCHMARKING
The 4th Railway Package (Article 7f of the Directive 2012/34/EU, as amended by Directive 2016/2370) has formalised
and specified the missions of PRIME. In particular, it states that “[…] the network meets at regular intervals to […]
monitor and benchmark performance. For this purpose, the network shall identify common principles and practices for
the monitoring and benchmarking of performance in a consistent manner”.
Infrastructure managers are natural monopolies and performance benchmarking is a relevant exercise to assess,
manage and improve their performance. Many indicators are already available within the sector but they are not
harmonised and are incomplete. Now, for the first time, all Infrastructure Managers are mobilised to provide a
coherent framework of performance indicators.
4

This report provides an overview of KPI data and results –
It serves as a starting point for further benchmarking
Purpose of this report (2/4)
OBJECTIVE OF PRIME PERFORMANCE BENCHMARKING (continued)
Performance Benchmarking covers several dimensions of rail infrastructure management: punctuality, costs,
resilience, sustainable development, safety, etc. Our objective is to provide a comprehensive view of the
performance of the networks with the opportunity for Infrastructure Managers to identify areas for improvement and
the sources of inspiration among their peers.
A first internal benchmarking report has been produced based on 2016 data accompanied by assessment of data
completeness and robustness, of 49 selected indicators and first assessment of KPI correlations, qualitative
relationships between KPIs and potential performance drivers in the different performance dimensions. The purpose
of this report was to illustrate the current performance of IMs and identify areas for further analysis. Thus, this is only
the beginning of a longer term process.
For the future, we will increase data availability - both KPIs and participants - and provide reports with in ‘depth
analysis’ identifying trends and best practice. Our intention is to give information and fruit for thought to stakeholders,
researchers, economists and politicians. Above all, the general objective for the project is to deliver insight and
inspiration for better decisions on developing a sustainable and competitive infrastructure management
which provides high quality services, as expected by operators, passengers and freight companies.
A consistent benchmark of this kind has never been done before. PRIME was able to set it up thanks to the strong
commitment of a large number of Infrastructure Managers. We will progressively improve the participation and the
publication with the view to foster accountability, transparency and, ultimately, performance.
5

This report provides an overview of KPI data and results –
It serves as a starting point for further benchmarking
Purpose of this report (3/4)
OPERATIONAL ACHIEVEMENTS
PRIME KPI and its Benchmarking Subgroup has been working actively for the last four years. Through 30 meetings,
12 active member organizations and three pilot projects we have achieved the following results:
• An internal IT tool developed by the EC IT team in cooperation with civity Management Consultants has been put
into operation for data collection and validation and is being further developed to enhance reporting, interpretation
and management of data.
• The KPI definitions are documented in a PRIME KPI Catalogue that is available on
https://webgate.ec.europa.eu/multisite/primeinfrastructure/content/subgroups_en
PRIME 2016 BENCHMARKING REPORT: THE STARTING POINT FOR FURTHER BENCHMARKING
• The present PRIME 2016 Benchmarking report shows the results of a selection of indicators which based on
the initial assessment of the internal report were considered mature enough for publishing. This first report with
purely factual information serves as a starting point for further data sharing and analysis. As indicated in the
document, for some indicators, the data of individual infrastructure managers still deviates from agreed definitions,
but the members continue their efforts to improve the comparability of data.
• This is PRIME's first Benchmarking report – i.e. its “best ever”. But the participating members are committed that
each next report will become an improvement over the previous one.
6

This report provides an overview of KPI data and results –
It serves as a starting point for further benchmarking
Purpose of this report (4/4)
PRIME KPI NEXT STEPS
• Enhancing participation: the number of members involved in the benchmarking report, currently 12 will
progressively increase
• Improving the dataset: The KPI framework will continue to be developed over the coming years, with the KPIs
refined, completed, and the quality of the input data and hence output metrics improved.
• In-depth studies: based on the results achieved, PRIME will work on in-depth analyses which include
interpretation of benchmarking results with detailed analyses of contextual factors and identification of root causes
for performance differences on selected topics. The topic chosen for 2018 is punctuality.
• Preparing and sharing reports: PRIME aims to publish annual benchmarking reports. In addition it will prepare
'special reports' presenting the outcome of the in-depth analyses.
7

Table of contents
• Purpose of this report
• Context
• Benchmarking results
• Appendix
8

European challenges towards a Single European Railway
Area
• Integration of infrastructure & interoperability
• Management of international traffic restrictions and
disruptions
• Difficulties in cross-border operations
PRIME benchmarking is a tool to support the IMs’ path to a
better performing single European market
Context
9
IMs’ challenges towards efficient infrastructure management
• Increasing performance requirements from governments
and customers vs. worn out assets and investment
backlogs
• Requires systematic and efficient asset management to
deliver better performance, optimized costs and controlled
risks
• Improved European
network efficiency
through cooperation of
IMs around common
quality criteria
• Improved service
quality and efficient
infrastructure
management through
information sharing and
mutual learning
Challenges PRIME benchmarking

The overall objectives and benefits of the PRIME KPI
exercise provide a constant orientation to improvement
Context – Objectives and benefits of PRIME KPI
• Exchange of best practices and performance benchmarking are the formal tasks of PRIME (Platform of Rail
Infrastructure Managers in Europe) who has undertaken the role of the European Network of Infrastructure
Managers as foreseen in the 4th Railway Package
• The PRIME group has identified a number of objectives and corresponding benefits which can be achieved
through a benchmarking comparison of KPIs and exchange of best practices:
– Share information, knowledge and practice between railway infrastructure managers (IMs) and learn from each
other in order to improve performance and business development
– Understand the drivers for each KPI and their manageability
– Identify relative performance of IMs in different dimensions to each other and understand existing differences
and reasons for them
– Undertake root cause analysis and explore what organisations do differently and what their best practice is
– Inform decision makers about choices to achieve performance improvements so that more informed
management decisions can be taken
• Sharing the results with the public can also support engagement with key stakeholders:
– Data can be used to support negotiations with public authorities and trade unions, and it can also be used for
engagement with regulators
– Provides evidence to monitor whether national or EU policies are working or not
– Is a communication tool vis-à-vis customers and business partners to indicate trends
• A further important outcome of the PRIME KPI work is a good quality, comparable and easily accessible dataset
10

The PRIME KPI Subgroup has been growing since 2014,
having 12 participants in the report and 3 new members
Context – PRIME KPI Active Members
11
Participants in PRIME KPI Report New members
Observers:

A number of factors need to be in place to make this
benchmarking exercise successful
Context – Key success factors of PRIME KPI
There are a number of factors to be considered for a successful and meaningful benchmarking
exercise:
Meaningful and supportive KPIs strongly aligned with the peer group’s strategic objectives
and providing a good starting point for the identification of good practices
Clear and well defined indicators are essential for reliable and comparable results
Reliable and high data quality through a thorough challenging of the collection and
completeness of data including plausibility checks and gap-filling
Comparability of results can be increased by applying adjustments to normalise data based
on structural differences between IMs, as well as identifying limitations and caveats very clearly
to avoid misinterpretation and misleading conclusions
Target group-oriented tools and reporting should be developed which are flexible, easy-to-
use and correspond to the needs of benchmarking experts, team members, and senior
managers, etc., using carefully defined requirements.
A strong senior management commitment is essential to support and resource the exercise,
and provide confidence to interpret, understand and implement results
12
!

Table of contents
• Purpose of this report
• Context
• Benchmarking results
– Overview, framework and maturity
– KPI results
– Assessment of the current status of benchmarking
• Appendix
13

This report provides selected high level and benchmarking
KPIs of the framework's business dimensions
Overview
14
• First, the framework and performance indicator hierarchy is illustrated and, based on their
completeness and robustness, 35 KPIs were selected for publication, while 14 KPIs were not
mature enough and are excluded from this report.
• An example slide of results is provided explaining contents and meaning of the graphical
illustration.
• Each business dimension is introduced by its objectives as described in the PRIME catalogue
and each category is introduced by the current definitions of KPIs in the category.
• This is followed by a comparison of these KPIs per IM illustrated in bar-charts showing for each
IM the most recent available data among the years 2012 – 2016. Where KPIs for 2016 are not
currently available, presented values are based on data from the most recent available year. For
example, if the latest data provided by an IM is from 2015 then 2015 data is presented in the chart.
• Bar-charts also indicate the peer average across all IMs based on most recent available data as
well as the individual IM mid-term averages (2012 – 2016 where available).
• Intentionally, benchmarking results are not interpreted and possible reasons for performance
differences are not investigated in detail at this stage.
• Some comments from IMs are added only to explain deviations from agreed PRIME definitions.
• A diversified set of reasons has been recorded for why an IM does not present data for a certain
KPI, including lack of data, complex calculations, low data robustness, data sensitivity concerns
and others.

Tier Indicators Reporting
High Level
Industry KPIs
Bench-
marking
KPIs
Additional
PIs
Supporting
Indicators & data
Selection of 12 top KPIs
Additional 37 KPIs covering
all categories for core
benchmarking
All remaining PIs
Other indicators & data for
detail and explanation
Bench-
marking
reports
Report-
ing per
indicator
in IT tool
The PRIME performance indicators have been tiered into
four levels, with the main KPIs considered for reports
Framework – Performance indicator hierarchy
15

Framework – Overview of High Level Industry and Benchmarking KPIs
16
PRIME
Context
Electrification
Modal share
passenger transport
Modal share freight
transport
Safety
Accidents
Precursors
Fatalities
Security
Delays
Train cancellations
Environment
Diesel trains
Electric trains
CO2 emissions
Capacity
Possessions planned
Possessions utilised
Condition
Asset failures
Signalling
Telecom
Power supply
Track
Structures
Other
Permanent speed
restrictions
Temporary speed
restrictions
Costs
OPEX
Maintenance
Traffic management
CAPEX
Renewals
Revenues
Non access charges
Track access charges
Proportion
Incentive regimes
Utilisation
Train-km
Passenger trains
Freight trains
Asset Capability & ERTMS
Deployment today
Deployment 2030
Intermodality
Intermodal stations
Passengers at
accessible stations
Context Safety & Environment Delivery Financial Growth
Punctuality
Passenger trains
Freight trains
Delays caused by IM
Train cancellation
caused by IM
Robustness
Delays
Signalling
Telecom
Power supply
Track
Structures
Other
Performance
A framework was established including 12 High Level
Industry KPIs and 37 Benchmarking KPIs
High Level Industry KPI Benchmarking KPI

The subgroup will assess how data completeness and
robustness can be improved especially for critical KPIs
Data completeness and robustness
• Data completeness for high level KPIs ranges from close to 60% to 70% across the years
• Benchmarking KPIs are generally less populated with completeness ranging from close to 50% to
55% across the years, reflecting a prioritised collection of high level KPI data by IMs
• Increasing data completeness across reporting periods for both high level and benchmarking
KPIs suggests that IMs are implementing and improving internal data collection processes
• While the context, safety and environment, financial and growth dimensions are relatively well
populated and robust, the performance and delivery dimensions show room for improvement
• 14 KPIs have been identified as being critical KPIs in terms of low data completeness and/or
robustness and reasons for these include demanding definitions or calculation methodologies,
differing internal reporting concepts, unavailability of data and data being considered as sensitive
by IMs
• Against this background it is important for the subgroup to assess how data completeness and
robustness can be improved especially for the critical KPIs
17

18
PRIME
Context
Electrification
Modal share
passenger transport
Modal share freight
transport
Safety
Accidents
Precursors
Fatalities
Security
Delays
Train cancellations
Environment
Diesel trains
Electric trains
CO2 emissions
Capacity
Possessions planned
Possessions utilised
Condition
Asset failures
Signalling
Telecom
Power supply
Track
Structures
Other
Permanent speed
restrictions
Temporary speed
restrictions
Costs
OPEX
Maintenance
Traffic management
CAPEX
Renewals
Revenues
Non access charges
Track access charges
Proportion
Incentive regimes
Utilisation
Train-km
Passenger trains
Freight trains
Asset Capability & ERTMS
Deployment today
Deployment 2030
Intermodality
Intermodal stations
Passengers at
accessible stations
Context Safety & Environment Delivery Financial Growth
Punctuality
Passenger trains
Freight trains
Delays caused by IM
Train cancellation
caused by IM
Robustness
Delays
Signalling
Telecom
Power supply
Track
Structures
Other
Performance
High Level Industry KPI Benchmarking KPI
Maturity of KPIs
35 KPIs are ready for publication – 14 KPIs were not mature
enough to be included in this 2016 Benchmarking Report
Maturity of KPIs
Source: civity calculations using data as provided by the infrastructure managers until 13 April 2018 Data accuracy: N = Normal E = Estimate D = Deviating from definition P = Preliminary
Latest available year Average of available years 2012-2016 Total average latest available year
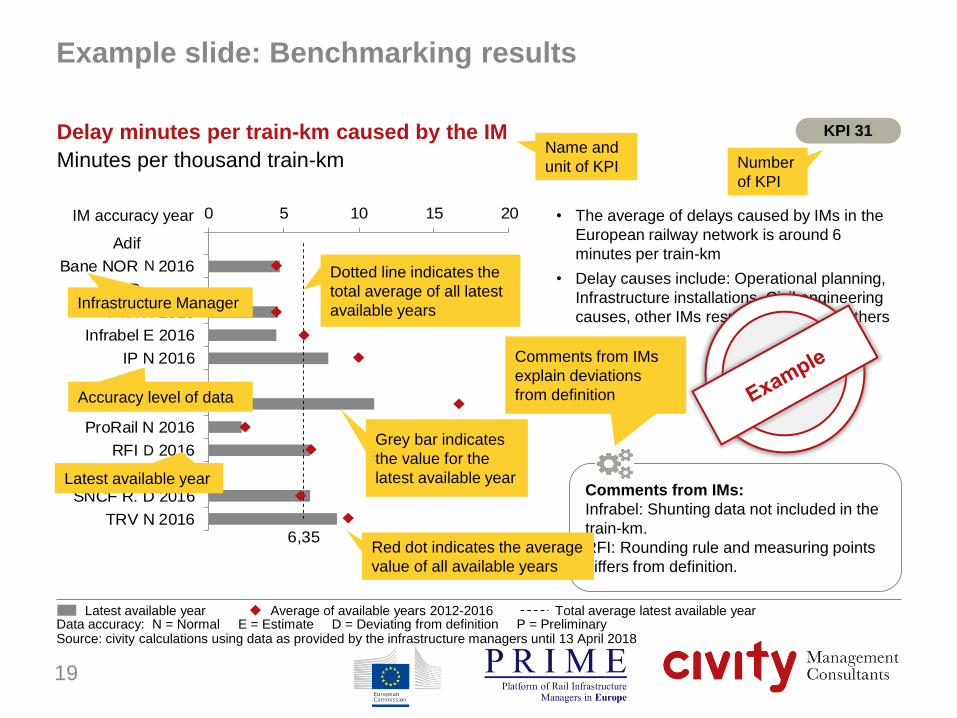
IM accuracy year • The average of delays caused by IMs in the
European railway network is around 6
minutes per train-km
• Delay causes include: Operational planning,
Infrastructure installations, Civil engineering
causes, other IMs responsibilities and others
19
Delay minutes per train-km caused by the IM
Minutes per thousand train-km
6,35
0 5 10 15 20
Adif
Bane NOR D 2016
DB
FTA N 2016
Infrabel E 2016
IP N 2016
NR
PKP PLK N 2016
ProRail N 2016
RFI N 2016
SBB
SNCF R. D 2016
TRV N 2016
KPI 31
Comments from IMs:
Infrabel: Shunting data not included in the
train-km.
RFI: Rounding rule and measuring points
differs from definition.
D
N
Grey bar indicates
the value for the
latest available year
Red dot indicates the average
value of all available years
Name and
unit of KPI
Dotted line indicates the
total average of all latest
available years Infrastructure Manager
Accuracy level of data
Latest available year
Number
of KPI
Example slide: Benchmarking results
Comments from IMs
explain deviations
from definition

Table of contents
• Purpose of this report
• Context
• Benchmarking results
– Overview, framework and maturity
– KPI results
- Context
- Safety and environment
- Performance
- Delivery
- Financial
- Growth
– Assessment of the current status of benchmarking
• Appendix
20

• Understanding the size and relative significance of the
railway in each country and the market for railway services
• Provision of valuable background information and relevant
context when reviewing and assessing other KPIs and
additional performance indicators
This category provides an overview of the characteristics
and configuration of each IM
Context – objectives
21
Source: PRIME Catalogue Version 2.0, 25 September 2017

This category provides an overview of the characteristics and configuration of each IM. This enables an understanding of the size and relative significance
of the railway in each country and the market for railway services, which provides valuable background information and relevant context when reviewing
and assessing other KPIs and additional performance indicators.
KPI Definition KPI Name
Context – Overview
22
PRIME
Context Safety & Environment Performance Delivery Financial Growth
Degree of electrification of total network - all lines
Proportion of national rail passenger-km compared to total passenger-km of passenger cars, buses / coaches, and railways
(Source: Eurostat based on data reported by national statistical offices)
Proportion of national rail tonne-km compared to total tonne-km of road, inland waterways and rail freight (Source:
Eurostat based on data reported by national statistical offices)
Degree of electrification of
total network – all lines
National modal share of rail in
passenger transport
National modal share of rail in
freight transport
High Level Industry KPI Benchmarking KPI
Context
Electrification
Modal share
passenger transport
Modal share freight
transport
This category provides an overview of the characteristics
and configuration of each IM

Source: civity calculations using data as provided by the infrastructure managers until 13 April 2018 Data accuracy: N = Normal E = Estimate D = Deviating from definition P = Preliminary
Latest available year Average of available years 2012-2016 Total average latest available year
IM accuracy year • Two thirds of European railway networks are
electrified, the degree of electrification has
been quite stable in the period considered
23
Degree of electrification of total network – all lines
% of track-km
KPI 1
Comments from IMs:
IP: Some sidings and depots not
accounted for.
ProRail: Electrified track refers only to
main track
TRV: Electrified track refers only to main
track 66,6
0 20 40 60 80 100
Adif N 2016
Bane NOR N 2016
DB N 2016
FTA N 2016
Infrabel E 2016
IP E 2016
NR N 2016
PKP PLK N 2016
ProRail N 2016
RFI N 2016
SNCF R. N 2016
TRV N 2016
2012 to 2015 deviating
D

Source: civity calculations using data as provided by the infrastructure managers until 13 April 2018 Data accuracy: N = Normal E = Estimate D = Deviating from definition P = Preliminary
Latest available year Average of available years 2012-2016 Total average latest available year
IM accuracy year
24
National modal share of rail in passenger transport
% of passenger-km
7,43
0 5 10 15
Adif N 2015
Bane NOR N 2015
DB N 2015
FTA N 2015
Infrabel N 2015
IP N 2015
NR N 2015
PKP PLK N 2015
ProRail N 2015
RFI N 2015
SNCF R. N 2015
TRV N 2015
KPI 2
Data provided by European Commission
Source: Eurostat based on data reported
by national statistical offices
• Based on passenger-kilometres, the average
modal share of rail in passenger transport in
Europe is 7%

Source: civity calculations using data as provided by the infrastructure managers until 13 April 2018 Data accuracy: N = Normal E = Estimate D = Deviating from definition P = Preliminary
Latest available year Average of available years 2012-2016 Total average latest available year
IM accuracy year
25
National modal share of rail in freight transport
% of tonne-km
• Based on tonne-kilometres, the average
modal share of rail in freight transport in
Europe is 16%
15,7
0 10 20 30 40
Adif N 2015
Bane NOR N 2015
DB N 2015
FTA N 2015
Infrabel N 2015
IP N 2015
NR N 2015
PKP PLK N 2015
ProRail N 2015
RFI N 2015
SNCF R. N 2015
TRV N 2015
KPI 3
Data provided by European Commission
Source: Eurostat based on data reported
by national statistical offices

Table of contents
• Purpose of this report
• Context
• Benchmarking results
– Overview, framework and maturity
– KPI results
- Context
- Safety and environment
- Performance
- Delivery
- Financial
- Growth
– Assessment of the current status of benchmarking
• Appendix
26

• Understand and improve the ability of an IM to manage and
operate its network and users of its network in such a way
as to maximise safety and security (ALARP) for its
customers, staff, its partners – operators, contractors and
suppliers – and the general public; and
• Demonstrate the ability of an IM to manage its network in
such a way as to minimise short term and long term
environmental impacts by itself and its staff, its operators,
suppliers and customers.
Aim is to demonstrate the level of safety and security as
well as the environmental impact provided by the railway
Safety, Security & Environment – objectives
27
Source: PRIME Catalogue Version 2.0, 25 September 2017

Safety is the primary focus of the management of a railway IM and a prerequisite in any framework of management indicators. It is the most important and
essential element in the performance of an IM, and affects customers, stakeholders, the reputation of the IM, the railway and society at large.
Safety & Environment – Safety – Overview
28
PRIME
Context Safety & Environment Performance Delivery Financial Growth
Relative number of significant accidents including sidings, excluding accidents in workshops, warehouses and depots
based on the following types of accidents (primary accidents): Collision of train with rail vehicle, Collision of train with
obstacle within the clearance gauge, Derailment of train, Level crossing accident, including accident involving
pedestrians at level crossing, Accident to persons involving rolling stock in motion, with the exception of suicides and
attempted suicides, Fire on rolling stock, Other accident
The boundary is the point at which the railway vehicle leaving the workshop / warehouse / depot / sidings cannot pass
without having an authorization to access the mainline or other similar line. This point is usually identified by a signal. For
further guidance, please see ERA Implementation Guidance on CSIs.
Relative number of the following types of precursors: broken rail track buckle and track misalignment wrong-side
signalling failure
Relative number of persons seriously injured (i.e. hospitalised for more than 24 hours, excluding any attempted suicide)
and killed (i.e. killed immediately or dying within 30 days, excluding any suicide) by accidents based upon following
categories: Passenger, Employee or contractor, Level crossing user, Trespasser, Other person at a platform,
Other person not at a platform
Significant accidents
IM related precursors to
accidents
Persons seriously injured and
killed
KPI Definition KPI Name
High Level Industry KPI Benchmarking KPI
Safety
Accidents
Precursors
Fatalities
Security
Delays
Train cancellations
Environment
Diesel trains
Electric trains
CO2 emissions

Source: civity calculations using data as provided by the infrastructure managers until 13 April 2018 Data accuracy: N = Normal E = Estimate D = Deviating from definition P = Preliminary
Latest available year Average of available years 2012-2016 Total average latest available year
IM accuracy year
29
Significant accidents
Number per million train-km
0,41
0 0,5 1 1,5
Adif N 2016
Bane NOR D 2016
DB
FTA N 2016
Infrabel E 2016
IP N 2016
NR N 2016
PKP PLK N 2016
ProRail N 2016
RFI N 2016
SNCF R. N 2016
TRV N 2016
• On average European infrastructure networks
show 0,4 accidents per million train kilometre
KPI 7
Comments from IMs:
Infrabel: Shunting data not included in the
train-km.
N

Source: civity calculations using data as provided by the infrastructure managers until 13 April 2018 Data accuracy: N = Normal E = Estimate D = Deviating from definition P = Preliminary
Latest available year Average of available years 2012-2016 Total average latest available year
IM accuracy year
30
Persons seriously injured and killed
Number per million train-km
0,36
0 0,5 1 1,5 2
Adif N 2016
Bane NOR D 2016
DB
FTA N 2016
Infrabel D 2016
IP N 2016
NR N 2016
PKP PLK N 2016
ProRail N 2016
RFI N 2016
SNCF R. N 2016
TRV N 2016
KPI 8
• The average of safety related injuries or
fatalities in the European railway network is
0,36 per million train-kilometres
Comments from IMs:
Infrabel: Shunting data not included in the
train-km.
N

Source: civity calculations using data as provided by the infrastructure managers until 13 April 2018 Data accuracy: N = Normal E = Estimate D = Deviating from definition P = Preliminary
Latest available year Average of available years 2012-2016 Total average latest available year
IM accuracy year
31
IM related precursors to accidents
Number per million train-km
3,55
0 2 4 6 8
Adif N 2016
Bane NOR D 2016
DB
FTA N 2016
Infrabel
IP N 2016
NR N 2016
PKP PLK N 2016
ProRail N 2016
RFI
SNCF R. N 2016
TRV N 2016
KPI 12
• Precursors like broken rails and wrong side
signalling failures occur 3,6 times per million
train-km N

The management of railway security includes activities for the protection of the railway, its users and its staff through monitoring, prevention and
preparation of responses to security incidents carried out with malicious intent, which have the potential to harm customers and staff, damage railway
assets, or generally to impede and disrupt railway operations.
Safety & Environment – Security – Overview
32
PRIME
Context Safety & Environment Performance Delivery Financial Growth
Number of delay minutes due to security incidents (intentional acts as terrorism, sabotage, cyber-attacks, vandalism, thefts,
espionage, unauthorized persons and other acts of aggression or hooliganism) per train-km
Percentage of trains cancelled caused by security incidents (intentional acts as terrorism, sabotage, cyber-attacks,
vandalism, thefts, espionage, unauthorized persons and other acts of aggression or hooliganism) per total trains scheduled
to be operated
Delays caused by security
incidents
National Train cancellations
caused by security incidents
KPI Definition KPI Name
High Level Industry KPI Benchmarking KPI
Safety
Accidents
Precursors
Fatalities
Security
Delays
Train cancellations
Environment
Diesel trains
Electric trains
CO2 emissions
Security-related data is not
yet sufficiently complete
and robust for publishing

Monitoring the environmental impact of the IM focuses on two aspects: the influence of the IM in affecting and improving the environmental impact of the
whole integrated railway (e.g. through electrification) and the direct environmental impact of the IM’s own activities.
Safety & Environment – Environment – Overview
33
Diesel train-kilometres compared to train-kilometres both for passenger and freight trains
Electric train-kilometres compared to train-kilometres both for passenger and freight trains
CO2 emission produced from maintenance rolling stock compared to main track-km
Share of diesel trains
Share of electric trains
Performance against carbon
reduction target
KPI Definition KPI Name
High Level Industry KPI Benchmarking KPI
Safety
Accidents
Precursors
Fatalities
Security
Delays
Train cancellations
Environment
Diesel trains
Electric trains
CO2 emissions
PRIME
Context Safety & Environment Performance Delivery Financial Growth

Share of train types
% of train-km
34
Source: civity calculations using data as provided by the infrastructure managers until 13 April 2018
0
10
20
30
40
50
60
70
80
90
100
RFI FTA Adif SNCF
R.
PKP
PLK
Bane
NOR
IP TRV
Share of diesel trains Share of electric trains
KPI 18+19
• Overall the share of electrically produced
train-kilometres in European countries is quite
high, reaching 86% of the total
• This reflects the degree of electrification of
the network which in most countries reaches
70% or more (KPI 1)

Source: civity calculations using data as provided by the infrastructure managers until 13 April 2018 Data accuracy: N = Normal E = Estimate D = Deviating from definition P = Preliminary
Latest available year Average of available years 2012-2016 Total average latest available year
IM accuracy year
35
CO2 emission produced from maintenance rolling stock
tCO2 per main track-km
0,58
0 0,5 1 1,5
Adif
Bane NOR E 2016
DB
FTA
Infrabel
IP N 2016
NR
PKP PLK N 2016
ProRail
RFI N 2016
SNCF R. N 2016
TRV
KPI 20
• The environmental impact of an IM’s
maintenance rolling stock is measured by its
CO2 emissions
• On average 0,6 tons are emitted per main
track kilometre annually
• Some values may differ due to different levels
of outsourcing
Comments from IMs:
Bane NOR: Only own working machines.

Table of contents
• Purpose of this report
• Context
• Benchmarking results
– Overview, framework and maturity
– KPI results
- Context
- Safety and environment
- Performance
- Delivery
- Financial
- Growth
– Assessment of the current status of benchmarking
• Appendix
36

• Understand the performance of the IM network in relation
to other IMs;
• Improve the ability of the IM to enable trains to run on time;
and,
• Identify opportunities to improve the management of assets
to minimise the number of failures, and the impact of those
failures on the operating railway.
Aim is to describe the network performance and the
resulting impact on operators and customers
Performance – objectives
37
Source: PRIME Catalogue Version 2.0, 25 September 2017

Train punctuality is the primary measure of overall railway performance and a key measure of quality of service, driven not only by the IM but also opera-
tors and customers. The requirements for punctuality differs between IMs, high-speed routes, core network, customer groups, passenger/freight etc. It is
essential to understand both the overall performance of the system through punctuality, as well as the IM’s impact on and responsibility for punctuality.
Performance – Punctuality – Overview
38
PRIME
Context Safety & Environment Performance Delivery Financial Growth
Percentage of national and international passenger trains (excluding freight and work trains) which arrive at all strategic
measuring points with less than or equal to 5 minutes delay compared to all passenger trains that ran against the original
time plan, including international traffic
Passenger trains punctuality
Percentage of national and international freight trains (excluding passenger and work trains) which arrive at all strategic
measuring points with less than or equal to 15 minutes delay compared to all freight trains that ran against the original time
plan, including international traffic
Freight trains punctuality
Average delay minutes caused by incidents that are regarded as IMs responsibility according to UIC leaflet 450-R per train-
km. Delay causes should include both primary causes and secondary causes. Primary and secondary causes are
described in UIC CODE, 450 – 2 Appendix A. Delay data will be collected at all available measuring points. Delays refer to
the time the train arrives at the measuring point. The maximum number of measured delay minutes across all available
measuring points is counted with a threshold of more than 5 minutes for passenger services and more than 15 minutes for
freight services. UIC CODE 450 – 2 rounding rule number 2: Round down to full minute until 29 seconds, round up to full
minute from 30 seconds on, e.g. 5:30 is considered as 6, 5:29 is considered as 5
Minutes of delays caused by
IM per train-km - IM's
responsibility
Percentage of fully or partially cancelled national and international passenger trains that are included in the last time table
issued the day before the service (or the time table that is valid when the train service takes place) and are caused by
incidents for which the infrastructure manager has the responsibility. All sorts of cancelled trains are to be included.
Percentage of train
cancellations caused by the
IM
KPI Definition KPI Name
Punctuality
Passenger trains
Freight trains
Delays caused by IM
Train cancellation
caused by IM
Robustness
Delays
Signalling
Telecom
Power supply
Track
Structures
Other
High Level Industry KPI Benchmarking KPI

Source: civity calculations using data as provided by the infrastructure managers until 13 April 2018 Data accuracy: N = Normal E = Estimate D = Deviating from definition P = Preliminary
Latest available year Average of available years 2012-2016 Total average latest available year
IM accuracy year
91,8
80 85 90 95 100
Adif D 2016
Bane NOR D 2016
DB
FTA N 2016
Infrabel E 2016
IP N 2016
NR
PKP PLK N 2016
ProRail N 2016
RFI N 2016
SNCF R. D 2016
TRV D 2016
• Further work is required by IMs to collect
punctuality data according to the PRIME
definition, in order to make this measure more
comparable across the peer group
• Some IMs use differing measuring points and
rounding rules for calculating punctuality
• This KPI accounts for all the responsibilities
(RUs and external causes) and not only an
IM’s activity
39
Passenger trains punctuality
% of trains
KPI 28
0
Comments from IMs:
ADIF: Only HS value is included.
Bane NOR: Rounding rule and measuring
points differs from definition.
RFI: Rounding rule and measuring points
differs from definition.
TRV: Measuring points differs from
definition.
D
E

Source: civity calculations using data as provided by the infrastructure managers until 13 April 2018 Data accuracy: N = Normal E = Estimate D = Deviating from definition P = Preliminary
Latest available year Average of available years 2012-2016 Total average latest available year
IM accuracy year
40
Freight trains punctuality
% of trains
67,8
0 50 100
Adif
Bane NOR D 2016
DB
FTA N 2016
Infrabel E 2016
IP N 2016
NR
PKP PLK N 2016
ProRail N 2016
RFI N 2016
SNCF R. D 2016
TRV D 2016
KPI 29
Comments from IMs:
Bane NOR: Rounding rule and measuring
points differs from definition.
RFI: Rounding rule and measuring points
differs from definition.
TRV: Measuring points differs from
definition.
• Further work is required by IMs to collect
punctuality data according to the PRIME
definition, in order to make this measure more
comparable across the peer group
• Some IMs use differing measuring points and
rounding rules for calculating punctuality
• This KPI accounts for all the responsibilities
(RUs and external causes) and not only an
IM’s activity
E
D

Source: civity calculations using data as provided by the infrastructure managers until 13 April 2018 Data accuracy: N = Normal E = Estimate D = Deviating from definition P = Preliminary
Latest available year Average of available years 2012-2016 Total average latest available year
IM accuracy year • The average of delays caused by IMs in the
European railway network is about 6 minutes
per train-km
• Delay causes include: Operational planning,
Infrastructure installations, Civil engineering
causes, other IMs responsibilities and others
41
Delay minutes per train-km caused by the IM
Minutes per thousand train-km
6,35
0 5 10 15 20
Adif
Bane NOR D 2016
DB
FTA N 2016
Infrabel E 2016
IP N 2016
NR
PKP PLK N 2016
ProRail N 2016
RFI N 2016
SNCF R. D 2016
TRV N 2016
2012 to 2015 deviating
KPI 31
Comments from IMs:
Infrabel: Shunting data not included in the
train-km.
RFI: Rounding rule and measuring points
differs from definition.
N
D

Source: civity calculations using data as provided by the infrastructure managers until 13 April 2018 Data accuracy: N = Normal E = Estimate D = Deviating from definition P = Preliminary
Latest available year Average of available years 2012-2016 Total average latest available year
IM accuracy year • IMs cause an average of 12 percent of train
cancellations
42
Percentage of train cancellations caused by the IM
% of scheduled and cancelled passenger trains
12,3
0 10 20 30 40
Adif
Bane NOR D 2016
DB
FTA
Infrabel N 2016
IP N 2016
NR
PKP PLK N 2016
ProRail N 2016
RFI N 2016
SNCF R.
TRV
2012 to 2015 deviating
KPI 34
Comments from IMs:
Bane NOR: Include both passenger and
freight trains.
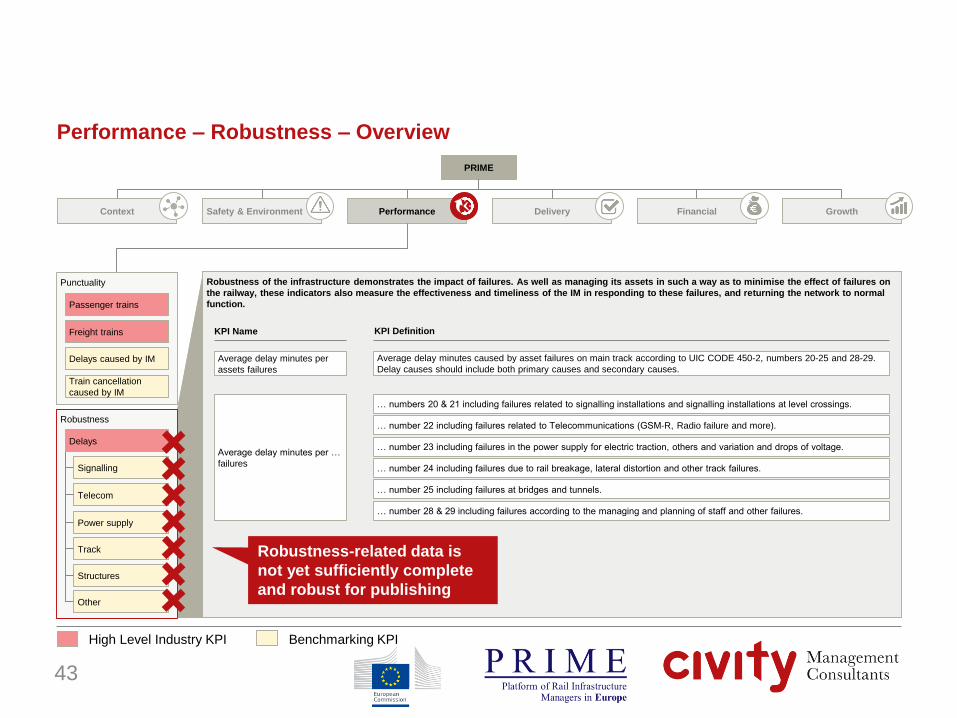
Robustness of the infrastructure demonstrates the impact of failures. As well as managing its assets in such a way as to minimise the effect of failures on
the railway, these indicators also measure the effectiveness and timeliness of the IM in responding to these failures, and returning the network to normal
function.
Performance – Robustness – Overview
43
PRIME
Context Safety & Environment Performance Delivery Financial Growth
Average delay minutes caused by asset failures on main track according to UIC CODE 450-2, numbers 20-25 and 28-29.
Delay causes should include both primary causes and secondary causes. Average delay minutes per
assets failures
… numbers 20 & 21 including failures related to signalling installations and signalling installations at level crossings.
Average delay minutes per …
failures
… number 22 including failures related to Telecommunications (GSM-R, Radio failure and more).
… number 23 including failures in the power supply for electric traction, others and variation and drops of voltage.
… number 24 including failures due to rail breakage, lateral distortion and other track failures.
… number 25 including failures at bridges and tunnels.
… number 28 & 29 including failures according to the managing and planning of staff and other failures.
KPI Definition KPI Name
High Level Industry KPI Benchmarking KPI
Punctuality
Passenger trains
Freight trains
Delays caused by IM
Train cancellation
caused by IM
Robustness
Delays
Signalling
Telecom
Power supply
Track
Structures
Other
Robustness-related data is
not yet sufficiently complete
and robust for publishing

Table of contents
• Purpose of this report
• Context
• Benchmarking results
– Overview, framework and maturity
– KPI results
- Context
- Safety and environment
- Performance
- Delivery
- Financial
- Growth
– Assessment of the current status of benchmarking
• Appendix
44

• Deliver an available, operable and fully functional network,
to the required level of capacity;
• Carry out its asset management functions effectively and in
a timely manner; and
• Maintain and improve asset condition in line with its
strategy.
Aim is to describe the effectiveness of the IM's internal
processes and management of the assets
Delivery – objectives
45
Source: PRIME Catalogue Version 2.0, 25 September 2017

The Capacity category measures the overall constraints on capacity of the IM’s network. It includes the impact on capacity from the condition of the IM’s
infrastructure and the impact of activities undertaken to maintain or improve overall condition.
Delivery – Capacity – Overview
46
PRIME
Context Safety & Environment Performance Delivery Financial Growth
Share of main track planned for IMs activities, including maintenance, enhancement and renewals on main tracks. Planned
work in the yearly time table. This is calculated as the number of main track-km planned for IMs activities weighted by
duration and divided by the total network length
Ratio of executed to planned possessions for IMs activities included in the yearly time table, including maintenance,
enhancement and renewals on main tracks. This is calculated as the sum of main track-km-days divided by sum of main
track-km-days planned
Possessions planned
Possessions utilised
KPI Definition KPI Name
Capacity
Possessions planned
Possessions utilised
Condition
Asset failures
Signalling
Telecom
Power supply
Track
Structures
Other
Permanent speed
restrictions
Temporary speed
restrictions
Capacity-related data is not
yet sufficiently complete and
robust for publishing
High Level Industry KPI Benchmarking KPI

The measurement of asset condition is complex, and not always straight forward for a single IM, nevermind as a comparative metric for use in bench-
marking. Therefore the PRIME condition category describes the condition of the asset primarily in terms of how well it functions (i.e. number of failures)
and in terms of the impact of condition of the assets on the expected delivery of the network, in terms of temporary and permanent speed restrictions.
Delivery – Condition – Overview
47
PRIME
Context Safety & Environment Performance Delivery Financial Growth
Number of asset failures on main track according to UIC CODE 450-2, numbers 20-25 and 28-29 per thousand main track-
km.
Percentage of tracks with permanent speed restriction due to deteriorating asset condition weighted by the time the
restrictions are in place (included in the yearly timetable), related to total main track-km
Percentage of tracks with temporary speed restriction due to deteriorating asset condition weighted by the time the
restrictions are in place (not included in the yearly timetable), related to total main track-km
Assets failures per thousand
main track-km
Tracks with permanent speed
restrictions
Tracks with temporary speed
restrictions
… numbers 20 & 21 … . Including failures related to signalling installations and signalling installations at level crossings.
… failures per thousand main
track-km
… number 22… . Including failures related to Telecommunications (GSM-R, Radio failure and more).
… number 23 … . Including failures in the power supply for electric traction, others and variation and drops of voltage.
… number 24 … . Including failures due to rail breakage, lateral distortion and other track failures.
… number 25 … . Including failures at bridges and tunnels.
… numbers 28 & 29 … . Failures according to the managing and planning of staff and other failures.
KPI Definition KPI Name
Capacity
Possessions planned
Possessions utilised
Condition
Asset failures
Signalling
Telecom
Power supply
Track
Structures
Other
Permanent speed
restrictions
Temporary speed
restrictions
High Level Industry KPI Benchmarking KPI

Source: civity calculations using data as provided by the infrastructure managers until 13 April 2018 Data accuracy: N = Normal E = Estimate D = Deviating from definition P = Preliminary
Latest available year Average of available years 2012-2016 Total average latest available year
IM accuracy year
48
Asset failures in relation to network size
Number per thousand main track-km
• On average around 1.200 assets are failing
per thousand main track-km and year
1.199
0 1.000 2.000 3.000 4.000
Adif N 2016
Bane NOR E 2016
DB
FTA
Infrabel
IP N 2016
NR
PKP PLK N 2016
ProRail N 2016
RFI N 2016
SNCF R. D 2016
TRV N 2016
KPI 51
Comments from IMs:
IP: All failures included even those not
affecting trains/causing delays.
D

Source: civity calculations using data as provided by the infrastructure managers until 13 April 2018 Data accuracy: N = Normal E = Estimate D = Deviating from definition P = Preliminary
Latest available year Average of available years 2012-2016 Total average latest available year
IM accuracy year
49
Signalling failures in relation to network size
Number per thousand main track-km
• Average failure frequency for signalling
assets is about 800 per thousand main track-
km and year and appears to be relatively
constant over time
831
0 500 1.000 1.500 2.000 2.500
Adif N 2016
Bane NOR N 2016
DB
FTA
Infrabel
IP N 2016
NR
PKP PLK N 2016
ProRail N 2016
RFI
SNCF R.
TRV N 2016
KPI 52
Comments from IMs:
IP: All failures included even those not
affecting trains/causing delays.
D

Source: civity calculations using data as provided by the infrastructure managers until 13 April 2018 Data accuracy: N = Normal E = Estimate D = Deviating from definition P = Preliminary
Latest available year Average of available years 2012-2016 Total average latest available year
IM accuracy year
50
Telecommunication failures in relation to network size
Number per thousand main track-km
• Average failure frequency for
telecommunication assets is 47 per thousand
main track-km and year
47,0
0 100 200 300
Adif N 2016
Bane NOR N 2016
DB
FTA
Infrabel
IP N 2016
NR
PKP PLK N 2016
ProRail N 2016
RFI
SNCF R.
TRV N 2016
KPI 53
Comments from IMs:
IP: All failures included even those not
affecting trains/causing delays.
D

Source: civity calculations using data as provided by the infrastructure managers until 13 April 2018 Data accuracy: N = Normal E = Estimate D = Deviating from definition P = Preliminary
Latest available year Average of available years 2012-2016 Total average latest available year
IM accuracy year
51
Power supply failures in relation to network size
Number per thousand main track-km
• Average failure frequency for power supply
assets is 57 per thousand main track-km and
year and seem to be decreasing
56,6
0 50 100 150 200
Adif N 2016
Bane NOR N 2016
DB
FTA
Infrabel
IP N 2016
NR
PKP PLK N 2016
ProRail N 2016
RFI
SNCF R.
TRV N 2016
2012 to 2015 deviating
KPI 54
Comments from IMs:
IP: All failures included even those not
affecting trains/causing delays.
D

Source: civity calculations using data as provided by the infrastructure managers until 13 April 2018 Data accuracy: N = Normal E = Estimate D = Deviating from definition P = Preliminary
Latest available year Average of available years 2012-2016 Total average latest available year
IM accuracy year
52
Track failures in relation to network size
Number per thousand main track-km
• Average failure frequency for track assets is
about 300 per thousand main track-km and
year
311
0 200 400 600 800 1.000 1.200
Adif N 2016
Bane NOR E 2016
DB
FTA
Infrabel
IP N 2016
NR
PKP PLK N 2016
ProRail N 2016
RFI
SNCF R.
TRV N 2016
KPI 55
Comments from IMs:
IP: All failures included even those not
affecting trains/causing delays.
D

Source: civity calculations using data as provided by the infrastructure managers until 13 April 2018 Data accuracy: N = Normal E = Estimate D = Deviating from definition P = Preliminary
Latest available year Average of available years 2012-2016 Total average latest available year
IM accuracy year
53
Structure failures in relation to network size
Number per thousand main track-km
• Average failure frequency for structures is 5,5
per thousand main track-km and year
5,53
0 5 10 15 20
Adif
Bane NOR E 2016
DB
FTA
Infrabel
IP N 2016
NR
PKP PLK N 2016
ProRail N 2016
RFI
SNCF R.
TRV N 2016
KPI 56
Comments from IMs:
IP: All failures included even those not
affecting trains/causing delays.
D

Source: civity calculations using data as provided by the infrastructure managers until 13 April 2018 Data accuracy: N = Normal E = Estimate D = Deviating from definition P = Preliminary
Latest available year Average of available years 2012-2016 Total average latest available year
IM accuracy year
54
Other infrastructure failures in relation to network size
Number per thousand main track-km
• Average failure frequency for other assets is
63 per thousand main track-km and year
63,0
0 50 100 150 200
Adif N 2016
Bane NOR E 2016
DB
FTA
Infrabel
IP N 2016
NR
PKP PLK N 2016
ProRail N 2016
RFI
SNCF R.
TRV N 2016
2012 to 2015 deviating
KPI 57
Comments from IMs:
IP: All failures included even those not
affecting trains/causing delays.
N
D

Source: civity calculations using data as provided by the infrastructure managers until 13 April 2018 Data accuracy: N = Normal E = Estimate D = Deviating from definition P = Preliminary
Latest available year Average of available years 2012-2016 Total average latest available year
IM accuracy year
55
Tracks with temporary speed restrictions
% of main track-km
• On average, 2% of the main track has
temporary speed restrictions due to
deteriorating condition
2,26
0 5 10
Adif N 2016
Bane NOR N 2016
DB
FTA
Infrabel
IP N 2016
NR
PKP PLK N 2016
ProRail D 2015
RFI
SNCF R.
TRV
KPI 59

Table of contents
• Purpose of this report
• Context
• Benchmarking results
– Overview, framework and maturity
– KPI results
- Context
- Safety and environment
- Performance
- Delivery
- Financial
- Growth
– Assessment of the current status of benchmarking
• Appendix
56

• Support delivery of a cost-effective railway, through
identification and implementation of good practices and
processes;
• Identify and encourage opportunities to increase revenues
from all sources;
• Understand the impact of charging and charges on IM and
the whole railway industry; and
• Support making the case for appropriate and effective
investment in the railway.
This dimension is intended to provide understanding of the
structure and the level of costs and revenues
Financial – objectives
57
Source: PRIME Catalogue Version 2.0, 25 September 2017

All financial data have been adjusted for purchasing power
and converted into Euro using purchasing power parities
PPPs1)
58
1) Data provided by European Commission
Country 2012 2013 2014 2015 2016
Belgium 1,0979 1,1050 1,1037 1,0821 1,1000
Switzerland 1,7900 1,7900 1,7500 1,6700 1,6900
Germany 1,0387 1,0532 1,0429 1,0318 1,0600
Spain 0,9145 0,9126 0,8952 0,8852 0,9000
Finland 1,2066 1,2370 1,2412 1,2217 1,2400
France 1,1218 1,1095 1,1005 1,0809 1,1000
Great Britain 0,9200 0,9373 0,9398 0,9090 0,9500
Italy 0,9979 1,0108 1,0061 0,9838 0,9900
Lithuania 0,6027 0,6042 0,6033 0,6047 0,6200
Latvia 0,6711 0,6793 0,6750 0,6657 0,6700
Netherlands 1,0961 1,0944 1,0945 1,0900 1,1000
Norway 11,9451 12,2606 12,5583 12,8648 13,7100
Poland 2,3978 2,4087 2,4060 2,3647 2,4000
Portugal 0,7806 0,7899 0,7792 0,7785 0,8000
Sweden 11,5182 11,8062 11,9888 11,9867 12,2800
Purchasing power parity (LCU/EUR)

The Costs category includes all the costs incurred by the IM, broken down into useful and comparable sub-categories. It includes all Operating, Capital and
Investment costs. For purposes of comparison, costs will be adjusted where appropriate to reflect local costs using purchasing power parities (PPPs). The
costs incurred by an IM will be dependent on a number of factors: some within and some outside the management responsibility of the IM.
Financial – Costs – Overview
59
PRIME
Context Safety & Environment Performance Delivery Financial Growth
Total IMs annual operational expenditures per main track-km
Total IMs annual capital expenditures per main track-km
Total IMs annual renewal expenditures per main track-km
OPEX – operational
expenditures in relation to
network size
CAPEX – capital expenditures
in relation to network size
Renewal expenditures in
relation to network size
Total IMs annual maintenance expenditures per main track-km Maintenance expenditures in
relation to network size
Total IMs annual traffic management expenditures per main track-km
Traffic management
expenditures in relation to
network size
KPI Definition KPI Name
Costs
OPEX
Maintenance
Traffic management
CAPEX
Renewals
Revenues
Non access charges
Track access charges
Proportion
Incentive regimes
High Level Industry KPI Benchmarking KPI

1) Results are normalised for purchasing power parity
Source: civity calculations using data as provided by the infrastructure managers until 13 April 2018 Data accuracy: N = Normal E = Estimate D = Deviating from definition P = Preliminary
Latest available year Average of available years 2012-2016 Total average latest available year
IM accuracy year
60
OPEX – operational expenditures in relation to network size1)
1.000 Euro per main track-km
• Average annual operational expenditures are
90.000 Euros per main track-kilometre
• For a meaningful gap analysis, major cost
drivers should be taken into account such as
network characteristics, utilisation and traffic
management technologies
90
0 100 200 300
Adif N 2016
Bane NOR N 2016
DB N 2016
FTA D 2015
Infrabel E 2016
IP N 2016
NR N 2016
PKP PLK N 2016
ProRail N 2016
RFI N 2016
SNCF R. N 2016
TRV N 2016
KPI 60
1) Results are normalised for purchasing power parity
Source: civity calculations using data as provided by the infrastructure managers until 13 April 2018 Data accuracy: N = Normal E = Estimate D = Deviating from definition P = Preliminary
Latest available year Average of available years 2012-2016 Total average latest available year
IM accuracy year
61
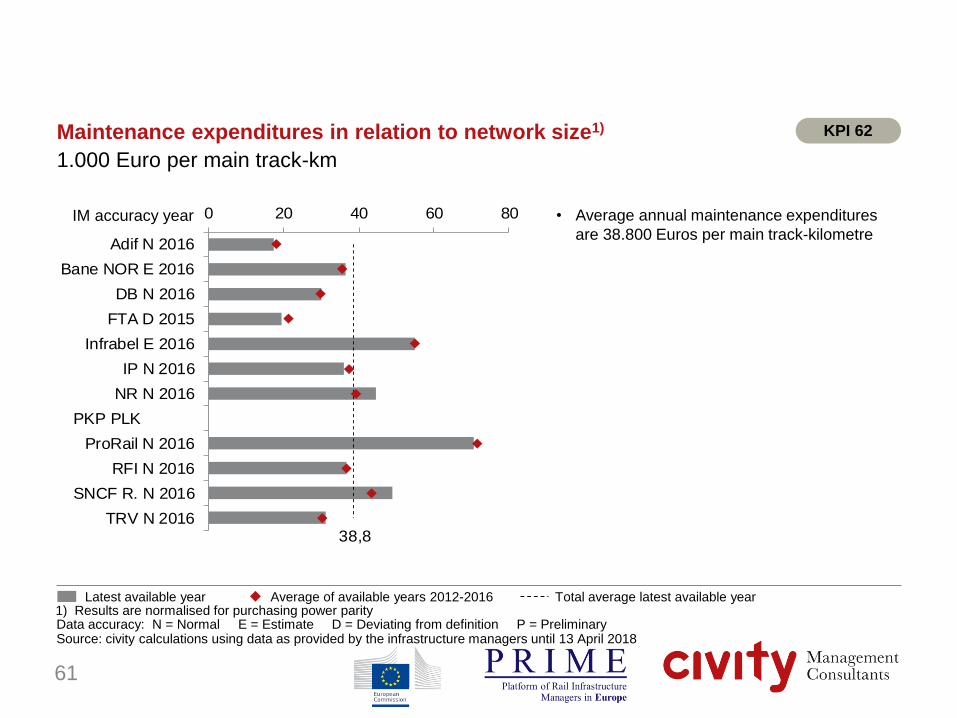
Maintenance expenditures in relation to network size1)
1.000 Euro per main track-km
• Average annual maintenance expenditures
are 38.800 Euros per main track-kilometre
38,8
0 20 40 60 80
Adif N 2016
Bane NOR E 2016
DB N 2016
FTA D 2015
Infrabel E 2016
IP N 2016
NR N 2016
PKP PLK
ProRail N 2016
RFI N 2016
SNCF R. N 2016
TRV N 2016
KPI 62

1) Results are normalised for purchasing power parity
Source: civity calculations using data as provided by the infrastructure managers until 13 April 2018 Data accuracy: N = Normal E = Estimate D = Deviating from definition P = Preliminary
Latest available year Average of available years 2012-2016 Total average latest available year
IM accuracy year
16,5
0 10 20 30
Adif N 2016
Bane NOR N 2016
DB
FTA D 2015
Infrabel
IP N 2016
NR
PKP PLK
ProRail N 2016
RFI N 2016
SNCF R. N 2016
TRV
62
Traffic management expenditures in relation to network size1)
1.000 Euro per main track-km
• Average annual expenditures for traffic
management are 16.500 Euros per main
track-kilometre
KPI 64

1) Results are normalised for purchasing power parity
Source: civity calculations using data as provided by the infrastructure managers until 13 April 2018 Data accuracy: N = Normal E = Estimate D = Deviating from definition P = Preliminary
Latest available year Average of available years 2012-2016 Total average latest available year
IM accuracy year
63
CAPEX – capital expenditures in relation to network size1)
1.000 Euro per main track-km
• Average annual capital expenditures are
124.000 Euros per main track-kilometre
124
0 100 200 300
Adif N 2016
Bane NOR N 2016
DB N 2016
FTA D 2015
Infrabel N 2016
IP N 2016
NR N 2016
PKP PLK
ProRail N 2016
RFI N 2016
SNCF R. N 2016
TRV N 2016
KPI 66

1) Results are normalised for purchasing power parity
Source: civity calculations using data as provided by the infrastructure managers until 13 April 2018 Data accuracy: N = Normal E = Estimate D = Deviating from definition P = Preliminary
Latest available year Average of available years 2012-2016 Total average latest available year
IM accuracy year
64
Renewal expenditures in relation to network size1)
1.000 Euro per main track-km
• Average annual renewal expenditures are
42.000 Euros per main track-kilometre
42,0
0 50 100 150
Adif N 2016
Bane NOR N 2016
DB N 2016
FTA D 2015
Infrabel N 2016
IP N 2016
NR N 2016
PKP PLK
ProRail N 2016
RFI N 2016
SNCF R. N 2016
TRV N 2016
KPI 68

The Revenue category provides a summary of the total non-track access revenue ‘earned’ by an IM, excluding subsidies and property development.
Furthermore, it measures and compares that element of an IM’s revenue that comes from charges from operators using its network and service facilities.
Financial – Revenues – Overview
65
Financial Growth
Total IMs annual revenues from non-access charges (e.g. commercial letting, advertising, telecoms but excluding grants or
subsidies) related to total main track-km
Total revenues from non-
access charges in relation to
network size
Total IMs annual TAC revenues (including freight, passenger and touristic trains) compared to total main track-km TAC revenue in relation to
network size
Percentage of IMs annual TAC revenues (including freight, passenger and touristic trains) compared to total revenues
(excluding grants and subsidies)
Proportion of TAC in total
revenue
Total IMs annual income from incentive/performance regimes with customers (if applicable, no public grants or state
subsidies) per main track-km
Income from incentive
regimes in relation to network
size
KPI Definition KPI Name
High Level Industry KPI Benchmarking KPI
Costs
OPEX
Maintenance
Traffic management
CAPEX
Renewals
Revenues
Non access charges
Track access charges
Proportion
Incentive regimes
PRIME
Context Safety & Environment Performance Delivery

1) Results are normalised for purchasing power parity
Source: civity calculations using data as provided by the infrastructure managers until 13 April 2018 Data accuracy: N = Normal E = Estimate D = Deviating from definition P = Preliminary
Latest available year Average of available years 2012-2016 Total average latest available year
IM accuracy year • Average annual revenues from non-access
charges are 15.200 Euros per main track-
kilometre
66
Total revenues from non-access charges in relation to network size1)
1.000 Euro per main track-km
15,2
0 20 40 60 80
Adif N 2016
Bane NOR N 2016
DB N 2016
FTA N 2016
Infrabel E 2016
IP N 2016
NR
PKP PLK N 2016
ProRail N 2016
RFI N 2016
SNCF R. N 2016
TRV
KPI 80

1) Results are normalised for purchasing power parity
Source: civity calculations using data as provided by the infrastructure managers until 13 April 2018 Data accuracy: N = Normal E = Estimate D = Deviating from definition P = Preliminary
Latest available year Average of available years 2012-2016 Total average latest available year
IM accuracy year • Average annual revenues from track access
charges are 44.400 Euros per main track-
kilometre
67
TAC revenue in relation to network size1)
1.000 Euro per main track-km
44,4
0 50 100 150
Adif N 2016
Bane NOR N 2016
DB N 2016
FTA N 2016
Infrabel N 2016
IP N 2016
NR
PKP PLK N 2016
ProRail N 2016
RFI N 2016
SNCF R. N 2016
TRV N 2016
KPI 87

Source: civity calculations using data as provided by the infrastructure managers until 13 April 2018 Data accuracy: N = Normal E = Estimate D = Deviating from definition P = Preliminary
Latest available year Average of available years 2012-2016 Total average latest available year
IM accuracy year
73,1
0 50 100
Adif N 2016
Bane NOR N 2016
DB N 2016
FTA N 2016
Infrabel E 2016
IP N 2016
NR
PKP PLK N 2016
ProRail N 2016
RFI N 2016
SNCF R. N 2016
TRV N 2016
• Track access charges account for nearly 75%
of the total revenues on average
68
Proportion of TAC in total revenue
% of monetary value
KPI 81

1) Results are normalised for purchasing power parity
Source: civity calculations using data as provided by the infrastructure managers until 13 April 2018 Data accuracy: N = Normal E = Estimate D = Deviating from definition P = Preliminary
Latest available year Average of available years 2012-2016 Total average latest available year
IM accuracy year • The average annual "income" from incentives
is rather a malus payment of 70 Euros per
main track-km
69
Income from incentive regimes in relation to network size1)
1.000 Euro per main track-km
-0,07
-1,5 -1 -0,5 0 0,5 1
Adif N 2016
Bane NOR N 2016
DB
FTA D 2015
Infrabel N 2016
IP N 2016
NR
PKP PLK N 2016
ProRail N 2016
RFI N 2016
SNCF R. N 2016
TRV N 2016
KPI 91

Table of contents
• Purpose of this report
• Context
• Benchmarking results
– Overview, framework and maturity
– KPI results
- Context
- Safety and environment
- Performance
- Delivery
- Financial
- Growth
– Assessment of the current status of benchmarking
• Appendix
70

• Improve the use of the overall capacity of the railway
network;
• Encourage modal shift to rail from road and air;
• Promote multi-modal transport integration;
• Understand and use new technology, such as ERTMS,
effectively and efficiently to support the objectives of the IM
and the integrated railway.
Aim is to describe the current / future network use /
technology, and integration with other transport modes
Growth – objectives
71
Source: PRIME Catalogue Version 2.0, 25 September 2017

Utilisation is an essential measure of the performance of an IM. One of the most important objectives for an IM is to use its infrastructure as effectively as
possible. This measure also distinguishes between passenger and freight traffic. Utilisation has a major impact on the ability of an IM to cover its costs and
the utilisation of the infrastructure will also affect the future performance (other KPIs) of the infrastructure, e.g. overall condition.
Growth – Utilisation – Overview
72
PRIME
Context Safety & Environment Performance Delivery Financial Growth
Average daily train-km on main track (passenger and freight revenue service only, no shunting, no work trains) related to
main track-km
Average daily passenger train-km on main track (revenue service only, no shunting, no work trains) related to main track-
km
Average daily freight train-km on main track (revenue service only, no shunting, no work trains) related to main track-km
Degree of utilisation – all
trains
Degree of utilisation –
passenger trains
Degree of utilisation – freight
trains
KPI Definition KPI Name
Utilisation
Train-km
Passenger trains
Freight trains
Asset Capability & ERTMS
Deployment today
Deployment 2030
Intermodality
Intermodal stations
Passengers at
accessible stations
High Level Industry KPI Benchmarking KPI

Source: civity calculations using data as provided by the infrastructure managers until 13 April 2018 Data accuracy: N = Normal E = Estimate D = Deviating from definition P = Preliminary
Latest available year Average of available years 2012-2016 Total average latest available year
IM accuracy year
73
Degree of network utilisation – all trains
Daily train-km per main track-km
36,4
0 50 100
Adif N 2016
Bane NOR D 2016
DB
FTA E 2016
Infrabel N 2016
IP N 2016
NR D 2016
PKP PLK N 2016
ProRail N 2016
RFI N 2016
SNCF R. N 2016
TRV N 2016
KPI 92
• The utilisation of European railway networks
varies widely. On average 36 trains per main
track-km (passenger and freight) are running
daily on European railway network
Bane NOR N 2016

Source: civity calculations using data as provided by the infrastructure managers until 13 April 2018 Data accuracy: N = Normal E = Estimate D = Deviating from definition P = Preliminary
Latest available year Average of available years 2012-2016 Total average latest available year
IM accuracy year
74
Degree of network utilisation – passenger trains
Daily passenger train-km per main track-km
31,0
0 25 50 75 100
Adif N 2016
Bane NOR N 2016
DB
FTA E 2016
Infrabel N 2016
IP N 2016
NR D 2016
PKP PLK N 2016
ProRail N 2016
RFI N 2016
SNCF R. N 2016
TRV N 2016
KPI 93
• On average 31 passenger trains per main
track-km are running daily on European
railway tracks

Source: civity calculations using data as provided by the infrastructure managers until 13 April 2018 Data accuracy: N = Normal E = Estimate D = Deviating from definition P = Preliminary
Latest available year Average of available years 2012-2016 Total average latest available year
IM accuracy year
75
Degree of network utilisation – freight trains
Daily freight train-km per main track-km
5,37
0 5 10
Adif N 2016
Bane NOR N 2016
DB
FTA E 2016
Infrabel N 2016
IP N 2016
NR D 2016
PKP PLK N 2016
ProRail N 2016
RFI N 2016
SNCF R. N 2016
TRV N 2016
KPI 94
• On average 5 freight trains per main track-km
are running daily on European railway tracks

Asset capability describes the functionality of the IM’s railway network. It provides the overview of the capability of the network and specifically the extent
to which the network meets the TEN-T requirements. The asset capability describes the IM’s part of the interoperability of the European railway network,
although it is recognised that achievement of interoperability requires capability and functionality from the railway operators as well.
Growth – Asset Capability & ERTMS – Overview
76
PRIME
Context Safety & Environment Performance Delivery Financial Growth
Main tracks with ERTMS in operation in proportion to total main tracks (measured in track-km)
In 2030, the percentage of main track-km planned to have been deployed with ERTMS, i.e. main tracks equipped with both
- ETCS (European train control system; any baseline or level) and GSM-R (Global System for Mobile Communications);
and where ETCS and GSM-R are used in service
ERTMS deployment
Planned extent of ERTMS
deployment by 2030
KPI Definition KPI Name
High Level Industry KPI Benchmarking KPI
Utilisation
Train-km
Passenger trains
Freight trains
Asset Capability & ERTMS
Deployment today
Deployment 2030
Intermodality
Intermodal stations
Passengers at
accessible stations

Source: civity calculations using data as provided by the infrastructure managers until 13 April 2018 Data accuracy: N = Normal E = Estimate D = Deviating from definition P = Preliminary
Latest available year Average of available years 2012-2016 Total average latest available year
IM accuracy year
77
ERTMS deployment
% of main track-km
5,92
0 5 10 15 20
Adif N 2016
Bane NOR N 2016
DB N 2016
FTA N 2016
Infrabel N 2015
IP N 2016
NR N 2015
PKP PLK N 2016
ProRail N 2016
RFI N 2016
SNCF R. N 2016
TRV N 2016
constantly increasing
KPI 98
• The degree of installation of ERTMS in the
reporting IMs is covering 6% of their total
network

Source: civity calculations using data as provided by the infrastructure managers until 13 April 2018 Data accuracy: N = Normal E = Estimate D = Deviating from definition P = Preliminary
Latest available year Average of available years 2012-2016 Total average latest available year
IM accuracy year
78
Planned extent of ERTMS deployment by 2030
% of current main track-km
52,5
0 25 50 75 100 125
Adif
Bane NOR N 2016
DB N 2016
FTA N 2016
Infrabel N 2015
IP D 2014
NR
PKP PLK N 2016
ProRail P 2016
RFI N 2016
SNCF R.
TRV N 2016
KPI 101
• By 2030 ETCS is expected to be rolled out in
half of the railway network of reporting IMs
Network in 2030 will be
longer than today
E

A highly functional intermodality between different transport modes can bring traffic and business to the rail network. Since trains rarely offer a door-to-
door solution, and rather is a part of the mobility chain, connections between modes become essential for the customers. Intermodality promotes
efficiency for both freight and passenger traffic. Intermodality also increases the number of potential customers for rail.
Growth – Intermodality – Overview
79
PRIME
Context Safety & Environment Performance Delivery Financial Growth
Percentage of public passenger railway stations with connections to public urban transport (metro, bus, tramways, light rail,
ferries etc.…) within the entire railway infrastructure network, independent of ownership (Source "Passenger stations":
European Commission, RMMS)
Percentage of passengers registered annually in all accessible stations within the entire railway infrastructure network,
independent of ownership, related to the total number of passengers. An accessible station is one on which a passenger
can, from entering the station, reach the platform via level-access, without steps or equivalent.
Intermodal stations
Passengers using accessible
stations
KPI Definition KPI Name
High Level Industry KPI Benchmarking KPI
Utilisation
Train-km
Passenger trains
Freight trains
Asset Capability & ERTMS
Deployment today
Deployment 2030
Intermodality
Intermodal stations
Passengers at
accessible stations
Intermodality-related data is
not yet sufficiently complete
and robust for publishing

Table of contents
• Purpose of this report
• Context
• Benchmarking results
– Overview, framework and maturity
– KPI results
– Assessment of the current status of benchmarking
• Appendix
80

Overall this has been a successful phase of continuous
development of the PRIME KPI exercise
Assessment of the current status of benchmarking
• This phase of the PRIME KPI exercise between July 2017 and May 2018 has carried matters from a
pilot into an operating phase
• It achieved a considerable development of the data definitions and actual data, which is
documented in the Catalogue 2.1
• The IT-tool has been put into operation for data collection and validation and has been further
developed, thus increasing usability and supporting a focused data collection as well as validation,
interpretation and management of data
• A first internal benchmarking report includes additional evaluations such as comparisons against
multi-annual averages, KPI correlations, qualitative relationships between KPIs and drivers of
performance in the different PRIME KPI dimensions
• It is recognised that differences in KPI values across IMs can be due to a variety of factors, some
within and some outside of the control of IMs, and a ranking based on single KPIs is thus not
appropriate
• Further work is required to make the database more complete and to improve the robustness and
comparability of the KPIs, with focus on strategic interests
• This first published benchmarking report represents a relevant step for railway infrastructure
business benchmarking by providing a performance overview based on factual information
• Meanwhile the PRIME KPI subgroup recognises that the larger benefits from this exercise, i.e.
mutual learning between IMs and business improvement, will be realised through perseverance and
further in-depth analysis
81

Table of contents
• Purpose of this report
• Context
• Benchmarking results
• Appendix
– Country characteristics & Market and operations
– Organisation & Network
82
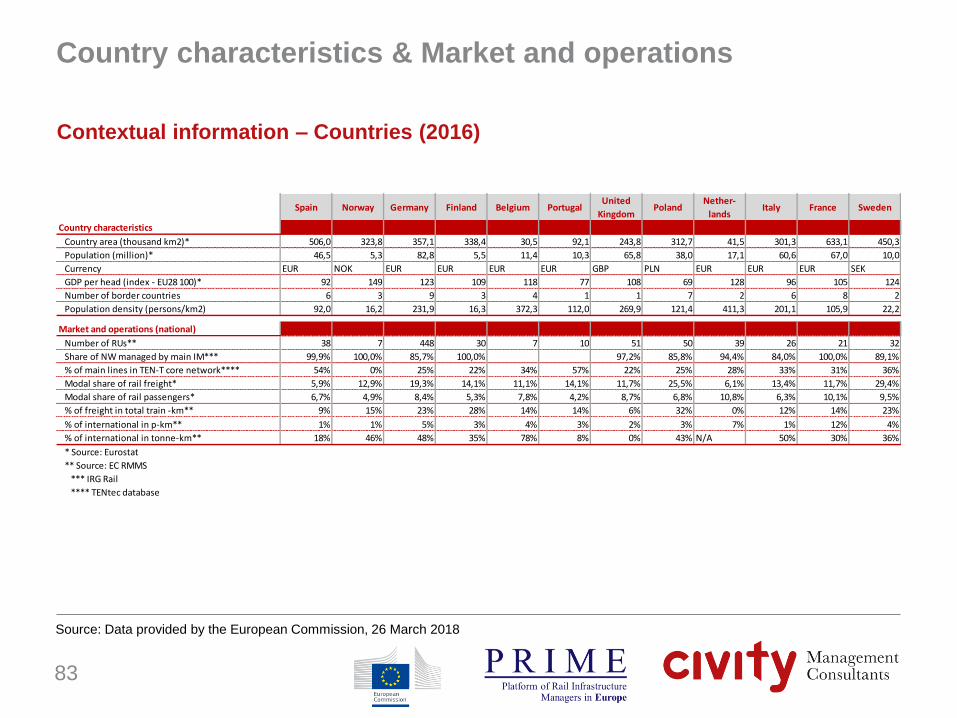
Country characteristics & Market and operations
Contextual information – Countries (2016)
83
Source: Data provided by the European Commission, 26 March 2018
Spain Norway Germany Finland Belgium PortugalUnited
KingdomPoland
Nether-
landsItaly France Sweden
Country characteristics
Country area (thousand km2)* 506,0 323,8 357,1 338,4 30,5 92,1 243,8 312,7 41,5 301,3 633,1 450,3
Population (million)* 46,5 5,3 82,8 5,5 11,4 10,3 65,8 38,0 17,1 60,6 67,0 10,0
Currency EUR NOK EUR EUR EUR EUR GBP PLN EUR EUR EUR SEK
GDP per head (index - EU28 100)* 92 149 123 109 118 77 108 69 128 96 105 124
Number of border countries 6 3 9 3 4 1 1 7 2 6 8 2
Population density (persons/km2) 92,0 16,2 231,9 16,3 372,3 112,0 269,9 121,4 411,3 201,1 105,9 22,2
Market and operations (national)
Number of RUs** 38 7 448 30 7 10 51 50 39 26 21 32
Share of NW managed by main IM*** 99,9% 100,0% 85,7% 100,0% 97,2% 85,8% 94,4% 84,0% 100,0% 89,1%
% of main lines in TEN-T core network**** 54% 0% 25% 22% 34% 57% 22% 25% 28% 33% 31% 36%
Modal share of rail freight* 5,9% 12,9% 19,3% 14,1% 11,1% 14,1% 11,7% 25,5% 6,1% 13,4% 11,7% 29,4%
Modal share of rail passengers* 6,7% 4,9% 8,4% 5,3% 7,8% 4,2% 8,7% 6,8% 10,8% 6,3% 10,1% 9,5%
% of freight in total train -km** 9% 15% 23% 28% 14% 14% 6% 32% 0% 12% 14% 23%
% of international in p-km** 1% 1% 5% 3% 4% 3% 2% 3% 7% 1% 12% 4%
% of international in tonne-km** 18% 46% 48% 35% 78% 8% 0% 43% N/A 50% 30% 36%
* Source: Eurostat
** Source: EC RMMS
*** IRG Rail
**** TENtec database

Organisation & Network
Contextual information – Infrastructure Managers (2016)
84
Source: Data provided by the European Commission, 26 March 2018
Adif Bane NOR DB FTA Infrabel IP NR PKP PLK ProRail RFI SNCF R.Trafik-
verket
Organisation
Is the IM state-owned Yes Yes Yes Yes Yes Yes N/A Yes Yes Yes Yes
Are IM and operators integrated No No Yes No No No N/A No No No No
Number of FTE employees 12976 4311 43974 647 3732 38122 39153 3959 25132 53858 6607
Age average 53,23 45 47 48,1 49 46 49 41,5
Male employees among IM's workforce 86% 74% 81% 60% 76% 84% 68% 76% 88% 88% 63%
Network
Main line km (lines in commercial use) 15327 3856 5926 3602 2546 31221 18427 3169 16788 28364 9684
Total track-km 21067 4560 60512 8520 8776 3663 31221 36079 6412 29486 60920 14114
Total passenger high speed main track-km 5248 419 294 2300 4413
Single track-km per total track-km 46% 92% 0% 62% 22% 0% 13% 27% 15% 31% 20% 55%
Degree of electrification of total network (KPI 1) 73% 60% 69% 46% 83% 75% 42% 69% 77% 77% 56% 72%
Utilisation rate (thousand train km/main track km) 9,3 10,4 17,6 5,5 9,9 18,2 6,4 24,8 12,9 7,8 10,8