governing body - vopnc.org
TRANSCRIPT

Governing Body
93
Department Profile
The Governing Body of the Village consists of a five-member council that includes a directly elected
Mayor. The Council provides leadership and strategic vision for the Village. The Council considers and
adopts local ordinances and resolutions to provide for the health, safety, and overall quality of life for
the residents, businesses, and visitors of Pinehurst. Other responsibilities include:
Providing governance for a population of approximately 15,760
Setting strategic direction for approximately 130 full-time employees
Adopting the Strategic Operating Plan which includes the annual budget and five-year financial
forecast
Approving policies that provide guidance for all municipal operations
There are no KPIs for the Governing Body Department. Additional information about the Governing
Body Department may be obtained by contacting Lauren Craig, Village Clerk, at 910.295.1900 or
Budget Summary
FY 2015 FY 2016 FY 2016 FY 2017 Percent
Actual Budget Estimated Budgeted Change
Salaries & Benefits 29,893$ 31,000$ 30,015$ 31,000$ 0.0%
Operating 150,703 202,248 181,865 178,400 -11.8%
Expenditures Total 180,596$ 233,248$ 211,880$ 209,400$ -10.2%
Expenditures by Type
Village Council Members

Administration
94
Department Profile
The Administration Department, which includes the Village Manager, Assistant Village Managers, the
Village Clerk, and Administrative support staff, executes the mission of the Council to promote,
enhance, and sustain the quality of life for residents, businesses, and visitors. Other responsibilities
include:
Providing vision and leadership to 17 other departments and divisions of the Village
Effectively communicating with and engaging residents and businesses
Overseeing the development and implementation of the annual Strategic Operating Plan
Managing and monitoring department performance
Maintaining Village meeting minutes, records, and contracts
Recruiting, training, engaging, and rewarding over 200 volunteers
Providing customer service and administration support to both internal and external customers
Additional information about the Administration Department may be obtained by contacting Jeff
Sanborn, Village Manager, at 910.295.1900 or [email protected].
Budget Summary
FY 2015 FY 2016 FY 2016 FY 2017 Percent
Actual Budget Estimated Budgeted Change
Salaries & Benefits 671,023$ 697,250$ 684,131$ 729,450$ 4.6%
Operating 317,308 395,184 388,149 373,460 -5.5%
Capital 90,952 68,195 68,195 45,829 -32.8%
Expenditures Total 1,079,283$ 1,160,629$ 1,140,475$ 1,148,739$ -1.0%
Expenditures by Type
FY 2017 Initiative Action Plans
Initiative Action Plans Timeline FY 2017 Budget
Civic engagement (ACE)– increase resident engagement in-person
and online and create a centralized Communications Specialist
position
FY 2017-2018 $25,400
Continuous process improvement – continue to use the Baldrige
Performance Excellence Framework and participate in associated
award programs
FY 2017-2021 $7,000

Administration
95
Key Performance Indicators (KPIs)
Council Goal: Professionally Manage a High Performing Organization
KPI Type
FY 2014
Actual
FY 2015
Actual
FY 2016
Est.
FY 2017
Goal
FY 2021
Proj.
Department Goal: Use electronic tools and other methods to communicate with and obtain
actionable feedback from customers
Total # of followers on all social media sites Output 2,015 3,826 6,810 9,500 14,000
Total # of Facebook users reached with VOP posts Output 154,850 503,111 460,000 550,000 675,000
# of Facebook engaged users (clicks, comments,
and shares) Output 12,630 42,346 35,000 44,000 56,000
# of Open Village Hall topics posted Output n/a n/a 16 12 12
# of subscribers who view Open Village Hall topics Output n/a n/a 3,040 3,600 3,600
# of website sessions Output 142,176 132,360 146,000 180,000 146,000
% of quarterly newsletters produced and distributed
according to schedule Effectiveness 100% 100% 100% 100% 100%
# of mobile app downloads (cumulative) Output n/a 314 600 1,000 1,800
% of residents satisfied with Village efforts to keep
residents informed on local issues Effectiveness 94% 92% 90% 90% 95%
% of Council agendas with supporting materials
posted to the Village website 5 days in advance of
meetings
Effectiveness 61% 100% 100% 100% 100%
% of Council meeting videos posted to the Village
website within 24 hours of the meeting Effectiveness n/a 100% 100% 100% 100%
Department Goal: Oversee the implementation of the Village's Strategic Operating Plan and
manage the overall operations of the Village
% of quarterly leadership strategy sessions held Output n/a n/a 100% 100% 100%
% of residents satisfied with customer service
provided by Village employees Effectiveness 97% 99% 99% 95% 95%
% of residents likely to recommend the Village as a
place to live Effectiveness 95% 97% 97% 95% 95%
% of Initiative Action Plans (IAPs) that achieve
targeted results Effectiveness n/a n/a n/a 90% 90%
Department Goal: Identify, analyze, and mitigate risks to the Village
Cost of risk (premiums, legal fees, & losses) as a %
of General Fund expenditures Effectiveness 2.85% 2.49% 2.30% 2.20% 1.80%
Council Goal: Attract & Retain an Engaged Workforce
KPI Type
FY 2014
Actual
FY 2015
Actual
FY 2016
Est.
FY 2017
Goal
FY 2021
Proj.
Department Goal: Recruit, train, engage, and reward volunteers
% of volunteers who would recommend
volunteering for the Village to a friend Effectiveness 90% 96% 95% 95% 95%
Department Goal: Ensure effective two-way communication with the workforce
% of workforce who attend the bi-annual State of
the Village meetings Output n/a n/a 48% 50% 50%
% of workforce who are satisfied with bi-annual
State of the Village meetings Effectiveness n/a n/a 100% 95% 95%

Financial Services
96
Department Profile
The Financial Services Director reports directly to the Assistant Village Manager of Administration and
serves as a member of the senior leadership team. The Financial Services Department includes three
full-time and one part-time financial professionals. Two staff members who oversee the fiscal operations
of the Village are Certified Public Accountants. Fiscal operations include:
Managing an average cash and investments balance of $9.6 million dollars
Monitoring compliance with Council approved financial policies and guidelines
Managing debt to achieve acceptable debt service objectives
Preparing the $18.2 million annual budget and five-year financial forecast
Processing accounts payable, accounts receivable, and payroll
Preparing all internal and external financial reports
Overseeing the purchasing and contracting functions
Additional information about the Financial Services Department may be obtained by contacting John G.
Frye, CPA, Financial Services Director, at 910.295.1900 or [email protected].
Budget Summary
FY 2015 FY 2016 FY 2016 FY 2017 Percent
Actual Budget Estimated Budgeted Change
Salaries & Benefits 300,166$ 330,550$ 330,508$ 315,450$ -4.6%
Operating 250,047 287,380 288,717 294,090 2.3%
Capital 2,187 900 900 1,760 95.6%
Total Expenditures 552,400$ 618,830$ 620,125$ 611,300$ -1.2%
Expenditures by Type

Financial Services
97
Key Performance Indicators (KPIs)
Council Goal: Maintain a Healthy Financial Condition
KPI Type
FY 2014
Actual
FY 2015
Actual
FY 2016
Est.
FY 2017
Goal
FY 2021
Proj.
Department Goal: Produce accurate and timely financial reports
GFOA Certificate of Achievement in Financial
Reporting received Effectiveness Yes Yes Yes Yes Yes
A "clean" audit opinion received by external
auditors Effectiveness Yes Yes Yes Yes Yes
% of time month end expenditures closing entries
are posted by the 10th day of the following month Effectiveness n/a n/a 92% 92% 92%
% of employees satisfied with the availability of
financial information Effectiveness 98% 100% 100% 95% 95%
Department Goal: Develop a five-year strategic operating plan and annual budget in accordance
with Council’s financial policies
Actual revenues as a % of forecasted revenues Effectiveness 100.2% 100.8% 101.0% 101.0% 101.0%
% of "Outstanding" ratings received through
GFOA Distinguished Budget Presentation Award Effectiveness 28% 29% 37% 40% 50%
Department Goal: Process financial transactions efficiently and effectively
# of accounts payable invoices and payments
processed per accounts payable FTE Efficiency 941 833 852 850 850
% of purchase orders processed within 1 business
day of submission Effectiveness 99% 99% 98% 95% 95%
% of employees satisfied with the timeliness of
purchasing services Effectiveness 100% 98% 100% 95% 95%
# of payroll transactions processed per payroll
technician FTE Efficiency 1,111 1,100 1,167 1,150 1,150
% of employees satisfied with the accuracy of
payroll services Effectiveness n/a 100% 98% 95% 95%
# of other financial transactions processed per
finance technician FTE Efficiency 637 600 687 650 650
Department Goal: Maximize investment earnings while ensuring adequate cash flow
# of basis points by which investment yield exceeds
the average Federal Funds rate Effectiveness 4.00 0.00 0.05 1.00 1.00

Human Resources
98
Department Profile
The Human Resources Director reports directly to the Village Manager and serves as a member of the
senior leadership team. Along with the Director, one full-time Human Resources Generalist and one
part-time Human Resources Assistant, provide a strategic service for recruitment, retention and
recognition of competent staff. Areas of focus include:
Reward and recognition systems for approximately 130 full-time employees
Programs to enhance employee job satisfaction and a balanced family/work life
A comprehensive compensation and benefits package to encourage retention
Training and development programs to ensure workforce performance meets current and future
needs
Education and services to promote a safe work environment
Additional information about the Human Resources Department may be obtained by contacting Angela
Kantor, Human Resources Director, at 910.295.1900 or [email protected].
Budget Summary
FY 2015 FY 2016 FY 2016 FY 2017 Percent
Actual Budget Estimated Budgeted Change
Salaries & Benefits 206,173$ 222,450$ 219,466$ 229,550$ 3.2%
Operating 114,190 147,240 114,101 200,510 36.2%
Capital 1,094 450 450 2,200 388.9%
Expenditures Total 321,457$ 370,140$ 334,017$ 432,260$ 16.8%
Expenditures by Type
FY 2017 Initiative Action Plans
Initiative Action Plans Timeline FY 2017 Budget
Workforce plans (ACE) – forecast future workforce capacity and
capability needs and close any gaps FY 2017-2018 $1,000
Learning & development system (ACE) – develop a systematic
learning & development system to include formalized succession
planning
FY 2017-2018 $0

Human Resources
99
Key Performance Indicators (KPIs)
Council Goal: Attract and Retain an Engaged Workforce
KPI Type
FY 2014
Actual
FY 2015
Actual
FY 2016
Est.
FY 2017
Goal
FY 2021
Proj.
Department Goal: Reward and recognize employees
% of employees who agree they are satisfied with
reward & recognition programs Effectiveness 85% 80% 83% 85% 88%
% of employees recognized in Village-wide award
programs Effectiveness n/a n/a 77% 77% 80%
Department Goal: Maintain a safe work environment
% of Safety Committee inspection violations
corrected within 90 days Effectiveness 0% 0% 0% 75% 85%
% of injuries that are preventable Effectiveness 57% 33% 30% 27% 23%
% of accidents that are preventable Effectiveness n/a n/a 70% 68% 63%
# of Worker's Compensation claims per 100 FTEs Effectiveness 5.3 4.6 4.6 <5 <5
DART (Days away from work, restriction, or
transfer) rate Effectiveness 3.74 2.23 1.47 1.70 1.70
Department Goal: Provide competitive salaries and benefits
% of positions reviewed for competitive salaries Output 86% 36% 33% 33% 33%
% of employees who receive compensation
adjustments (if needed) based on market salary
reviews
Effectiveness n/a n/a 100% 100% 100%
% of employees who participate in Wellness
Committee activities Effectiveness n/a n/a n/a 50% 60%
Department Goal: Effectively fill vacant positions
Average # of days to recruit (requisition to start
date) Effectiveness 69.9 66.7 80 70 60
% of positions filled within target date Effectiveness n/a n/a n/a 85% 90%
% of turnover (all) Effectiveness 8% 14% 10% <10% <10%
% of turnover (voluntary, excluding retirements) Effectiveness 6% 8% 5% <5% <5%
% of turnover during the first year of employment Effectiveness 0% 1.6% 0% 0% 0%
Average tenure of employees Output NA 10.20 8.00 8.00 8.50
Sick leave hours used per 1,000 hours worked Effectiveness 26.54 33.99 28.00 28.00 25.00
Department Goal: Provide training and development opportunities
% of employees who agree they are offered
training and development to enhance their skills Effectiveness 97% 92% 92% 95% 95%
% of employees who agree they have input into
their personal development plan Effectiveness 97% 95% 95% 95% 95%
% of vacancies filled with internal candidates Effectiveness 36% 85% 58% 50% 50%

Police
100
Department Profile
The Police Chief reports directly to the Village Manager and serves as a member of the senior leadership
team. In addition to the Chief, the Police Department consists of 22 sworn police officers, four
dispatchers, one administrative assistant and six reserve auxiliary officers to protect the life and property
of approximately 15,760 residents. Areas of responsibility include:
Patrolling three response areas
Dispatching approximately 1,000 routine and emergency police calls monthly
Investigating and gathering evidence to solve crimes
Promoting strong community engagement
Additional information about the Police Department may be obtained by contacting Earl Phipps, Police
Chief, at 910.295.3141 or [email protected].
Budget Summary
FY 2015 FY 2016 FY 2016 FY 2017 Percent
Actual Budget Estimated Budgeted Change
Salaries & Benefits 1,941,923$ 2,038,235$ 1,938,110$ 2,226,038$ 9.2%
Operating 654,625 769,979 720,482 727,900 -5.5%
Capital 129,863 141,385 141,385 77,715 -45.0%
Expenditures Total 2,726,411$ 2,949,599$ 2,799,977$ 3,031,653$ 2.8%
FY 2015 FY 2016 FY 2016 FY 2017 Percent
Actual Budget Estimated Budgeted Change
Controlled Substance Tax Distribution 1,646$ 1,100$ 1,100$ 1,000$ -9.1%
Parking Fines 450 - - - 0.0%
Miscellaneous Police Revenues 8,724 6,000 6,500 6,500 8.3%
Revenues Total 10,820$ 7,100$ 7,600$ 7,500$ 5.6%
Expenditures by Type
Revenues by Type
FY 2017 Initiative Action Plans
Initiative Action Plans Timeline FY 2017 Budget
Citizens on Patrol (ACE) – expand Citizens on Patrol FY 2017-2018 $0
Traffic enforcement – increase enforcement of local traffic laws
with two additional police officers FY 2017 $104,400
Police Department staffing – reorganize the Police Department to
improve operating efficiency & effectiveness FY 2017 $57,100

Police
101
Key Performance Indicators (KPIs)
Council Goal: Safeguard the Community
KPI Type
FY 2014
Actual
FY 2015
Actual
FY 2016
Est.
FY 2017
Goal
FY 2021
Proj.
Department Goal: Enforce traffic laws
% of collisions with an injury Effectiveness 12% 15% 15% 15% 11%
% of collisions with a fatality Effectiveness 0.20% 0.00% 0.00% 0.30% 0.30%
# of collisions per 1,000 population Output 34 34 41 41 33
Average vehicle speed as a % of the posted MPH Effectiveness n/a n/a 140% 132% 116%
Department Goal: Protect the lives and property of residents
% of officer hours available on patrol Effectiveness n/a n/a n/a 40% 40%
Department Goal: Solve crimes
% of Part 1 - Violent crimes solved Effectiveness 20% 67% 70% 70% 75%
% of Part 1 - Property crimes solved Effectiveness 24% 38% 40% 40% 40%
% of Part 2 crimes solved Effectiveness 48% 70% 67% 65% 70%
Department Goal: Respond promptly to calls for service
# of citizen initiated calls for service per patrol
officer Efficiency 339 326 425 427 436
# of officer initiated calls for service per patrol
officer Efficiency 261 247 185 250 290
# of calls for service per 1,000 population Output 791 737 775 780 800
% of calls for service that are citizen initiated Output 57% 57% 70% 68% 60%
% of calls for service that are officer initiated Output 43% 43% 30% 35% 43%
% of total time spent on calls for service that are
citizen initiated Effectiveness 50% 64% 67% 60% 40%
% of total time spent on calls for service that are
officer initiated Effectiveness 50% 36% 33% 40% 60%
Council Goal: Attract and Retain an Engaged Workforce
KPI Type
FY 2014
Actual
FY 2015
Actual
FY 2016
Est.
FY 2017
Goal
FY 2021
Proj.
Department Goal: Utilize Citizen on Patrol volunteers to supplement police staff
# of Citizen on Patrol volunteer hours Output 3,722 2,319 2,948 3,000 3,400
# of Citizen on Patrol volunteer hours per volunteer Effectiveness 93 70 72 75 95
$ value of Citizen on patrol volunteer hours Effectiveness $76,230 $57,603 $58,964 $60,000 $80,000
Department Goal: Develop a competent, professional police force
% of full-time sworn officers who obtain
intermediate or advanced certifications Effectiveness n/a n/a 61% 70% 92%

Fire
102
Department Profile
The Fire Chief reports directly to the Village Manager and serves as a member of the senior leadership
team. Twenty-nine firefighters and one fire/life safety educator protect the Village and rural district
from two stations with four engines, two brush trucks, and a rescue truck. Areas of responsibility
include:
Protecting the life, property, and environment in an area encompassing 28.91 square miles and
approximate population of 17,600, including a rural county district and the Town of Taylortown
Educating the public to promote preparedness for all hazards
Conducting fire inspection, suppression medical first response, and rescue services
Responding to approximately 1,150 incidents annually
Additional information about the Fire Department may be obtained by contacting J. Carlton Cole, Fire
Chief, at 910.295.5575 or [email protected].
Budget Summary
FY 2015 FY 2016 FY 2016 FY 2017 Percent
Actual Budget Estimated Budgeted Change
Salaries & Benefits 2,054,235$ 2,185,700$ 2,097,788$ 2,236,150$ 2.3%
Operating 437,966 543,878 499,770 495,390 -8.9%
Capital 98,677 114,115 114,115 675,706 492.1%
Expenditures Total 2,590,878$ 2,843,693$ 2,711,673$ 3,407,246$ 19.8%
FY 2015 FY 2016 FY 2016 FY 2017 Percent
Actual Budget Estimated Budgeted Change
Fire Inspection Fees -$ 1,000$ 1,000$ -$ 100.0%
Fire District Revenue 202,694 200,000 200,000 253,000 26.5%
Fire Grants 14,000 26,000 26,000 - 0.0%
Revenues Total 216,694$ 227,000$ 227,000$ 253,000$ 11.5%
Expenditures by Type
Revenues by Type
FY 2017 Initiative Action Plans
Initiative Action Plans Timeline FY 2017 Budget
Traffic pre-emption program – install traffic pre-emption devices
at signalized intersections FY 2017-2021 $12,500
Fire Department accreditation – achieve international accreditation
in the Fire Department FY 2017 $2,000

Fire
103
Key Performance Indicators (KPIs)
Council Goal: Safeguard the Community
KPI Type
FY 2014
Actual
FY 2015
Actual
FY 2016
Est.
FY 2017
Goal
FY 2021
Proj.
Department Goal: Prevent fires and injuries
# of commercial business fire inspections
completed Output 385 353 256 380 380
% of commercial businesses inspected Efficiency 91% 84% 61% 90% 90%
# of commercial business fire inspections per
inspector per month Output 12 19 12 13 15
% of businesses satisfied with fire prevention
inspection services Effectiveness 95% 96% 90% 90% 90%
% of fire hydrants tested Effectiveness 97% 96% 95% 95% 95%
# of participants in Fire & Life Safety Education
Programs Effectiveness 7,487 25,626 23,000 20,000 20,000
Fire incident rates per 1,000 population served Effectiveness 3.68 3.34 3.25 3.25 3.00
ISO (Insurance Services Office) Rating Effectiveness 4 4 4 4 4
Life Safety Achievement Award for zero fire
deaths Effectiveness Yes Yes Yes Yes Yes
Department Goal: Promptly respond to fire calls for service
% of dispatched emergency calls with a reaction
time of 90 seconds or less Effectiveness 67% 76% 76% 77% 80%
% of emergency calls with a response time of 6
minutes and 30 seconds for first due apparatus Effectiveness 67% 73% 74% 75% 79%
% of calls for fire incidents Output 6.5% 5.6% 3.3% 3.3% 2.9%
% of calls for service for rescue and EMS calls for
service Output 9.9% 8.4% 18.8% 50.0% 50.0%
% of signalized intersections with preemption
controls Effectiveness 0% 15% 23% 31% 62%
Council Goal: Attract and Retain an Engaged Workforce
KPI Type
FY 2014
Actual
FY 2015
Actual
FY 2016
Est.
FY 2017
Goal
FY 2021
Proj.
Department Goal: Train and develop a professional, competent firefighting force
% of full-time uniformed staff who pass the
OSHA/NFPA medical clearance test Effectiveness n/a 100% 100% 100% 100%
% of full-time staff certified as an Emergency
Medical Technician Effectiveness 77% 77% 85% 90% 100%
% of full-time uniformed staff who obtain
advanced training Effectiveness 30% 60% 26% 25% 25%
% of firefighters meeting or exceeding NFPA
firefighter competencies Effectiveness 100% 100% 100% 100% 100%

Inspections
104
Department Profile
The Inspections Department is a division of the Planning Department and reports directly to the
Planning and Inspections Director. The Inspections Department includes two building inspectors.
Inspections personnel both review and enforce compliance with the North Carolina Codes for all types
of residential and commercial building and development. Responsibilities include:
Performing approximately 5,200 inspections annually
Approving plans for approximately 240 residential and 10 commercial projects per year resulting
in the issuance of 135 Certificates of Occupancy (CO)
Additional information about the Inspections Department may be obtained by contacting Kevin Reed,
Planning and Inspections Director, at 910.295.8659 or [email protected].
Budget Summary
FY 2015 FY 2016 FY 2016 FY 2017 Percent
Actual Budget Estimated Budgeted Change
Salaries & Benefits 201,127$ 197,500$ 167,673$ 183,000$ -7.3%
Operating 23,901 34,185 34,107 32,955 -3.6%
Capital 1,172 25,355 25,355 882 -96.5%
Expenditures Total 226,200$ 257,040$ 227,135$ 216,837$ -15.6%
FY 2015 FY 2016 FY 2016 FY 2017 Percent
Actual Budget Estimated Budgeted Change
Inspection Permit Revenue 226,200$ 257,040$ 227,135$ 216,837$ -15.6%
Revenues Total 226,200$ 257,040$ 227,135$ 216,837$ -15.6%
Expenditures by Type
Revenues by Type

Inspections
105
Key Performance Indicators (KPIs)
Council Goal: Ensure Pinehurst is a Premier Residential Community
KPI Type
FY 2014
Actual
FY 2015
Actual
FY 2016
Est.
FY 2017
Goal
FY 2021
Proj.
Department Goal: Inspect residential and non-residential development to ensure compliance with
building codes
# of building inspections completed Output 5,068 5,622 5,060 5,200 5,835
% of building inspections completed within one
business day Effectiveness 95% 99% 100% 99% 99%
% of building inspections compliant upon initial
inspection Effectiveness 95% 94% 94% 95% 95%
# of building inspections completed per inspector
FTE per day Efficiency 10.8 12.0 12.0 12.0 12.0
# of building inspections completed per 1,000
population served Output 335 362 322 330 350
# of residential Certificates of Occupancy issued Output 154 169 129 133 150
# of non-residential Certificates of Occupancy
issued Output 3 8 6 4 40
Estimated residential construction cost for
Certificates of Occupancy Output $26.7 M $27.0 M $25.9 M $26.7 M $30.0 M
Estimated non-residential construction cost for
Certificates of Occupancy Output $1.4 M $6.6 M $4.2 M $2.0 M $2.0 M
% of businesses satisfied with building inspections Effectiveness 100% 100% 99% 95% 95%
Council Goal: Maintain a Healthy Financial Condition
KPI Type
FY 2014
Actual
FY 2015
Actual
FY 2016
Est.
FY 2017
Goal
FY 2021
Proj.
Department Goal: Recover the cost of inspection services
% of inspections operating costs recovered through
inspection fees Effectiveness 120% 129% 136% 125% 125%
Average cost per building inspection Efficiency $42 $40 $40 $40 $40

Public Services Administration
106
Department Profile
Public Services Administration is a division of the Public Services Department. The Director of the
Public Services Department reports directly to the Assistant Village Manager of Operations and is a
member of the senior leadership team. The Public Services Administration Division consists of the
Director, the Assistant Director, and an Administrative Assistant. Areas of focus include:
Providing vision and leadership for Solid Waste and Streets and Grounds divisions and 27
employees
Meeting customer expectations for transportation, street and neighborhood maintenance, and
solid waste services
KPIs for this department are identified in the Solid Waste and Streets and Grounds divisions. Additional
information about Public Services Administration may be obtained by contacting Walt Morgan, Public
Services Director, at 910.295.5021 or [email protected].
Budget Summary
FY 2015 FY 2016 FY 2016 FY 2017 Percent
Actual Budget Estimated Budgeted Change
Salaries & Benefits 282,787$ 298,850$ 289,156$ 309,350$ 3.5%
Operating 75,072 106,610 103,085 96,090 -9.9%
Capital 978 486,285 486,285 97,871 -79.9%
Expenditures Total 358,837$ 891,745$ 878,526$ 503,311$ -43.6%
Expenditures by Type
Public Services Department

Streets & Grounds
107
Department Profile
The Streets and Grounds Division of the Public Services Department operates under the direction of the
Assistant Director of Public Services. There are 15 members of the Streets and Grounds team, led by an
Infrastructure Superintendent. This division serves approximately 15,760 residents encompassing an
area of 14.9 square miles. Responsibilities include:
Maintaining approximately 107 miles of paved streets (Village roads)
Maintaining directional, roadway, and regulatory signs
Periodically assisting Solid Waste Division in removing debris
Maintaining 17,155 linear feet of pedestrian walkways
Maintaining/improving sidewalks and other public landscape areas
Collecting metal white goods
Maintaining approximately 25 lane miles of NCDOT roads in the Village
Additional information about Streets and Grounds Division may be obtained by contacting Walt
Morgan, Public Services Director, at 910.295.5021 or [email protected].
Budget Summary
FY 2015 FY 2016 FY 2016 FY 2017 Percent
Actual Budget Estimated Budgeted Change
Salaries & Benefits 641,792$ 672,120$ 640,433$ 701,600$ 4.4%
Operating 564,104 599,920 556,489 622,000 3.7%
Capital 396,368 309,228 309,228 466,881 51.0%
Expenditures Total 1,602,264$ 1,581,268$ 1,506,150$ 1,790,481$ 13.2%
Expenditures by Type
FY 2017 Initiative Action Plans
Initiative Action Plans Timeline FY 2017 Budget
Street lighting – expand street lighting in neighborhoods FY 2017-2020 $1,400
Streetscape enhancements – expand brick sidewalks and streetscape
improvements around the Village Center FY 2017-2018 $140,000

Streets & Grounds
108
Key Performance Indicators (KPIs)
Council Goal: Ensure Pinehurst Is a Premier Residential Community
KPI Type
FY 2014
Actual
FY 2015
Actual
FY 2016
Est.
FY 2017
Goal
FY 2021
Proj.
Department Goal: Maintain Village right of ways
% of right of way lane miles shoulders inspected Effectiveness 16% 12% 17% 17% 17%
# of right of way lane miles maintained per FTE Efficiency 16 16 16 16 16
% of ROW mowing performed according to
schedule Effectiveness n/a n/a 94% 94% 94%
% of stormwater facilities inspected and cleared Effectiveness n/a n/a 94% 94% 94%
% of residents satisfied with stormwater
management Effectiveness 83% 86% 86% 86% 86%
# of street lights per mile Effectiveness 3 3 3 3 4
Council Goal: Provide Multimodal Transportation Systems
KPI Type
FY 2014
Actual
FY 2015
Actual
FY 2016
Est.
FY 2017
Goal
FY 2021
Proj.
Department Goal: Maintain directional and regulatory street signs
% of regulatory reflective signs inspected Output 11% n/a 11% 22% 22%
% of street signs inspected and maintained Output n/a n/a 22% 22% 22%
Department Goal: Monitor traffic congestion
% of intersections studied with a level of service
(LOS) rating of "C" or higher Effectiveness 76% 86% 85% 85% 83%
Department Goal: Maintain Village roadways
# of miles of Village roadways resurfaced Output 5.00 4.07 2.00 4.50 5.00
# of centerline miles of Village roadways Input 106.00 106.50 106.75 106.75 107.25
% of centerline miles of Village roadways
resurfaced Effectiveness 4.72% 4.23% 1.87% 4.22% 4.66%
5-year rolling average of the # of miles of roadways
resurfaced Effectiveness 4.48 4.42 3.88 3.92 4.90
% of roadways with a Pavement Condition rating of
85 or better Effectiveness 60% 60% 60% 56% 60%
Pavement condition Rating Effectiveness 82.90 82.90 80.00 80.00 82.00
% of residents satisfied with maintenance of streets
in neighborhoods Effectiveness 86% 85% 85% 85% 85%

Powell Bill
109
Department Profile
The Powell Bill Department is managed by the Public Services Director and is used to separately
identify the expenditure of restricted State Powell Bill Funds that are used for the purpose of
construction, repair, and maintenance of Village-owned streets and right of ways. Focus areas include:
Resurfacing 3-5 miles of Village maintained streets annually
Maintaining a 15-25 year life cycle for Village maintained streets
KPIs for the Powell Bill Department are provided in the Streets & Grounds division. The Powell Bill
Department does not contain any staff. However, additional information about the Powell Bill
Department may be obtained by contacting Walt Morgan, Public Services Director, at 910.295.5021 or
Budget Summary
FY 2015 FY 2016 FY 2016 FY 2017 Percent
Actual Budget Estimated Budgeted Change
Operating 806,847$ 654,000$ 651,000$ 900,300$ 37.7%
Capital 21,115 146,000 25,000 - -100.0%
Expenditures Total 827,962$ 800,000$ 676,000$ 900,300$ 12.5%
FY 2015 FY 2016 FY 2016 FY 2017 Percent
Actual Budget Estimated Budgeted Change
Powell Bill Revenue 492,706$ 492,000$ 495,083$ 494,000$ 0.4%
Revenues Total 492,706$ 492,000$ 495,083$ 494,000$ 0.4%
Expenditures by Type
Revenues by Type
Village Street Resurfacing

Solid Waste
110
Department Profile
The Solid Waste Division of the Public Services Department operates under the direction of the
Assistant Director of Public Services. There are nine members of the Solid Waste team, led by a Solid
Waste Superintendent. This division provides approximately 8,150 households with weekly pickup of
garbage, recycling, and yard debris. Solid Waste functions include:
Operating automated trash trucks and small garbage trucks (12 total) to collect trash, recycling,
and yard debris
Recycling approximately 163 tons of curbside recyclables monthly
Removing approximately 342 tons of curbside household refuse monthly
Removing approximately 1,884 tons of yard debris annually
Additional information about Solid Waste Division may be obtained by contacting Walt Morgan, Public
Services Director, at 910.295.5021 or [email protected].
Budget Summary
FY 2015 FY 2016 FY 2016 FY 2017 Percent
Actual Budget Estimated Budgeted Change
Salaries & Benefits 420,253$ 480,155$ 450,494$ 476,450$ -0.8%
Operating 984,242 904,645 848,736 896,240 -0.9%
Capital 182,305 325,780 325,780 3,936 -98.8%
Expenditures Total 1,586,800$ 1,710,580$ 1,625,010$ 1,376,626$ -19.5%
Expenditures by Type
FY 2017 Initiative Action Plans
Initiative Action Plans Timeline FY 2017 Budget
Supplemental yard debris collection (ACE) – provide
supplemental fall leaf and storm debris collection FY 2017 $20,000
Solid Waste
111
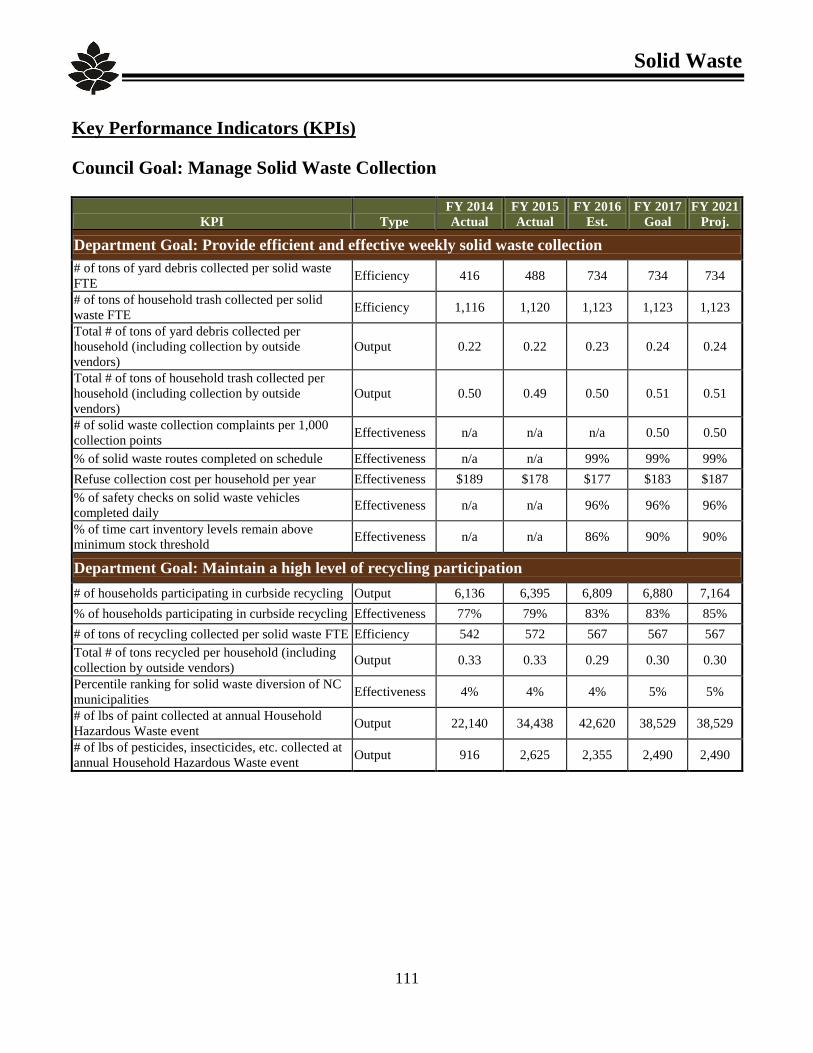
Key Performance Indicators (KPIs)
Council Goal: Manage Solid Waste Collection
KPI Type
FY 2014
Actual
FY 2015
Actual
FY 2016
Est.
FY 2017
Goal
FY 2021
Proj.
Department Goal: Provide efficient and effective weekly solid waste collection
# of tons of yard debris collected per solid waste
FTE Efficiency 416 488 734 734 734
# of tons of household trash collected per solid
waste FTE Efficiency 1,116 1,120 1,123 1,123 1,123
Total # of tons of yard debris collected per
household (including collection by outside
vendors)
Output 0.22 0.22 0.23 0.24 0.24
Total # of tons of household trash collected per
household (including collection by outside
vendors)
Output 0.50 0.49 0.50 0.51 0.51
# of solid waste collection complaints per 1,000
collection points Effectiveness n/a n/a n/a 0.50 0.50
% of solid waste routes completed on schedule Effectiveness n/a n/a 99% 99% 99%
Refuse collection cost per household per year Effectiveness $189 $178 $177 $183 $187
% of safety checks on solid waste vehicles
completed daily Effectiveness n/a n/a 96% 96% 96%
% of time cart inventory levels remain above
minimum stock threshold Effectiveness n/a n/a 86% 90% 90%
Department Goal: Maintain a high level of recycling participation
# of households participating in curbside recycling Output 6,136 6,395 6,809 6,880 7,164
% of households participating in curbside recycling Effectiveness 77% 79% 83% 83% 85%
# of tons of recycling collected per solid waste FTE Efficiency 542 572 567 567 567
Total # of tons recycled per household (including
collection by outside vendors) Output 0.33 0.33 0.29 0.30 0.30
Percentile ranking for solid waste diversion of NC
municipalities Effectiveness 4% 4% 4% 5% 5%
# of lbs of paint collected at annual Household
Hazardous Waste event Output 22,140 34,438 42,620 38,529 38,529
# of lbs of pesticides, insecticides, etc. collected at
annual Household Hazardous Waste event Output 916 2,625 2,355 2,490 2,490

Planning
112
Department Profile
The Planning and Inspections Director reports directly to the Village Manager and serves as a member
of the senior leadership team. The Planning Department consists of two Planners, a Planning
Technician, Code Enforcement Officer, and Administrative Assistant. The Department provides
planning services for the Village as well as its extra territorial jurisdictions (ETJ) to preserve and
enhance the community’s unique character and ambience. Responsibilities include:
Coordinating the plan review process for the Community Appearance Commission and the
Historic Preservation Commission
Coordinating rezoning, text amendments, and appeals with the Planning and Zoning Board and
the Board of Adjustment
Reviewing plans for approximately 240 residential projects for zoning compliance annually with
an estimated permit value of $40,000,000
Reviewing 10 commercial development plans on average in the Village and expansion areas
each year
Conducting approximately 50 code enforcement inspections monthly
Additional information about the Planning Department may be obtained by contacting Kevin Reed,
Planning and Inspections Director, at 910.295.2581 or [email protected].
Budget Summary
FY 2015 FY 2016 FY 2016 FY 2017 Percent
Actual Budget Estimated Budgeted Change
Salaries & Benefits 439,479$ 464,000$ 427,020$ 455,850$ -1.8%
Operating 122,993 231,070 173,213 179,800 -22.2%
Capital 2,889 26,145 26,145 2,348 -91.0%
Expenditures Total 565,361$ 721,215$ 626,378$ 637,998$ -11.5%
FY 2015 FY 2016 FY 2016 FY 2017 Percent
Actual Budget Estimated Budgeted Change
Planning Permit Revenue 50,595$ 47,700$ 47,700$ 47,700$ 0.0%
Revenues Total 50,595$ 47,700$ 47,700$ 47,700$ 0.0%
Expenditures by Type
Revenues by Type
FY 2017 Initiative Action Plans
Initiative Action Plans Timeline FY 2017 Budget
Land use analysis – conduct a comprehensive land use analysis of
the Village to determine the highest and best use of developable land FY 2017 $50,000
Code enforcement – increase code enforcement capacity and
routinely patrol neighborhoods FY 2017 $13,900

Planning
113
Key Performance Indicators (KPIs)
Council Goal: Ensure Pinehurst is a Premier Residential Community
KPI Type
FY 2014
Actual
FY 2015
Actual
FY 2016
Est.
FY 2017
Goal
FY 2021
Proj.
Department Goal: Increase compliance with Village codes and ordinances
# of code violations investigated Output 486 662 625 750 310
% of code violations that are valid Output n/a n/a n/a 90% 95%
% of code violations investigated within 2 business
days Effectiveness n/a n/a n/a 90% 95%
% of code violations resolved within 45 days Effectiveness 96% 98% 96% 95% 95%
# of code violations investigated per FTE Efficiency 486 662 625 750 310
% of neighborhoods patrolled according to
schedule for code violations Effectiveness n/a n/a n/a 85% 95%
Department Goal: Process residential permit applications in a timely manner
# of new single-family residential permits issued Output 96 105 100 103 116
# of square feet of new single family residential
new construction permitted Output 329,815 356,563 330,000 339,900 371,742
% of single family residential new construction and
addition/alteration plans reviewed within 14 days Effectiveness 89% 92% 90% 85% 85%
Average # of days to issue single family permits for
new construction and additions/alterations Effectiveness 10 9 10 10 10
$ value of residential development permitted Output $41.2 M $44.6 M $39.9 M $42.5 M $46.5 M
% of Certificates of Appropriateness issued by staff
within 7 days Effectiveness 93% 89% 65% 90% 95%
% of Certificates of Appropriateness issued by the
Historic Preservation Commission within 45 days Effectiveness 92% 90% 95% 95% 95%
Council Goal: Ensure a Thriving Business Community
KPI Type
FY 2014
Actual
FY 2015
Actual
FY 2016
Est.
FY 2017
Goal
FY 2021
Proj.
Department Goal: Process non-residential permit applications in a timely manner
# of non-residential permits issued Output 14 10 10 11 13
% of time non-residential development applicant
receives initial staff comments within 21 days Effectiveness 79% 100% 88% 95% 95%
$ value of non-residential development permitted Output $1.4 M $6.6 M $4.2 M $2.0 M $2.0 M
Council Goal: Maintain a Healthy Financial Condition
KPI Type
FY 2014
Actual
FY 2015
Actual
FY 2016
Est.
FY 2017
Goal
FY 2021
Proj.
Department Goal: Recover the cost of development services
% of planning operating costs recovered through
planning fees Effectiveness 7% 8% 8% 8% 8%

Community Development
114
Department Profile
The Community Development Department is managed by the Assistant Village Manager of Operations
and the Assistant Village Manager of Administration. This department oversees marketing, economic
development, the Village’s Welcome Center, engineering services, and traffic studies. Areas of focus
include:
Promoting and marketing the Village as a place to visit, live, and do business with print and
digital advertising
Operating the George P. Lane Welcome Center to serve approximately 1,500 visitors to the area
each year
Monitoring and evaluating traffic levels at six key intersections in the Village
Additional information about the Community Development Department may be obtained by contacting
Jeff Batton, Assistant Village Manager of Operations, or Natalie Dean, Assistant Village Manager of
Administration, at 910.295.1900 or [email protected] or [email protected].
Budget Summary
FY 2015 FY 2016 FY 2016 FY 2017 Percent
Actual Budget Estimated Budgeted Change
Operating 232,423$ 201,040$ 198,540$ 242,890$ 20.8%
Capital 311,736 169,200 169,200 440 -99.7%
Expenditures Total 544,159$ 370,240$ 367,740$ 268,030$ -27.6%
FY 2015 FY 2016 FY 2016 FY 2017 Percent
Actual Budget Estimated Budgeted Change
Enginnering Plan Review Fees 1,114$ 500$ 1,505$ 1,000$ 100.0%
Engineering Fee Revenue 2,756 1,500 1,500 1,500 0.0%
Revenues Total 3,870$ 2,000$ 3,005$ 2,500$ 25.0%
Expenditures by Type
Revenues by Type
FY 2017 Initiative Action Plans
Initiative Action Plans Timeline FY 2017 Budget
Marketing and promotion (ACE) – expand marketing and
promotional efforts FY 2017 $45,600

Community Development
115
Key Performance Indicators (KPIs)
Council Goal: Ensure Pinehurst is a Premier Residential Community
KPI Type
FY 2014
Actual
FY 2015
Actual
FY 2016
Est.
FY 2017
Goal
FY 2021
Proj.
Department Goal: Market and promote the Village as a premier residential community
# of print ads distributed Village-wide Output 40 32 26 32 32
# of digital ads placed Village-wide Output 7 15 16 40 40
Marketing $ invested Village-wide Input $99,660 $39,942 $40,000 $75,000 $75,000
Department Goal: Provide a welcoming environment for Pinehurst visitors
# of Welcome Center visitors served Output 1,171 2,312 1,500 2,750 2,750
Council Goal: Ensure a Thriving Business Community
KPI Type
FY 2014
Actual
FY 2015
Actual
FY 2016
Est.
FY 2017
Goal
FY 2021
Proj.
Department Goal: Support Partners in Progress economic development activities
$ spent to support Partners in Progress Input $22,000 $27,000 $27,000 $27,000 $27,000
George P. Lane Welcome Center

Recreation
116
Department Profile
Recreation is a division within the Parks and Recreation Department. The Parks and Recreation
Director reports directly to the Assistant Village Manager of Operations and is a member of the senior
leadership team. The Director provides management support to all of the divisions in the department,
which includes Recreation, Harness Track, Fair Barn, and Buildings & Grounds. In addition to the
Director, the Recreation Division includes an Athletic Coordinator, Program Coordinator, Special Event
Coordinator, and part-time Event Assistant who, in conjunction with the Director, are charged with
providing the citizens of Pinehurst with a variety of recreational pursuits that enrich the quality of the
lives of the participants. Focus areas include:
Providing 36 youth recreational programs annually serving approximately 2,510 participants
Providing 29 adult recreational programs annually serving approximately 1,200 participants
Offering 80 cultural events each year attended by approximately 26,140 residents and visitors
Providing quality facilities and infrastructure to promote recreational activities
Additional information about the Recreation Division may be obtained by contacting Mark Wagner,
Parks and Recreation Director, at 910.295.2817 or [email protected].
Budget Summary
FY 2015 FY 2016 FY 2016 FY 2017 Percent
Actual Budget Estimated Budgeted Change
Salaries & Benefits 389,735$ 424,800$ 409,152$ 448,950$ 5.7%
Operating 805,670 939,059 928,202 1,000,030 6.5%
Capital 100,957 664,520 664,520 571,255 -14.0%
Expenditures Total 1,296,362$ 2,028,379$ 2,001,874$ 2,020,235$ -0.4%
FY 2015 FY 2016 FY 2016 FY 2017 Percent
Actual Budget Estimated Budgeted Change
Athletic Programs 34,514$ 32,500$ 34,000$ 32,000$ -1.5%
Recreation Fees 83,207 58,000 81,000 87,000 50.0%
Facility Rentals 31,545 23,500 27,000 35,500 51.1%
Revenues Total 149,266$ 114,000$ 142,000$ 154,500$ 35.5%
Expenditures by Type
Revenues by Type
FY 2017 Initiative Action Plans
Initiative Action Plans Timeline FY 2017 Budget
Greenways - expand the greenway system and maintain/renovate
existing trails FY 2017-2021 $130,000
Neighborhood sidewalks – install sidewalks in Village neighborhoods,
per Comprehensive Pedestrian Master Plan FY 2017-2021 $376,200
Recreation facilities – expand park amenities at Rassie Wicker Park and
develop new recreation facilities FY 2017-2021 $75,000

Recreation
117
Key Performance Indicators (KPIs)
Council Goal: Maintain an Active, Healthy Community
KPI Type
FY 2014
Actual
FY 2015
Actual
FY 2016
Est.
FY 2017
Goal
FY 2021
Proj.
Department Goal: Provide adequate parks and recreation facilities
# of acres of developed parks per 1,000 population Effectiveness 9.25 9.25 9.25 9.25 9.57
# of developed acres of parks maintained per FTE Efficiency 35.84 35.84 35.84 35.84 37.09
% of residents satisfied with the quality of Village
parks Effectiveness 99% 97% 97% 97% 97%
# of miles of greenway trails per 1,000 population Effectiveness 0.44 0.44 0.46 0.48 0.48
% of residents satisfied with P&R facilities Effectiveness 96% 92% 92% 93% 93%
# of days the Arboretum is used Output 66 67 112 115 127
Department Goal: Provide a variety of athletic and recreation programs for all ages
Total # of participants in athletic and recreation
programs Output 3,249 3,722 4,100 4,150 4,350
Resident participation rate as a % of total
participants in athletic and recreation programs Effectiveness 72% 72% 68% 72% 72%
% of athletic and recreation program participants
who are adults Output 29% 32% 31% 32% 35%
% of athletic and recreation program participants
who are youth Output 71% 68% 69% 68% 65%
% of athletic and recreation programs offered that
met or exceeded minimum registration requirements Effectiveness 85% 74% 84% 85% 89%
# of athletic and recreation program participants per
Recreation Coordinator FTE Efficiency 1,625 1,861 2,050 2,075 2,175
Residents recreation program participants as a % of
population Effectiveness 17% 18% 18% 18% 19%
% of residents satisfied with the quality of youth
recreation programs Effectiveness 92% 90% 91% 91% 91%
% of residents satisfied with the quality of adult
recreation programs Effectiveness 93% 89% 91% 91% 91%
Department Goal: Provide cultural arts events
# of Village sponsored cultural arts events Output 80 76 70 71 75
Estimated attendance at Village sponsored cultural
arts events Output 27,785 26,145 30,000 30,250 31,250
Council Goal: Maintain a Healthy Financial Condition
KPI Type
FY 2014
Actual
FY 2015
Actual
FY 2016
Est.
FY 2017
Goal
FY 2021
Proj.
Department Goal: Recover program and event costs through fees
% of direct costs recovered through recreation fees Effectiveness 73% 84% 71% 70% 70%
$ of sponsorships obtained for Village sponsored
cultural arts events Output $1,540 $2,800 $4,000 $6,000 $10,000

Library
118
Department Profile
The Library Department includes funds for contributions to the Given Memorial Library. Given Tufts is
a non-profit 501(c)3 that operates the Given Memorial Library and the Tufts Archives in the Village
Center. The Village provides public library services through an operating contract with the Given
Memorial Library. In addition, starting FY 2013, the Village began making annual payments toward a
$1,000,000 pledge to the Library’s $4,500,000 capital expansion campaign. The Library includes:
A collection of over 23,000 items including fiction, non-fiction, audio books, e-books, reference,
large print, and children’s books
Free wireless internet, a laptop computer, and a printer for public use
Children’s programs throughout the year
Tufts Archives, the Pinehurst History Museum
Additional information about the Library Department may be obtained by contacting John G. Frye,
CPA, Financial Services Director, at 910.295.1900 or [email protected].
Budget Summary
FY 2015 FY 2016 FY 2016 FY 2017 Percent
Actual Budget Estimated Budgeted Change
Operating 405,000$ 225,000$ 225,000$ 200,000$ -11.1%
Expenditures Total 405,000$ 225,000$ 225,000$ 200,000$ -11.1%
Expenditures by Type

Library
119
Key Performance Indicators (KPIs)
Council Goal: Maintain an Active, Healthy Community
KPI Type
FY 2014
Actual
FY 2015
Actual
FY 2016
Est.
FY 2017
Goal
FY 2021
Proj.
Department Goal: Support the provision of public library services
# of books checked out Output 37,040 36,264 35,000 35,000 35,000
# of e-books checked out Output 8,373 8,168 8,100 8,100 8,100
$ spent to support Given Memorial Library Input $140,000 $360,000 $405,000 $200,000 $100,000
Given Memorial Library

Harness Track
120
Department Profile
The Harness Track Division of the Parks and Recreation Department reports to the Parks and Recreation
Director. The Harness Track Division includes one Track Supervisor, three full-time Track Specialists,
and part-time seasonal personnel responsible for the operations and maintenance of the Harness Track
facility. Responsibilities include:
Maintaining three sand-clay training tracks totaling 2.25 miles of track and 111 acres to host 25
special events annually
Maintaining 17 barns with 260 rentable stalls
Maintaining a Track Restaurant and Tack Shop
Maximizing the use of the facility by the equine industry, residents, and visitors to consistently
generate between $250,000 and $290,000 in revenue annually
Additional information about the Harness Track Division of the Parks and Recreation Department may
be obtained by contacting Mark Wagner, Parks and Recreation Director, at 910.295.2817 or
Budget Summary
FY 2015 FY 2016 FY 2016 FY 2017 Percent
Actual Budget Estimated Budgeted Change
Salaries & Benefits 190,569$ 206,850$ 186,760$ 199,500$ -3.6%
Operating 277,024 320,060 313,060 313,900 -1.9%
Capital 144,450 190,790 190,790 97,831 -48.7%
Expenditures Total 612,043$ 717,700$ 690,610$ 611,231$ -14.8%
FY 2015 FY 2016 FY 2016 FY 2017 Percent
Actual Budget Estimated Budgeted Change
Stall Rental 204,630$ 218,000$ 230,000$ 230,000$ 5.5%
Tack Shop Rental 4,944 4,800 4,800 4,800 0.0%
Restaurant Rent 6,600 7,200 7,200 6,600 -8.3%
Shows/Events Revenue 37,907 47,000 47,000 37,000 -21.3%
Revenues Total 254,081$ 277,000$ 289,000$ 278,400$ 0.5%
Expenditures by Type
Revenues by Type

Harness Track
121
Key Performance Indicators (KPIs)
Council Goal: Maintain a Healthy Financial Condition
KPI Type
FY 2014
Actual
FY 2015
Actual
FY 2016
Est.
FY 2017
Goal
FY 2021
Proj.
Department Goal: Provide a high quality equestrian training and event venue
% of Harness Track building renovations
completed on schedule Effectiveness 92% 100% 100% 100% 100%
# of Harness Track facility acres Input 111 111 111 111 111
# of Harness Track facility acres maintained per
FTE Efficiency 27.75 27.75 27.75 27.75 27.75
% of customers satisfied with the Harness Track
facility Effectiveness 92% 100% 100% 90% 90%
Department Goal: Maximize utilization of the Harness Track
# of stalls available for rent Input 260 260 260 260 260
# of stalls rented Output 250 236 257 250 250
% of capacity reached for stall rentals Effectiveness 96% 91% 99% 96% 96%
# of days the Harness Track is rented for equestrian
events Output 19 25 25 25 25
# of days the Harness Track is rented for non-
equestrian events Output 87 13 35 35 35
Utilization rate for Harness Track rentals Effectiveness 74% 22% 35% 35% 35%
Department Goal: Maximize profitability of the Harness Track
% of Harness Track operating expenditures
recovered with fees Effectiveness 52% 54% 56% 57% 61%
Harness Track Race

Fair Barn
122
Department Profile
The Fair Barn is a Division of the Parks and Recreation Department and operates under the direction of
the Events Coordinator. The Fair Barn Department is comprised of the Fair Barn Coordinator, several
part-time assistants, and part-time laborers who provide the manpower, supplies, expertise, and
management for the operations and maintenance of the Fair Barn. Responsibilities include:
Hosting an average of 111 community events and meetings annually, generating approximately
$220,000 in revenue
Maintaining 6,400 square feet of rental space
Promoting and managing the facility to maximize its use
Additional information about the Fair Barn Division of the Parks and Recreation Department may be
obtained by contacting Mark Wagner, Parks and Recreation Director, at 910.295.2817 or
Budget Summary
FY 2015 FY 2016 FY 2016 FY 2017 Percent
Actual Budget Estimated Budgeted Change
Salaries & Benefits 91,117$ 110,300$ 103,875$ 122,800$ 11.3%
Operating 155,584 191,120 187,263 206,770 8.2%
Capital 73,277 65,865 65,865 92,046 39.7%
Expenditures Total 319,978$ 367,285$ 357,003$ 421,616$ 14.8%
FY 2015 FY 2016 FY 2016 FY 2017 Percent
Actual Budget Estimated Budgeted Change
Fair Barn Rental 215,819$ 185,000$ 220,000$ 215,000$ 16.2%
Shows/Events Revenue 10,733 3,000 3,035 3,000 0.0%
Revenues Total 226,552$ 188,000$ 223,035$ 218,000$ 16.0%
Expenditures by Type
Revenues by Type

Fair Barn
123
Key Performance Indicators (KPIs)
Council Goal: Maintain a Healthy Financial Condition
KPI Type
FY 2014
Actual
FY 2015
Actual
FY 2016
Est.
FY 2017
Goal
FY 2021
Proj.
Department Goal: Provide a high quality event venue
% of customers satisfied with the Fair Barn facility Effectiveness n/a 95% 87% 88% 92%
Department Goal: Maximize utilization of the Fair Barn
# of weekdays the Fair Barn is rented Output n/a 107 45 47 55
# of weekend days the Fair Barn is rented Output n/a 98 99 101 109
Fair Barn weekday utilization rate Effectiveness n/a 51% 22% 23% 27%
Fair Barn weekend utilization rate Effectiveness n/a 63% 64% 65% 70%
Department Goal: Market and promote the Fair Barn
# of client leads for weekday rentals Output n/a n/a n/a 12 20
# of client leads for weekend rentals Output n/a n/a n/a 60 80
Department Goal: Maximize profitability of the Fair Barn
% of Fair Barn operating expenditures recovered
with fees Effectiveness 94% 92% 90% 92% 100%
Fair Barn

Buildings & Grounds
124
Department Profile
The Buildings & Grounds Division operates under the direction of the Parks and Recreation Director.
This division includes a Building and Grounds Superintendent, a Maintenance Technician, and four
Grounds Specialists that provide regular and preventative maintenance for all facilities owned by the
Village as well as for selected Village-owned grounds and property. All expenditures of this department
are charged back to other departments in the form of internal service charges. Buildings & Grounds
services include:
Maintaining 17 facilities used to carry out municipal activities totaling 69,200 square feet
Maintaining 4 parks and recreation facilities totaling 145 developed acres
Maintaining greenway trails totaling 6.8 linear miles
Completing approximately 22 work orders monthly
Additional information about the Building & Grounds Division may be obtained by contacting Mark
Wagner, Parks and Recreation Director, at 910.295.1900 or [email protected].
Budget Summary
FY 2015 FY 2016 FY 2016 FY 2017 Percent
Actual Budget Estimated Budgeted Change
Salaries & Benefits 313,339$ 343,036$ 326,431$ 334,700$ -2.4%
Operating 626,847 676,774 665,096 704,710 4.1%
Capital 166,220 773,925 773,925 757,960 -2.1%
Expenditures Total 1,106,406$ 1,793,735$ 1,765,452$ 1,797,370$ 0.2%
Expenditures by Type

Buildings & Grounds
125
Key Performance Indicators (KPIs)
Council Goal: Professionally Manage a High Performing Organization
KPI Type
FY 2014
Actual
FY 2015
Actual
FY 2016
Est.
FY 2017
Goal
FY 2021
Proj.
Department Goal: Respond promptly to Building and Grounds work order requests
# of B&G work order requests Input 310 248 257 253 253
% of B&G work order requests closed within 14
days Effectiveness 81% 83% 79% 81% 81%
% of B&G work order requests that are an
emergency Effectiveness 5% 6% 5% 5% 4%
Average response time for B&G work order
requests (in days) Effectiveness 7.84 9.88 10.91 9.91 9.91
Department Goal: Effectively maintain Village buildings and grounds
# of square feet of buildings maintained Output 107,002 108,802 108,802 108,802 108,802
# of square feet of buildings maintained per
facilities maintenance FTE Efficiency 107,002 108,802 108,802 108,802 108,802
% of Village buildings inspected quarterly Effectiveness 87% 93% 100% 95% 95%
% of playground inspections completed according
to schedule Effectiveness n/a n/a n/a 100% 100%
% of greenway/trail bridges inspected according to
schedule Effectiveness n/a n/a n/a 90% 98%
% of employees satisfied with the quality of B&G
work performed Effectiveness 98% 97% 97% 97% 97%

Fleet Maintenance
126
Department Profile
The Fleet Director reports directly to the Assistant Village Manager of Operations and is a member of
the Senior Leadership Team. The Fleet Maintenance Department consists of the Director and two
Technicians who are responsible for providing regular and preventative maintenance for all vehicles and
equipment operated by the Village. All expenditures of this department are charged back to other
departments in the form of internal service charges. Fleet services include:
Maintaining 100 vehicles used to carry out municipal activities
Maintaining 123 pieces of equipment used in the delivery of municipal services
Performing 125 preventative maintenance (PM) services annually
Completing approximately 15 work orders monthly
Additional information about the Fleet Maintenance Department may be obtained by contacting Randy
Kuhn, Fleet Manager, at 910.295.0005 or [email protected].
Budget Summary
FY 2015 FY 2016 FY 2016 FY 2017 Percent
Actual Budget Estimated Budgeted Change
Salaries & Benefits 223,218$ 237,550$ 228,775$ 241,050$ 1.5%
Operating 384,777 451,140 396,462 428,750 -5.0%
Capital 516,446 713,200 713,200 851,080 19.3%
Expenditures Total 1,124,441$ 1,401,890$ 1,338,437$ 1,520,880$ 8.5%
Expenditures by Type
Fleet Maintenance Department

Fleet Maintenance
127
Key Performance Indicators (KPIs)
Council Goal: Professionally Manage a High Performing Organization
KPI Type
FY 2014
Actual
FY 2015
Actual
FY 2016
Est.
FY 2017
Goal
FY 2021
Proj.
Department Goal: Respond promptly to fleet work order requests
% of fleet work orders completed within 2 days of
receipt Effectiveness 81% 88% 80% 85% 85%
% of mechanic time spent on repairs &
maintenance Effectiveness 24% 32% 35% 50% 65%
Council Goal: Maintain a Healthy Financial Condition
KPI Type
FY 2014
Actual
FY 2015
Actual
FY 2016
Est.
FY 2017
Goal
FY 2021
Proj.
Department Goal: Effectively maintain Village vehicles and equipment to maximize availability
# of vehicles maintained Output 99 97 97 94 95
# of equipment items maintained Output 69 61 62 63 68
# of vehicles and equipment items maintained per
FTE Efficiency 56 53 53 52 54
# of PMs completed Output 127 141 140 140 140
% of PMs completed on time Effectiveness 74% 85% 98% 98% 98%
% of rolling stock available Effectiveness 97% 98% 98% 98% 98%
% of employees satisfied that repairs are made
correctly the first time Effectiveness 91% 100% 94% 94% 95%
Scheduled maintenance work orders as a % of total
maintenance work orders Effectiveness 37% 38% 36% 36% 36%
Department Goal: Replace vehicles and equipment based on the predetermined life-cycle
expectancy
Average age of police sedans fleet (in years) Effectiveness 4.5 5.4 5.2 6.2 7.3
Average age of automated garbage trucks fleet (in
years) Effectiveness 5.3 6.3 6.3 6.0 6.4
Average age of fire pumpers fleet (in years) Effectiveness 8.8 9.8 10.8 7.0 6.0

Information Technology
128
Department Profile
The Chief Information Officer (CIO) reports directly to the Assistant Village Manager of Administration
and is a member of the senior leadership team. In addition to the CIO, the Information Technology
Department (IT) includes a Network Administrator, IT Systems Specialist, Business Analyst, and IT
Technician. All of these positions are responsible for the support, maintenance, and security of
hardware, software, and network infrastructure. All expenditures of this department are charged back to
other departments in the form of internal service charges. Information technology services include:
Maintaining more than 20 software programs and applications that support municipal services as
well as the Village website, mobile app, database servers, email servers, Enterprise Resource
Planning (ERP) system, and a downtown kiosk
Managing a secure network infrastructure that has multiple WAN connections and over 320
devices including computers, physical and virtual servers, Wi-Fi, printers, and other technology
equipment
Maintaining the audio visual technology used in meeting rooms across the Village campus
Completing approximately 100 work orders monthly
Additional information about the Information Technology Department may be obtained by contacting
Jason Whitaker, Chief Information Officer, at 910.295.1900 or [email protected].
Budget Summary
FY 2015 FY 2016 FY 2016 FY 2017 Percent
Actual Budget Estimated Budgeted Change
Salaries & Benefits 381,093$ 423,250$ 356,241$ 423,750$ 0.1%
Operating 356,671 481,148 472,470 497,360 3.4%
Capital 109,795 96,300 96,300 176,500 83.3%
Expenditures Total 847,559$ 1,000,698$ 925,011$ 1,097,610$ 9.7%
Expenditures by Type
Information Technology
129
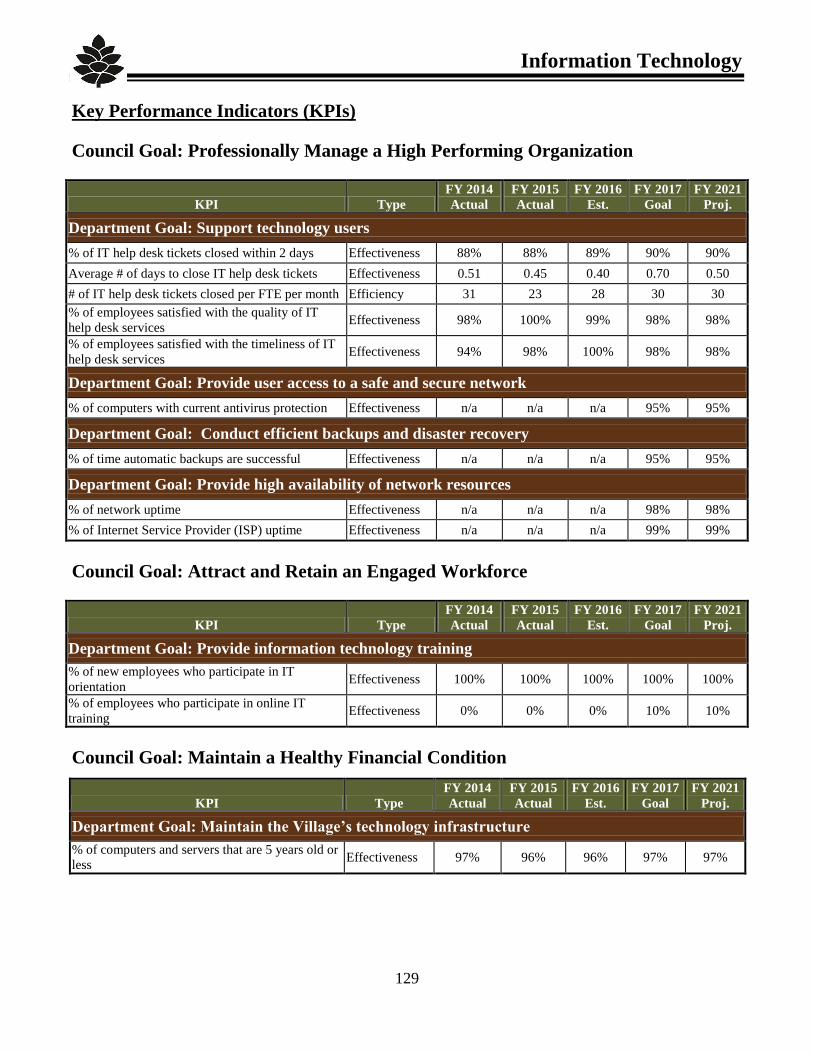
Key Performance Indicators (KPIs)
Council Goal: Professionally Manage a High Performing Organization
KPI Type
FY 2014
Actual
FY 2015
Actual
FY 2016
Est.
FY 2017
Goal
FY 2021
Proj.
Department Goal: Support technology users
% of IT help desk tickets closed within 2 days Effectiveness 88% 88% 89% 90% 90%
Average # of days to close IT help desk tickets Effectiveness 0.51 0.45 0.40 0.70 0.50
# of IT help desk tickets closed per FTE per month Efficiency 31 23 28 30 30
% of employees satisfied with the quality of IT
help desk services Effectiveness 98% 100% 99% 98% 98%
% of employees satisfied with the timeliness of IT
help desk services Effectiveness 94% 98% 100% 98% 98%
Department Goal: Provide user access to a safe and secure network
% of computers with current antivirus protection Effectiveness n/a n/a n/a 95% 95%
Department Goal: Conduct efficient backups and disaster recovery
% of time automatic backups are successful Effectiveness n/a n/a n/a 95% 95%
Department Goal: Provide high availability of network resources
% of network uptime Effectiveness n/a n/a n/a 98% 98%
% of Internet Service Provider (ISP) uptime Effectiveness n/a n/a n/a 99% 99%
Council Goal: Attract and Retain an Engaged Workforce
KPI Type
FY 2014
Actual
FY 2015
Actual
FY 2016
Est.
FY 2017
Goal
FY 2021
Proj.
Department Goal: Provide information technology training
% of new employees who participate in IT
orientation Effectiveness 100% 100% 100% 100% 100%
% of employees who participate in online IT
training Effectiveness 0% 0% 0% 10% 10%
Council Goal: Maintain a Healthy Financial Condition
KPI Type
FY 2014
Actual
FY 2015
Actual
FY 2016
Est.
FY 2017
Goal
FY 2021
Proj.
Department Goal: Maintain the Village’s technology infrastructure
% of computers and servers that are 5 years old or
less Effectiveness 97% 96% 96% 97% 97%

Contingency
130
Department Profile
The Contingency Department includes an allocation of funds for unexpected items that may occur in the
FY 2017 Budget. This practice of maintaining contingency funding is recommended by the Fiscal
Management Staff of the N. C. Local Government Commission.
These funds may not legally exceed 5.0% of all other General Fund appropriations. The $50,000 budget
is 0.27% of the total General Fund budget.
Additional information about the Contingency Department may be obtained by contacting John G. Frye,
CPA, Financial Services Director, at 910.295.1900 or [email protected].
Budget Summary
FY 2015 FY 2016 FY 2016 FY 2017 Percent
Actual Budget Estimated Budgeted Change
Operating -$ 48,000$ -$ 50,000$ 4.2%
Expenditures Total -$ 48,000$ -$ 50,000$ 4.2%
Expenditures by Type

Debt Service
131
Department Profile
As a means to finance long-term capital purchases and projects, the Village of Pinehurst utilizes long-
term debt. While simultaneously benefiting from its use, the Village has traditionally maintained a
conservative position regarding the use of debt. Because of its importance to the Village’s financial
solvency, debt is regulated not only by North Carolina statutes, but also by Council policy. See the SOP
Guide section for the Debt Guidelines. For information on anticipated debt, please refer to the Capital
Improvement Plan section.
The total amount of debt outstanding at June 30, 2016 will be $1,435,138. This is a relatively small
amount of direct debt compared to our taxable property of $3,369,000,000. All of the Village’s debt is
in the form of installment purchase agreements.
As the Village has not issued any General Obligation Bonds, we have not been rated by a national rating
agency such as Moody’s Investment Service or Standard and Poors.
Additional information about Debt Service expenditures may be obtained by contacting John G. Frye,
CPA, Financial Services Director, at 910.295.1900 or [email protected].
Budget Summary
FY 2015 FY 2016 FY 2016 FY 2017 Percent
Actual Budget Estimated Budgeted Change
Principal 420,917$ 406,103$ 406,103$ 368,784$ -9.2%
Interest 73,616 58,201 58,201 43,938 -24.5%
Expenditures Total 494,533$ 464,304$ 464,304$ 412,722$ -11.1%
Expenditures by Type

Debt Service
132
The chart below indicates the total debt service payments due under the terms of each of the Village’s
financing agreements over the next five-year period. It also offers financing details of each installment
agreement:
2017 2018 2019 2020 2021
Firetruck - Unit 924 41,850$ -$ -$ -$ -$
$500,000; due in 14 semi-annual payments of $42,037
beginning on 6/1/10; final payment due on 12/1/16;
interest @ 4.43% with a 35% interest rebate on each
pymt; collateralized by firetruck.
Firetruck - Unit 914 83,825 83,825 83,825 83,825 41,549
$550,000; due in 14 semi-annual payments of $41,917
beginning on 2/1/14; final payment due on 8/1/20;
interest @ 1.75%;
collateralized by firetruck.
Fire Station 188,167 182,434 176,700 170,967 -
$2,500,000; due in 30 semi-annual payments consisting of
fixed principal of $83,334 plus interest @ 3.44%;
collateralized by Fire Station bldg; final payment due
on 03/15/20.
Fair Barn 63,225 60,925 58,625 56,325 54,025
$1,000,000; due in 40 semi-annual payments consisting of
fixed principal of $25,000 plus interest @ 4.60%;
collateralized by Fair Barn building; final payment due
on 03/11/22.
67.04 Acres (Chicken Plant Road) 35,655 34,329 - - -
$500,000; due in 30 semi-annual payments consisting of
fixed principal of $16,667 plus interest @ 3.98%;
collateralized by 67.04 acres of land/ final payment
due 04/15/18.
412,722$ 361,513$ 319,150$ 311,117$ 95,574$
Description
Debt Service Payments on Installment Purchase Agreements
Total Debt Service
Fiscal Year

Debt Service
133
The charts below indicate the total principal and interest due under the terms of each of the Village’s
financing agreements until maturity by project and by fiscal year:
Project Principal Interest Principal Interest Principal Interest
Fire Station 166,667$ 21,500$ 166,667$ 15,767$ 166,667$ 10,033$
Firetruck 914 77,842 5,983 79,211 4,614 80,603 3,222
Firetruck - 924 40,942 908 - - - -
Fair Barn 50,000 13,225 50,000 10,925 50,000 8,625
67.04 Acres 33,333 2,322 33,334 995 - -
Totals 368,784$ 43,938$ 329,212$ 32,301$ 297,270$ 21,880$
Project Principal Interest Principal Interest Principal Interest
Fire Station 166,667$ 4,300$ -$ -$ -$ -$
Firetruck 914 82,020 1,805 41,185 364 - -
Fair Barn 50,000 6,325 100,000 5,750 - -
Totals 298,687$ 12,430$ 141,185$ 6,114$ -$ -$
FY 2020 FY 2021-2025 FY 2026-2030
FY 2017 FY 2018 FY 2019
Project Principal Interest Total
Fire Station 666,668$ 51,600$ 718,268$
Firetruck 914 360,861 15,988 376,849
Firetruck - 924 40,942 908 41,850
Fair Barn 300,000 44,850 344,850
67.04 Acres 66,667 3,317 69,984
Totals 1,435,138$ 116,663$ 1,551,801$
Fiscal Year(s) Principal Interest Total
FY 2017 368,784$ 43,938$ 412,722$
FY 2018 329,212 32,301 361,513
FY 2019 297,270 21,880 319,150
FY 2020 298,687 12,430 311,117
FY 2021-2025 141,185 6,114 147,299
Totals 1,435,138$ 116,663$ 1,551,801$
Total by Fiscal Year(s)
Total Balance by Project

Debt Service
134
Net Assessed Value - June 30, 2015 3,492,214,968$
8.0%
Debt Limit - Eight Percent (8.0%) of Assessed Value 279,377,197$
Gross Debt:
Installment Purchase Agreements 1,841,825
Total Amount of Debt Applicable to Debt Limit (Net Debt) 1,841,825 0.05%
Legal Debt Margin 277,535,372$
Computation of Legal Debt Limit
The Village is subject to the Local Government Bond Act of North Carolina, which limits the amount of
net bonded debt the Village may have outstanding to 8% of the assessed value of the property subject to
taxation. The Village’s net debt as a percentage of assessed valuation at June 30, 2015 is 0.05%
compared to the legal debt limit of 8%.