grain transportation report - agricultural marketing … 14, 2017 grain transportation report 3...
TRANSCRIPT

A weekly publication of the Agricultural Marketing Service
www.ams.usda.gov/GTR
December 14, 2017
Contents
Article/
Calendar
Grain
Transportation
Indicators
Rail
Barge
Truck
Exports
Ocean
Brazil
Mexico
Grain Truck/Ocean
Rate Advisory
Datasets
Specialists
Subscription
Information
--------------
The next
release is December 21, 2017
Preferred citation: U.S. Dept. of Agriculture, Agricultural Marketing Service. Grain Transportation Report. December 14, 2017.
Web: http://dx.doi.org/10.9752/TS056.12-14-2017
Grain Transportation Report
WEEKLY HIGHLIGHTS
Grain Barge Rates Decline Since October…
St. Louis barge rates for export grain peaked on October 3 at 800 percent of tariff ($31.92 per ton), but dropped significantly to 338
percent of tariff ($13.49 per ton) by the end of October. The average November barge rate for St. Louis was 240 percent of tariff
($9.58 per ton). Presently, the average December barge rate for St. Louis is about 200 percent of tariff ($7.98 per ton). Similar patterns
were observed for other major barge originating locations, except for the Ohio River, where rates have seen occasional increases due
to delays caused by lock and dam repairs.
…and Secondary Railcar Markets Drop Since August Weekly average October and November shuttle rates on the secondary railcar market fell from late August through November due to
adequate railcar supply relative to a lower-than-expected demand. Rail shipments of grain over the past four weeks have been only 89
percent of last year’s level. Compared to the previous year, weekly average October shuttle rates per car were almost $1,000 less on
BNSF and $700 less on UP between August and October. Weekly average November shuttle rates per car were almost $600 less on
BNSF and $200 less on UP between August and November. Average December shuttle secondary railcar bids/offers per car were
$141 below tariff for the week ending December 7, $286 lower than last year. According, to the December USDA World Agricultural
Supply and Demand Estimates, there has been reduced soybean exports during September, October, and November due to stronger-
than-expected competition from Argentina and Brazil.
Grain Inspections Lowest Since September
For the week ending December 7, total inspections of grain (corn, wheat, and soybeans) for export from all major U.S. export
regions reached 2.28 million metric tons (mmt), down 21 percent from the previous week, down 29 percent from the same time last
year, and 29 percent below the 3-year average. The drop in inspections was caused primarily by the typical slowdown in demand from
Asia and Latin America during this period. Grain inspections were the lowest since the middle of September, with wheat inspections
decreasing 23 percent from the previous week, and soybeans dropping 31 percent for the same period. Inspections of corn rebounded
from the past week, increasing 9 percent. Pacific Northwest (PNW) inspections decreased 14 percent from the past week, and
Mississippi Gulf grain inspections decreased 29 percent for the same period. Outstanding (unshipped) export sales were down for
wheat and soybeans, but up for corn.
Snapshots by Sector
Export Sales
For the week ending November 30, unshipped balances of wheat, corn, and soybeans totaled 33.6 mmt, down 20 percent from the
same time last year. Net weekly wheat export sales were .322 mmt, up 74 percent from the previous week. Net corn export sales
were .876 mmt, up 46 percent from the previous week, and net soybean export sales were 2.0 mmt for the same period, up
significantly from the previous week.
Rail
U.S. Class I railroads originated 25,712 grain carloads for the week ending December 2, up 37 percent from the previous week, up 3
percent from last year, and up 13 percent from the 3-year average.
There were no shuttle bids/offers last week and no non-shuttle bids/offers this week.
Barge For the week ending December 9, barge grain movements totaled 811,802 tons, 14 percent higher than the previous week, and down
23 percent from the same period last year.
For the week ending December 9, 524 grain barges moved down river, up 15 percent from last week. 676 grain barges were
unloaded in New Orleans, 22 percent lower than the previous week.
Ocean
For the week ending December 7, 37 ocean-going grain vessels were loaded in the Gulf, 18 percent less than the same period last
year. Sixty-one vessels are expected to be loaded within the next 10 days, 27 percent less than the same period last year.
For the week ending December 7, the ocean freight rate for shipping bulk grain from the Gulf to Japan was $44.25 per metric ton,
unchanged from the previous week. The cost of shipping from the PNW to Japan was $24.75 per metric ton, unchanged from the
previous week.
Fuel
During the week ending December 11, average diesel fuel prices decreased 1 cent from the previous week at $2.91 per gallon, 42
cents above the same week last year.
Contact Us

December 14, 2017
Grain Transportation Report 2
Feature Article/Calendar
Study of Grain Basis Behavior during Transportation Disruptions
Basis, which is the difference between the local cash (spot) price and the futures price for a commodity, is an
important and complex signaling mechanism in grain markets. Some have called it “the voice of the market,”
since basis affects when and where many grain producers and shippers buy and sell grain.1 Basis is
mathematically expressed as: Basis = Cash Price – Futures Price.
Local cash prices reflect local supply and demand forces, while futures markets reflect global supply and
demand forces. When local supplies are tight relative to demand, cash prices will rise, resulting in a more
positive (or less negative) basis at that location. This is also known as the basis narrowing or strengthening.
Crop merchandizers strengthen basis to increase the flow of grain. Conversely, basis widens or weakens when
it becomes less positive (or more negative). Merchandizers weaken basis to slow the flow of grain. As the cash
price falls relative to the futures price, the incentive to store grain increases.
Numerous factors influence basis, such as local storage capacity and crop quality, but transportation is usually
one of the largest cost components, either directly through shipping costs or indirectly, for example, through
transportation availability. Thus, disruptions to the transportation system can have serious impacts on basis.
Researchers at Iowa State University (ISU) and North Dakota State University (NDSU) explored the
interactions of transportation costs, transportation disruptions, and other variables on basis. This article
presents highlights of an AMS summary of their report, including an overview of the study’s methods and
major results.2
Study Methods In order to better understand basis behavior and patterns, the researchers conducted both exploratory and
regression analyses. In the first part, they examined basis patterns over time and across space. This involved,
for instance, using cash price data from USDA’s Agricultural Marketing Service to generate a series of graphs
plotting corn basis over time from the start to the end of the marketing year for several major corn markets
(e.g., eastern Iowa, southern Minnesota, various locations on the Mississippi River, etc.). In addition, the
researchers developed “heat maps” depicting the response in basis to changes in events, such as the disruptions
caused by Hurricane Katrina in 2005 or the annual closure of the Upper Mississippi River to barge traffic.
The study also developed regression models to explore the relationships between various grain market and
transportation variables on basis in the Corn Belt and major wheat markets in the Upper Plains. The
researchers included factors representing shifts in futures contracts throughout the marketing year, local
demand (e.g., ethanol and livestock), potential
disruptions in the transportation system (e.g., hurricanes
and closure of the Upper Mississippi), and transportation
costs (e.g., diesel fuel prices, ocean freight rates, and
rates in the secondary rail auction market), among
others.
Study Results The researchers visually demonstrated that basis varies
over the course of the marketing year and by location.
Figure 1 plots the average corn basis for multiple
locations from September through August, the marketing
year for corn. Two observations are notable: (1) basis
tends to improve (or strengthen) in the months after
harvest, since the filling of demand needs (from
1 Kluis, Alan. “Understanding Basis Signals in the Grain Markets.” Corn and Soybean Digest. March 31, 2000. 2 Hart, Chad and Frayne Olson. Analysis of Grain Basis Behavior during Transportation Disruptions and Development of Weekly
Grain Basis Indicators for the USDA Grain Transportation Report. Staff Report 17-SR 111. Center for Agricultural and Rural
Development, Iowa State University. May 2017. This staff report received funding from USDA’s Agricultural Marketing Service
through cooperative agreement number 14-TMXXX-IA-0028.

December 14, 2017
Grain Transportation Report 3
livestock, ethanol, exports, and other uses) decreases grain supplies, and (2) basis levels in southern and
eastern Iowa tend to be higher than for southern Minnesota and northern Iowa due to their proximity to export
terminals in the Gulf. Areas closer to demand centers generally face lower transportation costs and thus tend to
have higher local demand and a stronger basis.
Figure 2 offers another visual of this typical pattern, where the orange/red coloring indicates a stronger (or
narrower) basis, and the green/blue coloring indicates a weaker (or wider) basis. As the authors explained,
“basis tends to be weak [green/blue] in areas where local supply is large relative to demand and strong
[orange/red] where demand is large relative to local supply. One can think of basis as the price signal to move
the crop towards the areas where crop demands are relatively stronger.” As a result, basis is normally stronger
along the river and near the Gulf of Mexico. However, Hurricane Katrina significantly disrupted flows out of
the Gulf, and consequently halted barge traffic, delaying shipments. Grain shippers faced increased costs
implementing alternative transportation options. As a result, basis levels weakened across portions of Illinois,
Missouri, and other areas to offset those financial impacts and slow down the flow of grain (Figure 3).
Most of the regression results aligned with expectations. For instance,
demand factors (such as ethanol and livestock) had mostly positive and
significant relationships with basis in Iowa, meaning that increases in local
demand correspond to a stronger basis. Similarly, basis tended to increase
with more demand (reflected by export levels) in the major wheat markets.
In terms of transportation disruptions, the hurricane impact was not
significant across Iowa, but the winter closure impact was for most Iowa
locations studied. Comparatively, the hurricane and winter disruption
impacts had significant effects on basis for the Illinois locations, with the
impact from hurricanes almost twice the size of winter disruptions. The
authors explained, “Illinois is closer to the Gulf and further away from the
winter river stoppages. The hurricane impact is also larger at the barge
loading elevators along the Illinois River than it is for the country elevators,”
reflecting the barge loading elevators’ greater reliance on river transportation
to reach crop users.
Transportation costs—diesel rates, ocean freight rates, rail tariff rates, and
rates in the secondary rail auction market—were almost all significant across
the sampled locations, Iowa, Illinois, North Dakota, and Montana. The study
found that increases in transportation costs translate into weaker basis levels.
In other words, “the results show that increases in the tariff rates, fuel
surcharges, and the costs of transportation in the secondary markets have a
direct, inverse impact on basis.” In one example, the researchers found that a
$1 change in the price of diesel was associated with a $0.17 decrease in basis
in east Iowa. The authors concluded that: “transportation costs are a major
component in basis setting.” Further, they emphasized, “there are a number
of factors that influence basis at any given time, and the influence of these
factors on basis levels depends on the specific combination of crop, location,
and time period.”
Overall, the study found that increased local production and higher
transportation costs are associated with wider basis levels. In contrast, higher
local usage, via ethanol or livestock, is associated with narrower basis levels.
In addition, there are some distinct seasonal patterns to basis, which vary by
region.
The study found mixed impacts from natural disasters, again depending on the region of the country. The
variables chosen to model basis held the most explanatory power for regions closer to the major shipping
channel, the Mississippi River system. This suggests that further research using additional variables is needed
to explain changes in basis for regions farther away from the Mississippi River. [email protected], [email protected], [email protected], [email protected]

December 14, 2017
Grain Transportation Report 4
Grain Transportation Indicators
The grain bid summary illustrates the market relationships for commodities. Positive and negative adjustments in differential be-
tween terminal and futures markets, and the relationship to inland market points, are indicators of changes in fundamental market
supply and demand. The map may be used to monitor market and time differentials.
Table 1
Grain Transport Cost Indicators1
Truck Barge Ocean
For the week ending Unit Train Shuttle Gulf Pacific
12/13/17 195 264 207 154 198 1760 % # D IV / 0 ! - 2 % 0 % 0 %
12/06/17 196 272 213 158 198 176
1Indicator: Base year 2000 = 100; Weekly updates include truck = diesel ($/gallon); rail = near-month secondary rail market bid and monthly tariff rate
with fuel surcharge ($/car); barge = Illinois River barge rate (index = percent of tariff rate); and ocean = routes to Japan ($/metric ton)
Source: Transportation & Marketing Programs/AMS/USDA
Rail
Table 2
Market Update: U.S. Origins to Export Position Price Spreads ($/bushel)
Commodity Origin--Destination 12/8/2017 12/1/2017
Corn IL--Gulf -0.59 -0.63
Corn NE--Gulf -0.74 -0.82
Soybean IA--Gulf -1.29 -1.09
HRW KS--Gulf -2.60 -2.70
HRS ND--Portland -1.76 -1.66
Note: nq = no quote; n/a = not available
Source: Transportation & Marketing Programs/AMS/USDA
Figure 1
Grain Bid Summary

December 14, 2017
Grain Transportation Report 5
Rail Transportation
Railroads originate approximately 24 percent of U.S. grain shipments. Trends in these loadings are indicative of
market conditions and expectations.
Figure 2
Rail Deliveries to Port
0
1,000
2,000
3,000
4,000
5,000
6,000
7,000
8,000
9,000
10,000
07
/03/1
3
08
/28/1
3
10
/23/1
3
12
/18/1
3
02
/12/1
4
04
/09/1
4
06
/04/1
4
07
/30/1
4
09
/24/1
4
11
/19/1
4
01
/14/1
5
03
/11/1
5
05
/06/1
5
07
/01/1
5
08
/26/1
5
10
/21/1
5
12
/16/1
5
02
/10/1
6
04
/06/1
6
06
/01/1
6
07
/27/1
6
09
/21/1
6
11
/16/1
6
01
/11/1
7
03
/08/1
7
05
/03/1
7
06
/28/1
7
08
/23/1
7
10
/18/1
7
12
/13/1
7
02
/07/1
8
04
/04/1
8
05
/30/1
8
Ca
rlo
ad
s -
4-w
eek
ru
nn
ing
average
Pacific Northwest: 4 wks. ending 12/06--down 23% from same period last year; down 12% from 4-year average
Texas Gulf: 4 wks. ending 12/06--down 53% from same period last year; down 36% from the 4-year average
Miss. River: 4 wks. ending 12/06-down 59% from same period last year; down 65% from 4-year average
Cross-border: 4 wks. ending 12/02--down 4% from same period last year; up 11% from 4-year average
Source: Transportation & Marketing Programs/AMS/USDA
Table 3
Rail Deliveries to Port (carloads)1
Mississippi Pacific Atlantic & Cross-Border
For the Week Ending Gulf Texas Gulf Northwest East Gulf Total Week ending Mexico3
12/06/2017p
453 790 7,460 291 8,994 12/2/2017 1,810
11/29/2017r
127 893 5,038 187 6,245 11/25/2017 2,595
2017 YTDr
27,694 72,961 269,845 20,911 391,411 2017 YTD 113,519
2016 YTDr
34,631 81,301 281,923 25,968 423,823 2016 YTD 101,954
2017 YTD as % of 2016 YTD 80 90 96 81 92 % change YTD 111
Last 4 weeks as % of 20162
41 47 77 35 64 Last 4wks % 2016 96
Last 4 weeks as % of 4-year avg.2
35 64 88 39 73 Last 4wks % 4 yr 111
Total 2016 36,925 86,992 299,932 28,728 452,577 Total 2016 92,982
Total 2015 29,054 60,819 239,029 26,730 355,632 Total 2015 97,7361 Data is incomplete as it is voluntarily provided2 Compared with same 4-weeks in 2016 and prior 4-year average.
3 Cross-border weekly data is approximately 15 percent below the Association of American Railroads' reported weekly carloads received by Mexican railroads
to reflect switching between KCSM and FerroMex.
YTD = year-to-date; p = preliminary data; r = revised data; n/a = not available
Source: Transportation & Marketing Programs/AMS/USDA

December 14, 2017
Grain Transportation Report 6
Table 4
Class I Rail Carrier Grain Car Bulletin (grain carloads originated)
For the week ending:
12/2/2017 CSXT NS BNSF KCS UP CN CP
This week 2,104 3,122 13,660 1,139 5,687 25,712 3,227 5,141
This week last year 1,726 3,763 13,095 863 5,566 25,013 4,682 5,626
2017 YTD 82,446 132,985 533,370 46,768 269,933 1,065,502 184,627 225,950
2016 YTD 87,322 140,022 545,397 41,666 277,600 1,092,007 178,524 217,137
2017 YTD as % of 2016 YTD 94 95 98 112 97 98 103 104
Last 4 weeks as % of 2016* 103 85 90 114 82 89 88 95
Last 4 weeks as % of 3-yr avg.** 96 91 103 111 90 98 86 100
Total 2016 95,179 151,006 590,779 45,246 300,836 1,183,046 193,725 234,738
*The past 4 weeks of this year as a percent of the same 4 weeks last year.
**The past 4 weeks as a percent of the same period from the prior 3-year average. YTD = year-to-date.
Source: Association of American Railroads (www.aar.org)
East WestU.S. total
Canada
Figure 3
Total Weekly U.S. Class I Railroad Grain Car Loadings
15,000
17,000
19,000
21,000
23,000
25,000
27,000
29,000
Car
load
s
Prior 3-year, 4-week average Current 4-week average
For the 4 weeks ending December 2, grain carloadings were up 3 percent from the previous week, down 11 percent from last year, and down 2 percent from the 3-year average.
Source: Association of American Railroads
Table 5
Railcar Auction Offerings1
($/car)2
Dec-17 Dec-16 Jan-18 Jan-17 Feb-18 Feb-17 Mar-18 Mar-17
CO T grain units 0 0 no bids 0 no bids no bids no bids no bids
CO T grain single-car5 0 11 0 4 no bids no bids no bids no bids
GCAS/Region 1 no bids no bids no bids no bids no bids no bids n/a n/a
GCAS/Region 2 41 no bids no bids no bids no bids no bids n/a n/a
1Auctio n o fferings a re fo r s ingle-car and unit tra in s hipments o nly.2Average premium/dis co unt to ta riff, las t auc tio n
3BNSF - COT = Certifica te o f Trans po rta tio n; no rth gra in and s o uth gra in bids were co mbined effec tive the week ending 6/24/06.
4UP - GCAS = Grain Car Allo ca tio n Sys tem
Regio n 1 inc ludes : AR, IL, LA, MO, NM, OK, TX, WI, and Duluth, MN.
Regio n 2 inc ludes : CO, IA, KS, MN, NE, WY, and Kans as City and St. J o s eph, MO.
5Range is s ho wn becaus e average is no t ava ilable . No t ava ilable = n/a .
So urce : Trans po rta tio n & Marketing P ro grams /AMS/USDA.
UP4
Delivery period
BNSF3
For the week ending:
12/7/2017

December 14, 2017
Grain Transportation Report 7
The secondary rail market information reflects trade values for service that was originally purchased from the railroad carrier as
some form of guaranteed freight. The auction and secondary rail values are indicators of rail service quality and demand/
supply.
Figure 4
Bids/Offers for Railcars to be Delivered in December 2017, Secondary Market
-400
-200
0
200
400
600
800
1000
1200
1400
5/4
/201
7
5/1
8/2
017
6/1
/201
7
6/1
5/2
017
6/2
9/2
017
7/1
3/2
017
7/2
7/2
017
8/1
0/2
017
8/2
4/2
017
9/7
/201
7
9/2
1/2
017
10
/5/2
017
10/1
9/2
017
11
/2/2
017
11/1
6/2
017
11/3
0/2
017
12/1
4/2
017
Aver
age
pre
miu
m/d
isco
unt
to tar
iff
($/c
ar)
Shuttle Non-Shuttle
Shuttle prior 3-yr avg. (same week) Non-Shuttle prior 3-yr avg. (same week)12/7/2017
Non-shuttle bids include unit-train and single-car bids. n/a = not available.Source: Transportation & Marketing Programs/AMS/USDA
n/a
UPBNSF
$6
n/a
-$288Shuttle
Non-Shuttle
There were no Non-Shuttle bids/offers this week.
There were no Shuttle bids/offers last week. Average Non-Shuttle bids/offers this week are $141 below the peak.
Figure 5
Bids/Offers for Railcars to be Delivered in January 2018, Secondary Market
-200
0
200
400
600
800
1000
1200
6/1
/201
7
6/1
5/2
017
6/2
9/2
017
7/1
3/2
017
7/2
7/2
017
8/1
0/2
017
8/2
4/2
017
9/7
/201
7
9/2
1/2
017
10
/5/2
017
10/1
9/2
017
11
/2/2
017
11/1
6/2
017
11/3
0/2
017
12/1
4/2
017
12/2
8/2
017
1/1
1/2
018
Aver
age
pre
miu
m/d
isco
unt
to tar
iff
($/c
ar)
Shuttle Non-Shuttle
Shuttle prior 3-yr avg. (same week) Non-Shuttle prior 3-yr avg. (same week)12/7/2017
Non-shuttle bids include unit-train and single-car bids. n/a = not available.Source: Transportation & Marketing Programs/AMS/USDA
n/a
UPBNSF
n/a
n/a
n/aShuttle
Non-Shuttle
There were no Non-Shuttle bids/offers this week.
There were no Shuttle bids/offers this week.

December 14, 2017
Grain Transportation Report 8
Figure 6
Bids/Offers for Railcars to be Delivered in February 2018, Secondary Market
-200
-100
0
100
200
300
400
500
600
700
6/2
9/2
017
7/1
3/2
017
7/2
7/2
017
8/1
0/2
017
8/2
4/2
017
9/7
/201
7
9/2
1/2
017
10
/5/2
017
10/1
9/2
017
11
/2/2
017
11/1
6/2
017
11/3
0/2
017
12/1
4/2
017
12/2
8/2
017
1/1
1/2
018
1/2
5/2
018
2/8
/201
8
Aver
age
pre
miu
m/d
isco
unt
to tar
iff
($/c
ar)
Shuttle Non-Shuttle
Shuttle prior 3-yr avg. (same week) Non-Shuttle prior 3-yr avg. (same week)12/7/2017
Non-shuttle bids include unit-train and single-car bids. n/a = not available.Source: Transportation & Marketing Programs/AMS/USDA
n/a
UPBNSF
n/a
n/a
n/aShuttle
Non-Shuttle
There were no Non-Shuttle bids/offers this week.
There were no Shuttle bids/offers this week.
Table 6
Weekly Secondary Railcar Market ($/car)1
Dec-17 Jan-18 Feb-18 Mar-18 Apr-18 May-18
BNSF-GF n/a n/a n/a n/a n/a n/a
Change from last week n/a n/a n/a n/a n/a n/a
Change from same week 2016 n/a n/a n/a n/a n/a n/a
UP-Pool n/a n/a n/a n/a n/a n/a
Change from last week n/a n/a n/a n/a n/a n/a
Change from same week 2016 n/a n/a n/a n/a n/a n/a
BNSF-GF 6 n/a n/a n/a n/a n/a
Change from last week n/a n/a n/a n/a n/a n/a
Change from same week 2016 (285) n/a n/a n/a n/a n/a
UP-Pool (288) n/a n/a n/a n/a n/a
Change from last week n/a n/a n/a n/a n/a n/a
Change from same week 2016 (288) n/a n/a n/a n/a n/a
1Average premium/dis co unt to ta riff, $ /car-las t week
No te : Bids lis ted are market INDICATORS o nly & are NOT guaranteed prices ,
n/a = no t ava ilable ; GF = guaranteed fre ight; P o o l = guaranteed po o l
So urces : Trans po rta tio n and Marketing P ro grams /AMS/USDA
Data fro m J ames B. J o iner Co ., Tradewes t Bro kerage Co .
No
n-s
hu
ttle
For the week ending:
12/7/2017
Sh
utt
le
Delivery period

December 14, 2017
Grain Transportation Report 9
The tariff rail rate is the base price of freight rail service, and together with fuel surcharges and any auction and secondary rail
values constitute the full cost of shipping by rail. Typically, auction and secondary rail values are a small fraction of the full
cost of shipping by rail relative to the tariff rate. High auction and secondary rail values, during times of high rail demand or
short supply, can exceed the cost of the tariff rate plus fuel surcharge.
Table 7
Tariff Rail Rates for Unit and Shuttle Train Shipments1
Percent
Tariff change
December, 2017 Origin region3
Destination region3
rate/car metric ton bushel2
Y/Y4
Unit train
Wheat Wichita, KS St. Louis, MO $3,883 $71 $39.26 $1.07 4
Grand Forks, ND Duluth-Superior, MN $4,143 $0 $41.14 $1.12 0
Wichita, KS Los Angeles, CA $7,050 $0 $70.01 $1.91 1
Wichita, KS New Orleans, LA $4,540 $125 $46.32 $1.26 4
Sioux Falls, SD Galveston-Houston, TX $6,786 $0 $67.39 $1.83 5
Northwest KS Galveston-Houston, TX $4,816 $137 $49.18 $1.34 4
Amarillo, TX Los Angeles, CA $5,021 $190 $51.75 $1.41 5
Corn Champaign-Urbana, IL New Orleans, LA $3,931 $141 $40.44 $1.03 8
Toledo, OH Raleigh, NC $6,344 $0 $63.00 $1.60 5
Des Moines, IA Davenport, IA $2,258 $30 $22.72 $0.58 1
Indianapolis, IN Atlanta, GA $5,446 $0 $54.08 $1.37 5
Indianapolis, IN Knoxville, TN $4,540 $0 $45.08 $1.15 5
Des Moines, IA Little Rock, AR $3,609 $88 $36.71 $0.93 3
Des Moines, IA Los Angeles, CA $5,327 $255 $55.43 $1.41 4
Soybeans Minneapolis, MN New Orleans, LA $3,631 $127 $37.32 $1.02 2
Toledo, OH Huntsville, AL $5,287 $0 $52.50 $1.43 5
Indianapolis, IN Raleigh, NC $6,460 $0 $64.15 $1.75 5
Indianapolis, IN Huntsville, AL $4,764 $0 $47.31 $1.29 5
Champaign-Urbana, IL New Orleans, LA $4,745 $141 $48.52 $1.32 7
Shuttle Train
Wheat Great Falls, MT Portland, OR $3,953 $0 $39.26 $1.07 0
Wichita, KS Galveston-Houston, TX $4,171 $0 $41.42 $1.13 8
Chicago, IL Albany, NY $5,663 $0 $56.24 $1.53 3
Grand Forks, ND Portland, OR $5,611 $0 $55.72 $1.52 0
Grand Forks, ND Galveston-Houston, TX $5,931 $0 $58.90 $1.60 0
Northwest KS Portland, OR $5,812 $224 $59.94 $1.63 5
Corn Minneapolis, MN Portland, OR $5,000 $0 $49.65 $1.26 0
Sioux Falls, SD Tacoma, WA $4,960 $0 $49.26 $1.25 0
Champaign-Urbana, IL New Orleans, LA $3,731 $141 $38.45 $0.98 9
Lincoln, NE Galveston-Houston, TX $3,700 $0 $36.74 $0.93 0
Des Moines, IA Amarillo, TX $3,970 $110 $40.52 $1.03 3
Minneapolis, MN Tacoma, WA $5,000 $0 $49.65 $1.26 0
Council Bluffs, IA Stockton, CA $4,820 $0 $47.86 $1.22 2
Soybeans Sioux Falls, SD Tacoma, WA $5,600 $0 $55.61 $1.51 0
Minneapolis, MN Portland, OR $5,650 $0 $56.11 $1.53 0
Fargo, ND Tacoma, WA $5,500 $0 $54.62 $1.49 0
Council Bluffs, IA New Orleans, LA $4,775 $162 $49.03 $1.33 7
Toledo, OH Huntsville, AL $4,352 $0 $43.22 $1.18 3
Grand Island, NE Portland, OR $5,710 $229 $58.98 $1.61 61A unit train refers to shipments of at least 25 cars. Shuttle train rates are generally available for qualified shipments of
75-120 cars that meet railroad efficiency requirements.
2Approximate load per car = 111 short tons (100.7 metric tons): corn 56 lbs./bu., wheat and soybeans 60 lbs./bu.
3Regional economic areas are defined by the Bureau of Economic Analysis (BEA)
4Percentage change year over year calculated using tariff rate plus fuel surcharge
Tariff plus surcharge per:Fuel
surcharge
per car

December 14, 2017
Grain Transportation Report 10
Table 8
Tariff Rail Rates for U.S. Bulk Grain Shipments to MexicoDate: Percent
Tariff change4
Commodity Destination region rate/car1
metric ton3 bushel
3Y/Y
Wheat MT Chihuahua, CI $7,459 $0 $76.21 $2.07 0
OK Cuautitlan, EM $6,631 $98 $68.75 $1.87 1
KS Guadalajara, JA $7,309 $285 $77.59 $2.11 5
TX Salinas Victoria, NL $4,292 $60 $44.46 $1.21 3
Corn IA Guadalajara, JA $8,313 $248 $87.47 $2.22 3
SD Celaya, GJ $7,700 $0 $78.68 $2.00 2
NE Queretaro, QA $8,013 $205 $83.97 $2.13 3
SD Salinas Victoria, NL $6,743 $0 $68.90 $1.75 2
MO Tlalnepantla, EM $7,379 $200 $77.44 $1.97 3
SD Torreon, CU $7,300 $0 $74.59 $1.89 2
Soybeans MO Bojay (Tula), HG $8,134 $231 $85.47 $2.32 -5
NE Guadalajara, JA $8,692 $250 $91.37 $2.48 -1
IA El Castillo, JA $8,960 $0 $91.55 $2.49 0
KS Torreon, CU $7,489 $180 $78.36 $2.13 1
Sorghum NE Celaya, GJ $7,345 $226 $77.36 $1.96 4
KS Queretaro, QA $7,819 $122 $81.14 $2.06 3
NE Salinas Victoria, NL $6,452 $98 $66.92 $1.70 4
NE Torreon, CU $6,790 $172 $71.13 $1.80 41Rates are based upon published tariff rates for high-capacity shuttle trains. Shuttle trains are available for qualified
shipments of 75--110 cars that meet railroad efficiency requirements.2Fuel surcharge adjusted to reflect the change in Ferrocarril Mexicano, S.A. de C.V railroad fuel surcharge policy as of 10/01/20093Approximate load per car = 97.87 metric tons: Corn & Sorghum 56 lbs/bu, Wheat & Soybeans 60 lbs/bu4Percentage change calculated using tariff rate plus fuel surchage
Sources: www.bnsf.com, www.uprr.com, www.kcsouthern.com
Fuel
surcharge
per car2
Tariff plus surcharge per:Origin
state
December, 2017
Figure 7
Railroad Fuel Surcharges, North American Weighted Average1
-$0.10
$0.00
$0.10
$0.20
$0.30
$0.40
$0.50
$0.60
$0.70
Doll
ars
per
rai
lcar
mil
e
3-Year Monthly Average
Fuel Surcharge* ($/mile/railcar)
December, 2017: $0.09, unchanged from last month's surcharge of $0.09/mile; up 7 cents from the December 2016
surcharge of $0.02/mile; and down 2 cents from the December prior 3-year average of $0.11/mile.
1 Weighted by each Class I railroad's proportion of grain traffic for the prior year. * Beginning January 2009, the Canadian Pacific fuel surcharge is computed by a monthly average of the bi -weekly fuel surcharge.**CSX strike price changed from $2.00/gal. to $3.75/gal. starting January 1, 2015.
Sources: www.bnsf.com, www.cn.ca, www.cpr.ca, www.csx.com, www.kcsi.com, www.nscorp.com, www.uprr.com

December 14, 2017
Grain Transportation Report 11
Barge Transportation
Figure 9
Benchmark tariff rates
Calculating barge rate per ton:
(Rate * 1976 tariff benchmark rate per ton)/100
Select applicable index from market quotes included in
tables on this page. The 1976 benchmark rates per ton
are provided in map.
Twin Cities 6.19
Mid-Mississippi 5.32
St. Louis 3.99
Cairo-Memphis 3.14
Illinois 4.64 Cincinnati 4.69
Lower Ohio 4.04
Figure 8
Illinois River Barge Freight Rate1,2
1Rate = percent of 1976 tariff benchmark index (1976 = 100 percent); 24-week moving average of the 3-year average.
Source: Transportation & Marketing Programs/AMS/USDA
0
200
400
600
800
1000
12001
2/1
3/1
6
12
/27
/16
01
/10
/17
01
/24
/17
02
/07
/17
02
/21
/17
03
/07
/17
03
/21
/17
04
/04
/17
04
/18
/17
05
/02
/17
05
/16
/17
05
/30
/17
06
/13
/17
06
/27
/17
07
/11
/17
07
/25
/17
08
/08
/17
08
/22
/17
09
/05
/17
09
/19
/17
10
/03
/17
10
/17
/17
10
/31
/17
11
/14
/17
11
/28
/17
12
/12
/17
Per
cen
t of
tar
iff Weekly rate
3-year avg. for
the week
For the week ending December 12: 3 percent lower than last week, 7 percenthigher than last year,and 21 percent lower thanthe 3-year average.
Table 9
Weekly Barge Freight Rates: Southbound Only
Twin
Cities
Mid-
Mississippi
Lower
Illinois
River St. Louis Cincinnati
Lower
Ohio
Cairo-
Memphis
Rate1
12/12/2017 - - 278 208 300 300 175
12/5/2017 - - 285 195 268 268 173
$/ton 12/12/2017 - - 12.90 8.30 14.07 12.12 5.50
12/5/2017 - - 13.22 7.78 12.57 10.83 5.43
Current week % change from the same week:
Last year - - 7 11 35 35 3
3-year avg. 2
- - -21 -17 4 4 -22-2 6 6
Rate1
January - - 300 218 245 245 175
March - - 278 208 218 218 175
Source: Transportation & Marketing Programs/AMS/USDA
1Rate = percent of 1976 tariff benchmark index (1976 = 100 percent);
24-week moving average; ton = 2,000 pounds; "-" = closed

December 14, 2017
Grain Transportation Report 12
Figure 10
Barge Movements on the Mississippi River1 (Locks 27 - Granite City, IL)
1 The 3-year average is a 4-week moving average.
Source: U.S. Army Corps of Engineers
0
200
400
600
800
1,000
1,200
1,40006
/18/1
6
07
/02/1
6
07
/16/1
6
07
/30/1
6
08
/13/1
6
08
/27/1
6
09
/10/1
6
09
/24/1
6
10
/08/1
6
10
/22/1
6
11
/05/1
6
11
/19/1
6
12
/03/1
6
12
/17/1
6
12
/31/1
6
01
/14/1
7
01
/28/1
7
02
/11/1
7
02
/25/1
7
03
/11/1
7
03
/25/1
7
04
/08/1
7
04
/22/1
7
05
/06/1
7
05
/20/1
7
06
/03/1
7
06
/17/1
7
07
/01/1
7
07
/15/1
7
07
/29/1
7
08
/12/1
7
08
/26/1
7
09
/09/1
7
09
/23/1
7
10
/07/1
7
10
/21/1
7
11
/04/1
7
11
/18/1
7
12
/02/1
7
12
/16/1
7
12
/30/1
7
1,0
00
to
ns
Soybeans
Wheat
Corn
3-Year Average
For the week ending December 9: down 28 percent fromlast year and 19 percent lower than the 3-yravg.
Table 10
Barge Grain Movements (1,000 tons)
For the week ending 12/9/2017 Corn Wheat Soybeans Other Total
Mississippi River
Rock Island, IL (L15) 120 0 79 0 198
Winfield, MO (L25) 150 0 170 8 328
Alton, IL (L26) 391 0 220 8 619
Granite City, IL (L27) 357 0 209 19 585
Illinois River (L8) 205 0 38 0 243
Ohio River (L52) 25 4 126 2 156
Arkansas River (L1) 0 6 66 0 71
Weekly total - 2017 381 9 400 21 812
Weekly total - 2016 513 29 514 2 1,057
2017 YTD1
21,214 2,123 15,200 344 38,880
2016 YTD 23,137 1,947 15,598 318 41,000
2017 as % of 2016 YTD 92 109 97 108 95
Last 4 weeks as % of 20162
78 79 79 540 80
Total 2016 24,136 2,030 16,668 344 43,178
2 As a percent of same period in 2016.
Source: U.S. Army Corps of Engineers
Note: Total may not add exactly, due to rounding
1 Weekly total, YTD (year-to-date) and calendar year total includes Miss/27, Ohio/52, and Ark/1; "Other" refers to oats, barley,
sorghum, and rye.

December 14, 2017
Grain Transportation Report 13
Figure 11
Source: U.S. Army Corps of Engineers
Upbound Empty Barges Transiting Mississippi River Locks 27, Arkansas River
Lock and Dam 1, and Ohio River Locks and Dam 52
0
100
200
300
400
500
600
700
8001
/28
/17
2/4
/17
2/1
1/1
7
2/1
8/1
7
2/2
5/1
7
3/4
/17
3/1
1/1
7
3/1
8/1
7
3/2
5/1
7
4/1
/17
4/8
/17
4/1
5/1
7
4/2
2/1
7
4/2
9/1
7
5/6
/17
5/1
3/1
7
5/2
0/1
7
5/2
7/1
7
6/3
/17
6/1
0/1
7
6/1
7/1
7
6/2
4/1
7
7/1
/17
7/8
/17
7/1
5/1
7
7/2
2/1
7
7/2
9/1
7
8/5
/17
8/1
2/1
7
8/1
9/1
7
8/2
6/1
7
9/2
/17
9/9
/17
9/1
6/1
7
9/2
3/1
7
9/3
0/1
7
10/
7/1
7
10/
14/
17
10/
21/
17
10/
28/
17
11/
4/1
7
11/
11/
17
11/
18/
17
11/
25/
17
12/
2/1
7
12/
9/1
7
Nu
mb
er o
f B
arg
es
Miss. Locks 27 Ark Lock 1 Ohio Locks 52
For the week ending December 9: 455 barges transited the locks, 253 barges lower than the previous week, and 32 percent lower than the 3-year avg.
Figure 12
Grain Barges for Export in New Orleans Region
Source: U.S. Army Corps of Engineers and GIPSA
0
200
400
600
800
1000
1200
8/2
0/1
6
9/3
/16
9/1
7/1
6
10
/1/1
6
10
/15
/16
10
/29
/16
11
/12
/16
11
/26
/16
12
/10
/16
12
/24
/16
1/7
/17
1/2
1/1
7
2/4
/17
2/1
8/1
7
3/4
/17
3/1
8/1
7
4/1
/17
4/1
5/1
7
4/2
9/1
7
5/1
3/1
7
5/2
7/1
7
6/1
0/1
7
6/2
4/1
7
7/8
/17
7/2
2/1
7
8/5
/17
8/1
9/1
7
9/2
/17
9/1
6/1
7
9/3
0/1
7
10/1
4/1
7
10/2
8/1
7
11/1
1/1
7
11/2
5/1
7
12/9
/17
Downbound Grain Barges Locks 27, 1, and 52
Grain Barges Unloaded in New Orleans
Nu
mb
er o
f b
arges
For the week ending December 9: 524 grain barges moved down river, 15 percent higher than last week, 676 grain barges were unloaded in New Orleans, 22 percent lower
than the previous week.

December 14, 2017
Grain Transportation Report 14
The weekly diesel price provides a proxy for trends in U.S. truck rates as diesel fuel is a significant expense for truck grain move-
ments.
Truck Transportation
Table 11
Change from
Region Location Price Week ago Year ago
I East Coast 2.901 -0.003 0.381
New England 2.900 0.003 0.353
Central Atlantic 3.060 -0.002 0.427
Lower Atlantic 2.788 -0.006 0.359
II Midwest2 2.863 -0.014 0.417
III Gulf Coast3 2.705 -0.008 0.334
IV Rocky Mountain 2.991 -0.028 0.544
V West Coast 3.344 -0.029 0.572
West Coast less California 3.072 -0.034 0.382
California 3.560 -0.025 0.723
Total U.S. 2.910 -0.012 0.417
1Diesel fuel prices include all taxes. Prices represent an average of all types of diesel fuel.
2Same as North Central 3Same as South Central
Source: Energy Information Administration/U.S. Department of Energy (www.eia.doe.gov)
Retail on-Highway Diesel Prices, Week Ending 12/11/2017 (US $/gallon)
Figure 13
Weekly Diesel Fuel Prices, U.S. Average
Source: Retail On-Highway Diesel Prices, Energy Information Administration, Dept. of Energy
$2.49 $2.91
2
2.1
2.2
2.3
2.4
2.5
2.6
2.7
2.8
2.9
3
6/12
/201
7
6/19
/201
7
6/26
/201
7
7/3/
2017
7/10
/201
7
7/17
/201
7
7/24
/201
7
7/31
/201
7
8/7/
2017
8/14
/201
7
8/21
/201
7
8/28
/201
7
9/4/
2017
9/11
/201
7
9/18
/201
7
9/25
/201
7
10/2
/201
7
10/9
/201
7
10/1
6/20
17
10/2
3/20
17
10/3
0/20
17
11/6
/201
7
11/1
3/20
17
11/2
0/20
17
11/2
7/20
17
12/4
/201
7
12/1
1/20
17
$ pe
r ga
llon
Last Year Current YearFor the week ending December 11, fuel prices decreased 1.2
cents from the previous week at $2.91 per gallon, 42 cents
above the same week last year.

December 14, 2017
Grain Transportation Report 15
Grain Exports
Table 12
U.S. Export Balances and Cumulative Exports (1,000 metric tons)
Wheat Corn Soybeans Total
For the week ending HRW SRW HRS SWW DUR All wheat
Export Balances1
11/30/2017 1,989 545 1,579 1,280 58 5,450 14,813 13,302 33,564
This week year ago 2,084 559 2,304 1,186 188 6,320 18,484 17,160 41,964
Cumulative exports-marketing year 2
2017/18 YTD 4,925 1,099 3,145 2,665 202 12,036 8,087 23,040 43,163
2016/17 YTD 5,763 1,095 3,872 2,142 177 13,049 13,094 25,930 52,073
YTD 2017/18 as % of 2016/17 85 100 81 124 114 92 62 89 83
Last 4 wks as % of same period 2016/17 96 94 73 111 31 88 79 83 82
2016/17 Total 11,096 2,285 7,923 4,254 484 26,042 41,864 51,156 119,062
2015/16 Total 5,538 3,057 6,285 3,551 670 19,101 45,564 49,821 114,4861 Current unshipped (outstanding) export sales to date2 Shipped export sales to date; new marketing year now in effect for wheat, corn, and soybeans
Note: YTD = year-to-date. Marketing Year: wheat = 6/01-5/31, corn & soybeans = 9/01-8/31
Source: Foreign Agricultural Service/USDA (www.fas.usda.gov)
Table 13
Top 5 Importers 1 of U.S. Corn
For the week ending 11/30/2017 % change Exports3
2017/18 2016/17 current MY 3-year avg
Current MY Last MY from last MY 2014-2016 - 1,000 mt -
Mexico 8,924 8,750 2 12,297
Japan 3,769 4,175 (10) 11,450
Korea 950 2,366 (60) 4,494
Colombia 1,548 1,908 (19) 4,179
Peru 1,402 1,459 (4) 2,693
Top 5 Importers 16,594 18,658 (11) 35,113
Total US corn export sales 22,899 31,578 (27) 49,308
% of Projected 47% 54%
Change from prior week2
876 1,495
Top 5 importers' share of U.S. corn
export sales 72% 59% 71%
USDA forecast, December 2017 48,982 58,346 (16)
Corn Use for Ethanol USDA
forecast, December 2017 140,335 138,151 2
1Based on FAS Marketing Year Ranking Reports for 2015/16 - www.fas.usda.gov; Marketing year (MY) = Sep 1 - Aug 31.
3FAS Marketing Year Ranking Reports - http://apps.fas.usda.gov/export-sales/myrkaug.htm; 3-yr average
2Cumulative Exports (shipped) + Outstanding Sales (unshipped), FAS Weekly Export Sales Report, or Export Sales
Query--http://www.fas.usda.gov/esrquery/. Total commitments change (net sales) from prior week could include
revisions from previous week's outstanding sales or accumulated sales.
December 14, 2017
Grain Transportation Report 16
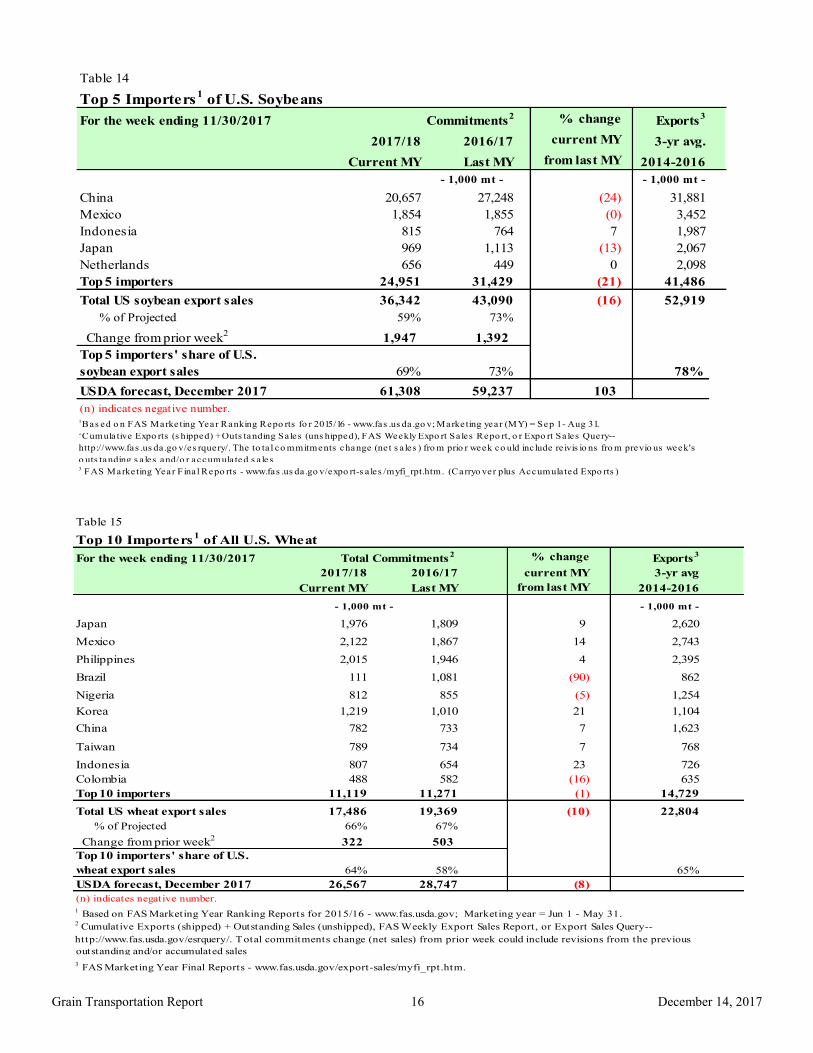
Table 15
Top 10 Importers1 of All U.S. Wheat
For the week ending 11/30/2017 % change Exports3
2017/18 2016/17 current MY 3-yr avg
Current MY Last MY from last MY 2014-2016
- 1,000 mt -
Japan 1,976 1,809 9 2,620
Mexico 2,122 1,867 14 2,743
Philippines 2,015 1,946 4 2,395
Brazil 111 1,081 (90) 862
Nigeria 812 855 (5) 1,254
Korea 1,219 1,010 21 1,104
China 782 733 7 1,623
Taiwan 789 734 7 768
Indonesia 807 654 23 726
Colombia 488 582 (16) 635
Top 10 importers 11,119 11,271 (1) 14,729
Total US wheat export sales 17,486 19,369 (10) 22,804
% of Projected 66% 67%
Change from prior week2
322 503
Top 10 importers' share of U.S.
wheat export sales 64% 58% 65%
USDA forecast, December 2017 26,567 28,747 (8)
1 Based on FAS Marketing Year Ranking Reports for 2015/16 - www.fas.usda.gov; Marketing year = Jun 1 - May 31.
outstanding and/or accumulated sales
Total Commitments2
3 FAS Marketing Year Final Reports - www.fas.usda.gov/export-sales/myfi_rpt.htm.
(n) indicates negative number.
2 Cumulative Exports (shipped) + Outstanding Sales (unshipped), FAS Weekly Export Sales Report, or Export Sales Query--
http://www.fas.usda.gov/esrquery/. Total commitments change (net sales) from prior week could include revisions from the previous
- 1,000 mt -
Table 14
Top 5 Importers1 of U.S. Soybeans
For the week ending 11/30/2017 % change
Exports3
2017/18 2016/17 current MY 3-yr avg.
Current MY Last MY from last MY 2014-2016
- 1,000 mt - - 1,000 mt -
China 20,657 27,248 (24) 31,881
Mexico 1,854 1,855 (0) 3,452
Indonesia 815 764 7 1,987
Japan 969 1,113 (13) 2,067
Netherlands 656 449 0 2,098
Top 5 importers 24,951 31,429 (21) 41,486
Total US soybean export sales 36,342 43,090 (16) 52,919
% of Projected 59% 73%
Change from prior week2
1,947 1,392
Top 5 importers' share of U.S.
soybean export sales 69% 73% 78%
USDA forecast, December 2017 61,308 59,237 103
1Bas ed o n FAS Marketing Year Ranking Repo rts fo r 2015/16 - www.fas .us da .go v; Marketing year (MY) = Sep 1 - Aug 31.
Total
Commitments2
3 FAS Marketing Year Fina l Repo rts - www.fas .us da .go v/expo rt-s a les /myfi_rpt.htm. (Carryo ver plus Accumula ted Expo rts )
(n) indicates negative number.
2Cumula tive Expo rts (s hipped) + Outs tanding Sales (uns hipped), FAS Weekly Expo rt Sa les Repo rt, o r Expo rt Sa les Query--
http://www.fas .us da .go v/es rquery/. The to ta l co mmitments change (ne t s a les ) fro m prio r week co uld inc lude re ivis io ns fro m previo us week's
o uts tanding s a les and/o r accumula ted s a les

December 14, 2017
Grain Transportation Report 17
The United States exports approximately one-quarter of the grain it produces. On average, this includes nearly 45 percent of U.S.-grown
wheat, 35 percent of U.S.-grown soybeans, and 20 percent of the U.S.-grown corn. Approximately 58 percent of the U.S. export grain ship-
ments departed through the U.S. Gulf region in 2016.
Table 16
Grain Inspections for Export by U.S. Port Region (1,000 metric tons)
For the Week Ending Previous Current Week 2017 YTD as
12/07/17 Week1
as % of Previous 2016 YTD % of 2016 YTD Last Year Prior 3-yr. avg.
Pacific Northwest
Wheat 222 267 83 13,857 11,594 120 91 115 12,325
Corn 58 0 n/a 10,317 11,533 89 7 16 12,009
Soybeans 491 635 77 12,286 13,098 94 100 103 14,447
Total 771 901 86 36,460 36,224 101 78 96 38,782
Mississippi Gulf
Wheat 27 65 42 4,064 3,338 122 80 77 3,480
Corn 413 443 93 27,757 29,939 93 84 101 31,420
Soybeans 622 991 63 30,107 32,120 94 78 76 35,278
Total 1,063 1,498 71 61,927 65,397 95 80 82 70,178
Texas Gulf
Wheat 44 18 241 6,058 5,600 108 73 96 6,019
Corn 22 11 204 733 1,590 46 26 50 1,669
Soybeans 0 0 n/a 219 1,027 21 0 0 1,105
Total 66 29 228 7,010 8,217 85 42 55 8,792
Interior
Wheat 40 37 108 1,641 1,458 113 90 114 1,543
Corn 153 136 113 8,315 6,854 121 122 168 7,197
Soybeans 132 117 113 5,187 4,327 120 105 106 4,577
Total 325 290 112 15,143 12,639 120 113 134 13,317
Great Lakes
Wheat 0 45 0 641 1,094 59 30 47 1,186
Corn 0 0 n/a 189 584 32 18 51 584
Soybeans 22 32 68 847 868 98 55 57 910
Total 22 77 28 1,677 2,546 66 41 54 2,681
Atlantic
Wheat 0 0 n/a 46 289 16 80 3 315
Corn 0 5 0 32 293 11 937 668 294
Soybeans 27 89 31 1,734 1,959 89 85 80 2,269
Total 27 94 29 1,813 2,541 71 86 79 2,878
U.S. total from ports
Wheat 334 432 77 26,307 23,373 113 80 99 24,867
Corn 647 594 109 47,343 50,794 93 69 99 53,173
Soybeans 1,294 1,864 69 50,379 53,399 94 83 83 58,587
Total 2,275 2,890 79 124,029 127,565 97 79 88 136,6271 Data includes revisions from prior weeks; some regional and U.S. totals may not add exactly due to rounding.
Source: Grain Inspection, Packers and Stockyards Administration/USDA (www.gipsa.usda.gov); YTD= year-to-date; n/a = not applicable
Last 4-weeks as % of:
Port Regions 2016 Total2017 YTD

December 14, 2017
Grain Transportation Report 18
Figure 14
U.S. grain inspected for export (wheat, corn, and soybeans)
Source: Grain Inspection, Packers and Stockyards Administration/USDA (www.gipsa.usda.gov)
Note: 3-year average consists of 4-week running average
0
20
40
60
80
100
120
140
160
180
200
5/1
2/2
016
6/9
/201
6
7/7
/201
6
8/4
/201
6
9/1
/201
6
9/2
9/2
016
10/2
7/2
016
11/2
4/2
016
12/2
2/2
016
1/1
9/2
017
2/1
6/2
017
3/1
6/2
017
4/1
3/2
017
5/1
1/2
017
6/8
/201
7
7/6
/201
7
8/3
/201
7
8/3
1/2
017
9/2
8/2
017
10/2
6/2
017
11/2
3/2
017
12/2
1/2
017
1/1
8/2
018
2/1
5/2
018
3/1
5/2
018
4/1
2/2
018
Mil
lion
bu
shels
(m
bu
)
Current week 3-year average
For the week ending Dec. 07: 85.3 mbu, down 21 percent from the previous week, down 29 percent from same week last year, and down 29 percent from the 3-year average.
Figure 15
U.S. Grain Inspections: U.S. Gulf and PNW1 (wheat, corn, and soybeans)
-
10
20
30
40
50
60
70
80
90
100
4/2
1/1
6
5/2
1/1
6
6/2
1/1
6
7/2
1/1
6
8/2
1/1
6
9/2
1/1
6
10/2
1/1
6
11/2
1/1
6
12/2
1/1
6
1/2
1/1
7
2/2
1/1
7
3/2
1/1
7
4/2
1/1
7
5/2
1/1
7
6/2
1/1
7
7/2
1/1
7
8/2
1/1
7
9/2
1/1
7
10/2
1/1
7
11/2
1/1
7
12/2
1/1
7
1/2
1/1
8
2/2
1/1
8
3/2
1/1
8
Mil
lion
bu
shels
(m
bu
)
Miss. Gulf 3-Year avg - Miss. Gulf
PNW 3-Year avg - PNW
Texas Gulf 3-Year avg - TX Gulf
Source: Grain Inspection, Packers and Stockyards Administration/USDA (www.gipsa.usda.gov)
Last Week:
Last Year (same week):
3-yr avg. (4-wk. mov. Avg):
MS Gulf TX Gulf U.S. Gulf PNW
down 29
down 31
down 40
up 127
down 68
down 55
down 26
down 35
down 41
down 14
down 20
down 7
Percent change from:Week ending 12/07/17 inspections (mbu):
Mississippi Gulf:
PNW:
Texas Gulf:
40.1
28.5
2.5

December 14, 2017
Grain Transportation Report 19
Ocean Transportation
Figure 16
U.S. Gulf Vessel Loading Activity
0
10
20
30
40
50
60
70
07
/20
/20
17
07
/27
/20
17
08
/03
/20
17
08
/10
/20
17
08
/17
/20
17
08
/24
/20
17
08
/31
/20
17
09
/07
/20
17
09
/14
/20
17
09
/21
/20
17
09
/28
/20
17
10
/05
/20
17
10
/12
/20
17
10
/19
/20
17
10
/26
/20
17
11
/02
/20
17
11
/09
/20
17
11
/16
/20
17
11
/23
/20
17
11
/30
/20
17
12
/07
/20
17
Nu
mb
er
of
ve
ssel
s
Loaded Last 7 Days Due Next 10 days Loaded 4 Year Average
Source:Transportation & Marketing Programs/AMS/USDA1U.S. Gulf includes Mississippi, Texas, and East Gulf.
For the week ending December 7 Loaded Due Change from last year -17.8% -26.5%
Change from 4-year avg. -15.9% -21.0%
Table 17
Weekly Port Region Grain Ocean Vessel Activity (number of vessels)
Pacific
Gulf Northwest
Loaded Due next
Date In port 7-days 10-days In port
12/7/2017 38 37 61 9
11/30/2017 48 43 42 9
2016 range (21..62) (27..55) (40..87) (6..27)
2016 avg. 43 40 62 15
Source: Transportation & Marketing Programs/AMS/USDA
December 14, 2017
Grain Transportation Report 20
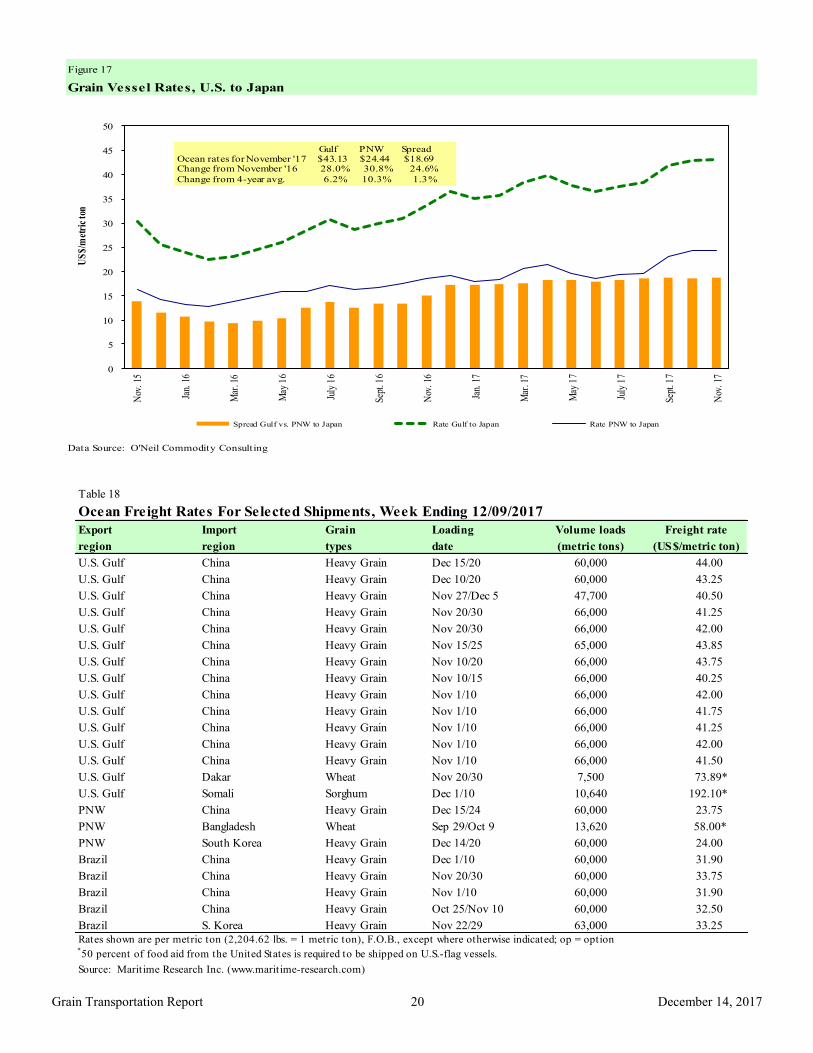
Figure 17
Grain Vessel Rates, U.S. to Japan
Data Source: O'Neil Commodity Consulting
0
5
10
15
20
25
30
35
40
45
50
Nov
. 15
Jan.
16
Mar
. 16
May
16
July
16
Sept
. 16
Nov
. 16
Jan.
17
Mar
. 17
May
17
July
17
Sept
. 17
Nov
. 17
US
$/m
etri
c to
n
Spread Gulf vs. PNW to Japan Rate Gulf to Japan Rate PNW to Japan
Gulf PNW Spread Ocean rates for November '17 $43.13 $24.44 $18.69 Change from November '16 28.0% 30.8% 24.6%
Change from 4-year avg. 6.2% 10.3% 1.3%
Table 18
Ocean Freight Rates For Selected Shipments, Week Ending 12/09/2017
Export Import Grain Loading Volume loads Freight rate
region region types date (metric tons) (US$/metric ton)
U.S. Gulf China Heavy Grain Dec 15/20 60,000 44.00
U.S. Gulf China Heavy Grain Dec 10/20 60,000 43.25
U.S. Gulf China Heavy Grain Nov 27/Dec 5 47,700 40.50
U.S. Gulf China Heavy Grain Nov 20/30 66,000 41.25
U.S. Gulf China Heavy Grain Nov 20/30 66,000 42.00
U.S. Gulf China Heavy Grain Nov 15/25 65,000 43.85
U.S. Gulf China Heavy Grain Nov 10/20 66,000 43.75
U.S. Gulf China Heavy Grain Nov 10/15 66,000 40.25
U.S. Gulf China Heavy Grain Nov 1/10 66,000 42.00
U.S. Gulf China Heavy Grain Nov 1/10 66,000 41.75
U.S. Gulf China Heavy Grain Nov 1/10 66,000 41.25
U.S. Gulf China Heavy Grain Nov 1/10 66,000 42.00
U.S. Gulf China Heavy Grain Nov 1/10 66,000 41.50
U.S. Gulf Dakar Wheat Nov 20/30 7,500 73.89*
U.S. Gulf Somali Sorghum Dec 1/10 10,640 192.10*
PNW China Heavy Grain Dec 15/24 60,000 23.75
PNW Bangladesh Wheat Sep 29/Oct 9 13,620 58.00*
PNW South Korea Heavy Grain Dec 14/20 60,000 24.00
Brazil China Heavy Grain Dec 1/10 60,000 31.90
Brazil China Heavy Grain Nov 20/30 60,000 33.75
Brazil China Heavy Grain Nov 1/10 60,000 31.90
Brazil China Heavy Grain Oct 25/Nov 10 60,000 32.50
Brazil S. Korea Heavy Grain Nov 22/29 63,000 33.25
Rates shown are per metric ton (2,204.62 lbs. = 1 metric ton), F.O.B., except where otherwise indicated; op = option *50 percent of food aid from the United States is required to be shipped on U.S.-flag vessels.
Source: Maritime Research Inc. (www.maritime-research.com)

December 14, 2017
Grain Transportation Report 21
In 2015, containers were used to transport 8 percent of total U.S. waterborne grain exports. Approximately 64 percent of U.S. wa-
terborne grain exports in 2015 went to Asia, of which 12 percent were moved in containers. Approximately 94 percent of U.S. wa-
terborne containerized grain exports were destined for Asia.
Figure 18
Top 10 Destination Markets for U.S. Containerized Grain Exports, January-September 2017
Source: USDA/Agricultural Marketing Service/Transportation Services Division analysis of Port Import Export Reporting
Service (PIERS) data
Note: The following Harmonized Tariff Codes are used to calculate containerized grains movements: 100190, 100200,
100300, 100400, 100590, 100700, 110100, 230310, 110220, 110290, 120100, 230210, 230990, 230330, and 120810.
Indonesia18%
Taiwan17%
China11%
Thailand10% Korea
10%
Japan
6%
Malaysia5%
Philippines2%
Vietnam2%
Bangladesh2%
Other17%
Figure 19
Monthly Shipments of Containerized Grain to Asia
Source: USDA/Agricultural Marketing Service/Transportation Services Division analysis of Port Import Export Reporting Service (PIERS) data.
Note: The following Harmonized Tariff Codes are used to calculate containerized grains movements: 100190, 100200, 100300, 100400, 100590,
100700, 110100, 110220, 110290, 120100, 120810, 230210, 230310, 230330, and 230990.
05
101520253035404550556065707580
Jan.
Feb
.
Mar
.
Ap
r.
May
Jun
.
Jul.
Au
g
.
Sep
.
Oct
.
Nov
.
Dec
.
Th
ou
san
d
20
-ft
equ
ivale
nt
un
its
2016
2017
5-year avg
Sep 2017: Down 19.7% from last year and 8% lower than
the 5-year average

December 14, 2017
Grain Transportation Report 22
Coordinators
Surajudeen (Deen) Olowolayemo [email protected] (202) 720 - 0119
Pierre Bahizi [email protected] (202) 690 - 0992
Adam Sparger [email protected] (202) 205 - 8701
Weekly Highlight Editors
Surajudeen (Deen) Olowolayemo [email protected] (202) 720 - 0119
April Taylor [email protected] (202) 720 - 7880
Nicholas Marathon [email protected] (202) 690 - 4430
Grain Transportation Indicators
Surajudeen (Deen) Olowolayemo [email protected] (202) 720 - 0119
Rail Transportation
Adam Sparger [email protected] (202) 205 - 8701
Johnny Hill [email protected] (202) 690 - 3295
Jesse Gastelle [email protected] (202) 690 - 1144
Peter Caffarelli [email protected] (202) 690 - 3244
Barge Transportation
Nicholas Marathon [email protected] (202) 690 - 4430
April Taylor [email protected] (202) 720 - 7880
Matt Chang [email protected] (202) 720 - 0299
Truck Transportation
April Taylor [email protected] (202) 720 - 7880
Sergio Sotelo [email protected] (202) 756 - 2577
Grain Exports
Johnny Hill [email protected] (202) 690 - 3295
Ocean Transportation
Surajudeen (Deen) Olowolayemo [email protected] (202) 720 - 0119
(Freight rates and vessels)
April Taylor [email protected] (202) 720 - 7880
(Container movements)
Subscription Information: Send relevant information to [email protected] for an electronic
copy (printed copies are also available upon request).
Preferred citation: U.S. Dept. of Agriculture, Agricultural Marketing Service. Grain Transportation Report.
December 14, 2017. Web: http://dx.doi.org/10.9752/TS056.12-14-2017
Contacts and Links
In accordance with Federal civil rights law and U.S. Department of Agriculture (USDA) civil rights regulations and policies, the USDA, its
Agencies, offices, and employees, and institutions participating in or administering USDA programs are prohibited from discriminating based on
race, color, national origin, religion, sex, gender identity (including gender expression), sexual orientation, disability, age, marital status, family/
parental status, income derived from a public assistance program, political beliefs, or reprisal or retaliation for prior civil rights activity, in any
program or activity conducted or funded by USDA (not all bases apply to all programs). Remedies and complaint filing deadlines vary by pro-
gram or incident.
Persons with disabilities who require alternative means of communication for program information (e.g., Braille, large print, audiotape, American
Sign Language, etc.) should contact the responsible Agency or USDA's TARGET Center at (202) 720-2600 (voice and TTY) or contact USDA
through the Federal Relay Service at (800) 877-8339. Additionally, program information may be made available in languages other than English.
To file a program discrimination complaint, complete the USDA Program Discrimination Complaint Form, AD-3027, found online at How to
File a Program Discrimination Complaint and at any USDA office or write a letter addressed to USDA and provide in the letter all of the infor-
mation requested in the form. To request a copy of the complaint form, call (866) 632-9992. Submit your completed form or letter to USDA by:
(1) mail: U.S. Department of Agriculture, Office of the Assistant Secretary for Civil Rights, 1400 Independence Avenue, SW, Washington, D.C.
20250-9410; (2) fax: (202) 690-7442; or (3) email: [email protected].