grande ronde satellite facilities o&m annual …...grande ronde satellite facilities o&m...
TRANSCRIPT
Grande Ronde Satellite Facilities O&M
Annual Report
1 January 2017 through 31 December 2017
Michael L. McLean Ryan Seeger Tim Helwick
Confederated Tribes of the Umatilla Indian Reservation Department of Natural Resources, Fisheries Program
46411 Timine Way, Pendleton, Oregon 97801
Prepared for:
Tracy Hauser, Project Manager U.S. Department of Energy
Bonneville Power Administration Division of Fish and Wildlife
P. O. Box 3621 Portland, Oregon 97208-3621
Project 199800703
BPA Contract No. 73982 CTUIR Project 410
January 2018

2
ACKNOWLEDGEMENTS
We would like to thank CTUIR facility operators Nick Allamand, Ken Walker, Dave Hein and Giani Moses for all of the long hours spent watching and maintaining the facilities and their assistance in collection of data. Thanks to CTUIR personnel Gary James, Brian Zimmerman, Michelle Thompson, Julie Burke, Celeste Reves, and Dora Sigo who provided program administrative assistance from Pendleton. Thanks to the ODFW personnel at Lookingglass Hatchery for their assistance holding and spawning the broodstock. Also, the ODFW fish transportation crew La Grande Oregon, for fish transportation to the acclimation facilities and ODFW fish pathology La Grande Oregon, for disease sampling at the acclimation facilities. Lastly, Brian Zimmerman provided report review and critique.

3
ABSTRACT
There was only one group of fish acclimated at the Catherine Creek Acclimation Facility in 2017. The 155,534 conventional smolts arrived at the facility on 15 March. The volitional release began on 20 March, and continued until force release on 14 April. The average size of the fish at delivery was 27.0 fish/lb. The total number of fish that were released from the acclimation facility was 155,428. The size of the fish that were forced from the facility was 22.6 fish/lb. The total mortality for the acclimation period was 106 (0.068%). ODFW Fish Health Services examined a total of ten Catherine Creek smolt mortalities with dates of mortality ranging from 15 March to 9 April 2017. These represented fish from raceways 2 and 3 at Lookingglass Hatchery. Three of ten fish (33%) had gross signs of BKD. Four of the ten fish had very high BKD ELISA results ranging from 1.549 to 2.478 OD units confirming these fish had clinical BKD. The others were ≤ 0.078 OD units. There were two acclimation groups at the Upper Grande Ronde Acclimation Facility in 2017. Group 1, 129,255 conventional smolts, arrived at the facility on 14 March 2017. Group 2, 126,198 conventional smolts, arrived on 5 April. Volitional release for Group 1 began on 17 March with force out on 4 April. The average size of the fish at delivery was 28.9 fish/lb. Volitional release for Group 2 began on 7 April with force out on 14 April. The average size of the fish at delivery was 26.6 fish/lb. The total number of fish that were released from the acclimation facility was 255,276 (129,219 Group 1, 126,057 Group 2). The size of the fish that were forced from the facility was 24.7 and 22.0 fish/lb, for groups 1 and 2 respectively. There were a total of 177 mortalities during acclimation. There were 36 mortalities in Group 1 (0.03%) and 141 in Group 2 (0.11%). ODFW Fish Health Services examined a total of 20 Grande Ronde smolt mortalities (ten from each group). Two out of 20 fish (one from each group) had gross signs of BKD and ELISA OD values ≥2.338 OD units confirming that they had clinical BKD. All other BKD ELISA values were ≤0.082 OD units. The Catherine Creek Adult Collection Facility was put into operation on 28 February 2017. The first adult summer steelhead was captured on 10 March. A total of 104 unmarked adult summer steelhead were trapped and released from 10 March to 22 May 2017. No hatchery adults were trapped. Median arrival at the trap was the week of 1 April. The first adult spring Chinook salmon was captured in the trap on 10 June 2017. A total of 223 (185 adult and 38 jack) spring Chinook salmon were trapped from 10 June to 31 July 2017. The total catch was comprised of 50 adults and 7 jacks of natural origin and 135 adults and 31 jacks of hatchery origin. A total of 112 adults (30 natural, 82 hatchery) and 11 jacks (6 natural, 5 conventional) were released above the weir to spawn naturally. Median arrival for both natural and hatchery origin adults at the trap was the week of 24 June. The broodstock collected and transported consisted of 20 unmarked and 53 conventional broodstock adults along with one natural and four conventional jacks. The trap was removed on 12 August. Trap efficiency in 2016 was estimated at 92.5%. The Upper Grande Ronde Adult Collection Facility was put into operation on 1 March 2017. The first adult summer steelhead was captured on 26 April. A total of two unmarked adult summer steelhead were trapped and released from 26 April to 28 April. No adipose-clipped fish were captured. Median arrival at the trap was the week of 29 April. The first adult spring Chinook salmon was captured on 5 June 2017. A total of 138 (128 adult and 10 jack) spring Chinook salmon, were trapped from 5 June to 21 June. A total of nine natural adults were released above
4
the weir to spawn naturally. A total of seven adults of natural origin and 111 adults and 10 jacks of conventional hatchery origin were transported to LGH for broodstock. The trap and weir were removed on 21 June 2017 due to high stream temperatures (daily maximum >20 oC). Trap efficiency was estimated at 30.4%. A total of 45 females, 36 males and five jacks were spawned from the Catherine Creek stock at LGH in 2017. The total number of green eggs collected was 173,691. A total of 71 females, 60 males, and 10 jacks were spawned from the upper Grande Ronde stock in 2017. The total number of green eggs collected was 272,182. A total of 45 females, 40 males, and six jacks were spawned for the Lookingglass Creek program in 2017. The total number of green eggs collected was 168,568. In 2017, EN was used for the sixth year during the ripeness sorts. The EN system was not used on the Catherine Creek stock held in the circular tank due to logistical reasons. The mean egg viability in 2017 for stocks the EN was used on was 94%, while for Catherine Creek it was 90%.
5
TABLE OF CONTENTS
ACKNOWLEDGEMENTS .............................................................................................................2
ABSTRACT .....................................................................................................................................3
LIST OF FIGURES .........................................................................................................................6
LIST OF TABLES ...........................................................................................................................8
LIST OF APPENDIX TABLES ....................................................................................................10
INTRODUCTION .........................................................................................................................12
METHODS ....................................................................................................................................13
Juvenile Acclimation .................................................................................................................13 Adult Collections .......................................................................................................................17 Broodstock Activities ................................................................................................................21
RESULTS AND DISCUSSION ....................................................................................................22
Juvenile Acclimation .................................................................................................................22 Adult Collections .......................................................................................................................26 Broodstock Activities ................................................................................................................37
LOOKINGGLASS HATCHERY ..................................................................................................37 LITERATURE CITED ..................................................................................................................41
APPENDIX TABLES ....................................................................................................................42

6
LIST OF FIGURES
Figure 1. Map of the upper Grande Ronde River basin showing locations (rm) of Lookingglass Hatchery and Catherine Creek and Upper Grande Ronde juvenile acclimation and adult capture facilities. ........................................................................................................................................ 14
Figure 2. Photo and diagram of the Catherine Creek acclimation facility. The lines passing through the shaded area represent underground return pipes. .................................................................... 15
Figure 3. Photo and diagram of the Upper Grande Ronde acclimation facility. The main intake line and the lines passing through the shaded area represent underground pipes. ............................... 16
Figure 4. Photos of the Catherine Creek (top) and the Upper Grande Ronde (bottom) adult broodstock collection facilities ..................................................................................................... 18
Figure 5. Daily maximum, minimum, and average water temperatures (recorded hourly) at the Catherine Creek juvenile acclimation facility in 2017 ................................................................. 23
Figure 6. Daily maximum, minimum, and average water temperatures (recorded hourly) at the Upper Grande Ronde juvenile acclimation facility in 2017. ........................................................ 25
Figure 7. Summer steelhead arrival timing at the Catherine Creek adult collection facility in 2017 and mean arrival timing from 2002 to 2016 ................................................................................. 27
Figure 8. Arrival timing of age 4 and 5 spring Chinook salmon at the Catherine Creek adult collection facility in 2017 and mean arrival timing from 2002 to 2016. ...................................... 28
Figure 9. Weekly maximum flows (recorded daily) near the town of Union, OR in 2017 (data from Oregon Water Resources Department (OWRD) website, site # 13320000). Also shown is the mean weekly maximum flow for 2011 to 2016. ..................................................................................... 31
Figure 10. Daily maximum, minimum, and average water temperatures (recorded hourly) at the Catherine Creek adult collection facility in 2017. ........................................................................ 31
Figure 11. Average hourly water temperature at the Catherine Creek adult collection facility in 2017............................................................................................................................................... 31
Figure 12. Summer steelhead arrival timing at the Grande Ronde adult collection facility in 2017 and for 2007-16 (rm 153.5) and mean arrival timing for 2002-06 (rm 163). ............................... 33
Figure 13. Arrival timing of age 4 and 5 spring Chinook salmon at the Upper Grande Ronde adult collection facility in 2017 and mean arrival timing for 2010 -16 (weir out early rm 153.5), 2007-09 (rm 153.5) and 2002-06 (rm 163) ............................................................................................ 34
Figure 14. Weekly maximum flows (recorded daily) near the town of Perry, OR in 2017 (data from Oregon Water Resources Department (OWRD) website, site #13318960). Also shown is the mean weekly maximum flow for 2011 to 2016. ..................................................................................... 35

7
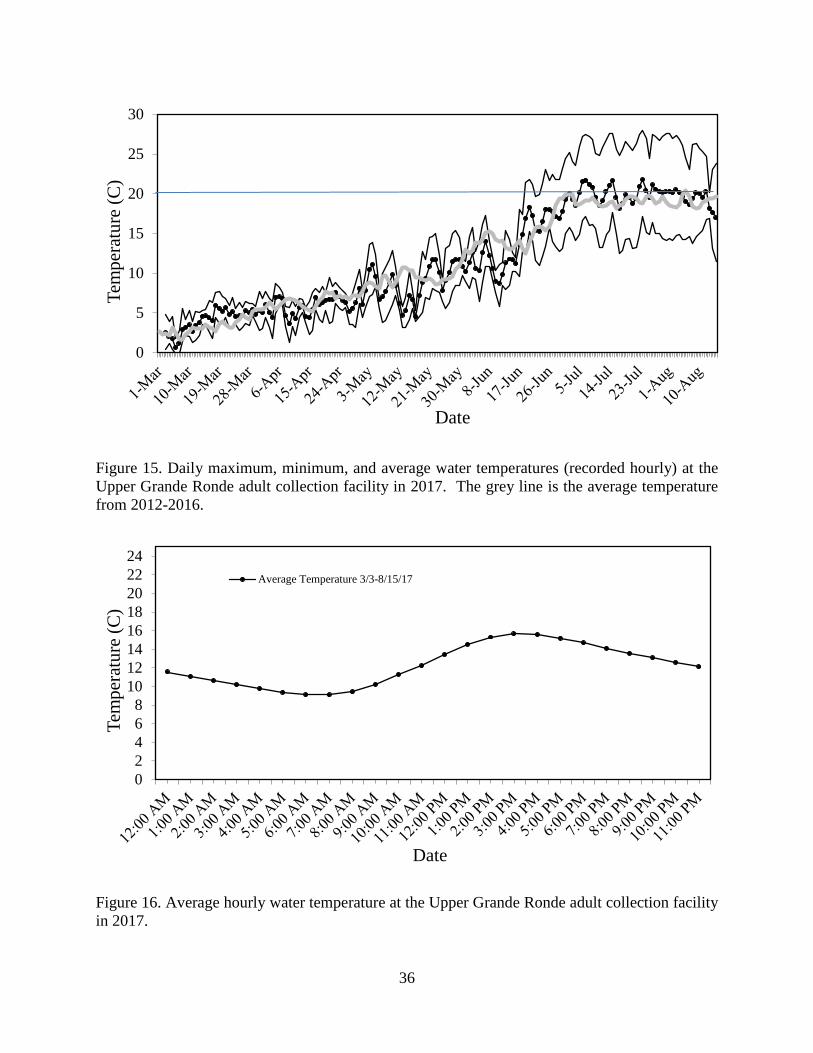
Figure 15. Daily maximum, minimum, and average water temperatures (recorded hourly) at the Upper Grande Ronde adult collection facility in 2017. ................................................................ 36
Figure 16. Average hourly water temperature at the Upper Grande Ronde adult collection facility in 2017. ......................................................................................................................................... 36

8
LIST OF TABLES
Table 1. Raceway fish density and flow data for the Catherine Creek acclimation facility release in 2017 .......................................................................................................................................... 22
Table 2. Group, number, size, raceways, mortality, feed fed, and numbers released from the Catherine Creek acclimation facility in 2017 ............................................................................... 22
Table 3. Group, acclimation dates, temperature, and dissolved oxygen for the acclimation period at the Catherine Creek acclimation facility in 2017...................................................................... 23
Table 4. Raceway fish density and flow data for the Upper Grande Ronde acclimation facility release in 2017 .............................................................................................................................. 24
Table 5. Group, number, size, raceways, mortality, feed fed, and numbers released from the Upper Grande Ronde acclimation facility in 2017 .................................................................................. 25
Table 6. Group, acclimation dates, temperature, and dissolved oxygen for fish acclimated at the Upper Grande Ronde facility in 2017 ........................................................................................... 25
Table 7. Summer steelhead trap capture data from the Catherine Creek adult collection facility in 2017. Trapping began 28 February and ended 12 August ............................................................ 27
Table 8. Spring Chinook salmon trap capture, transport, and mortality data for the Catherine Creek stock at the adult collection facility in 2017. Trapping began 28 February and ended 12 August28
Table 9. Summer steelhead trap capture data from the Upper Grande Ronde adult collection facility in 2017. Trapping began 1 March and ended 21 June. The trap was pulled on 21 June due to high water temperature.......................................................................................................................... 32
Table 10. Spring Chinook salmon trap capture, transport, and mortality data for the Grande Ronde River stock at the adult collection facility in 2017. Trapping began 1 March and ended 21 June 34
Table 11. Spawning information from Catherine Creek spring Chinook salmon female broodstock at Lookingglass Hatchery in 2017. ............................................................................................... 38
Table 12. Spawning information from Catherine Creek spring Chinook salmon male broodstock at Lookingglass Hatchery in 2017 ................................................................................................ 38
Table 13. Spawning information from Catherine Creek spring Chinook salmon jack broodstock at Lookingglass Hatchery in 2017 .................................................................................................... 38
Table 14. Spawning information from Grande Ronde spring Chinook salmon female broodstock at Lookingglass Hatchery in 2017 ................................................................................................ 39
Table 15. Spawning information from Grande Ronde spring Chinook salmon male broodstock at Lookingglass Hatchery in 2017 .................................................................................................... 39

9
Table 16. Spawning information from Grande Ronde spring Chinook salmon jack broodstock at Lookingglass Hatchery in 2017. ................................................................................................... 39
Table 17. Spawning information from Lookingglass Creek spring Chinook salmon female broodstock at Lookingglass Hatchery in 2017.............................................................................. 40
Table 18. Spawning information from Lookingglass Creek spring Chinook salmon male broodstock at Lookingglass Hatchery in 2017.............................................................................. 40
Table 19. Spawning information from Lookingglass Creek spring Chinook salmon jack broodstock at Lookingglass Hatchery in 2017 ................................................................................................ 40

10
LIST OF APPENDIX TABLES
Appendix Table 1. Sliding Scale Management Plan for the Catherine Creek and Upper Grande Ronde Spring Chinook Artificial Propagation Program. .............................................................. 43
Appendix Table 2. Group, number, size, raceways, mortality, feed fed, and numbers released from the Catherine Creek acclimation facility 2000 to 2017 release years. .......................................... 44
Appendix Table 3. Group, number, size, raceways, mortality, feed fed, and numbers released from the Upper Grande Ronde acclimation facility 2000 to 2017 release years. .................................. 45
Appendix Table 4. Group, acclimation dates, temperature, dissolved oxygen, and estimated volitional migration of fish acclimated at the Catherine Creek facility 2000 to 2017 release years........................................................................................................................................................ 46
Appendix Table 5. Group, acclimation dates, temperature, dissolved oxygen, and estimated volitional migration of fish acclimated at the Upper Grande Ronde facility 2000 to 2017 release years. ............................................................................................................................................. 47
Appendix Table 6. Release and return summary for spring Chinook salmon from Catherine Creek 1998 to 2015 broodyears. Numbers updated from previous years reports. .................................. 48
Appendix Table 7. Release and return summary for spring Chinook salmon from the upper Grande Ronde River 1998 to 2015 broodyears. Numbers updated from previous years reports. ............. 49
Appendix Table 8. Release and return summary for spring Chinook salmon from Lookingglass Creek 2000 to 2015 broodyears. Numbers updated from previous years reports. ........................ 51
Appendix Table 9. Adult trapping, broodstock and redd counts for spring Chinook salmon from Catherine Creek 1997 to 2017 (does not include jack salmon). ................................................... 52
Appendix Table 10. Adult trapping, broodstock and redd counts for spring Chinook salmon from the upper Grande Ronde River 1997 to 2017 (does not include jack salmon). ............................ 53
Appendix Table 11. Adult trapping, broodstock and redd counts for spring Chinook salmon from Lookingglass Creek 2004 to 2017 (does not include jack salmon)(Trap operated by ODFW Lookingglass Hatchery). ............................................................................................................... 54
Appendix Table 12. Daily summer steelhead trapping data from the Catherine Creek adult collection facility in 2017. ............................................................................................................ 55
Appendix Table 13. Daily spring Chinook salmon trapping data from the Catherine Creek adult collection facility in 2017. ............................................................................................................ 56
Appendix Table 14. Daily summer steelhead trapping data from the Upper Grande Ronde adult collection facility in 2017. ............................................................................................................ 56

11
Appendix Table 15. Daily spring Chinook salmon trapping data from the Upper Grande Ronde adult collection facility in 2017. ................................................................................................... 57
Appendix Table 16. Daily summer steelhead trapping data from the Lookingglass Creek adult collection facility in 2017. ............................................................................................................ 58
Appendix Table 17. Daily spring Chinook salmon trapping data from the Lookingglass Creek adult collection facility in 2017. ............................................................................................................ 59
Appendix Table 18. Adult summer steelhead trapping summary from the Catherine Creek adult collection facility 1997-2017. ....................................................................................................... 60
Appendix Table 19. Adult summer steelhead trapping summary from the Upper Grande Ronde River adult collection facility 1997-2017. .................................................................................... 61
Appendix Table 20. Adult summer steelhead trapping summary from the Lookingglass Creek adult collection facility 1997-2017. ....................................................................................................... 62
Appendix Table 21. Spawning data for Catherine Creek stock spring Chinook salmon at Lookingglass Hatchery 2001-2017. .............................................................................................. 63
Appendix Table 22. Spawning data for Grande Ronde stock spring Chinook salmon at Lookingglass Hatchery 2001-2017. .............................................................................................. 64
Appendix Table 23. Spawning data for Lookingglass Creek stock spring Chinook salmon at Lookingglass Hatchery 2004-2017. .............................................................................................. 65
Appendix Table 24. Bull trout trapping summary from the Catherine Creek, Upper Grande Ronde, and Lookingglass Creek adult collection facilities 1999-2017. .................................................... 66
Appendix Table 25. Median spawn dates and holding location at Lookingglass Hatchery for Catherine Creek, Grande Ronde, and Lookingglass Creek stocks 2001-2017. ............................ 66
Appendix Table 26. Percent egg viability for stocks of fish spawned at Lookingglass Hatchery (mean percent viability). ............................................................................................................... 67
Appendix Table 27. Trap install and removal dates. .................................................................... 67
Appendix Table 28. Spawning metrics from Lookingglass Hatchery. ......................................... 68

12
INTRODUCTION
Anadromous salmonid stocks have declined in both the Grande Ronde River Basin (Lower Snake River Compensation Plan (LSRCP) Status Review Symposium 1998) and in the entire Snake River Basin (Nehlsen et al. 1991), many to the point of extinction. The Grande Ronde River Basin historically supported large populations of fall and spring Chinook (Oncorhynchus tshawytscha), sockeye (O. nerka), and coho (O. kisutch) salmon and steelhead trout (O. mykiss) (Nehlsen et al. 1991). The decline of Chinook salmon and steelhead populations and extirpation of coho and sockeye salmon in the Grande Ronde River Basin was, in part, a result of construction and operation of hydroelectric facilities, over fishing, and loss and degradation of critical spawning and rearing habitat in the Columbia and Snake River basins (Nehlsen et al. 1991). Hatcheries were built in Oregon, Washington and Idaho under the Lower Snake River Compensation Plan (LSRCP) to compensate for losses of anadromous salmonids due to the construction and operation of the lower four Snake River dams. Lookingglass Hatchery (LGH) on Lookingglass Creek, a tributary of the Grande Ronde River, was completed under LSRCP in 1982 and has served as the main incubation and rearing site for spring Chinook salmon programs in the Grande Ronde and Imnaha rivers in Northeast Oregon. Despite these hatchery programs, natural spring Chinook populations continued to decline resulting in the National Marine Fisheries Service (NMFS) listing Snake River spring/summer Chinook salmon as "threatened" under the federal Endangered Species Act (1973) on 22 April 1992. Continuing poor escapement levels and declining population trends indicated that Grande Ronde River basin spring Chinook salmon were in imminent danger of extinction. These continuing trends led fisheries co-managers in the basin to initiate the Grande Ronde Endemic Spring Chinook Salmon Supplementation Program (GRESCSSP) in order to prevent extinction and preserve options for use of endemic fish stocks in future artificial propagation programs. The GRESCSSP was implemented in three Grande Ronde River basin tributaries; the Lostine River, the upper Grande Ronde River, and Catherine Creek. The GRESCSSP employed two broodstock strategies utilizing captive and conventional brood sources. The captive brood programs began in 1995, with the collection of parr from the three tributary areas. As of June 2015, all the captive brood programs were discontinued. The conventional broodstock component of the programs began in 1997 with the collection of natural adults returning to these tributary areas. Although LGH was available as the primary production facility for spring Chinook programs in the Grande Ronde Basin, there were never any adult or juvenile satellite facilities developed in the tributary areas that were to be supplemented. An essential part of the GRESCSSP was the construction of adult traps and juvenile acclimation facilities in these tributary areas. Weirs were installed in 1997 for the collection of adult broodstock for the conventional component of the program. Juvenile facilities were built in 2000 for acclimation of the smolts produced by the captive and conventional broodstock programs as release sites within the natural production areas of their natal streams. The Confederated Tribes of the Umatilla Indian Reservation (CTUIR) operate both the juvenile acclimation and adult trapping facilities located on Catherine Creek and the upper Grande Ronde River under this project. The Nez Perce Tribe (NPT) operate the facilities on the Lostine River under a sister project.

13
Hatcheries were also built in Oregon, Washington and Idaho under the LSRCP to compensate for losses of summer steelhead due to the construction and operation of the lowest four Snake River dams. Despite these harvest-driven hatchery programs, natural summer steelhead populations continued to decline as evidenced by declining counts at Lower Granite Dam since 1995 (Columbia River Data Access in Real Time, DART) and low steelhead redd counts on index streams in the Grande Ronde Basin. Because of low escapement the Snake River summer steelhead were listed as threatened under the Endangered Species Act of 1973 by the National Marine Fisheries Service (NMFS) on 18 August, 1997. Co-managers have also discontinued off-station releases of juvenile Wallowa stock (non-endemic) hatchery summer steelhead into Catherine Creek in 1998 and the upper Grande Ronde River in 1999. Data are lacking on summer steelhead adult return numbers, stray rates, and the genetic make-up of populations that return to tributaries of the Grande Ronde River basin. The adult fish weirs in place on Catherine Creek and the upper Grande Ronde River are also used to collect data on summer steelhead populations in those areas.
METHODS
Juvenile Acclimation
The Catherine Creek Acclimation Facility (CCAF) is located at river mile (rm) 52.5 of Catherine Creek (Figure 1). Catherine Creek originates in the Wallowa Mountains and flows north to northwest entering the Grande Ronde River at rm 117. The Upper Grande Ronde Acclimation Facility (UGRAF) is located at rm 170.5 of the Grande Ronde River (Figure 1). The Grande Ronde River originates in the Elkhorn Mountains and flows north to northeast 183 rm, before entering the Snake River. Each facility consists of 4 portable raceways lined with vinyl fabric (Figures 2 and 3). Each raceway is 86 ft long, 8 ft wide, and the water depth is kept at around 3.25 ft (2,236 ft3). The water supply for CCAF is pumped directly from Catherine Creek into the raceways using a screened submersible pump powered by a diesel powered electrical generator. The water supply for UGRAF is diverted from the Grande Ronde River into the raceways by gravity using a screened cement intake structure located about 600 ft upstream from the raceways. For both facilities the water is drained from each raceway through an 8 inch pipe back to the river below the water intake. A 29 ft travel trailer is placed at each facility to provide onsite housing for facility operators, who provide 24 hour watch and maintenance of the facility.

14
Figure 1. Map of the upper Grande Ronde River basin showing locations (rm) of Lookingglass Hatchery and Catherine Creek and Upper Grande Ronde juvenile acclimation and adult capture facilities.

15
Figure 2. Photo and diagram of the Catherine Creek acclimation facility. The lines passing through the shaded area represent underground return pipes.

16
Figure 3. Photo and diagram of the Upper Grande Ronde acclimation facility. The main intake line and the lines passing through the shaded area represent underground pipes.
17
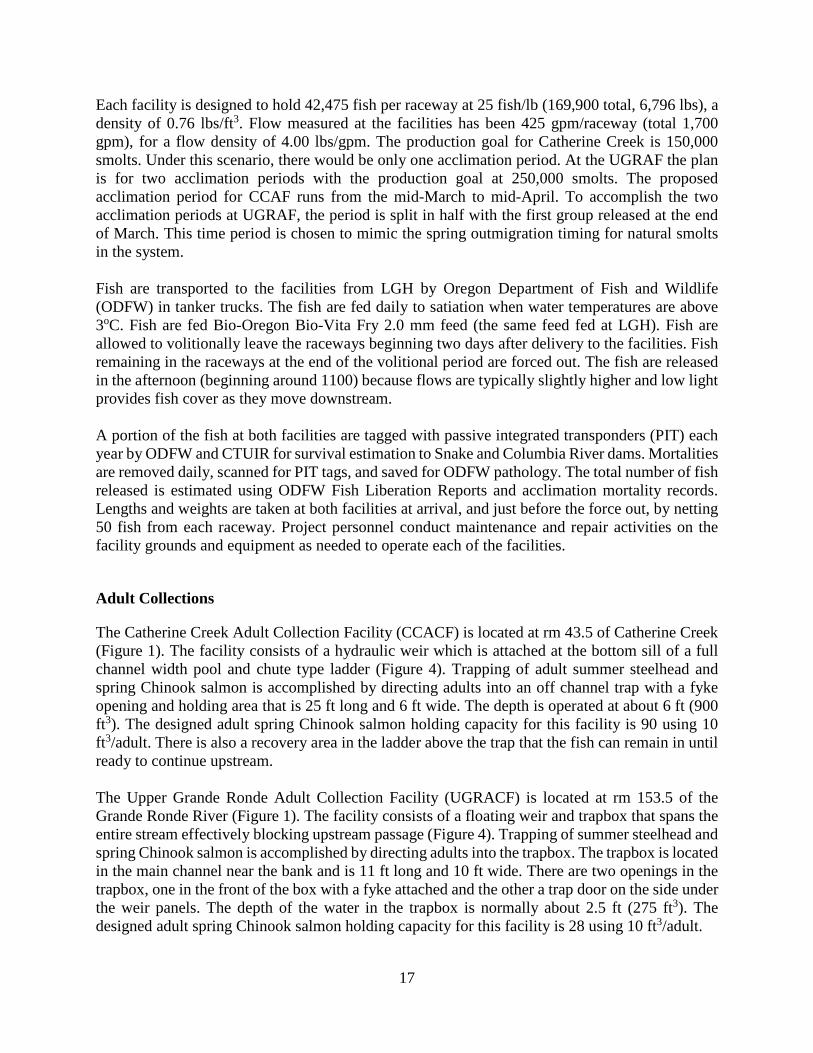
Each facility is designed to hold 42,475 fish per raceway at 25 fish/lb (169,900 total, 6,796 lbs), a density of 0.76 lbs/ft3. Flow measured at the facilities has been 425 gpm/raceway (total 1,700 gpm), for a flow density of 4.00 lbs/gpm. The production goal for Catherine Creek is 150,000 smolts. Under this scenario, there would be only one acclimation period. At the UGRAF the plan is for two acclimation periods with the production goal at 250,000 smolts. The proposed acclimation period for CCAF runs from the mid-March to mid-April. To accomplish the two acclimation periods at UGRAF, the period is split in half with the first group released at the end of March. This time period is chosen to mimic the spring outmigration timing for natural smolts in the system. Fish are transported to the facilities from LGH by Oregon Department of Fish and Wildlife (ODFW) in tanker trucks. The fish are fed daily to satiation when water temperatures are above 3oC. Fish are fed Bio-Oregon Bio-Vita Fry 2.0 mm feed (the same feed fed at LGH). Fish are allowed to volitionally leave the raceways beginning two days after delivery to the facilities. Fish remaining in the raceways at the end of the volitional period are forced out. The fish are released in the afternoon (beginning around 1100) because flows are typically slightly higher and low light provides fish cover as they move downstream. A portion of the fish at both facilities are tagged with passive integrated transponders (PIT) each year by ODFW and CTUIR for survival estimation to Snake and Columbia River dams. Mortalities are removed daily, scanned for PIT tags, and saved for ODFW pathology. The total number of fish released is estimated using ODFW Fish Liberation Reports and acclimation mortality records. Lengths and weights are taken at both facilities at arrival, and just before the force out, by netting 50 fish from each raceway. Project personnel conduct maintenance and repair activities on the facility grounds and equipment as needed to operate each of the facilities.
Adult Collections
The Catherine Creek Adult Collection Facility (CCACF) is located at rm 43.5 of Catherine Creek (Figure 1). The facility consists of a hydraulic weir which is attached at the bottom sill of a full channel width pool and chute type ladder (Figure 4). Trapping of adult summer steelhead and spring Chinook salmon is accomplished by directing adults into an off channel trap with a fyke opening and holding area that is 25 ft long and 6 ft wide. The depth is operated at about 6 ft (900 ft3). The designed adult spring Chinook salmon holding capacity for this facility is 90 using 10 ft3/adult. There is also a recovery area in the ladder above the trap that the fish can remain in until ready to continue upstream. The Upper Grande Ronde Adult Collection Facility (UGRACF) is located at rm 153.5 of the Grande Ronde River (Figure 1). The facility consists of a floating weir and trapbox that spans the entire stream effectively blocking upstream passage (Figure 4). Trapping of summer steelhead and spring Chinook salmon is accomplished by directing adults into the trapbox. The trapbox is located in the main channel near the bank and is 11 ft long and 10 ft wide. There are two openings in the trapbox, one in the front of the box with a fyke attached and the other a trap door on the side under the weir panels. The depth of the water in the trapbox is normally about 2.5 ft (275 ft3). The designed adult spring Chinook salmon holding capacity for this facility is 28 using 10 ft3/adult.

18
Figure 4. Photos of the Catherine Creek (top) and the Upper Grande Ronde (bottom) adult broodstock collection facilities.

19
There is a structure on the upstream side of the trap that reduces the flow of the river on the trap side and allows an area of recovery for the fish that are passed. A travel trailer is placed at each facility after the completion of the acclimation periods to allow for 24 hour/7 day a week security during the peak trapping periods. Each of the traps is checked daily and water temperatures are taken with a pocket thermometer before the trap is operated. An Onset™ recording thermometer is also installed in the trap boxes for hourly temperature readings. Handling events only occur when water temperatures are below 20.0oC. Later in the season, as water temperatures rise, fish are processed earlier in the day when water temperatures are lower, in order to reduce stress. At the upper Grande Ronde facility, if and when the daily maximum water temperature exceeds 20.0oC the trap is opened and the weir is removed from the stream for the year (2017 LSRCP AOP). Drug free methods are used at the traps due to possible harvest of the fish above the weirs. Electro-narcosis (EN) is used during trap checks at Catherine Creek to sedate the fish prior to handling. The EN system consists of a 75 gallon trough with an 18 in. x 18 in. aluminum plate attached at each end of the trough. The plates are covered with a plastic mesh to eliminate contact of the fish with the plates. The plates are wired to the power system which was a variable 0 – 60 volt; 3 amp DC power source. Electro-narcosis is not used at the Grande Ronde due to safety concerns specific to that trap. The fish are worked un-anesthetized due to the harvest concerns above the trap. Fork lengths from both summer steelhead and spring Chinook salmon are measured to the nearest millimeter (mm). A paper punch is used to mark fish and collect tissues for genetic samples. A single punch on the right opercle plate is used to mark the fish that are released upriver as having been trapped. Tissue from opercle punch is collected for genetics evaluation (all steelhead, and only Chinook from CCACF). Tissue samples are stored dry in scale envelopes. Each fish is examined externally for marks, injuries or other physical conditions, and a preliminary determination of sex is made. Scales from a subsample of the steelhead and all natural Chinook are taken. Naturally and hatchery produced summer steelhead are enumerated and passed upstream. Spring Chinook salmon are collected and transported to LGH for broodstock, outplanted in another stream, or enumerated and passed upstream. Summer steelhead kelts encountered are counted and allowed to pass downstream over the weir if alive and sampled (length, weight, and otolith) if dead. Any spring Chinook salmon mortality recovered is also sampled. Fish species captured incidentally are released upstream. Spring Chinook broodstock collection at the CCACF is based on a sliding scale developed by co-managers in the basin (Appendix Table 1). The sliding scale was developed to allow for increases and decreases in the number of returning naturally- and hatchery-produced fish and to provide a basin specific approach to broodstock and natural escapement management. The scale is based on preseason population estimates and regulates the percentage of natural and hatchery broodstock to be retained and hatchery/wild ratio above the weir. When the ratio is applied above the weir and surplus fish are the result, these fish can be used for Lookingglass Creek broodstock or outplanted in Lookingglass Creek and/or Indian Creek. Fish collected for broodstock are taken systematically (adult/jack) from across the run.

20
This sliding scale management does not apply to the UGRACF. For the upper Grande Ronde River, escapement and broodstock collection guidelines were agreed to by the co-managers as part of the Grande Ronde Spring Chinook Hatchery Management Plan (GRSCHMP 2002). Up to 50% of the natural fish returning to the weir may be retained for brood and as many conventional origin adults as needed to meet the broodstock goal. No captive brood progeny adults are used for broodstock. In the upper Grande Ronde, 2016 was the last year of returns for the captive broodstock program. There are no restrictions on hatchery/wild ratio above the weir. Fish collected for broodstock are to be taken systematically (adult/jack) from across the run. However, due to temperature concerns in the upper Grande Ronde, a contingency collection schedule is developed and agreed to as part of the LSRCP Annual Operating Plan (AOP) in case of early, high temperature conditions. We use daily maximum water temperature to estimate the removal date of the weir and adjust broodstock take accordingly (2017 LSRCP AOP). Hatchery jack management above the weirs is the same for both Catherine Creek and the upper Grande Ronde River. The goal is not to exceed a total of one jack for every ten adult male spring Chinook passed (10%). However, all natural origin jacks are passed upriver regardless of number. If natural jack numbers are below the 10% male level, then enough conventional jacks are released to meet the target. Surplus jacks that arrive at the weirs are sacrificed for data collection (coded wire tag) and distributed for ceremonial and subsistence uses. Preferred jack management in the Catherine Creek broodstock is 1 jack for every 10 males (10%) while the Grande Ronde broodstock can be as high as 1 jack for every 5 adult fish. The high percentage allowed in the Grande Ronde broodstock is due to the historical very low adult numbers when the GRSCHMP was being developed and the possible need for more males in the brood. Generally the same rate (1:10) is used as for the Catherine Creek brood. All fish collected for broodstock at UGRACF and CCACF and transported to LGH received prophylactic dorsal sinus injections of oxytetracycline and erythromycin upon loading. Dosage of each antibiotic is based on estimated age length data (3 year fish <600mm, 4 year fish 600-799mm, 5 year fish >799). For the erythromycin (100mg/ml), 3-year-old fish received 0.50cc, 4-year-old fish 1.0cc, and 5-year-old fish 2.0cc. The oxytetracycline (200mg/ml) is given at one-quarter the dose of the erythromycin injections. The fish are transferred from the trap to the CTUIR transport vehicle by using a water-filled tube. Broodstock are transported from each weir site to LGH using 300 gallon fiberglass tanks mounted on flatbed trailers. The tanks are each equipped with an aerator and oxygen tank. Transport time to LGH from the weir sites is about 1.0 to 2.0 hours. Target dissolved oxygen level in the tank during transport is 11 mg/l. Dissolved oxygen levels are checked mid-way through the transport. The possible effects of the weirs on fish behavior is evaluated by walking or snorkeling a one-mile segment of the stream immediately downstream of the weirs once a week when water levels and clarity allow for viewing fish. Live fish, carcasses, and evidence of spawning activities (redds, test digs) are recorded. ODFW and CTUIR staff conducts standard spawning ground surveys (Monzyk et al. 2006) on segments upstream and downstream of the weir in August and September and the same information is collected. Trap efficiency is calculated by taking the (number of adults passed + number of adults removed at the weir) / (total adult population above the weir + number of adults removed at the weir).

21
Project personnel conduct maintenance and repair activities on facility grounds and equipment as needed to operate the facilities.
Broodstock Activities
Assistance is provided to ODFW for the spawning of the Lookingglass Creek, Catherine Creek and Upper Grande Ronde River conventional broodstocks held at LGH. All stocks at LGH are checked for ripeness once a week over a five week period beginning around the middle of August. An EN system at Lookingglass Hatchery is used for the Grande Ronde and Lookingglass stocks but not used for the Catherine Creek stock.

22
RESULTS AND DISCUSSION
Juvenile Acclimation
There was only one group of fish acclimated at the CCAF in 2017 (Table 1). The CCAF received 155,534 conventional smolts on 15 March. The volitional release began on 20 March, and continued until force release on 14 April. The average size of the fish at delivery was 27.0 fish/lb (Table 1). Densities in the raceways ranged from 0.63 to 0.68 lbs/ft3. The variability in the raceway densities was due to the densities at LGH and the way they were loaded onto the transport truck. The total number of fish that were released from the acclimation facility was 155,428 (Table 2). The size of the fish that were forced from the facility was 22.6 fish/lb. The estimated release size for the entire group was 24.8 fish/lb. The size of the fish at release was larger than the size of the fish at delivery. This was the opposite of what we have seen in the past where the size of the fish at release is smaller than the size at delivery. This could be due to the smaller fish leaving first or the fish that did not migrate early grew to a larger size. A total of 490.0 pounds of food was fed during the acclimation period. The average daily water temperature at CCAF for the acclimation ranged from 1.8oC to 7.3 oC (Figure 5). The total mortality for the acclimation period was 106 (0.068%). ODFW Fish Health Services examined a total of ten Catherine Creek smolt mortalities from the acclimation. Three of ten fish (33%) had gross signs of BKD. Four of the ten fish had very high BKD ELISA results ranging from 1.549 to 2.478 OD units confirming these fish had clinical BKD. The others were ≤ 0.078 OD units. All samples collected for virus culture were negative. Table 1. Raceway fish density and flow data for the Catherine Creek acclimation facility release in 2017.
Table 2. Group, number, size, raceways, mortality, feed fed, and numbers released from the Catherine Creek acclimation facility in 2017.
Program Mark LGH
raceway CCAF
raceway No. Fish
Arr. Size (f/lb)
Wt. (lbs) lbs/gpm lbs/cf Mortality
Conv. AD,CWT 2 1 38,346 27.3 1,405 3.41 0.63 20 Conv. AD,CWT 2 2 38,346 26.8 1,433 3.48 0.64 65 Conv. AD,CWT 3 3 39,421 28.0 1,410 3.42 0.63 5 Conv. AD,CWT 3 4 39,421 25.9 1,524 3.70 0.68 16
Totals 155,534 27.0 5,773 106
Facility/ rel. yr
Group
Number Received
Rel.Size fish/lb.
Raceways Used
Density lbs/ft3
Total mortality (%)
Feed Fed (lbs)
Number released
CC 17 1 Conv. 155,534 24.8 4 0.65 0.07 490.0 155,428

23
Table 3. Group, acclimation dates, temperature, and dissolved oxygen for the acclimation period at the Catherine Creek acclimation facility in 2017.
Figure 5. Daily maximum, minimum, and average water temperatures (recorded hourly) at the Catherine Creek juvenile acclimation facility in 2017. There were two acclimation groups at the UGRAF in 2017 (Table 4). Group 1, 129,255 conventional smolts, arrived at the facility on 14 March 2017. Group 2, 126,198 conventional smolts, arrived on 5 April (Table 5). Volitional release for Group 1 began on 17 March with force out on 4 April (Table 6). The average size of the fish at delivery was 28.9 fish/lb. The densities in the raceways ranged from 0.46 and 0.54 lbs/ft3. Volitional release for Group 2 began on 7 April with force out on 14 April. The average size of the fish at delivery was 26.6 fish/lb. The densities in the raceways ranged from 0.50 to 0.55 lbs/ft3. The total number of fish that were released from the acclimation facility was 255,276 (129,219 Group 1, 126,057 Group 2). The size of the fish that were forced from the facility was 24.7 and 22.0 fish/lb, for groups 1 and 2 respectively. The estimated release size for the entire group was
Facility/ rel. yr
Group
Acclimation
Period
Volitional
began
Temp.oC DO mg/l
Min.
Max.
Min.
Max. CC 17 1 Conv. 3/15 – 4/14 3/20 1.8 7.3 10.0 12.7
-2-10123456789
10
Tem
pera
ture
(C)
Date

24
26.8 fish/lb Group 1 and 24.3 fish/lb Group 2. Based on the size of the fish at delivery it appears that the smaller fish from both groups 1 and 2 left the raceways volitionally leaving the larger fish to be forced out. The usual pattern seen in the past has been for the larger fish to leave the facility first. Growth of the fish during the acclimation period is probably not a reason for the larger size at release as the fish are only in the ponds for a couple of weeks. A total of 503.8 pounds of food was fed during the acclimation period (297.3 early, 206.5 late). The average daily water temperature at UGRAF for the acclimation ranged from -0.1oC to 6.1 oC (Figure 7). There were a total of 177 mortalities during acclimation. There were 36 mortalities in Group 1 (0.03%) and 141 in Group 2 (0.11%). ODFW Fish Health Services examined a total of 20 Grande Ronde smolt mortalities (ten from each group). One fish from each group had gross signs of BKD and ELISA OD values ≥2.338 OD units confirming that they had clinical BKD. All other BKD ELISA values were ≤0.082 OD units. All samples collected for virus culture were negative. Maintenance and repair activities were conducted at both acclimation facilities in 2017. Facility maintenance work at the CCAF consisted of snow removal, work on the intake site, fence repair and weed abatement. Facility maintenance work at the UGRAF consisted of snow removal, removal of gravel from intake area, weed abatement, and replacement of all 4 pond liners. Table 4. Raceway fish density and flow data for the Upper Grande Ronde acclimation facility release in 2017.
Program Mark LGH
raceway UGRAF raceway
No. Fish
Arr Size (f/lb)
Wt. (lbs) lbs/gpm lbs/cf Mortality
Group 1 Conv. CWT 15 1 32,546 28.2 1,156 3.03 0.52 10 Conv. CWT 15 2 32,547 31.4 1,036 2.71 0.46 17 Conv. AD,CWT 18 3 32,081 26.8 1,199 3.14 0.54 4 Conv. AD,CWT 18 4 32,081 29.3 1,095 2.87 0.49 5
Totals 129,255 28.9 4,487 36 Group 2 Conv. CWT 16 1 31,630 25.5 1,240 3.25 0.55 26 Conv. CWT 16 2 31,630 28.2 1,122 2.94 0.50 21 Conv. AD,CWT 17 3 31,469 25.6 1,228 3.21 0.55 42 Conv. AD,CWT 17 4 31,469 27.0 1,168 3.06 0.52 52
Totals 126,198 26.6 4,757 141

25
Table 5. Group, number, size, raceways, mortality, feed fed, and numbers released from the Upper Grande Ronde acclimation facility in 2017.
Table 6. Group, acclimation dates, temperature, and dissolved oxygen for fish acclimated at the Upper Grande Ronde facility in 2017.
Figure 6. Daily maximum, minimum, and average water temperatures (recorded hourly) at the Upper Grande Ronde juvenile acclimation facility in 2017.
Facility/ rel. yr
Group
Number Received
Size fish/lb.
Raceways used
Density lbs/ft3
Total mortality (%)
Feed Fed (lbs)
Number released
GR 17 1 Conv. 129,255 28.9 4 0.50 0.03 297.3 129,219 GR 17 2 Conv. 126,198 26.6 4 0.53 0.11 206.5 126,057
Facility/ rel. yr
Group
Acclimation
Period
Volitional
began
Temp.oC DO mg/l
Min.
Max.
Min.
Max. GR 17 1 Conv. 3/14 – 4/4 3/17 -0.1 4.7 10.9 13.7 GR 17 2 Conv. 4/5 – 4/14 4/7 -0.1 6.1 10.1 13.4
-2-10123456789
10
Tem
pera
ture
(C)
Date
26
Adult Collections
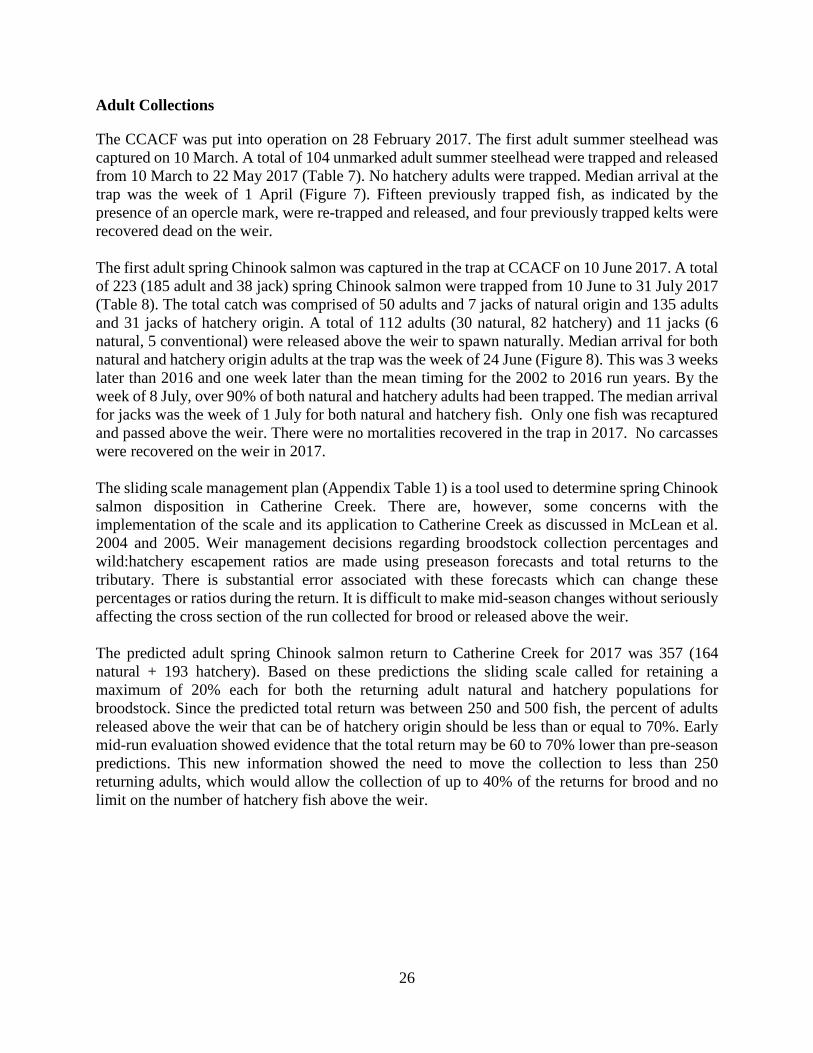
The CCACF was put into operation on 28 February 2017. The first adult summer steelhead was captured on 10 March. A total of 104 unmarked adult summer steelhead were trapped and released from 10 March to 22 May 2017 (Table 7). No hatchery adults were trapped. Median arrival at the trap was the week of 1 April (Figure 7). Fifteen previously trapped fish, as indicated by the presence of an opercle mark, were re-trapped and released, and four previously trapped kelts were recovered dead on the weir. The first adult spring Chinook salmon was captured in the trap at CCACF on 10 June 2017. A total of 223 (185 adult and 38 jack) spring Chinook salmon were trapped from 10 June to 31 July 2017 (Table 8). The total catch was comprised of 50 adults and 7 jacks of natural origin and 135 adults and 31 jacks of hatchery origin. A total of 112 adults (30 natural, 82 hatchery) and 11 jacks (6 natural, 5 conventional) were released above the weir to spawn naturally. Median arrival for both natural and hatchery origin adults at the trap was the week of 24 June (Figure 8). This was 3 weeks later than 2016 and one week later than the mean timing for the 2002 to 2016 run years. By the week of 8 July, over 90% of both natural and hatchery adults had been trapped. The median arrival for jacks was the week of 1 July for both natural and hatchery fish. Only one fish was recaptured and passed above the weir. There were no mortalities recovered in the trap in 2017. No carcasses were recovered on the weir in 2017. The sliding scale management plan (Appendix Table 1) is a tool used to determine spring Chinook salmon disposition in Catherine Creek. There are, however, some concerns with the implementation of the scale and its application to Catherine Creek as discussed in McLean et al. 2004 and 2005. Weir management decisions regarding broodstock collection percentages and wild:hatchery escapement ratios are made using preseason forecasts and total returns to the tributary. There is substantial error associated with these forecasts which can change these percentages or ratios during the return. It is difficult to make mid-season changes without seriously affecting the cross section of the run collected for brood or released above the weir. The predicted adult spring Chinook salmon return to Catherine Creek for 2017 was 357 (164 natural + 193 hatchery). Based on these predictions the sliding scale called for retaining a maximum of 20% each for both the returning adult natural and hatchery populations for broodstock. Since the predicted total return was between 250 and 500 fish, the percent of adults released above the weir that can be of hatchery origin should be less than or equal to 70%. Early mid-run evaluation showed evidence that the total return may be 60 to 70% lower than pre-season predictions. This new information showed the need to move the collection to less than 250 returning adults, which would allow the collection of up to 40% of the returns for brood and no limit on the number of hatchery fish above the weir.

27
Table 7. Summer steelhead trap capture data from the Catherine Creek adult collection facility in 2017. Trapping began 28 February and ended 12 August.
Week Trap capture Carcassa
First time Reruns Not punched Punched 4-Mar 0 11-Mar 3 18-Mar 20 25-Mar 22 2 1-Apr 11 8-Apr 14 5 15-Apr 6 1 1 22-Apr 13 1 29-Apr 6 3 2 6-May 7 3 13-May 0 1 20-May 1 27-May 1 3-Jun 0 10-Jun 0
104 15 0 4 a These fish were kelts or pre spawn mortality recovered on or near the weir. Punched fish
were previously trapped.
Figure 7. Summer steelhead arrival timing at the Catherine Creek adult collection facility in 2017 and mean arrival timing from 2002 to 2016.
05
1015202530354045505560
Perc
ent o
f the
tota
l
Week
2017 N=1042002-16 N=3,400

28
Table 8. Spring Chinook salmon trap capture, transport, and mortality data for the Catherine Creek stock at the adult collection facility in 2017. Trapping began 28 February and ended 12 August.
Week Trap capturea Broodstock hauled Trap
mort Nat. (jack) Capt. (jack) Conv. (jack) Nat. (jack) Conv. (jack) 13-May 0 Prog. 0 20-May 0 finished 0 27-May 0 0 3-Jun 0 0
10-Jun 1 3 17-Jun 8 21 2 3 9 24-Jun 19 1 50 8 8 1 20 3 1-Jul 12 4 37 8 5 15 1 8-Jul 9 2 22 12 3 7
15-Jul 0 2 1 2 22-Jul 0 0 29-Jul 0 0 5-Aug 0 0
12-Aug 0 0 50 7 0 0 135 31 19 1 53 4 0
a Age 4 and 5 spring Chinook salmon(age 3 fish). Nat. = Naturally-produced, Capt. = Captive broodstock program, Conv. = Conventional broodstock program.
Figure 8. Arrival timing of age 4 and 5 spring Chinook salmon at the Catherine Creek adult collection facility in 2017 and mean arrival timing from 2002 to 2016.
0102030405060708090
100
Perc
ent o
f the
tota
l
Week
Nat. N=251Con. N=2272002-16 N=8,032

29
The broodstock collection goal for 2017 was 94 adults (34 natural, 60 hatchery) and four jacks (1 natural and 3 hatchery). Our collection goal for females at the trap was 49. The broodstock collected and transported from CCACF consisted of 20 unmarked (40.0% of the natural return trapped) and 53 conventional broodstock adults (39.3% of the hatchery return) along with one natural and four conventional jacks. This was the maximum amount of fish that could be collected under the sliding scale management. There were 42 females collected for broodstock at the trap. Broodstock were collected systematically over the entire return from 12 June to 31 July. The unmarked portion in the broodstock ended up at 27.4%. The actual natural adult return trapped was 50 fish which was 30.5% of the original predicted number and the actual hatchery adult return trapped was 135 fish which was 69.9% of the original predicted number. The hatchery percentage of adult fish released above the weir in 2017 was 73.2%. There were 11 jacks (7 natural, 4 hatchery) released above the weir along with 50 adult males (14.0% natural jacks, 8.0% hatchery jacks). The total percentage (22.0%) was higher than the 10% jack goal above the weir due to the number of natural jacks and the early release of four hatchery jacks. Adults that are not passed above the weir or taken for Catherine Creek broodstock have three possible dispositions: transported to Lookingglass Creek for a fishery/natural spawning, taken as broodstock for the Lookingglass Creek program, or outplanted into Indian Creek for natural spawning. There were no fish available surplus to brood or escapement in 2017. Gender classification of adults at spawning was compared to that at the weir to estimate the accuracy of sex determination. Accuracy was 94.5% (69/73). The fish that were missed were called males at the weir so there were four more females in the broodstock than what was said to be collected. The EN unit was operated for the sixth year at the CCACF in 2017. The unit performed well and did not appear to injure the fish (no mortalities in the recovery area). There was only one prespawn mortality at the hatchery in 2017. Even though we did not meet the broodstock collection goal at the weir, we were still able to make the spawn goal of 44 females due to the low prespawn mortality. The trap was removed from Catherine Creek on 12 August. Surveys conducted by ODFW in 2017 resulted in 50 redds counted above the weir and one redd below the weir. Before the weir was in use, the average percent of the total redds located in the area below where the weir now sits was 4.6% (in years when there were >49 total redds). Based on the percentage of redds below the weir (2.0%) there did not appear to be any weir effect. A total of 24 adult carcasses were recovered above the weir which was 21.4% of the total adults passed (112). Of the 24 carcasses recovered, 21 were punched. The trap efficiency was 92.5%. The population estimate above the weir in 2017 was 127 adult fish (2017 Spawning Ground Survey Results, ODFW, unpublished). The peak flow was about two weeks later in 2017 than the average flows from 2012 to 2016 (Figure 9). The magnitude was also much greater with peaks around 800 cfs compared to the average of around 400 cfs. These higher and later flows probably contributed to the later arrival of adult Chinook salmon at the trap. Hourly water temperatures were taken at the CCACF in 2017 (Figures

30
10 and 11). Water temperatures ranged from 1.1oC on 7 March to 22.1oC on 3 August. Lowest temperature usually occurred around 0700 with the peak temperature around 1600. Maintenance work conducted at the CCACF in 2017 consisted of hydraulic weir component maintenance, rebuild of damaged sections of the weir, and weed abatement.
Figure 9. Weekly maximum flows (recorded daily) near the town of Union, OR in 2017 (data from Oregon Water Resources Department (OWRD) website, site # 13320000). Also shown is the mean weekly maximum flow for 2011 to 2016.
0
100
200
300
400
500
600
700
800
900
Wee
kly
max
imum
flow
(cfs
)
Week
2012 to 2016 avg. weekly max. flow
2017 weekly max flow

31
Figure 10. Daily maximum, minimum, and average water temperatures (recorded hourly) at the Catherine Creek adult collection facility in 2017. The grey line is the average temperature from 2011-2015(2016 data was lost).
Figure 11. Average hourly water temperature at the Catherine Creek adult collection facility in 2017.
02468
101214161820
Tem
pera
ture
(C)
Date
Average Temperature 3/7-8/15/17
0
5
10
15
20
25
30Te
mpe
ratu
re (C
)
Date

32
The UGRACF was moved ten miles downstream after the 2006 trapping season. There are about ten miles of spawning habitat located below the old weir location that were being utilized by returning fish. By moving the trap downstream below this spawning habitat, a more representative sample of the entire population could be trapped. The UGRACF was put into operation on 1 March 2017. The first adult summer steelhead was captured on 26 April. A total of 2 unmarked adult summer steelhead were trapped and released from 26 April to 28 April (Table 9, Figure 12). No adipose-clipped fish were captured. Median arrival at the trap was the week of 29 April. There were no kelts recovered dead on the weir. The first adult spring Chinook salmon was captured at UGRACF on 5 June 2017. A total of 138 (128 adult and 10 jack) spring Chinook salmon, were trapped from 5 June to 21 June (Table 10). The daily maximum water temperature rose above 20.0oC on 20 June prompting removal of the pickets from the trap the next day. The total catch was made up of 16 adults and no jacks of natural origin, 112 adults and 10 jacks from conventional broodstock. A total of nine natural adult spring Chinook salmon were released above the weir to spawn naturally. The return to the trap was about 3 weeks later than the average of 2010 to 2016 (Figure 13). The predicted adult spring Chinook salmon return to the upper Grande Ronde River for 2017 was 1,124 (212 natural + 912 hatchery). There is no sliding scale used for the upper Grande Ronde River. Up to 50% of the natural return and up to 100% of the conventional hatchery return can be collected for broodstock. With the weir pulled from the river early due to high stream temperatures, the actual number of hatchery adults trapped was only 112 which was 12.3% of the predicted number. The number of natural adults trapped was 16 fish which was 7.5% of the predicted number. The broodstock collection goal for 2017 was 170 adults and eight jacks. The broodstock collected and transported from UGRACF consisted of both natural and conventional hatchery fish. Due to the high water temperatures observed and early removal of the weir, broodstock were only collected from 5 June to 21 June 2017. A total of seven adults of natural origin and 111 adults and 10 jacks of conventional hatchery origin were transported to LGH for broodstock. The adult broodstock goal was not fully met in 2017 due to high water temperatures and early removal of the weir. There were an additional 12 adults and five jacks captured at LGH incorporated into the broodstock bringing the total adult brood collected to 130 and 15 jacks. The natural adults collected for broodstock comprised 43.8% of the total adult natural return trapped while 99.1% of the adult hatchery fish trapped were collected for broodstock. The proportion of natural fish in the broodstock was 5.5%. The adult prespawn mortality in 2017 was 1.5% (2), of which none were females. Gender classification of adults at spawning was compared to that at collection to estimate the accuracy of sex determination. Accuracy at collection was 95.8% (113/118). There were 5 less females in the broodstock than what was thought to be collected. This trend follows with last year which was also the opposite of the usual misidentification where collected males turn into females.

33
Table 9. Summer steelhead trap capture data from the Upper Grande Ronde adult collection facility in 2017. Trapping began 1 March and ended 21 June. The trap was pulled on 21 June due to high water temperature.
Week Trap capture Carcassa
First time Reruns Not punched Punched 4-Mar 0 11-Mar 0 18-Mar 0 25-Mar 0 1-Apr 0 8-Apr 0 15-Apr 0 22-Apr 0 29-Apr 2 6-May 0 13-May 0 20-May 0 27-May 0 3-Jun 0 10-Jun 0 17-Jun 0 24-Jun 0
2 0 0 0 a These fish were kelts or pre spawn mortality recovered on or near the weir. Punched fish were previously trapped.
Figure 12. Summer steelhead arrival timing at the Grande Ronde adult collection facility in 2017 and for 2007-16 (rm 153.5) and mean arrival timing for 2002-06 (rm 163).
05
101520253035404550556065707580859095
100
Perc
ent o
f the
tota
l
Week
2017 N=22007-16 N=1972002-06 N=133

34
Table 10. Spring Chinook salmon trap capture, transport, and mortality data for the Grande Ronde River stock at the adult collection facility in 2017. Trapping began 1 March and ended 21 June.
a Age 4 and 5 spring Chinook salmon(age 3 fish). Nat. = Naturally-produced, Capt. = Captive broodstock program, Conv. = Conventional broodstock program.
Figure 13. Arrival timing of age 4 and 5 spring Chinook salmon at the Upper Grande Ronde adult collection facility in 2017 and mean arrival timing for 2010 -16 (weir out early rm 153.5), 2007-09 (rm 153.5) and 2002-06 (rm 163).
Week Trap capturea Broodstock hauled Trap Mort Nat. (jack) Capt. (jack) Conv. (jack) Nat. (jack) Conv. (jack)
6-May 0 0 13-May 0 0 20-May 0 0 27-May 0 0 3-Jun 0 0
10-Jun 1 6 0 0 6 17-Jun 3 22 2 1 22 2 24-Jun 12 84 8 6 83 8 1
16 0 0 0 112 10 7 0 111 10 1
0
10
20
30
40
50
60
70
80
90
100
Perc
ent o
f the
tota
l
Week
Nat. N=16
Con. N=112
2010-16 N=3,956
2007-09 N=341
2002-06 N=1,364

35
Surveys conducted by ODFW in 2017 resulted in 29 redds above the weir and none below the weir. Since there were no redds observed below the weir there did not appear to be any weir effect. There were only four adult carcasses recovered above the weir and only one fish could be positively identified if an opercle punch was present or not (it was not punched). This was 0.0% of the total trapped and passed (9). The population estimate above the weir in 2017 was 300 adult fish (2017 Spawning Ground Survey Results, ODFW, unpublished). The removal of the weir early does not allow for a true trap efficiency estimate because there is no way to distinguish between the fish that escaped past the weir due to holes or fish that passed the weir after it was removed. Based on the ODFW spawning escapement total, it was estimated that we were able to capture 30.4% of the return. There were two peaks in flow in 2017 (Figure 14). The first peak occurred the week of 18 March and a smaller second peak occurred the week of 29 April. The peaks appeared later than the 2012 to 2016 average and at a much greater magnitude. There was a steady and rapid decline in flow after the second peak flow. The later run timing observed this year may have been a direct result of the higher and later peak flows. Hourly water temperatures were taken at the UGRACF from 1 March to 15 August in 2017. The water temperature from 3 March to 15 August ranged from -0.1oC to 28.0oC on 6 March and 24 July, respectively (Figure 15). The hourly temperatures at the adult trap from 3 March to 15 August showed that the lowest water temperature usually occurred at 0700 and the highest water temperature usually occurred at 1500 hours (Figure 16). These peaks and troughs in the temperature profile were slightly different from what we have seen in the past (0800, 1700). Average temperature was the same as the average of the previous five years. The maximum temperature used for trap removal criteria (20.0 oC) was reached on 19 June (21.4 oC). Maintenance and repair activities conducted at the facility in 2017 consisted of installation, removal, and repair of the floating weir panels and trap, and gravel removal from under the weir panels and in front of the trapbox during the instream work window.
Figure 14. Weekly maximum flows (recorded daily) near the town of Perry, OR in 2017 (data from Oregon Water Resources Department (OWRD) website, site #13318960). Also shown is the mean weekly maximum flow for 2011 to 2016.
0500
10001500200025003000350040004500
Wee
kly
max
imum
flow
(cfs
)
Week
2012 to 2016 avg. weekly max. flow2017 weekly max flow
36
Figure 15. Daily maximum, minimum, and average water temperatures (recorded hourly) at the Upper Grande Ronde adult collection facility in 2017. The grey line is the average temperature from 2012-2016.
Figure 16. Average hourly water temperature at the Upper Grande Ronde adult collection facility in 2017.
0
5
10
15
20
25
30Te
mpe
ratu
re (C
)
Date
02468
1012141618202224
Tem
pera
ture
(C)
Date
Average Temperature 3/3-8/15/17

37
Broodstock Activities
Lookingglass Hatchery
A total of 45 females, 36 males and five jacks were spawned from the Catherine Creek stock at LGH in 2017 (Tables 11-13). Five natural and 4 hatchery males were spawned twice. There was only one pre-spawning mortality (one natural female). Median spawning date at LGH occurred on 6 September (Appendix Table 21). In the past (2007 to 2011), we have seen the stock held in the indoor circular tanks exhibit later median spawn dates than stocks held in the outdoor raceways. Beginning in 2012, a point was made to keep the sliding doors to the brood building open at all times and not use the overhead lights. This was done to increase natural lighting so as not to affect the natural photoperiod with artificial lighting. Since then we have seen a similar median spawn date between fish held in the indoor circular and fish held in the outdoor raceway (Appendix Table 25). All 45 females (spawn goal was 44) had BKD ELISA values less than 0.097 OD units. The total number of green eggs collected was 173,691. The goal for the program is to supply 174,910 green eggs to make 150,000 smolts. The reason the green egg goal was not reached was due to lower fecundity than in previous years (Appendix Table 28). A total of 71 females, 60 males, and 10 jacks were spawned from the upper Grande Ronde stock in 2017 (Tables 14-16). There were four hatchery males spawned twice. There were two pre-spawn mortalities (2 hatchery males) and five jacks killed not spawned. Median spawning date at LGH occurred on 30 August (Appendix Table 22). All 71 females had BKD ELISA values less than 0.110 OD units. The total number of green eggs collected was 272,182. The goal for the program is to supply 281,690 green eggs to make 250,000 smolts. The reason the green egg goal was not reached was because we were off on our female estimation at the trap (estimated 77 females taken for broodstock) allowing us to only spawn 71 females not the goal of 73. A total of 45 females, 40 males, and six jacks were spawned for the Lookingglass Creek program in 2017 (Tables 17-19). There were three wild males and four hatchery males spawned twice. There were five pre-spawn mortalities (two female, one male, one jack). Median spawning date occurred on 30 August (Appendix Table 23). All 45 females had BKD ELISA values less than 0.110 OD units. The total number of green eggs collected was 168,568. The goal for the program is to supply 294,381 green eggs to make 250,000 smolts. The number of eggs fell short of the goal due to the low capture of fish at the trap. The low capture of fish at the trap was due in part to the low return to the basin and also the high number of fish that did not swim in to the trap located at the hatchery intake as evidenced by the high number a redds located just downstream. In order to help alleviate this issue in the future, re-initiation at the downstream hatchery ladder (which has not been in use for several years) should be considered to increase the chances of capturing more of the return. In 2017, EN was used for the sixth year during the ripeness sorts. The EN system was not used on the Catherine Creek stock held in the circular tank due to logistical reasons. The mean egg viability in 2017 for stocks EN was used on was 94%, while for Catherine Creek it was 90% (Appendix Table 26).

38
Table 11. Spawning information from Catherine Creek spring Chinook salmon female broodstock at Lookingglass Hatchery in 2017.
Date Natural n=12 Hatchery n=34
Morts Spawned DPS KPS KNS Morts Spawned DPS KPS KNS Till 8/16 16-Aug 0 0 23-Aug 1 1 7 30-Aug 4 10 6-Sep 5 15 11-Sep 1 2 15-Sep Totals 1 11 0 0 0 0 34 0 0 0
Table 12. Spawning information from Catherine Creek spring Chinook salmon male broodstock at Lookingglass Hatchery in 2017.
Date Natural n=8 Hatchery n=19
Morts Spawneda DPS KPS KNS Morts Spawneda DPS KPS KNS Till 8/16 16-Aug 0 0 23-Aug 2 6 30-Aug 4(1) 6(2) 6-Sep 5(2) 10(1) 1 11-Sep 2(2) 1 2 1(1) 1 15-Sep Totals 0 13 1 2 0 0 23 2 0 0
a The number in parentheses indicates the number of recycled fish used in the total. Table 13. Spawning information from Catherine Creek spring Chinook salmon jack broodstock at Lookingglass Hatchery in 2017.
Date Natural n=1 Hatchery n=4
Morts Spawned DPS KPS KNS Morts Spawned DPS KPS KNS Till 8/16 16-Aug 0 0 23-Aug 0 0 30-Aug 0 0 6-Sep 1 4 11-Sep 0 0 15-Sep Totals 0 1 0 0 0 0 4 0 0 0

39
Table 14. Spawning information from Grande Ronde spring Chinook salmon female broodstock at Lookingglass Hatchery in 2017.
Date Natural n=3 Hatchery n=68
Morts Spawned DPS KPS KNS Morts Spawned DPS KPS KNS Till 8/16 16-Aug 0 0 23-Aug 1 10 30-Aug 1 40 6-Sep 1 18 11-Sep 15-Sep Totals 0 3 0 0 0 0 68 0 0 0
Table 15. Spawning information from Grande Ronde spring Chinook salmon male broodstock at Lookingglass Hatchery in 2017.
Date Natural n=6 Hatchery n=52
Morts Spawneda DPS KPS KNS Morts Spawneda DPS KPS KNS Till 8/16 1 16-Aug 0 0 23-Aug 1 10(1) 30-Aug 5 25 6-Sep 4 1 19(3) 3 11-Sep 15-Sep Totals 0 6 0 4 0 2 54 0 3 0
a The number in parentheses indicates the number of recycled fish used in the total. Table 16. Spawning information from Grande Ronde spring Chinook salmon jack broodstock at Lookingglass Hatchery in 2017.
Date Natural n=0 Hatchery n=15
Morts Spawneda DPS KPS KNS Morts Spawned DPS KPS KNS Till 8/16 16-Aug 0 2 23-Aug 0 3 30-Aug 4 6-Sep 6 11-Sep 15-Sep Totals 0 10 0 0 5
40
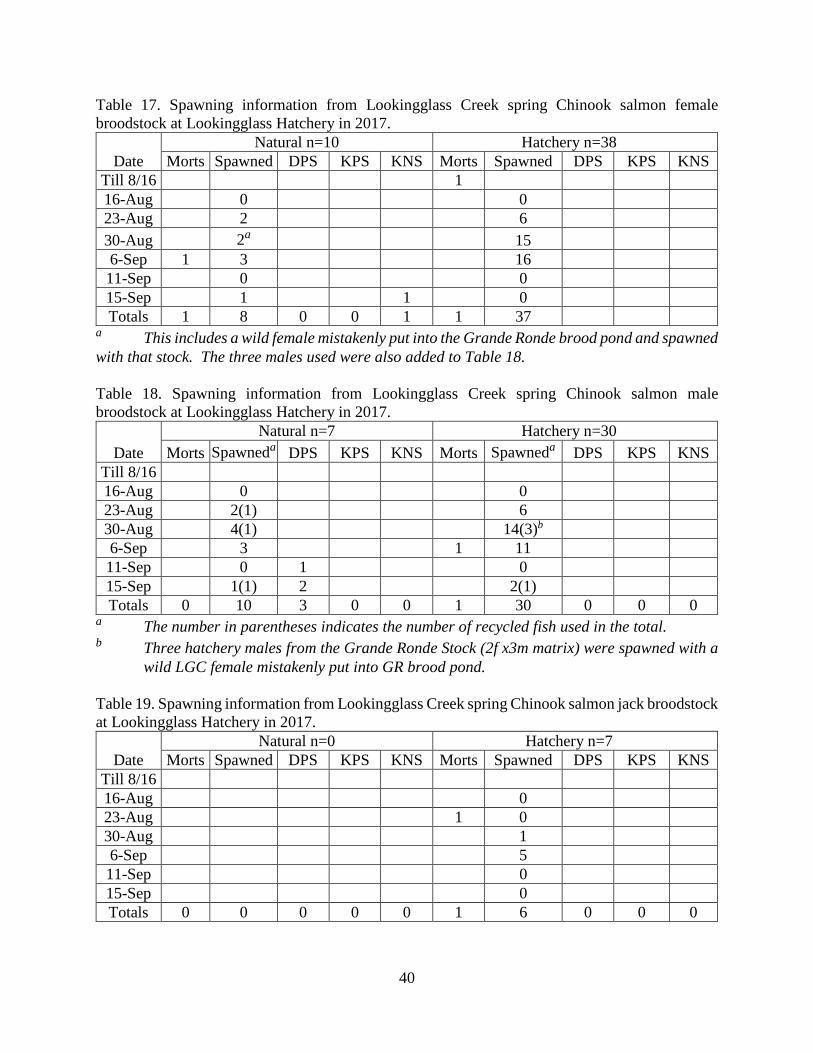
Table 17. Spawning information from Lookingglass Creek spring Chinook salmon female broodstock at Lookingglass Hatchery in 2017.
Date Natural n=10 Hatchery n=38
Morts Spawned DPS KPS KNS Morts Spawned DPS KPS KNS Till 8/16 1 16-Aug 0 0 23-Aug 2 6 30-Aug 2a 15 6-Sep 1 3 16 11-Sep 0 0 15-Sep 1 1 0 Totals 1 8 0 0 1 1 37
a This includes a wild female mistakenly put into the Grande Ronde brood pond and spawned with that stock. The three males used were also added to Table 18. Table 18. Spawning information from Lookingglass Creek spring Chinook salmon male broodstock at Lookingglass Hatchery in 2017.
Date Natural n=7 Hatchery n=30
Morts Spawneda DPS KPS KNS Morts Spawneda DPS KPS KNS Till 8/16 16-Aug 0 0 23-Aug 2(1) 6 30-Aug 4(1) 14(3)b 6-Sep 3 1 11 11-Sep 0 1 0 15-Sep 1(1) 2 2(1) Totals 0 10 3 0 0 1 30 0 0 0
a The number in parentheses indicates the number of recycled fish used in the total. b Three hatchery males from the Grande Ronde Stock (2f x3m matrix) were spawned with a
wild LGC female mistakenly put into GR brood pond. Table 19. Spawning information from Lookingglass Creek spring Chinook salmon jack broodstock at Lookingglass Hatchery in 2017.
Date Natural n=0 Hatchery n=7
Morts Spawned DPS KPS KNS Morts Spawned DPS KPS KNS Till 8/16 16-Aug 0 23-Aug 1 0 30-Aug 1 6-Sep 5 11-Sep 0 15-Sep 0 Totals 0 0 0 0 0 1 6 0 0 0
41
LITERATURE CITED
GRSCHMP. 2002. Grande Ronde Spring Chinook Hatchery Management Plan. Co-manager
signed agreement dealing with management of spring Chinook in the Grande Ronde Basin. Signed by CTUIR, NPT, LSRCP, and ODFW in 2002.
LSRCP AOP. 2017. Lower Snake River Compensation Plan Annual Operations Plan. McLean, M. L., R. Seeger, and L. Hewitt. 2004. Grande Ronde Satellite Facility O&M Annual
Report for 1 January-31 December 2004 to Bonneville Power Administration. BPA Project 9800703. CTUIR Project 410. Pendleton, Oregon.
McLean, M. L., R. Seeger, and L. Hewitt. 2005. Grande Ronde Satellite Facility O&M Annual
Report for 1 January-31 December 2005 to Bonneville Power Administration. BPA Project 9800703. CTUIR Project 410. Pendleton, Oregon.
Monzyk, F. M., G. Vonderohe, T. L. Hoffnagle, R. W. Carmichael, D.L. Eddy and P.J. Keniry.
2006. Lower Snake River Compensation Plan: Oregon Spring Chinook Salmon Evaluation Studies. 1999 Annual Progress Report, Oregon Department of Fish and Wildlife, Salem.
Nehlsen, W., J. E. Williams, and J. A. Lichatowich. 1991. Pacific salmon at a crossroads: stocks
at risk from California, Oregon, Idaho and Washington. Fisheries 16(2):4-20.

42
APPENDIX TABLES

43
Appendix Table 1. Sliding Scale Management Plan for the Catherine Creek and Upper Grande Ronde Spring Chinook Artificial Propagation Program.
Estimated total adult escapement to the Catherine Creek mouth (hatchery plus natural) a
Ratio of hatchery to natural adults at the mouth
Maximum % of natural adults to retain for broodstock
% of conventional hatchery adults to retain for broodstock b
% of adults released above the weir that can be of hatchery origin
Minimum % of broodstock of natural origin
% Strays allowed above the weir c
UGR Any Up to 50 Up to 100 Up to 100 d ≤5 CC
<250 Any 40 40 d d ≤5 251-500 Any 20 20 ≤70 ≥20 ≤5
>500 Any ≤20 d ≤50 ≥30 ≤5 a Pre-season estimate of total escapement b Conventional hatchery adults only, all captive brood adults released to spawn naturally or outplanted c For hatchery adults originating from different gene conservation groups (Rapid River stock or strays from outside the Grande Ronde basin) d Not decision factor at this level of escapement, percentage determined by other criteria e Not to exceed 130,000 smolt production initially

44
Appendix Table 2. Group, number, size, raceways, mortality, feed fed, and numbers released from the Catherine Creek acclimation facility 2000 to 2017 release years.
Facility/ rel. yr
Groupa
Number received
Size fish/lb.
Raceways used
Density lbs/ft3
Total Mortality (%)
Feed fed
Number released
CC 00 Single cap 38,009 23.6 4 0.20 0.10 474 37,980 CC 01 Single cap 137,588 19.6 4 0.85 0.70 1,296 136,902 CC 02 Single cap 180,912 17.4 4 1.26 0.30 1,968 180,343 CC 03 Early cap 105,352 12.8 4 1.00 0.04 345 105,313 CC 03 Late con 24,404 12.6 2 0.47 0.05 73 24,392 CC 04 Early cap 92,475 23.1 4 0.49 0.07 179 92,413 CC 04 Late con 70,539 23.4 4 0.37 0.03 115 70,521 CC 05 Early con 61,743 23.6 2 0.63 0.03 100 61,717 CC 05 Early cap 69,005 24.4 2 0.70 0.23 109 68,827 CC 05 Late con 59,100 21.8 2 0.66 0.11 60 59,036 CC 06 Single con 23,227 33.7 1 0.33 0.05 65 23,216 CC 06 Single cap 45,667 26.1 2 0.42 0.14 132 45,604 CC 07 Single con 49,709 27.4 3 0.29 0.03 202 49,696 CC 07 Single cap 21,584 24.9 1 0.42 0.06 86 21,572 CC 08 Single con 116,967 19.9 4 0.71 0.07 549 116,882 CC 09 Single con 93,240 27.4 3 0.58 0.07 229 93,176 CC 09 Early con 25,436 22.7 1 0.48 0.06 18 25,422 CC 09 Late con 20,254 20.6 1 0.44 0.04 35 20,245 CC 10 Single con 110,445 20.8 3 0.79 0.18 248 110,242 CC 10 Single cap 34,215 21.0 1 0.73 0.32 83 34,111 CC 11 Single con 58,887 26.6 2 0.54 0.25 300 58,737 CC 11 Single cap 50,194 25.6 2 0.41 0.02 126 48,343 CC 11 Single cap 50,246 24.9 2 0.50 0.02 173 48,395 CC 12 Single con 106,939 21.8 4 0.55 0.05 278 106,882 CC 13 Single con 134,591 22.0 4 0.69 0.05 491.5 134,519 CC 14 Single con 138,526 22.3 4 0.70 0.11 474.5 138,369 CC 15 Single con 146,394 20.8 4 0.71 0.06 619.5 146,310 CC 16 Single con 165,822 22.7 4 0.81 0.05 422.5 165,739 CC 17 Single con 155,534 24.8 4 0.65 0.07 490.0 155,428
a Single= one acclimation period. Early=1st of 2 groups. Late= 2nd of 2 groups.

45
Appendix Table 3. Group, number, size, raceways, mortality, feed fed, and numbers released from the Upper Grande Ronde acclimation facility 2000 to 2017 release years.
Facility/ rel. yr
Groupa
Number received
Size fish/lb.
Raceways used
Density lbs/ft3
Total Mortality (%)
Feed fed
Number released
GR 00 Single cap 1,512 19.4 1 0.04 0.30 1 1,508 GR 01 Single cap 2,570 13.9 1 0.09 1.01 8 2,544 GR 02 Single cap 201,958 18.4 4 1.33 25.01 568 151,444 GR 03 Early cap 110,169 14.2 4 1.14 0.05 24 110,114 GR 03 Late con 26,946 13.7 1 0.90 0.09 50 26,923 GR 03 Late cap 100,685 13.6 3 1.10 0.16 150 100,523 GR 04 Early cap 77,418 20.3 4 0.48 0.27 58 77,204 GR 04 Late con 70,098 22.4 3 0.50 0.01 79 70,088 GR 05 Single con 105,418 21.0 4 0.61 0.05 10 105,369 GR 06 Single con 18,986 29.3 2 0.16 0.05 3 18,977 GR 07 Early cap 20,620 23.2 2 0.22 0.00 9 20,620 GR 07 Late con 118,840 21.7 4 0.67 0.03 120 118,803 GR 08 Early con 127,552 21.8 4 0.71 0.05 0 127,491 GR 08 Late con 132,501 20.9 4 0.77 0.05 38 132,441 GR 09 Single con 94,203 22.7 3 0.72 0.06 28.2 94,148 GR 09 Early cap 28,080 22.0 1 0.63 0.04 0 28,068 GR 09 Late cap 24,340 20.2 1 0.66 0.03 7.5 24,332 GR 10 Early cap 125,951 28.3 4 0.50 0.07 0 125,868 GR 10 Late con 41,873 23.0 2 0.41 0.13 63 41,819 GR 10 Late cap 64,721 21.4 2 0.68 0.09 63 64,663 GR 11 Early cap 53,166 24.0 2 0.54 0.10 23 53,114 GR 11 Early con 55,160 27.7 2 0.49 0.51 23 54,880 GR 11 Late con 134,882 17.7 4 0.81 0.37 242 134,388 GR 12 Early con 73,402 23.0 2 0.72 0.16 86 73,286 GR 12 Single con 73,402 23.0 2 0.72 0.13 38 73,303 GR 12 Late con 72,211 20.5 2 0.79 0.03 47 72,192 GR 13 Early cap 155,321 24.0 4 0.72 0.04 131.0 155,264 GR 13 Late con 135,370 21.5 4 0.70 0.05 161.5 135,308 GR 14 Early con 121,633 22.8 4 0.60 0.02 67.8 121,612 GR 14 Late con 119,582 21.5 4 0.62 0.02 168.5 119,557 GR 15 Early con 118,445 22.0 4 0.60 0.02 270.7 118,357 GR 15 Late con 106,100 20.8 4 0.60 0.02 234.1 106,086 GR 16 Early con 120,117 26.0 4 0.52 0.03 149.8 120,077 GR 16 Late con 120,287 23.3 4 0.58 0.03 82.2 120,255 GR 17 Early con 129,255 28.9 4 0.50 0.03 297.3 129,219 GR 17 Late con 126,198 26.6 4 0.53 0.11 206.5 126,057
a Single= one acclimation period. Early=1st of 2 groups. Late= 2nd of 2 groups.

46
Appendix Table 4. Group, acclimation dates, temperature, dissolved oxygen, and estimated volitional migration of fish acclimated at the Catherine Creek facility 2000 to 2017 release years.
Facility/ rel. yr
Groupa
Acclimation
period
Volitional
began
Temp.oC DO mg/l Volitional
Min.
Max.
Min.
Max.
migration
% CC 00 Single cap 2/28-4/18 4/2 0.2 9.3 8.2 14.4 6,842 18.0 CC 01 Single cap 3/8-4/16 4/2 0.5 9.6 8.9 13.9 b CC 02 Single cap 2/26-4/15 4/2 0.0 10.5 7.0 13.3 68,948 38.1 CC 03 Early cap 3/7-3/23 3/13 1.1 6.2 10.3 12.2 25,092 23.8 CC 03 Late con 3/24-4/14 3/31 0.7 8.2 9.7 12.6 16,218 66.4 CC 04 Early cap 3/8-3/22 3/15 1.8 7.9 10.5 11.7 8,785 9.5 CC 04 Late con 3/24-4/12 3/30 2.1 8.2 10.5 12.4 49,147 69.2 CC 05 Early mix 3/7-3/27 3/14 0.1 5.8 9.6 15.4 29,402 22.5 CC 05 Late con 3/28-4/7 4/4 0.6 8.7 8.9 12.7 None CC 06 Single mix 3/13-4/12 3/27 0.2 7.6 9.0 11.4 28,311 41.1 CC 07 Single mix 3/12-4/11 3/26 0.3 8.8 9.6 12.3 23,761 33.3 CC 08 Single con 3/10-4/14 3/24 0.0 9.1 9.0 12.4 43,128 35.2 CC 09 Single con 3/9 – 4/13 3/23 0.0 7.5 8.9 11.8 48,442 52.0 CC 09 Early con 3/9 – 3/23 3/16 0.0 6.7 10.0 11.8 18,059 71.0 CC 09 Late con 3/24 – 4/13 4/1 0.6 7.5 9.9 11.3 8,613 42.5 CC 10 Single mix 3/15 – 4/12 3/29 0.2 7.6 8.5 12.6 21,357 14.8 CC 11 Single con 3/14 – 4/14 3/30 1.2 6.9 9.7 11.5 22,027 37.4 CC 11 Early cap 3/14 – 3/29 3/21 1.2 5.9 9.8 11.5 3,383 7.0 CC 11 Late cap 3/30 – 4/14 4/5 1.5 6.9 10.0 10.9 12,767 26.4 CC 12 Single con 3/20 – 4/14 3/22 0.5 8.1 11.0 13.6 53,377 49.9 CC 13 Single con 3/19 – 4/15 3/21 NA NA 10.6 12.3 63,500 47.2 CC 14 Single con 3/19 – 4/15 3/21 0.1 7.8 10.4 15.0 72,967 52.7 CC 15 Single con 3/17 – 4/15 3/19 1.2 8.0 8.4 13.4 NA CC 16 1 Conv. 3/21 – 4/14 3/23 1.1 6.8 NA NA NA CC 17 1 Conv. 3/15 – 4/14 3/20 1.8 7.3 10.0 12.7 NA
a Single= one acclimation period. Early=1st of 2 groups. Late= 2nd of 2 groups. b Problems with PIT tag readers made it impossible to estimate accurately the number of PIT
tagged fish leaving volitionally or during force out from the Catherine Creek facility. Actual PIT tags detected during the volitional release period were 290; tags detected during the force out were 6,862.

47
Appendix Table 5. Group, acclimation dates, temperature, dissolved oxygen, and estimated volitional migration of fish acclimated at the Upper Grande Ronde facility 2000 to 2017 release years.
Facility/ rel. yr
Groupa
Acclimation
period
Volitional
began
Temp.oC DO mg/l Volitional
Min.
Max.
Min.
Max.
migration
% GR 00 Single cap 2/28-3/14 None -0.5 2.7 - - None GR 01 Single cap 2/27-3/27 None -0.7 3.8 8.7 12.1 None GR 02 Single cap 2/27-4/15 4/2 0.0 3.5 9.2 12.7 68,200 44.9 GR 03 Early cap 3/10-3/23 3/17 0.0 4.4 10.0 11.9 31,900 30.0 GR 03 Late mix 3/24-4/14 3/30 0.0 6.6 9.0 11.9 37,900 29.7 GR 04 Early cap 3/9-3/22 3/15 -0.1 5.9 11.3 14.7 12,889 16.3 GR 04 Late con 3/25-4/12 3/31 -0.1 7.1 10.6 12.3 34,085 48.6 GR 05 Single con 3/8-3/14 None -0.1 3.4 10.3 11.9 None GR 06 Single con 3/13-4/12 3/27 -0.7 4.5 10.3 12.3 10,461 55.1 GR 07 Early cap 3/12-3/25 3/19 -0.1 5.4 8.7 12.7 2,932 11.6 GR 07 Late con 3/26-4/11 4/2 -0.1 6.9 8.5 11.9 28,718 24.2 GR 08 Early con 3/11-3/24 3/17 -5.8 2.6 na na 29,065 22.8 GR 08 Late con 3/25-4/14 4/7 -5.9 4.3 na na 10,880 8.2 GR 09 Single con 3/16 – 4/13 3/23 -0.1 4.0 11.3 13.5 54,859 58.3 GR 09 Early cap 3/16 – 3/23 3/18 -0.1 1.8 11.3 13.5 3,013 10.7 GR 09 Late cap 3/24 – 4/13 4/1 -0.1 4.0 11.7 13.5 10,264 42.2 GR 10 Early cap 3/8 – 3/22 3/15 -5.5 3.5 9.4 14.7 20,000 15.9 GR 10 Late mix 3/23 – 4/13 3/30 -3.6 5.6 10.0 12.5 16,000 15.0 GR 11 Early cap 3/15 – 3/30 3/22 -0.1 3.2 10.8 13.3 2,069 3.8 GR 11 Early con 3/15 – 3/30 3/22 -0.1 3.2 10.8 13.3 4,048 7.6 GR 11 Late con 3/31 – 4/14 4/5 -0.1 4.0 10.0 12.0 15,413 11.4 GR 12 Early con 3/19 – 4/2 3/21 0.0 5.0 7.9 9.2 17,100 23.3 GR 12 Single con 3/19 – 4/14 3/22 0.0 6.2 7.9 9.3 5,800 7.9 GR 12 Late con 4/4 – 4/14 4/9 -0.1 6.2 8.1 9.3 9,545 13.2 GR 13 Early cap 3/18 – 4/1 3/20 -5.5 0.3 10.6 12.9 41,719 26.9 GR 13 Late con 4/4 – 4/14 4/6 -0.1 5.5 10.4 12.7 41,857 30.9 GR 14 Early con 3/20 – 4/3 3/22 -0.1 4.5 11.1 13.6 NA GR 14 Late con 4/4 – 4/15 4/6 0.2 6.7 10.6 12.5 NA GR 15 Early con 3/16 – 3/30 3/18 0.2 7.0 9.7 11.8 NA GR 15 Late con 3/31 – 4/15 4/1 -0.1 6.8 9.7 12.2 NA GR 16 1 Conv. 3/18 – 4/5 3/20 -0.1 6.9 10.8 13.6 NA GR 16 2 Conv. 4/6 – 4/18 4/8 0.9 7.5 9.8 12.1 NA GR 17 1 Conv. 3/14 – 4/4 3/17 -0.1 4.7 10.9 13.7 NA GR 17 2 Conv. 4/5 – 4/14 4/7 -0.1 6.1 10.1 13.4 NA
a Single= one acclimation period. Early=1st of 2 groups. Late= 2nd of 2 groups.
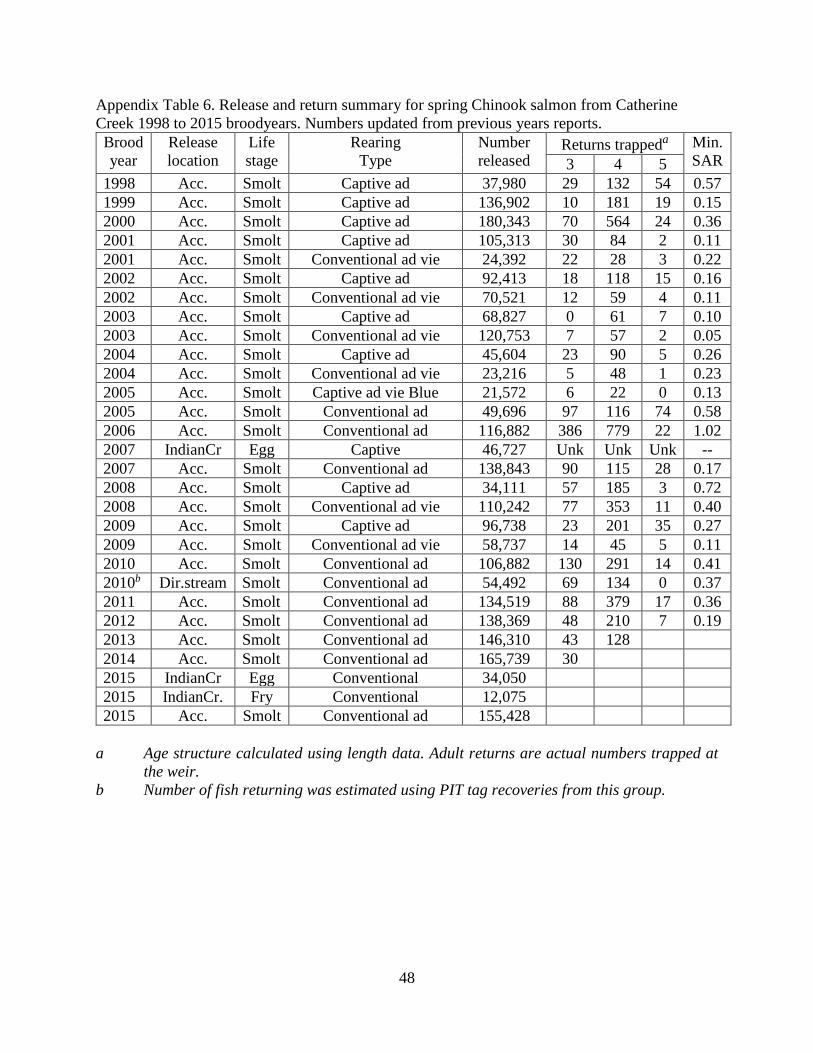
48
Appendix Table 6. Release and return summary for spring Chinook salmon from Catherine Creek 1998 to 2015 broodyears. Numbers updated from previous years reports. Brood year
Release location
Life stage
Rearing Type
Number released
Returns trappeda Min. SAR 3 4 5
1998 Acc. Smolt Captive ad 37,980 29 132 54 0.57 1999 Acc. Smolt Captive ad 136,902 10 181 19 0.15 2000 Acc. Smolt Captive ad 180,343 70 564 24 0.36 2001 Acc. Smolt Captive ad 105,313 30 84 2 0.11 2001 Acc. Smolt Conventional ad vie 24,392 22 28 3 0.22 2002 Acc. Smolt Captive ad 92,413 18 118 15 0.16 2002 Acc. Smolt Conventional ad vie 70,521 12 59 4 0.11 2003 Acc. Smolt Captive ad 68,827 0 61 7 0.10 2003 Acc. Smolt Conventional ad vie 120,753 7 57 2 0.05 2004 Acc. Smolt Captive ad 45,604 23 90 5 0.26 2004 Acc. Smolt Conventional ad vie 23,216 5 48 1 0.23 2005 Acc. Smolt Captive ad vie Blue 21,572 6 22 0 0.13 2005 Acc. Smolt Conventional ad 49,696 97 116 74 0.58 2006 Acc. Smolt Conventional ad 116,882 386 779 22 1.02 2007 IndianCr Egg Captive 46,727 Unk Unk Unk -- 2007 Acc. Smolt Conventional ad 138,843 90 115 28 0.17 2008 Acc. Smolt Captive ad 34,111 57 185 3 0.72 2008 Acc. Smolt Conventional ad vie 110,242 77 353 11 0.40 2009 Acc. Smolt Captive ad 96,738 23 201 35 0.27 2009 Acc. Smolt Conventional ad vie 58,737 14 45 5 0.11 2010 Acc. Smolt Conventional ad 106,882 130 291 14 0.41 2010b Dir.stream Smolt Conventional ad 54,492 69 134 0 0.37 2011 Acc. Smolt Conventional ad 134,519 88 379 17 0.36 2012 Acc. Smolt Conventional ad 138,369 48 210 7 0.19 2013 Acc. Smolt Conventional ad 146,310 43 128 2014 Acc. Smolt Conventional ad 165,739 30 2015 IndianCr Egg Conventional 34,050 2015 IndianCr. Fry Conventional 12,075 2015 Acc. Smolt Conventional ad 155,428
a Age structure calculated using length data. Adult returns are actual numbers trapped at
the weir. b Number of fish returning was estimated using PIT tag recoveries from this group.

49
Appendix Table 7. Release and return summary for spring Chinook salmon from the upper Grande Ronde River 1998 to 2015 broodyears. Numbers updated from previous years reports. Brood year
Release location
Life stage
Rearing Type
Number released
Returns trappeda Min. SAR 3 4 5
1998 Acc. Smolt Captive 1,508 0 3 0 0.20 1999 Acc. Smolt Captive 2,544 0 6 4 0.39 2000 Acc. Smolt Captive 151,444 35 321 15 0.24 2000 Dir. stream Parr Captive 76,941 2 51 2 0.07 2001 Acc. Smolt Captive 210,637 48 180 7 0.11 2001 Acc. Smolt Conventional vie or 26,923 9 60 0 0.26 2001 Dir. stream Parr Captive ad 32,800 0 0 0 0.00 2002 Acc. Smolt Captive ad 77,204 0 1 0 0.00 2002 Acc. Smolt Conventional cwt 70,088 6 140 8 0.22 2003 Acc. Smolt Captive ad 1,022 0 0 0 0.00 2003 Acc. Smolt Conventional cwt 104,347 2 27 1 0.03 2004 Acc. Smolt Captive ad 76 0 0 1 1.32 2004 Acc. Smolt Conventional cwt 18,901 5 8 20 0.17 2005 Acc. Smolt Captive ad 20,620 5 40 16 0.30 2005 Acc. Smolt Conventional cwt 118,803 98 258 29 0.32 2006 Acc. Smolt Conventional 259,932 301 1,114 13 0.55 2006 MeadowCr Egg Captive 1,263 Unk Unk Unk -- 2007 Acc. Smolt Captive ad 52,404 12 47 7 0.13 2007 Acc. Smolt Conventional cwt 94,148 15 61 12 0.09 2008 Acc. Smolt Captive ad 190,531 45 355 8 0.21 2008 Acc. Smolt Conventional cwt 41,819 43 113 5 0.38 2009 MeadowCr Egg Captive 143,349 Unk Unk Unk 2009 Acc. Smolt Captive ad 53,114 3 10 7 0.04 2009 Acc. Smolt Conventional cwt 189,268 17 57 5 0.04 2010 MeadowCr Egg Captive 251,107 Unk Unk Unk 2010 Acc. Smolt Conventional 218,781 34 259 25 0.15 2010 Dir.stream Smolt Conventional 66,956 8 86 4 0.15 2011 MeadowCr Egg Captive 96,885 Unk Unk Unk 2011 SheepCr Egg Captive 103,365 Unk Unk Unk 2011 Acc. Smolt Captive 155,264 10 288 4 0.19 2011 Acc. Smolt Conventional 135,308 11 447 18 0.35 2012 MeadowCr Egg Captive 34,404 Unk Unk Unk 2012 SheepCr Egg Captive 160,997 Unk Unk Unk 2012 Acc. Smolt Conventional cwt 118,150 6 114 1 0.10 2012 Acc. Smolt Conventional ad 123,019 8 90 6 0.08
a Age structure calculated using length data. Adult returns are actual numbers trapped at the weir. When life stage release from the same broodyear could not be determined at the trap (similar marks), CWT or PIT tag data was used to divide the returns by group. The weir was pulled from the stream early beginning in 2010 due to high stream temperature. A portion of the later returning fish is unknown.

50
Appendix Table 7 (cont.). Release and return summary for spring Chinook salmon from the upper Grande Ronde River 1998 to 2015 broodyears. Numbers updated from previous years reports. Brood year
Release location
Life stage
Rearing Type
Number released
Returns trappeda Min. SAR 3 4 5
2013 MeadowCr Egg Captive 30,863 Unk Unk 2013 SheepCr Egg Captive 4,095 Unk Unk 2013 Acc. Smolt Conventional cwt 117,438 1 53 2013 Acc. Smolt Conventional ad 107,005 1 52 2014 Acc. Smolt Conventional cwt 119,158 2 2014 Acc. Smolt Conventional ad 121,174 8 2015 MeadowCr Egg Conventional 34,936 2015 SheepCr. Fry Conventional 23,362 2015 Acc. Smolt Conventional cwt 128,279 2015 Acc. Smolt Conventional ad 126,997
a Age structure calculated using length data. Adult returns are actual numbers trapped at the weir. When life stage release from the same broodyear could not be determined at the trap (similar marks), CWT or PIT tag data was used to divide the returns by group. The weir was pulled from the stream early beginning in 2010 due to high stream temperature. A portion of the later returning fish is unknown.
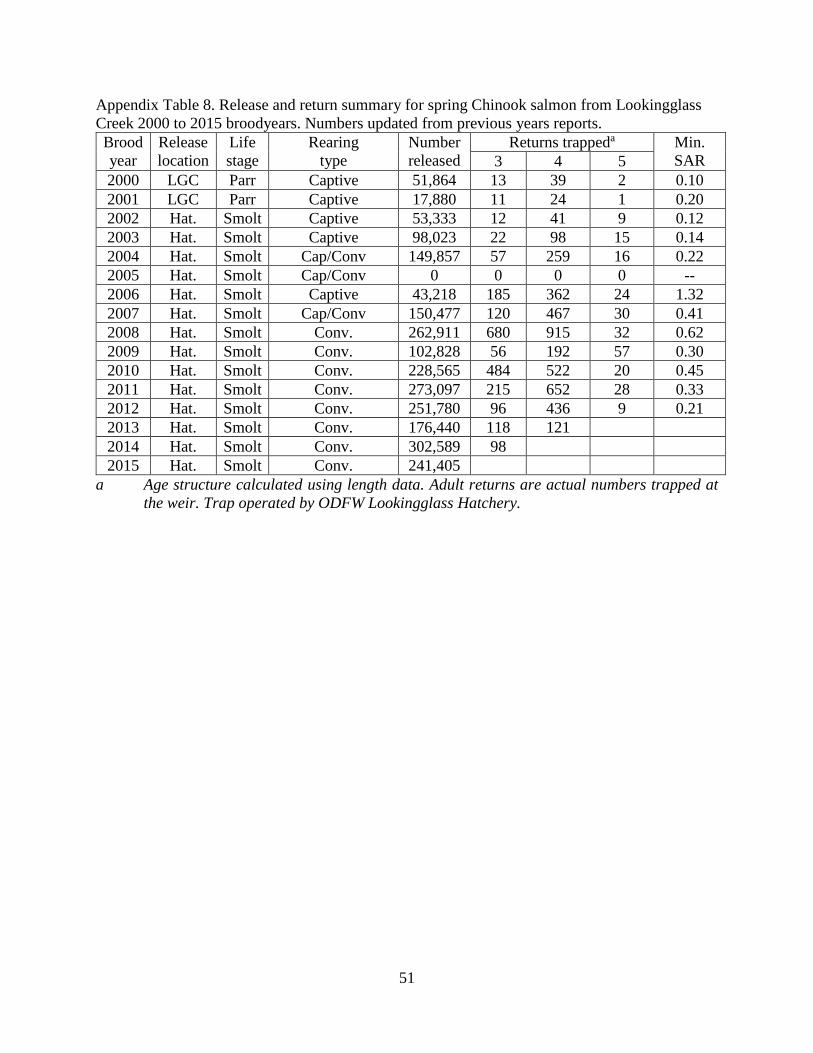
51
Appendix Table 8. Release and return summary for spring Chinook salmon from Lookingglass Creek 2000 to 2015 broodyears. Numbers updated from previous years reports. Brood year
Release location
Life stage
Rearing type
Number released
Returns trappeda Min. SAR 3 4 5
2000 LGC Parr Captive 51,864 13 39 2 0.10 2001 LGC Parr Captive 17,880 11 24 1 0.20 2002 Hat. Smolt Captive 53,333 12 41 9 0.12 2003 Hat. Smolt Captive 98,023 22 98 15 0.14 2004 Hat. Smolt Cap/Conv 149,857 57 259 16 0.22 2005 Hat. Smolt Cap/Conv 0 0 0 0 -- 2006 Hat. Smolt Captive 43,218 185 362 24 1.32 2007 Hat. Smolt Cap/Conv 150,477 120 467 30 0.41 2008 Hat. Smolt Conv. 262,911 680 915 32 0.62 2009 Hat. Smolt Conv. 102,828 56 192 57 0.30 2010 Hat. Smolt Conv. 228,565 484 522 20 0.45 2011 Hat. Smolt Conv. 273,097 215 652 28 0.33 2012 Hat. Smolt Conv. 251,780 96 436 9 0.21 2013 Hat. Smolt Conv. 176,440 118 121 2014 Hat. Smolt Conv. 302,589 98 2015 Hat. Smolt Conv. 241,405
a Age structure calculated using length data. Adult returns are actual numbers trapped at the weir. Trap operated by ODFW Lookingglass Hatchery.

52
Appendix Table 9. Adult trapping, broodstock and redd counts for spring Chinook salmon from Catherine Creek 1997 to 2017 (does not include jack salmon).
Year
Adults captured Mort Passed above
Est. above
Trap eff
Redds Adult broodstock Nat Cap Con N H Above Below Nat Cap Con
1997 2 -- -- 0 2 -- -- 40 6 0 0 0 1998 28 -- -- 0 28 105 26.7 34 0 0 0 0 1999 16 -- -- 0 16 87 18.4 38 2 0 0 0 2000 22 -- -- 1 21 40 53.7 26 8 0 0 0 2001 80 1 -- 0 57 352 21.1 131 2 22 0 0 2002 161 132 -- 0 1 257 427 63.2 156 2 34 0 0 2003 250 235 -- 2 0 432 449 96.6 165 2 50 0 0 2004 84 584 -- 2 3 192 203 95.1 94 2 17 0 0 2005 56 110 28 0 2 139 145 96.6 72 2 10 0 20 2006 103 121 62 0 1 221 263 87.2 115 2 20 0 43 2007 72 81 61 0 0 142 181 84.1 57 2 28 0 37 2008 90 97 50 0 0 186 197 95.6 100 1 18 0 33 2009 116 27 118 0 0 175 195 92.8 87 2 31 0 52 2010 438 0 855 1 1 813 904 90.7 373 11 30 0 42 2011 89 0 137 0 0 103 1,238 14.0 444 0 37 0 45 2012 362 185 381 0 3 630 688 92.5 238 1 48 0 38 2013 245 204 56 1 1 409 418 98.3 110 0 54 0 41 2014 546 41 424 0 0 909 986 92.9 363 18 57 5 40 2015 288 -- 392 3 4 465 471 99.0 215 7 51 0 55 2016 251 -- 227 1 1 384 384 100 142 4 33 0 59 2017 50 -- 135 0 0 112 127 92.5 50 1 20 0 53

53
Appendix Table 10. Adult trapping, broodstock and redd counts for spring Chinook salmon from the upper Grande Ronde River 1997 to 2017 (does not include jack salmon).
Year
Adults captured Mort Passed above
Est. above
Trap eff
Redds Adult broodstock +LGH Nat Cap Con N H Above Below Nat Cap Con Stray
1997 9 -- -- 0 0 9 -- -- 19 6 0 0 0 1998 33 -- -- 0 0 29 102 31.1 31 2 4 0 0 1999 1 -- -- 0 0 1 -- 0 0 0 0 0 2000 17 -- -- 2 0 15 23 68.0 8 12 0 0 0 2001 50 -- -- 0 0 29 29 100 7 8 21 0 0 2002 101 3 -- 2 0 54 54 100 16 2 48 0 0 2003 145 6 -- 1 0 78 92 91.5 19 19 72 0 0 2004 30 376 -- 0 4 387 425 91.4 134 51 15 0 0 2005 14 197 60 0 1 204 204 100 52 38 7 0 59 2 2006 49 8 140 0 0 48 48 100 18 4 26 0 123 14 2007 33 0 35 0 1 16 16 100 1 0 17 0 34 10 2008 17 0 9 0 0 8 184 12.9 37 5 9 0 9 7 2009 58 41 278 0 0 214 321 77.9 50 2 17 0 146 16 2010 63 16 1,143 0 4 1,048 2,273 49.9 316 16 29 0 141 0 2011 16 47 75 0 4 51 966 13.0 221 4 9 0 73 24 2012 168 362 125 0 1 494 707 75.5 95 2 79 0 81 3 2013 47 18 62 0 0 44 845 13.7 41 0 24 0 59 32 2014 242 8 349 1 2 460 1,648 33.5 255 6 55 0 81 19 2015 201 288 476 0 1 786 1,803 48.7 123 0 49 0 129 13 2016 67 4 222 0 0 142 1,279 20.5 73 0 25 0 126 37 2017 16 0 112 0 1 9 300 30.4 29 0 7 0 111 12

54
Appendix Table 11. Adult trapping, broodstock and redd counts for spring Chinook salmon from Lookingglass Creek 2004 to 2017 (does not include jack salmon)(Trap operated by ODFW Lookingglass Hatchery).
Year
Adults captured Mort Passed above
Est. above
Trap eff
Redds Adult broodstock Nat Hat Stray N H Above Below Nat Hat
2004 71 43 0 1 1 100 103 98.8 49 49 0 136 2005 24 26 4 0 0 41 43 95.3 29 10 0 0 2006 10 42 16 0 0 41 55 74.5 28 28 0 0 2007 13 107 18 0 0 66 66 100 32 22 0 41 2008 49 276 9 0 0 179 179 100 104 39 11 135 2009 78 38 17 0 0 83 83 100 67 30 27 14 2010 126 389 46 0 0 348 348 100 170 89 58 108 2011 131 492 24 0 0 440 444 99.4 212 129 58 123 2012 142 945 24 0 0 926 970 96.1 314 133 47 112 2013 59 225 31 0 0 160 160 100 60 47 28 97 2014 183 580 20 0 0 599 642 94.7 205 105 56 107 2015 238 670 13 0 1 735 744 99.0 185 91 54 118 2016 344 464 37 0 2 635 570 100 207 144 53 118 2017 28 130 13 0 0 75 69 100 32 68 15 69

55
Appendix Table 12. Daily summer steelhead trapping data from the Catherine Creek adult collection facility in 2017.
Date Total
Trapped Sacrificed/mortality Recaptures at trap Hat. Nat. Hat. Nat. Hat. Nat.
10-Mar 3 0 3 0 0 0 0 14-Mar 8 0 8 0 0 0 0 16-Mar 7 0 7 0 0 0 0 17-Mar 5 0 5 0 0 0 0 20-Mar 17 0 17 0 0 0 1 21-Mar 4 0 4 0 0 0 0 23-Mar 1 0 1 0 0 0 1 27-Mar 6 0 6 0 0 0 0 28-Mar 2 0 2 0 0 0 0 30-Mar 3 0 3 0 0 0 0 MAR 56 0 56 0 0 0 2 3-Apr 4 0 4 0 0 0 2 4-Apr 2 0 2 0 0 0 0 6-Apr 7 0 7 0 0 0 2 7-Apr 1 0 1 0 0 0 1
10-Apr 3 0 3 0 0 0 0 11-Apr 1 0 1 0 0 0 0 13-Apr 2 0 2 0 0 0 1 17-Apr 5 0 5 0 0 0 0 19-Apr 6 0 6 0 0 0 0 21-Apr 2 0 2 0 0 0 0 24-Apr 2 0 2 0 0 0 2 25-Apr 1 0 1 0 0 0 0 27-Apr 3 0 3 0 0 0 1 APR 39 0 39 0 0 0 9
1-May 0 0 0 0 0 0 1 3-May 1 0 1 0 0 0 1 4-May 1 0 1 0 0 0 0 5-May 5 0 5 0 0 0 1
11-May 0 0 0 0 0 0 1 17-May 1 0 1 0 0 0 0 22-May 1 0 1 0 0 0 0 MAY 9 0 9 0 0 0 4 Total 104 0 104 0 0 0 15

56
Appendix Table 13. Daily spring Chinook salmon trapping data from the Catherine Creek adult collection facility in 2017.
Date Total
Trapped Sacrificed/mortality Brood collected Adults Jacks Adults Jacks Adults Jacks
Hat. Nat. Hat. Nat. Hat. Nat. Hat. Nat. Hat. Nat. Hat. Nat. 10-Jun 4 3 1 0 0 11-Jun 1 0 1 0 0 12-Jun 2 2 0 0 0 2 13-Jun 2 1 1 0 0 15-Jun 6 5 1 0 0 2 1 16-Jun 10 7 1 2 0 2 1 17-Jun 10 6 4 0 0 3 1 19-Jun 10 7 3 0 0 3 1 20-Jun 17 6 10 0 1 2 4 1 22-Jun 23 17 3 3 0 7 1 1 23-Jun 13 8 2 3 0 1 3 1 2 24-Jun 15 12 1 2 0 2 5 1 25-Jun 11 6 3 1 1 1 2 2 26-Jun 17 9 3 3 2 2 3 1 1 27-Jun 8 5 2 1 0 1 28-Jun 13 10 2 1 0 1 7 1 30-Jun 12 7 2 2 1 2 3 1 JUN 174 111 40 18 5 0 0 10 0 44 16 4 1 2-Jul 16 7 2 7 0 6 2 4-Jul 10 3 5 2 0 2 3 2 5-Jul 5 3 1 0 1 6-Jul 6 4 1 0 1 2 1 8-Jul 8 5 0 3 0 3
11-Jul 2 1 0 1 0 1 1 14-Jul 1 1 0 0 0 1 31-Jul 1 0 1 0 0 1 JUL 49 24 10 13 2 0 0 12 0 9 4 0 0 Total 223 135 50 31 7 0 0 22 0 53 20 4 1
Appendix Table 14. Daily summer steelhead trapping data from the Upper Grande Ronde adult collection facility in 2017.
Date Total Trapped Sacrificed/mortality Recaptures at trap
Hat. Nat. Hat. Nat. Hat. Nat. 26-Apr 1 0 1 0 0 0 0 28-Apr 1 0 1 0 0 0 0 APR 2 0 2 0 0 0 0 Total 2 0 2 0 0 0 0

57
Appendix Table 15. Daily spring Chinook salmon trapping data from the Upper Grande Ronde adult collection facility in 2017.
Date Total
Trapped Sacrificed/mortality Brood collected Adults Jacks Adults Jacks Adults Jacks
Hat. Nat. Hat. Nat. Hat. Nat. Hat. Nat. Hat. Nat. Hat. Nat. 5-Jun 1 1 0 0 0 1 6-Jun 2 2 0 0 0 2 8-Jun 1 1 0 0 0 1
10-Jun 3 2 1 0 0 2 14-Jun 17 16 0 1 0 16 1 16-Jun 10 6 3 1 0 6 1 1 19-Jun 32 28 4 0 0 28 2 20-Jun 19 14 1 4 0 1 13 1 4 21-Jun 53 42 7 4 0 42 3 4 22-Jun 0 0 0 0 0 28-Jun 0 0 0 0 0 30-Jun 0 0 0 0 0 JUN 138 112 16 10 0 111 7 10 0 Total 138 112 16 10 0 0 0 0 0 111 7 10 0

58
Appendix Table 16. Daily summer steelhead trapping data from the Lookingglass Creek adult collection facility in 2017.
Date Total Trapped Sacrificed/mortality Recaptures at trap
Hat. Nat. Hat. Nat. Hat. Nat. 8-Mar 2 0 2 0 0 0 0
10-Mar 2 1 1 1 0 0 0 14-Mar 12 1 11 1 0 0 0 15-Mar 1 0 1 0 0 0 0 20-Mar 2 0 2 0 0 0 0 22-Mar 6 0 6 0 0 0 2 24-Mar 2 0 2 0 0 0 1 27-Mar 3 0 3 0 0 0 0 29-Mar 4 0 4 0 0 0 2 31-Mar 3 0 3 0 0 0 2 MAR 37 2 35 2 0 0 0 3-Apr 10 1 9 1 0 0 4 7-Apr 3 0 3 0 0 0 1
10-Apr 2 0 2 0 0 0 3 12-Apr 2 0 2 0 0 0 0 14-Apr 4 0 4 0 0 0 0 17-Apr 5 0 5 0 0 0 0 19-Apr 5 0 5 0 0 0 0 21-Apr 10 0 10 0 0 0 2 23-Apr 6 0 6 0 0 0 2 24-Apr 1 0 1 0 0 0 0 26-Apr 2 0 2 0 0 0 0 28-Apr 3 0 3 0 0 0 0 APR 54 1 53 1 0 0 0
1-May 21 0 21 0 0 0 3 5-May 15 0 15 0 0 0 3 8-May 5 0 5 0 0 0 4
10-May 6 0 6 0 0 0 1 12-May 2 0 2 0 0 0 1 15-May 2 0 2 0 0 0 0 17-May 1 0 1 0 0 0 1 19-May 1 0 1 0 0 0 0 22-May 2 0 2 0 0 0 1 24-May 3 0 3 0 0 0 2 26-May 1 0 1 0 0 0 0 31-May 1 0 1 0 0 0 1 MAY 60 0 60 0 0 0 17 Total 150 3 147 3 0 0 36

59
Appendix Table 17. Daily spring Chinook salmon trapping data from the Lookingglass Creek adult collection facility in 2017.
Date Total
Trapped Sacrificed/mortality Brood collected Adults Jacks Adults Jacks Adults Jacks
Hat. Nat. Hat. Nat. Hat. Nat. Hat. Nat. Hat. Nat. Hat. Nat. 7-Jun 1 1 0 0 0 1
14-Jun 3 3 0 0 0 2 15-Jun 2 1 1 0 0 16-Jun 2 2 0 0 0 1 19-Jun 23 13 4 6 0 5 1 6 20-Jun 19 12 4 3 0 2 5 2 1 21-Jun 12 8 1 3 0 3 5 1 22-Jun 12 6 1 5 0 5 3 23-Jun 6 2 1 1 2 1 26-Jun 27 14 3 9 1 9 7 3 28-Jun 16 10 0 5 1 4 7 30-Jun 11 8 2 1 0 1 3 1 JUN 134 80 17 33 4 0 0 25 0 39 8 7 0 2-Jul 14 3 1 9 1 7 3-Jul 11 1 1 8 1 7 1 5-Jul 16 4 2 8 2 8 2 1 7-Jul 16 7 0 6 3 5 3
10-Jul 19 5 1 12 1 11 3 1 12-Jul 6 1 1 4 0 3 1 1 14-Jul 6 3 0 2 1 2 2 17-Jul 8 3 0 5 0 4 19-Jul 6 2 1 2 1 2 1 1 20-Jul 3 3 0 0 0 1 JUL 105 32 7 56 10 0 0 49 0 13 5 0 0
2-Aug 4 0 1 3 0 3 9-Aug 1 1 0 0 0 1
14-Aug 1 1 0 0 0 1 18-Aug 2 1 1 0 0 21-Aug 12 7 1 4 0 3 2 1 23-Aug 6 5 0 1 0 3 25-Aug 5 3 0 2 0 2 2 28-Aug 7 5 0 2 0 1 5 30-Aug 5 4 0 1 0 1 AUG 43 27 3 13 0 0 0 9 0 15 1 0 0 5-Sep 6 2 0 3 1 3 1 8-Sep 3 0 0 3 0 3
12-Sep 5 2 1 2 0 2 1 SEP 14 4 1 8 1 0 0 8 0 1 1 0 0 Total 296 143 28 110 15 0 0 91 0 68 15 7 0

60
Appendix Table 18. Adult summer steelhead trapping summary from the Catherine Creek adult collection facility 1997-2017.
Year Total Trapped Sacrificed/mortality Recaptures at trap
Hat. Nat. Hat. Nat. Hat. Nat. 1997 0 0 0 0 0 0 0 1998 0 0 0 0 0 0 0 1999 10 3 7 3 0 0 0 2000 15 6 9 0 0 0 0 2001 201 50 151 41 1 0 2 2002 256 1 255 1 0 0 4 2003 226 2 224 2 1 0 2 2004 180 0 180 0 0 0 7 2005 191 1 190 1 0 0 6 2006 171 0 171 0 0 0 5 2007 127 0 127 0 0 0 3 2008 121 0 121 0 0 0 3 2009 149 0 149 0 0 0 15 2010 298 3 295 3 0 0 10 2011 348 0 348 0 0 0 30 2012 329 0 329 0 0 0 13 2013 171 0 171 0 0 0 20 2014 263 0 263 0 0 0 17 2015 293 0 293 0 0 0 10 2016 198 0 198 0 0 0 1 2017 104 0 104 0 0 0 15

61
Appendix Table 19. Adult summer steelhead trapping summary from the Upper Grande Ronde River adult collection facility 1997-2017.
Year Total Trapped Sacrificed/mortality Recaptures at trap
Hat. Nat. Hat. Nat. Hat. Nat. 1997 0 0 0 0 0 0 0 1998 0 0 0 0 0 0 0 1999 1 0 1 0 0 0 0 2000 0 0 0 0 0 0 0 2001 11 0 11 0 0 0 1 2002 36 0 36 0 0 0 3 2003 56 0 56 0 0 0 16 2004 63 0 63 0 0 0 10 2005 41 0 41 0 0 0 0 2006 1 0 1 0 0 0 0 2007 63 0 63 0 0 0 3 2008 31 0 31 0 0 0 6 2009 36 0 36 0 0 0 2 2010 15 0 15 0 0 0 0 2011 11 0 11 0 0 0 0 2012 13 0 13 0 0 0 2 2013 28 0 28 0 0 0 0 2014 8 0 8 0 0 0 1 2015 30 0 30 0 0 1 0 2016 25 0 25 0 0 0 0 2017 2 0 2 0 0 0 0

62
Appendix Table 20. Adult summer steelhead trapping summary from the Lookingglass Creek adult collection facility 1997-2017.
Year Total Trapped Sacrificed/mortality Recaptures at trap
Hat. Nat. Hat. Nat. Hat. Nat. 1997 10 1 9 0 0 0 0 1998 15 4 11 0 0 0 1 1999 40 0 40 0 0 0 0 2000 11 0 11 0 0 0 0 2001 114 1 113 0 0 0 2 2002 260 2 258 2 0 1 42 2003 165 0 165 0 0 0 14 2004 136 3 133 3 0 0 16 2005 206 5 201 5 1 0 20 2006 196 3 193 3 0 0 18 2007 132 0 132 0 0 0 15 2008 135 6 129 6 0 0 8 2009 194 0 194 0 0 0 48 2010 334 23 311 5 0 9 12 2011 281 3 278 3 0 0 28 2012 276 1 275 1 0 0 41 2013 160 2 157 1 0 0 18 2014 182 2 180 2 0 0 20 2015 305 15 290 15 0 0 30 2016 259 3 256 3 0 0 33 2017 150 3 147 3 0 0 36

63
Appendix Table 21. Spawning data for Catherine Creek stock spring Chinook salmon at Lookingglass Hatchery 2001-2017.
NatF=Natural Females, HatF=Natural Males, etc. Recy=number of fish that were spawned multiple times. These are included in the total. Example 2007: NatM=16 total males, recy=3 indicates that 3 of the 16 males spawned multiple times. There were 13 unique individuals. Median spawn wk=the week in which 50% of the females had spawned. Mortality=total mortality for the season.
Year Stock Fish spawned Median Mortality
NatF HatF NatM recy HatM recy NatJ recy HatJ recy Spawn wk F M J 2001 CC 13 0 5 0 2 0 30-Aug 2 2 1 2002 CC 20 0 11 0 3 0 23-Aug 1 1 0 2003 CC 28 0 17 0 1 0 21-Aug 1 2 0 2004 CC 9 0 6 0 0 1 16-Sep 0 2 0 2005 CC 8 9 2 10 0 5 8-Sep 2 0 0 2006 CC 8 29 11 16 1 1 31-Aug 0 0 0 2007 CC 14 31 16 3 13 1 1 4 29-Aug 2 1 0 2008 CC 11 21 19 14 32 21 0 4 3-Sep 0 0 0 2009 CC 13 30 14 1 5 4 2 27-Aug 4 4 0 2010 CC 13 29 22 7 18 3 1 2 9-Sep 1 0 0 2011 CC 19 20 13 2 24 3 2 2 15-Sep 5 5 0 2012 CC 23 22 24 3 18 2 2 16-Aug 2 2 0 2013 CC 26 23 21 7 13 3 1 2 29-Aug 9 3 1 2014 CC 25 19 29 7 26 1 2 2 28-Aug 2 3 0 2015 CC 20 33 38 9 21 3 1 3-Sep 3 1 0 2016 CC 22 16 16 2 19 0 3 1-Sep 14 7 1 2017 CC 11 34 13 5 23 4 1 4 6-Sep 1 0 0

64
Appendix Table 22. Spawning data for Grande Ronde stock spring Chinook salmon at Lookingglass Hatchery 2001-2017.
NatF=Natural Females, HatF=Natural Males, etc. Recy=number of fish that were spawned multiple times. These are included in the total. Example 2006: NatM=14 total males, recy=2 indicates that 2 of the 14 males spawned multiple times. There were 12 unique individuals. Median spawn wk=the week in which 50% of the females had spawned. Mortality=total mortality for the season.
Year Stock Fish spawned Median Mortality
NatF HatF NatM recy HatM recy NatJ recy HatJ recy Spawn wk F M J 2001 GR 8 0 7 0 0 0 5-Sep 2 3 0 2002 GR 21 14 0 1 0 23-Aug 6 3 0 2003 GR 23 0 20 0 0 0 28-Aug 16 11 0 2004 GR 7 0 5 0 0 1 9-Sep 1 2 1 2005 GR 2 38 4 24 6 0 5 1-Sep 3 4 0 2006 GR 13 71 14 2 50 2 1 7-Sep 4 15 0 2007 GR 6 25 10 2 14 1 0 7 11-Sep 1 4 1 2008 GR 4 8 10 5 11 6 0 5 2 3-Sep 0 1 0 2009 GR 9 52 10 2 30 1 1 9 1 13-Aug 37 28 4 2010 GR 14 68 23 6 63 6 1 0 2-Sep 5 12 1 2011 GR 2 37 8 4 32 3 2 1 1 1-Sep 17 4 0 2012 GR 27 47 40 3 32 1 5 30-Aug 8 10 2 2013 GR 13 53 7 14 31 3 0 8 29-Aug 8 3 1 2014 GR 22 46 34 3 42 2 3 28-Aug 5 13 6 2015 GR 23 62 22 6 68 1 5 3-Sep 12 5 1 2016 GR 9 60 17 2 60 4 0 4 1-Sep 13 8 0 2017 GR 3 68 6 54 4 0 10 30-Aug 0 2 0

65
Appendix Table 23. Spawning data for Lookingglass Creek stock spring Chinook salmon at Lookingglass Hatchery 2004-2017.
NatF=Natural Females, HatF=Natural Males, etc. Recy=number of fish that were spawned multiple times. These are included in the total. Example 2008: NatM=22 total males, recy=11 indicates that 11 of the 22 males spawned multiple times. There were 11 unique individuals. Median spawn wk=the week in which 50% of the females had spawned. Mortality=total mortality for the season.
Year Stock Fish spawned Median Mortality
NatF HatF NatM recy HatM recy NatJ recy HatJ recy Spawn wk F M J 2004 LG 0 53 0 53 0 4 9-Sep 5 12 0 2005 LG Fish were released above the hatchery 2006 LG Fish were released above the hatchery 2007 LG 0 23 0 19 4 0 23 6-Sep 2 1 3 2008 LG 0 76 22 11 91 45 1 6 4 3-Sep 1 2 0 2009 LG 19 7 14 6 8 5 27 0 3-Sep 1 1 4 2010 LG 20 55 23 49 3 9 0 2-Sep 8 10 0 2011 LG 29 50 32 6 41 3 8 0 1-Sep 4 9 0 2012 LG 24 57 28 52 10 2 5 30-Aug 3 7 0 2013 LG 15 52 15 6 34 9 0 5 4-Sep 4 3 2 2014 LG 24 58 32 5 47 4 0 7 4-Sep 5 6 1 2015 LG 27 48 21 0 56 1 1 5 2-Sep 11 9 2 2016 LG 21 55 37 13 42 4 0 4 31-Aug 12 10 1 2017 LG 8 37 10 3 30 4 0 6 30-Aug 2 1 1

66
Appendix Table 24. Bull trout trapping summary from the Catherine Creek, Upper Grande Ronde, and Lookingglass Creek adult collection facilities 1999-2017.
Appendix Table 25. Median spawn dates and holding location at Lookingglass Hatchery for Catherine Creek, Grande Ronde, and Lookingglass Creek stocks 2001-2017.
Year Catherine Creek Grande Ronde Lookingglass Creek 1999 1 0 47 2000 1 0 43 2001 1 0 39 2002 3 0 91 2003 5 0 45 2004 7 0 44 2005 5 0 60 2006 1 2 51 2007 5 0 59 2008 4 0 58 2009 14 0 34 2010 31 0 31 2011 35 0 78 2012 56 0 126 2013 52 1 177 2014 33 3 132 2015 30 4 82 2016 23 0 68 2017 29 0 77
Year Catherine Creek (#fem.) Grande Ronde (#fem.) Lookingglass Creek (#fem.) 2001 8/30 (12) circular 9/5 (8) circular -- 2002 8/23 (20) circular 8/23 (21) circular -- 2003 8/21 (28) circular 8/28 (23) circular -- 2004 9/16 (9) circular 9/9 (7) circular 9/9 (53) raceway 2005 9/8 (17) circular 9/1 (40) circular -- 2006 8/31 (37) circular 9/7 (85) circular -- 2007 8/29 (45) raceway 9/11 (32) circular 9/6 (23) raceway 2008 9/3 (32) raceway 9/3 (12) circular 9/3 (76) raceway 2009 8/27 (43) raceway 8/13 (61) circular 9/3 (26) raceway 2010 9/9 (42) circular 9/2 (82) raceway 9/2 (75) raceway 2011 9/15 (39) circular 9/1 (39) raceway 9/1 (79) raceway 2012 8/16 (45) circular 8/30 (74) raceway 8/30 (81) raceway 2013 8/29 (49) circular 8/29 (66) raceway 9/4 (67) raceway 2014 8/28 (44) circular 8/28 (68) raceway 9/4 (82) raceway 2015 9/3 (53) circular 9/3 (85) raceway 9/2 (75) raceway 2016 9/1 (38) circular 9/1 (69) raceway 8/31 (77) raceway 2017 9/6 (45) circular 8/30 (71) raceway 8/30 (45) raceway

67
Appendix Table 26. Percent egg viability for stocks of fish spawned at Lookingglass Hatchery (mean percent viability).
Appendix Table 27. Trap install and removal dates.
Year Catherine Creek Grande Ronde Lookingglass Creek Lostine Imnaha 2007 85 81 77 87 74 2008 95 90 93 92 88 2009 93 87 98 96 93 2010 92 93 87 93 92 2011 93 86 90 92 85 2012 87 92 94 90 80 2013 84 92 92 89 92 2014 93 94 96 94 94 2015 89 90 94 89 93 2016 86 92 92 87 97 2017 90 97 89 93 96
Year Catherine Creek Grande Ronde Lookingglass Creek In Out In Out In Out
1997 7/10 9/3 6/20 9/3 unk unk 1998 6/9 9/30 5/16 7/23 unk unk 1999 5/7 9/26 5/7 9/22 unk unk 2000 3/30 7/31 3/24 7/31 unk unk 2001 3/30 9/30 3/31 7/23 unk unk 2002 3/12 8/13 4/22 7/24 unk unk 2003 3/5 8/1 3/19 8/1 3/6 unk 2004 3/1 8/18 3/1 8/1 3/2 unk 2005 2/11 8/3 3/10 8/3 2/22 9/9 2006 3/1 7/25 3/3 7/25 3/8 unk 2007 3/1 7/31 3/1 7/13 4/2 9/18 2008 3/3 9/9 3/5 7/28 3/1 9/9 2009 3/2 9/2 3/12 8/4 3/2 9/10 2010 3/1 7/30 3/3 6/28 3/1 9/15 2011 3/3 8/5 3/2 7/20 2/28 9/12 2012 3/1 8/15 3/1 6/22 3/1 9/18 2013 2/21 7/31 3/6 6/18 3/1 9/11 2014 3/3 7/31 3/4 7/1 3/1 9/16 2015 3/2 7/29 3/2 6/7 3/1 9/18 2016 3/1 8/5 3/1 6/3 3/1 9/16 2017 2/28 8/12 3/1 6/21 3/1 9/12
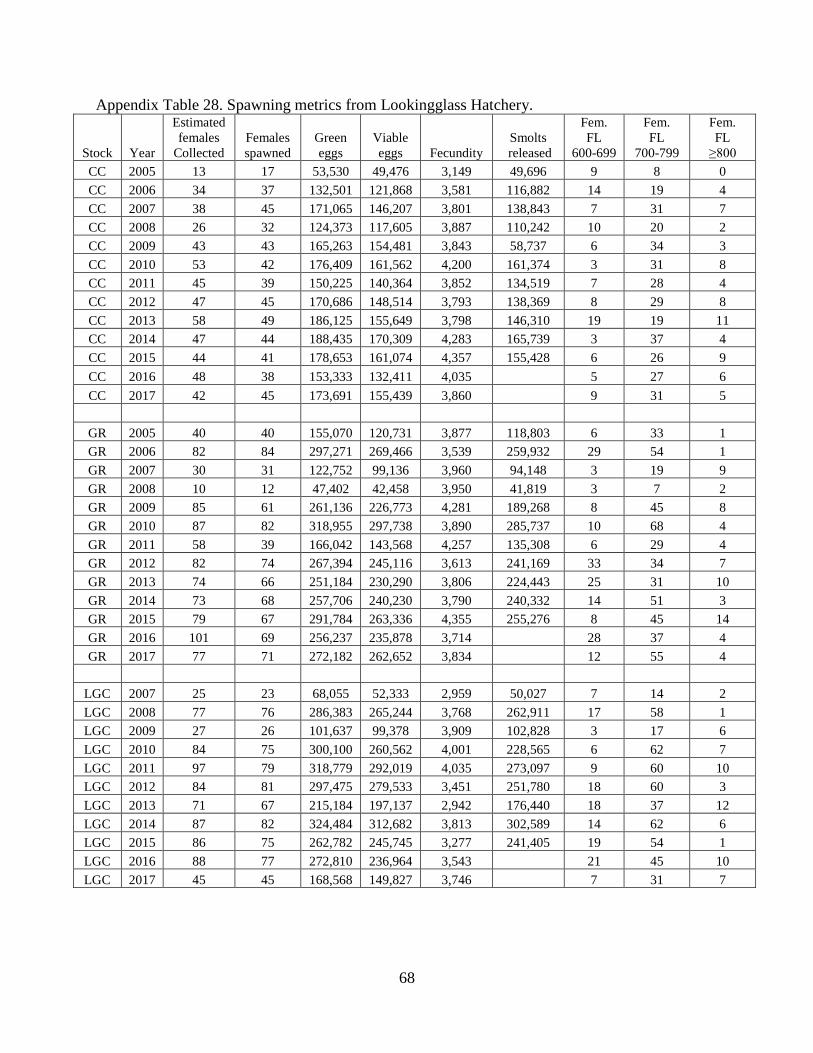
68
Appendix Table 28. Spawning metrics from Lookingglass Hatchery.
Stock Year
Estimated females
Collected Females spawned
Green eggs
Viable eggs Fecundity
Smolts
released
Fem. FL
600-699
Fem. FL
700-799
Fem. FL
≥800 CC 2005 13 17 53,530 49,476 3,149 49,696 9 8 0 CC 2006 34 37 132,501 121,868 3,581 116,882 14 19 4 CC 2007 38 45 171,065 146,207 3,801 138,843 7 31 7 CC 2008 26 32 124,373 117,605 3,887 110,242 10 20 2 CC 2009 43 43 165,263 154,481 3,843 58,737 6 34 3 CC 2010 53 42 176,409 161,562 4,200 161,374 3 31 8 CC 2011 45 39 150,225 140,364 3,852 134,519 7 28 4 CC 2012 47 45 170,686 148,514 3,793 138,369 8 29 8 CC 2013 58 49 186,125 155,649 3,798 146,310 19 19 11 CC 2014 47 44 188,435 170,309 4,283 165,739 3 37 4 CC 2015 44 41 178,653 161,074 4,357 155,428 6 26 9 CC 2016 48 38 153,333 132,411 4,035 5 27 6 CC 2017 42 45 173,691 155,439 3,860 9 31 5
GR 2005 40 40 155,070 120,731 3,877 118,803 6 33 1 GR 2006 82 84 297,271 269,466 3,539 259,932 29 54 1 GR 2007 30 31 122,752 99,136 3,960 94,148 3 19 9 GR 2008 10 12 47,402 42,458 3,950 41,819 3 7 2 GR 2009 85 61 261,136 226,773 4,281 189,268 8 45 8 GR 2010 87 82 318,955 297,738 3,890 285,737 10 68 4 GR 2011 58 39 166,042 143,568 4,257 135,308 6 29 4 GR 2012 82 74 267,394 245,116 3,613 241,169 33 34 7 GR 2013 74 66 251,184 230,290 3,806 224,443 25 31 10 GR 2014 73 68 257,706 240,230 3,790 240,332 14 51 3 GR 2015 79 67 291,784 263,336 4,355 255,276 8 45 14 GR 2016 101 69 256,237 235,878 3,714 28 37 4 GR 2017 77 71 272,182 262,652 3,834 12 55 4
LGC 2007 25 23 68,055 52,333 2,959 50,027 7 14 2 LGC 2008 77 76 286,383 265,244 3,768 262,911 17 58 1 LGC 2009 27 26 101,637 99,378 3,909 102,828 3 17 6 LGC 2010 84 75 300,100 260,562 4,001 228,565 6 62 7 LGC 2011 97 79 318,779 292,019 4,035 273,097 9 60 10 LGC 2012 84 81 297,475 279,533 3,451 251,780 18 60 3 LGC 2013 71 67 215,184 197,137 2,942 176,440 18 37 12 LGC 2014 87 82 324,484 312,682 3,813 302,589 14 62 6 LGC 2015 86 75 262,782 245,745 3,277 241,405 19 54 1 LGC 2016 88 77 272,810 236,964 3,543 21 45 10 LGC 2017 45 45 168,568 149,827 3,746 7 31 7