gravity expeditions 1948-1958
TRANSCRIPT

GRAVITY EXPEDITIONS 1948-1958
VOLUME V

P R I N T E D B Y W. D . M E I N E M A N . V . , DELFT, N E T H E R L A N D S

PUBLICATION OF THE NETHERLANDS GEODETIC COMMISSION
GRAVITY EXPEDITIONS I 948-1 958
VOLUME V
COMPLETE RESULTS WITH ISOSTATIC REDUCTION
WITH A PREFACE BY
F. A. VENING MEINESZ
EDITED BY G. J. BRUINS
1960
RIJKSCOMMISSIE VOOR GE.ODESIE, KANAALWEG 4, DELFT, NETHERLANDS

To the Royal Netherlands N a y

PREFACE
Since the war the gravity determinations at sea and on land, which since long have formed an important part of the activities of the Netherlands Geodetic Com- mission, have been actively pursued. As it has always been the case, the Commission has continued to consider the research at sea as an important task for all nations, and in this recent period since the war - which period is covered by this volume V - she has made great contributions to this field of research. In doing so, she has kept in view the geodetic as well as the geophysical aims. The first have gained in importance because of the growing demand for knitting together in a consistent whole the geo- detic surveys on the different continents, and it is well known that one way for doing so - and probably in many cases the best one - is provided by the gravimetric- astrogeodetic method.
As well for this purpose as for that of the determination of the geoid, the crossings of the Atlantic in 1949 and 195 1 and the complete survey in 1955 and 1956 of the North Sea up to fairly high latitude are valuable. The latter makes it also possible to derive the geoid in the Netherlands. I t may be emphasized that the geoid determi- nation is a duty that is usually overlooked by geodetic services.
The crossings of the Atlantic are also valuable for geophysical problems and the gravimetric survey of the North Sea likewise. The latter sheds light on the problem of the postglacial rise of Fennoscandia as far as the reaction of adjacent areas is concerned. I t also gives valuable indications about the way the geological features of the surrounding countries continue in the North Sea area.
The expedition of Hr. Ms. Walrus in the Caribbean and in the Pacific area west and south of Panama was mainly undertaken for geophysical reasons. Three objects can be especially mentioned, firstly the investigation whether north of the Andean ranges where they are cut off by the Caribbean Coast, gravity shows special features, secondly the gravity research over the submarine ridges in the Pacific southwest of Costa Rica and Panama, and thirdly the gravity research over the Pacific area con- tiguous to the Andes between Panama and Guayaquil.
Sincere gratitude may be expressed to the Royal Netherlands Navy for the ships allotted for these important gravity expeditions, to the Captains, Officers and crews of these ships for their unfailing collaboration and help for the scientific research, and to the young scientists who carried it out, to Ir. G. J. Bruins (1949), Dr. H. J. A. Vesseur (1949), Dr. R. Dorrestein (195 l ) , Dr. B. J. Collette (1955), Ir. G. Bakker (1957) and Ir. L. Otto (1957).
With high appreciation also the important gravity work on land may be mentioned carried out in Surinam (Dutch Guyana) by Prof. Dr. J. Veldkamp.
Sincere thanks are also due to the International Isostatic Institute in Helsinki for the reduction of the gravity results for the effects of topography and isostatic com- pensation.
Last but not least many thanks are due to Mr. H. C. van der Hoek for the con- tinuous services rendered to the editor and the printer, to Mr. M. C. Breemans and Mr. E. P. Boode for drawing and to the Netherlands Topographical Service for printing the maps and to the printer W. D. Meinema N.V., who all contributed to give this edition the present form.
F. A. VENING MEINESZ


CONTENTS
INTRODUCTION
PART I ATLANTIC, CARIBBEAN AND PACIFIC CRUISES page 1 1
by G. J. Bruins, R. Dorrestein, H. J. A. Vesseur, G. Bakker and L. Otto
PART I1 THE GRAVITY FIELD OF THE NORTH SEA
by B. J. Collette
PART I11 MEASUREMENTS OF GRAVITY IN SURINAM
by J. Veldkamp
page 47
page 97


INTRODUCTION
-4fter the second World War, the Netherlands Geodetic Commission again took up the organization of gravity measurements at sea. The method of measurement and the apparatus which were developed and used during the years 1923-1938 by Prof. Dr. F. A. Vening Meinesz, resulted during that period in the observation of gravity in 844 stations published in: F. A. Vening Meinesz, Gravity Expeditions at Sea, Volume IV, 1923-1938, Delft, 1948. Because of the war this investigation was inter- rupted for ten years, but on the initiative of Prof. vening Meinesz it was continued in 1948, although he then judged that younger observers should take his place.
As before the war, the Royal Netherlands Navy gave its full cooperation to make this scientific work possible. Sincere thanks are expressed for this help, which must be valued the higher as after 1945 the number of submarines of the Royal Nether- lands Navy was reduced and consequently there was less opportunity for making a vessel available for gravity expeditions.
The previous volumes I-IV of this series "Gravity Expeditions at Sea" contain only observations made at sea, however this volume V contains also gravity obser- vations on land. These measurements on land were made in Surinam (Dutch Guy- ana) with an Askania gravimeter type Gs. 9, which was purchased by the Nether- lands Geodetic Commission in 1956.
The following expeditions were made in chronological order:
15th September-9th October 1948, from Rotterdam via Ponte Delgada to Cura~ao. 1st March-7th April 1949, from Cura~ao via Paramaribo and Casablanca to Rotterdam. 23rd January-22nd April 195 1, from Rotterdam via Lisbon-Cura~ao-Key West-Ponte Delgada back to Rotterdam. 20th June-22nd September 1955, an investigation of the southern part of the North Sea. 10th-23rd September 1956, an investigation of the northern part of the North Sea. 29th July-19th August 1957, an expedition in Surinam. 14th-26th October 1957, a detailed investigation of the North Sea east of Scotland. 18th Novemver-2lst December 1957, an expedition in the Caribbean and in the Pacific Ocean.
I t must be remarked that on the expeditions d. and g., mentioned above, the observations were not made in a submarine because of the shallowness of this part of the North Sea. Not the pendulum apparatus of Prof. Vening Meinesz was used there, but a North-American gravimeter equipped with Robert Ray remote control, which was let down to the sea-bottom. The Royal Netherlands Navy kindly put the

frigates Hr. Ms. "Vos" and Hr. Ms. "Fret" at the disposal of these expeditions. Because the depth of the North Sea increases considerably towards the north, a number of supplementary pendulum observations were made by submarine in the autumn of 1956, so that a complete picture of gravity in the North Sea was obtained.
This publication is divided into three parts: Part I contains the expeditions in the Atlantic Ocean and in the Caribbean during
the years 1948, 1949 and 1951 by the observers G. J. Bruins, R. Dorrestein and H. J. A. Vesseur (see under a., b. and C.) and the expedition in 1957 (see under h.) in the Caribbean and in the Pacific by the observers G. Bakker and L. Otto. These expeditions can be considered as the actual continuation of the work of Professor Vening Meinesz. The observations of these expeditions have been numbered Nr. 845-1032, as the last observation in Gravity Observations at Sea, Volume IV, was Nr. 844. A geophysical interpretation of the results of the expedition h. by Prof. Vening Meinesz has been added; it is followed by tables of the numerical results. These tables are arranged in the same way as those in Volume IV.
Part I1 contains the expeditions d., e. and g. on the North Sea, observer B. J. Collette. The observations have been numbered No. 1033-1293 followed by a geophysical interpretation and tables of the results.
Part I11 contains the expedition f. in Surinam, by J. Veldkamp, with the Askania- Gravimeter Gs. 9. These observations on land have not been numbered. At the end of this part the results have been printed.
The following remarks are made with regard to the tables of anomalies and reductions :
a. In accordance with the recommendation by the Union GCodCsique et GCo- physique Internationale, the observations have only been reduced by the method of Airy-Heiskanen (R = 0) and not by the method of Hayford-Bowie. Reduc- tions were also computed for regional compensation with radii R = 29.05, 58.1, 116.2, 174.3 and 232.4 km. The indirect effect (Bowie-correction) was not computed either.
b. The topographic and isostatic corrections have been interpreted as corrections to measured gravity, and not as corrections to normal gravity, so that the sign of these corrections is opposite to that of the corrections in Gravity Expeditions at Sea, Volume IV.

PART I
ATLANTIC, CARIBBEAN AND PACIFIC CRUISES
Hr. Ms. "0.24" Cruise : September-October 1948 Cruise : February-April 1949 Observers : G. J. Bruins, H. J. A. Vesseur Observation numbers : 845-879
Hr. Ms. "Tijgerhaai" Cruise : January-April 195 1 Observer : R. Dorrestein Observation numbers : 880-953
Hr. Ms. "Walrus" Cruise : November-December 1957 Observers : G. Bakker, L. Otto Observation numbers : 954-1 032
CONTENTS
Expeditions during the years 1948, 1949 and 1951
General . . . . . . . . . . . . . . . . . . . . . . . . . . . . 13 Instrumentation . . . . . . . . . . . . . . . . . . . . . . . . . 15 The base-observations . . . . . . . . . . . . . . . . . . . . . . 15
Expedition during the year 1957
General . . . . . . . . . . . . . . . . . . . . . . . . . . . . 18 Instrumentation . . . . . . . . . . . . . . . . . . . . . . . . . 2 1 The base-observations . . . . . . . . . . . . . . . . . . . . . . 23 The sea-stations . . . . . . . . . . . . . . . . . . . . . . . . . 25 Accuracy and comparison with earlier results . . . . . . . . . . . . 26 Interpretation by F. A. Vening Meinesz . . . . . . . . . . . . . . 28
Tables
Free-air and isostatic anomalies and the effects of topography and compensation. . . . . . . . . . . . . . . . . . . . . . . . . . 35
Chart
Dutch Maritime Gravity Stations 1948-1958 . . . . . . . . . . enclosed


1 EXPEDITIONS DURING T H E YEARS 1948, 1949 AND 1951
1.1 General
Early in the year 1948, Prof. Dr. Ir. F. A. VENING MEINESZ, member of the Nether- lands Geodetic Commission, made preparations for a gravity expedition in a sub- marine of the Royal Netherlands Navy. The Naval Authorities consented to these plans; in the autumn of 1948 Hr. Ms. "0.24" departed together with Hr. Ms. "Zeehond" for a training cruise to the West-Indies and on the outward and home- ward voyages an opportunity was given for making gravity observations.
The squadron was commanded by Lieutenant Commander J. F. DRIJFHOUT VAN
HOOFF; the Officers of Hr. Ms. "0.24" were: Lieutenant-Commander R. VAN WELY, Commanding Officer Lieutenant H. J. BRAKEMA, Executive Officer Lieutenant H. A. HOLLENBACH, Chief Engineer Lieutenant F. F. BRINKMAN, Navigator Lieutenant Jhr. J. A. C. SIX Sub Lieutenant *J. G. C. VAN DE LINDE Sub Lieutenant T. J. ZICK
Many thanks are due to the Commander of the squadron and to the Command- ing Officer, the Officers, Petty Officers and crew of Hr. Ms. "0.24" for their whole-hearted co-operation in making the observations succeed.
The outward voyage started on 15th September 1948 at Rotterdam and ended in October 1948 (arrival at Curaqao) ; it was interrupted by a stay of one day at Ponte Delgada on the Azores. The observations started after departure from Ponte Delgada and from then on the route was adapted to the requirements of the scientif- ic investigation.
The homeward voyage started from Curaqao on 1st March 1949 and ended at Rotterdam on 7th April. There were two interruptions, one at Paramaribo from 7th - 10th March and one at Casablanca from 27th - 31st March.
After the outward voyage the observers Ir. G. J. BRUINS and Drs. H. J. A. VESSEUR went back to the Netherlands in October 1948, and returned to Curaqao in February 1949 in order to take part in the homeward voyage.
The results of the outward voyage were somewhat disappointing: when the photographic records were developed after returning to the Netherlands they turned out to be under-exposed so that several observations were lost. Nevertheless this voyage has not been entirely without results, also because of the great number of deep-sea soundings that were taken.
In February 1949 professor F. A. VENING MEINESZ accompanied the two observers to Curaqao in order to investigate with them the problem of the under-exposure before the start of the home-voyage. The instruments were re-adjusted at Curasao and the prisms and mirrors in the pendulum instrument proved to be covered with a film. After they had been cleaned the instrument was re-adjusted and some standardization-observations were made in the former Diesel engine-room of the

Naval base Parera. Great co-operation was received from the Commander of the base, Captain M. M. MERENS.
Professor VENING MEINESZ accompanied the expedition to the next port, Para- maribo, where all 15 observations proved to have been successful. He then returned to the Netherlands, and Hr. Ms. "0.24" started on her homeward voyage. Approx- imately sixty observations were made on this voyage which went via Casa- blanca.
After the return it appeared that the light-intensity of the recordings had gradually decreased, just as had been the case on the outward voyage. Fortunately only a small number of observations were lost for this reason, so that the home voyage resulted in many gravity observations and also many deep-sea soundings.
An investigation was made to find the cause of loss in light-intensity of the rec- ordings. I t was found that each time the submarine dived and the air from the quick diving tank was blown inboard, a very fine and non-noticeable precipitation of salt was formed, which also penetrated into the instrument and gradually covered the prisms with a film. At former expeditions this inboard blowing of the tank had not been practised. After finding the cause of the trouble, a better protection of the prisms against exterior influences was provided, so that this influence was rendered harmless at following expeditions.
In the beginning of the year 195 1 the Royal Netherlands Navy has also consented to co-operate in a gravity expedition, this time on board Hr. Ms. "Tijgerhaai", which ship departed on 23rd January 1951 from Rotterdam and arrived on 21st February at Cura~ao, after having stayed at Lisbon from 29th January to 1st February. The home voyage was begun from Cura~ao on 16th March. After inter- ruptions from 22nd - 26th March at Key West (Fla.) U.S.A. and from l l th - 14th April at Ponte Delgada, Rotterdam was reached on 23rd April.
The Officers of Hr. Ms. "Tijgerhaai" were: Lieutenant-Commander J. VAN NIEUWENHUIZEN, Commanding Officer Lieutenant H. HOPMAN, Executive Officer Lieutenant K. KRUININK, Chief Engineer Lieutenant D. SCHRIJVERSHOF Sub Lieutenant G. BRUNT Sub Lieutenant N. KOOYMAN
The co-operation of Commanding Officer, the Officers, Petty Officers and crew in making the expedition a success is very gratefully acknowledged.
Ir. G. J. BRUINS and Dr. R. DORRESTEIN were appointed as observers, and professor F. A. VENING MEINESZ took part in the voyage as far as Lisbon. On the ground of ill-health Mr. BRUINS had to return from Lisbon also, so that Mr. DORRE- STEIN had to do the further work all by himself.
Before arriving at Lisbon some observations were made off the Portuguese coast, and on the crossing from Lisbon to Cu ra~ao observations were made approximately each 100 miles.
The Mid-Atlantic Ridge was passed at 19"N and a profile was measured N.N.E. from Cape Codera at about 1 1 ON, 66"W. After arrival at Cura~ao, base-observations were made.

PART I ATLANTIC, CARIBBEAN AND PACIFIC CRUISES 15
On the home voyage via Key West, observations were again made at distances of approximately 100 miles, with the exception of the area of the Mid-Atlantic Ridge, where a greater number of stations were observed, at approximately 30°N.
1.2 Instrumentation
The original pendulum apparatus, as designed and used by professor F. A. VENING MEINESZ has been used throughout. During both voyages, for the time marks instead of the classical Nardin chronometers, use was made of a crystal-clock, designed and built by Mr. VESSEUR. For security, however, the marks of two chronometers, one for solar time and one for sidereal time, were recorded simultaneously.
The crystal-clock that served as a time standard for these gravity-measurements, was constructed at the Royal Netherlands Meteorological Institute, no such an instrument being commercially available at that time. As only a short time was left for its construction, circuity was held as simple as possible. A 125 kc/sec quartz crystal was used in the oscillator and three frequency divider-stages, each of them dividing by 5, were used. These stages were all simple multivibrator dividers, separated by buffer stages. A power amplifier drove a 1000 p/sec synchronous clock motor. The whole equipment was powered by 220 V. a.c. from the ship mains. The motor closed a contact once per second, that served as the time signal for the measurements. During the first expedition many difficulties were experienced by unstability of the frequency dividers. The main cause for these difficulties were severe voltage fluctuations of the mains voltage on board the submarine.
For the 195 1 expedition more stable frequency divider circuits were used. In each divider an extra stage with a tuned circuit was added and the buffer stages were improved. Two dividers, one from 1000 clsec to 200 clsec and one from 200 clsec to 50 clsec were added. A power amplifier at 200 clsec drove a small synchronous motor with a toothed wheel that gave light interruptions serving as time markers. A power amplifier at 50 clsec drove a synchronous clock, that could be compared with radio time signals.
During the 1951 expedition the improved crystal-clock design gave more satis- factory results. However, during a small number of observations the clock failed and chronometers had to be used as time standards.
For the clock corrections use was made of' the rythmic time signals of Rugby GBR and Pontoise FYP on the long wave (on fixed hours two-to-four times a day) in the eastern part of the Atlantic and of the continuous time signal Beltsville WWV in the western part. The accuracy of comparison with the latter signal was only 0.05 sec, but the comparison could be made many times a day.
1.3 The base-observations
Before, between and after the expeditions in the years 1948, 1949 and 195 1, base- observations were made at the base station in the Royal Meteorological Institute at De Bilt four times namely during August-September 1948, January 1950, January 1951 and May 1951.

The results, expressed in M.S.T., for the mean period T of the outer pendulums nr. 88 and 89, for their difference and for the difference between the periods of the outer and middle pendulums at the temperature to and pressure of one atmosphere, are given in Tables 1.3-1 and 1.3-2. The number between the brackets is the number of observations per day.
Before the 1948-1 949 expedition 1 I A f t ~ r the 1918-1949 expedition -1-
Date 1948 1 sec W(/ Date 1950 I Toe sec Bilt Tnn- 10-'sec
25 Jan. 26 Jan.
20 Aug. 23 Aug.
1 Sept. 7 Sept. 8 Sept.
Mean 1 0.5013975,4 64.8 1 Mean 0.5013956,6 56.7
1
T D ~ Bilt Date 1953 1 sec
0.501 3977,8 (1) 0.5013974,9 (4) 0.5013976,9 (4) 0.5013983,8 (1)
17 April 0.5013961,7 (4) 80.8 18 April 0.5013956.9 (4) 1 78.4
58.0 62.4 61.7 69.5
Before the 1951 expedition
lO-'sec
Mean 1 0.5013959,3 1 79.6
0.5013971,6 (4) 70.8
After the 195 1 expedition
1951 1 T:T T88<T89
10- sec
16 Jan. 18 Jan. 19 Jan. 20 Jan.
Mean
0.5013963,4 (1) 70.5 0.5013963,7 (2) 67.4 0.5013960,5 (3) 69.0 0.501 3960,l (1) 70.2
P-
0.50 13962,O 1 68.9
76.0 79.9
78.2
Tg8-TgO = $35.0 - 1.03t0 10-'sec Tn9-Tg0 = -26.0 +0.16t0 10-'SEC
22 May ~ 23 May
Mean
Tan-Tg0 = + 34.5 - 1.031' 10-7~ec Tn8-TgO = -35.3 +0.16t0 10-7sec
0.50 13956,5 (3) 0.5013953,3 (4)
P
0.5013954,6

PART I ATLANTIC, CARIBBEAN AND PACIFIC CRUISES 17
In April 1953 base-observations were made again at De Bilt. The results are shown in Table 1.3-3.
The above-mentioned results for the mean period T can be considered as a continuation of the base-observations before World-War I1 in 1937, 1938 and 1939, described in [3, pages 44 and 451. Looking at the results of August-September 1948 and January 1950 one arrives at the remarkable conclusion that the mean period of the pendulums remained almost the same during the period 1938-1948, but after using them again during the expedition in 1948 and 1949 the mean period changed from 0.5013975,4 sec M.S.T. in August-September 1948 to 0.5013956,6 sec M.S.T. in January 1950, while the following base-observations of' January 195 1, May 195 1 and April 1953 are in good agreement with those of January 1950. This is one of the reasons, why for the computation of the observations ofthe 1948-1949 expedition the reference-value T = 0.5013956,6 sec M.S.T. was used as the mean period of the pendulums at De Bilt.
There is also another reason why this value has been chosen. In February 1949 and again in March 1951 base-observations were carried out at Curaqao 111, 12°06'45" N; 68O55'26" W, being the Diesel engine-room of the naval base Parera. The results were:
When we compare the 1949 value in Curaqao with the 1950 value in De Bilt we find a difference of 7238.1 X l0-3ec M.S.T.
In 1937-1938 professor VENING MEINESZ made also base-observations at Curaqao 11, 12O06'58" N; 68'55'35" W, and at De Bilt, within a short time interval.
Althcugh the station Curaqao I1 is not exactly the same as Curaqao 111, having a latitude-difference of 13" and a longitude-difference of g", this difference is so small that we may suppose that the observed gravity is the same for the two stations, as the latitude is nearly the same and also the topografical conditions (see Fig. 1). The mean period T for Curaqao I1 was 0.5021217 sec M.S.T. [3, page 85 nr. lA, 1B and l C] and for De Bilt 0.5013976 sec M.S.T. [3, page 441 giving also a difference of 7241 X l0-3ec M.S.T. The differences in 1937-38 and 1950 agree very well and this was another motive to use TD, ,,, = 0.5013956,6 sec M.S.T. for the 1948-49 expedition. For the computation of the correction for deviation from isochronism the mean value T,,-,, = -35.4 +0.16t0 X lO-%ec and T,,-,, = + 18.7 - 1.03t0 X lO-%ec has been taken for the 1948-49 expedition.
T88-T89
lO-?sec
68.3 81.2 72.6 76.4
74.6
Date 1949 Tcurasao 111 Tcurasao 111 1 sec
23 Febr. 23 Febr. 24 Febr. 24 Febr. 24 Febr.
Mean
8 March 8 March 8 March 8 March
Mean
0.502 1192,6 0.502 1 189,4 0.5021 199,l 0.502 1195,5 0.502 1197,O
0.502 1194,7
0.502 1 193,6 0.5021 191,6 0.502 1 194,3 0.502 1 199,9
0.502 1 194,8
66.7 62.3 61.0 64.0 63.9
64.2

For the computation of the results of the 1951 expedition the reference value of I,, Bilt = 0.5013958,3 sec M.S.T. being the mean value of the base observations before and after this expedition respectively in January and May 1951, has been
Fig 1. Gravity Stations at Cura~ao
used. Mean values were also used for computing the correction for deviation from isochronism, namely T,,~,, = +34.7 - 1.03t0 X 10-'sec and T8,-,, = -30.7 +0.16t0 X 10-'sec.
2 EXPEDITION DURING THE YEAR 1957
2.1 General
During the months November and December, 64 gravity observations were carried out on board Hr. Ms. "Walrus" in the Pacific near the coasts of Columbia, Ecuador, Costa Rica and Panama. Besides, 15 observations were done in the Caribbean along the coasts of Panama and Columbia. The squadron, consisting of the sub-

PART I ATLANTIC, CARIBBEAN AND PACIFIC CRUISES 19
marines Hr. Ms. "Walrus" and Hr. Ms. "Zeeleeuw" left Rotterdam on 21st October 1957 for a training cruise across the Atlantic and arrived at Curaqao on 10th November. From that time on till 21st December Hr. Ms. "Walrus" was available for scientific investigations.
Lieutenant Commander J. FENNEMA was in command of the squadron and the Officers of Hr. Ms. "Walrus" were: Lieutenant Commander F. B. HAMILTON, Commanding Officer Lieutenant K. H. L. GERRETSE, Executive Officer Lieutenant H. M. ORT, Navigator Lieutenant P. SLIJP, Chief Engineer Lieutenant J. J. LEEFLANG Lieutenant B. R. VAN ERKEL Lieutenant C. NIJDAM
As observers were appointed Ir. G. BAKKER and Ir. L. OTTO. The observers are greatly indebted to the Commander of the squadron and to
the Captain, Officers and crew of Hr. Ms. "Walrus" for their co-operation and assistance to make the expedition successful. Many thanks are also due to the Shell, the Bataafsche Petroleum Maatschappij and the Curaqaosche Petroleum Industrie Maatschappij. They enabled the observers to make the crossings from Holland to Curaqao and back on board a Shelltanker and they took care of their stay at Curaqao. The assistance given by Dr. BRUINENBERG of the Meteorological Service of the Dr. Plesman Airport in calibrating the ship's barometer is gratefully acknowledged.
During the crossing of the Atlantic the pendulum apparatus and the associated equipment were stored in the soundroom and after the submarine had arrived at Curaqao they were installed in the controlroom. On 16th and 17th November two observations were made on board the ship lying in the New Harbour. O n 18th November Hr. Ms. "Walrus" departed from Curaqao and after having passed the Panama Canal observations were started. Measurements were usually made every sixty miles but in some parts of the profiles the distance was decreased according to professor VENING MEINESZ' indications. Echo soundings were taken during the whole expedition every ten minutes.
After a few sailing days a number of observations were developed on board and it appeared that some records did not contain the curve of the slow pendulum that swings in the longitudinal direction of the ship. Therefore in Guayaquil and later on in Puntarenas the whole apparatus containing the slow pendulums was cleaned and the prisms were readjusted, however without permanent result. Conse- quently the observers were obliged to observe visually the slow pendulums and from their swingings they concluded that the total second order correction amounted to 1 or 2 milligals on an average. Assuming circular waves it was possible to compute the total second order correction from the slight fluctuations of the time marks on the record. This confirmed the supposition: only once or twice the correction amounted to more than 2 milligals.
In Guayaquil, where the submarine arrived on 28th November an observation was carried out when the submarine was lying at anchor in the middle of the river
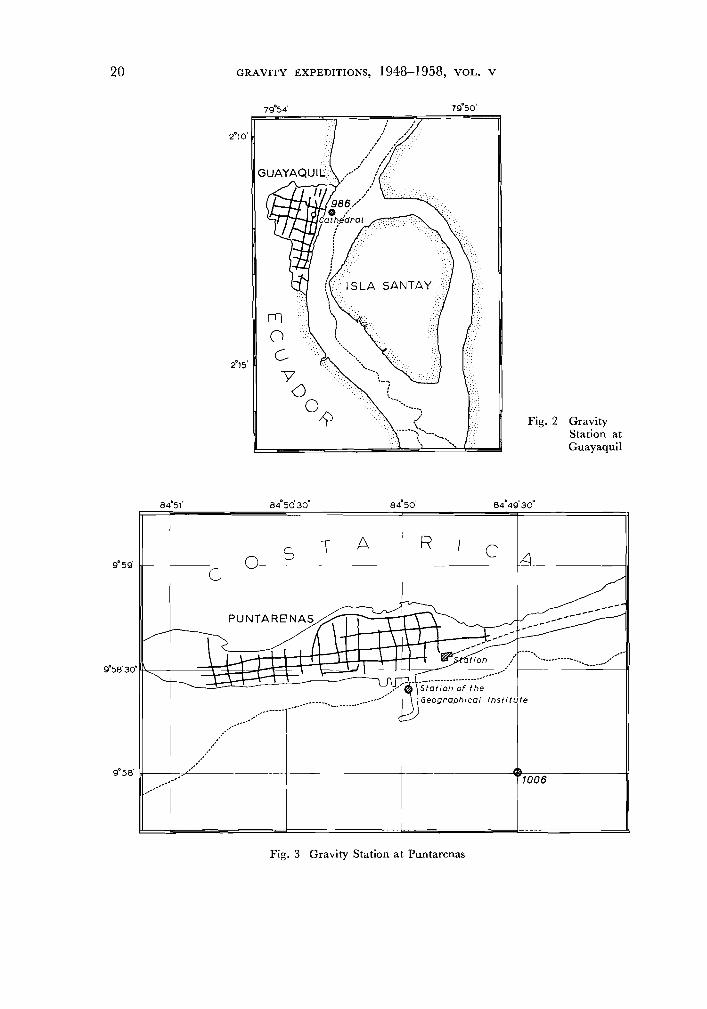
Fig. 2 Gravity Station at Guayaquil
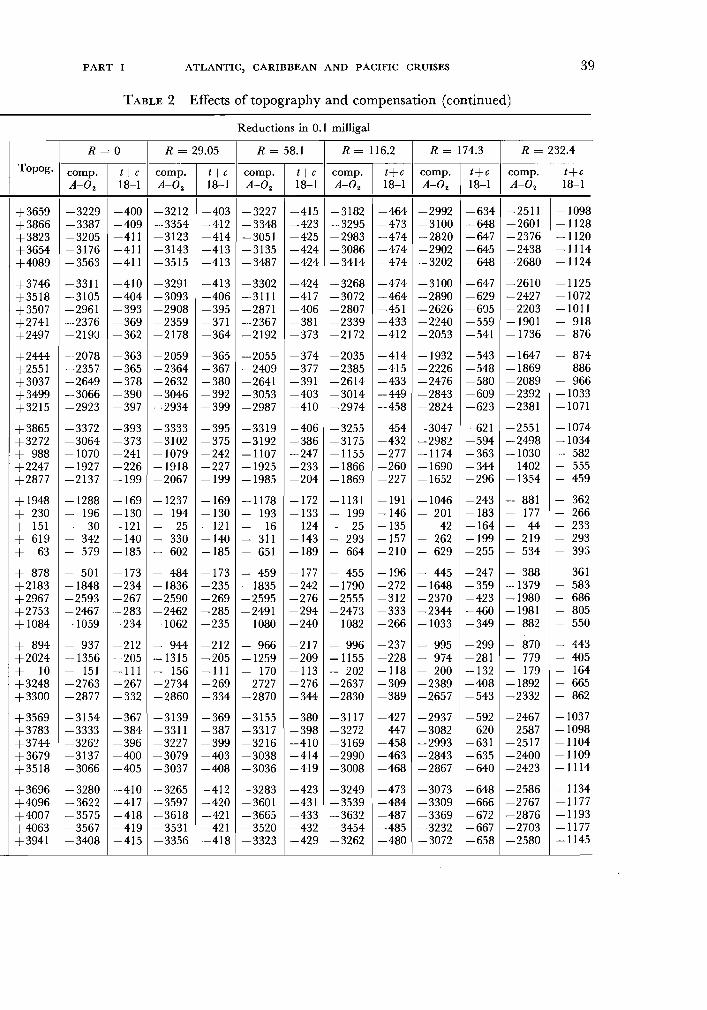
Fig. 3 Gravity Station at Puntarenas

PART I ATLANTIC, CARIBBEAN AND PACIFIC CRUISES 2 1
(see Fig. 2). The ship sailed from Guayaquil on 2nd December and from then till the arrival in Puntarenas observations went very well apart from two small dif- ficulties worth mentioning.
First it appeared from the records that on some ofthem the light-intensity decreased towards the edge of the record. It proved that the two large unprotected prisms in the outside cover of the apparatus tended to become greasy so from then on they were cleaned every day.
Second from the record of the damped pendulum, which indicates the tilt of the swinging plane, it was noticed that serious friction in the ball-bearings, which permit motion perpendicular to the swinging plane of the main pendulums, had occurred. Therefore the slow pendulum swinging in that direction was probably sliding on its knife edge. This may have been the reason why its movement was not recorded, as has been pointed out above. The ball-bearings of the cradle by which the in- strument is supported thus proved to be too small to function properly under its weight; when another expedition is planned they will have to be replaced by larger ones. According to EWING a.0. [ l , pages 68 and 831, the American observers had the same trouble with the suspension of the instrument in the gimbals.
On 7th December the submarine arrived at Puntarenas where an observation was carried out lying at anchor at an distance of about 100 metres from the landing- stage (see Fig. 3). Mr. GUTI~RREZ, Director of the Geographical Institute of San Jost, Costa Rica, kindly provided a list of gravimeter-stations in Costa Rica and he drew attention to the fact that there was already a gravity station in the harbour . - so it would be possible to compare both observations. A comparison with an American station (U.S.S. Conger 271) was possible at Balboa, Canal zone, where an observa- tion was made when the submarine was lying alongside pier 2 in the U.S. naval base "Rodman Base" (see Fig. 4).
Dr. GILBERT of the Dominion Observatory, Ottawa, embarked during the stay at Balboa from 13th till 17th December. Between Colon and Cura~ao fifteen observations were carried out in order to be able to compare the results of his newly designed sea gravimeter and the Vening Meinesz pendulum apparatus.
After a five-weeks voyage Hr. Ms. "Walrus" returned on her base in Curasao on 21st December and on the same spot as just prior to the expedition in November two observations were made in the New Harbour. Thereafter the instruments were stored in the soundroom and they reached the Netherlands 5th April. A few weeks after their arrival base-observations were carried out on the base station at De Bilt just as had been done prior to departure.
2.2 Instrumentation
The Vening Meinesz apparatus was used throughout but a different method of time-keeping was applied. As on earlier expeditions, a crystal-clock was used for time-keeping. However, a commercially obtainable frequency-standard was used instead of the one that has been constructed at the Royal Meteorological Institute. Nevertheless the markings of the sidereal time chronometer were continued as well. For this reason the interruptor which was controlled by the crystal-clock could

Fig. 4 Gravity Stations at Panama
be of a simple construction: it did not have to take care of the minute-interruptions because the minute-signals from the chronometer could be used in the working out of the records. The chronometer provided also a reserve in case the crystal-clock would be out of order.
The crystal-clock used was an Airmec frequency standard type 761. Its stability as stated by the makers is better than 1 in 106 over a period of two hours. To diminish

PART I ATLANTIC, CARIBBEAN AND PACIFIC CRUISES 2 3
a possible influence of variations in voltage which may occur on board a submarine, the current was taken up via an Airmec Voltage Regulator type P 881.
Via an extra connection the crystal-clock was made to give a signal with a frequency of 50 clsec. This signal was amplified so that two small synchronous motors (A.E.G. type S.S.L.K. 375) could work on it, one for making the time-marks and one for controlling the rate of the crystal-clock by means of radio-signals. These synchronous motors made 6l/, r.p.s. For time-marking a directly driven wheel was used whose four spokes could interrupt the light band. Thus there were 25 interruptions per second which proved to make possible an accurate evaluation of the recordings. Some experiments were made, using a greater number of inter- ruptions per second, but this resulted in a confusing picture on the records, which might give rise to mistakes.
The radio time signal that was used for controlling the rate of the crystal-clock by the method described hereafter consisted of the 1 clsec pulses of Rugby MSF. For the measurements in the Caribbean and in the Pacific Ocean the signals from Beltsville WWV were used.
The control was performed by means of a stroboscope triggered by the one second pulses. This stroboscope projected its light upon a disk, driven by the second synchronous motor, on which a scale could be read. This stroboscope has been designed by professor EWING. If the crystal-clock is in time with the radio signal, the same point on the revolving scale is seen each second when the stroboscope lamp flashes on. The synchronous motor however made 6l1, revolution per second, and a transmission would have been necessary to let the disk make a whole number of revolutions per second. This difficulty was circumvented by dividing the disk into four quadrants, each quadrant bearing a scale from 1 to 100. When the crystal- clock is in time the same part of the scale is seen each second in successive quadrants.
After some training it proved possible to read the scale with an accuracy of two or three divisions. I t may be possible to improve this accuracy by very carefully balancing the disk and by using an appropriate optical reading device. As one division of the scale corresponds to 112500 sec, because 6l/, X 400 divisions pass per second, the accuracy can be valued at about 1 millisec.
During the measurements at De Bilt it was tried to read the time each quarter of an hour; during the expedition this usually happened every two hours and before and after each pendulum observation.
During the expedition the electrical equipment functioned without serious dif- ficulty. The rate of the crystal-clock as compared to the time-signal was constant over long periods, however at some occasions between gravity observations changes in the rate were observed, amounting to about 5 millisec per hour. The cause of this could not be ascertained.
2.3 The base-observations
Before and after the expedition base-observations were made at the base station in the Royal Meteorological Institute at De Bilt. The results, expressed in mean solar time units, are shown in the following table.

For the determination of the difference of the periods of the outer and middle pendulums, at the temperature to and pressure of one atmosphere, two separate observations, in which the left and middle pendulum were given equal but opposite amplitude, have been made :
Before the expedition September 1957
During the stay in C u r a ~ a o before and after the voyage two observations were made in the New Harbour. The station was called C u r a ~ a o IV to distinguish it from the other stations at Cura~ao, occupied by former observers. The results were:
After the expedition April 1958
l T D e Bilt
sec
0.5000258 0.5000260 0.5000259 0.5000257 0.5000261
Mean 0.5000259
TABLE 2.3-2
Before the expedition After the expedition 16 and 17 November 1957 2 1 and 22 December 1957
T D ~ Bilt sec
0.5000253 0.5000256 0.5000257 0.5000254 0.5000252
Mean 0.5000254
T88-T89
10-'sec
64 66 62 60 64
63
Before the expedition
Tcuratao IV Tcuratao IV Ta8-Tao
sec 10-'sec sec 10-'sec l l I
T88-T89
10-'sec
62 58 64 59 66
62
After the expedition
Mean 0.50074765 70 1 Mean 0.5007473 1 64
The results for the mean period T before and after the expedition, both in C u r a ~ a o and De Bilt, are not exactly the same. They differ 3.5 X 10⁻⁷sec and 5 X lO-?sec from each other.
Evidently a small disturbance has occurred in the stability ofthe pendulums during the trip and not during the transport from Holland to Cura~ao , and back. The adapted overall mean period in De Bilt is 0.5000256 sec M.T. and in Curaqao

PART I ATLANTIC, CARIBBEAN AND PACIFIC CRUISES 2 5
0.5007475 sec M.T. The difference amounts to 7219 X 10-?sec M.T. = 7239 X
10-?sec M.S.T., which is in good harmony with the values found in 1949 and 1951 (see page 16).
For the computation of the sea-stations the following constants have been used: T B = 0.5000256 sec M.T. gDe .,, = 98 1 268 mgal Tcura,a, = 0.5007475 sec M.T. gcuraGa, IV = 978441 mgal
For the computation of the corrections for deviation from isochronism the figures of TB,-TB, and TB,-TB, obtained in September 1957 were used. These corrections are so small that there is no reason to correct them for the slight difference found in April 1958.
2.4 The sea-stations
The observations were computed and reduced according to the directives given in [2]. The synchronous motor, interrupting the light 25 times per second, brought about a diamond-pattern on the recordings of the fictitious pendulums. By deter- mining the time interval between the recording of two points of the diamond- pattern it is possible to find the number of swingings corresponding to each diamond and hence the period of the pendulum movement. In practice the instants corre- sponding to three or four points a t the beginning of the record and to the same number at its end were observed.
The corrections for temperature and air-density were computed using the fol- lowing coefficients expressed in mean solar time units: C,, = 45.75 X 10⁻⁷ seci°C C,, = 46.94 X 10⁻⁷ seci°C C,, = 46.78 X 10⁻⁷ seci°C
D,, = 664.1 X 10-' seclunit density D,, = 671.4 X 10-' seciunit density D,, = 666.6 X 10⁻⁷ seciunit density
After the expedition at the North Sea (see part 11) Dr. COLLETTE suspected that the temperature coefficients C of the pendulums were no more correct. Therefore the mean of the differences between the two fictitious pendulums was determined for three temperature-intervals :
The table, however, shows that the only conclusion that may be drawn is that the variation in temperature during the voyage was too small to demonstrate a possible error in the coefficients C. However, comparing these differences with the
TABLE 2.4-1
Temperature TE8-T88 in 10-'sec

differences 62 X 10-'sec and 63 X 10-'sec obtained at De Bilt, where temperature fluctuated between 19°C and 20°C, in September as well as in April, it is safe to state these coefficients are in error. In spite of this the reductions for temperature were computed with the old coefficients mentioned above, because of the absence of more precise data.
For determining the atmospheric pressure a Paulin barometer of the submarine was used, which was calibrated before and after the expedition. The correction on 4th November was +3.4 mm and on 3rd January +3.0 mm. The mean +3.2 mm was added to all pressure readings to afford a comparison with a mercury barometer at De Bilt.
As already mentioned in 2.1 the curve of the damped pendulum, recording the tilt of the swinging plane, was very irregular. Therefore the /?-correction was deter- mined in two ways. Firstly, every half or whole minute, depending on the more or less regular behaviour of the curve, the distance between the @-curve and the middle of one of' the fictitious pendulums was determined. The mean of these distances, subtracted from the corresponding value found at the base-observations gave /? and the mean deviation from that mean gave a. Secondly, the axis of the /?-trace was drawn on the record and the amplitude was estimated. The mean of both results was applied.
- -
The horizontal second order corrections were estimated at twice the vertical but of opposite sign. The total second order corrections rarely amounted to more than two milligals and this magnitude was in good harmony with the values estimated by Dr. GILBERT from his observations en route from Colon to Cura~ao.
The remaining corrections do not give rise to special remarks. The topographic and isostatic reductions were computed at the Isostatic Institute in Helsinki.
2.5 Accuracy and comparison with earlier results
I t is difficult to give an impression of the accuracy of an observation since the influence of several factors is not known. As an example we can take the Eotvos- correction. The velocity of the current at the surface of the sea during the observation can be derived from the difference between the true position and the position obtained by dead reckoning over a period of about six hours. For a station not too near the coast it will be correct to assume that this velocity is constant during this period but it remains doubtful whether the velocity is invariable with regard to the depth of submerging. Near the coast this uncertainty counts still more. The uncertainty in the determination of the current enters fully in the EMvos-correction since the stations are all situated near the equator and thus the cosinus latitude factor equals unity. For this reason no special evaluation is given here, but reference is made to the estimation of EWING and VENING MEINESZ who indicate a standard deviation of about 4 milligals for a typical observation. In Cura~ao , Puntarenas and Balboa observations were made when the submarine was lying at anchor or alongside the pier. Although in a submarine harbour observations are the most difficult ones to carry out a comparison with observations carried out earlier in these harbours gives a rather satisfactory result, as will be seen below.

PART I ATLANTIC, CARIBBEAN AND PACIFIC CRUISES 2 7
Although the stations are not identical in the different years a comparison is possible because all stations are situated around the harbour and the surrounding area is rather flat, see Table 2.5-1 and Fig. 1, page 18.
Puntarenas
Station
At the beginning of the landing-stage near the harbour-office there is a gravimeter- station of the Geographical Institute of Costa Rica, determined with a Worden gravimeter, observer BLACK from Wisconsin University, see Table 2.5-2 and Fig. 3, page 20.
Serial number
Balboa
I n the harbour of Balboa there are several stations namely station V.M. 77 (1926) and the stations 271 and 27 1a of the American expedition with U.S.S. "Conger" (1947). The station 271a is identical with station 1016, both situated at pier 2; the same is the case for the stations V.M. 77 and 271, both situated at pier 15, see Table 2.5-3 and Fig. 4, page 22.
Year 1 Latitude I Longitude
l ' ? ' 1 3 .
Gravity ' Free-air go I anomaly
68O56'06"W 68"55'34"W 68O55'26"W
68"55'001'W
Cura~ao I Cura~ao I1 Cura~ao 111 Febr. '49
March '5 1 Cura~ao IV Nov. and
Dec. '57
978436 mgal 978439 mgal 978441 mgal 978442 mgal
978441 mgal
Latitude '?'
09"58'23"N
09"58'00"N
Serial Year number
12"06'24"N 12"06'58"N 12"06'45"N
12"07'00"N
+ 160 mgal + 163 mgal + 165 mgal + 166 mgal
+ 165 mgal
Free-air anomaly
+ 33 mgal
$22 mgal
Longitude 3.
84"49'55"W
84"49'32"W
Geographical Institute 1006
Serial number
U.S. 271 U.S. 271" V.M. 77 1016
Gravity go
978236 mgal
978225 mgal
Jan. 1952
Dec. 1957
Year
1947 1947 1926 1957
Latitude '?'
8"57.5'N 8"57.2'N 8"57.5'N 8"57.2'N
Longitude 3.
79"34.0fW 7g034.5'W 7go34.0'W 7g034.5'W
Gravity go
978234 mgal 978233 mgal 978247 mgal 978233 mgal
Free-air anomaly
$60 mgal $59 mgal + 73 mgal $59 mgal

Conclusion
The 1957 value in Balboa agrees very well with the values found by the American observers. I t confirms the supposition [ l , page 711 that the VENING MEINESZ ob- servation nr. 77 is in error.
In contrast with the good harmony at Cura~ao, the observations at Puntarenas do not agree so well, which is probably due to the less favourable circumstances prevailing during the observation 1006. The ship was exposed to strong waves coming straight from the ocean, which was clearly manifested in the irregular movement of the middle pendulum.
2.6 Interpretation by F. A. Vening Meinesz
The gravity observations nrs. 954-1032 (see Fig. 5), obtained by the "Walrus" expedition have been reduced at the Isostatic Bureau at Helsinki for topography and for isostatic compensation.
Fig. 5 Gravity Stations, expedition of Hr. Ms. ".Walrus"
Fig. 5a (overlay) Isostatic anomalies, T = 30, R = 0

PART I ATLANTIC, CARIBBEAN AND PACIFIC CRUISES 2 9
The gravity profiles (see page 34) show the anomalies for T = 30 km and for R = 0, R = 1 16.2 and R = 232.4 km. Before attempting an interpretation we shall examine the topographic and bathymetric map of the area surveyed. In doing so we see two preferred directions in the topography. One is found under an azimuth of about N35"E to N40°E and a second at about right angles to it. We find the first in the Andes north of the equator, the northern part of'the westcoast of S. America and its prolongation in the Carnegie Ridge, in the Panama part of the Isthmus, in the submarine ridge from Puntarenas to the Cocos and Galapagos Archipelago's in the submarine ridge NE of the island of Malpelo, in the Beata Ridge and in the broad submarine elevation to the WSW of Haiti and Jamaica. The second direction shows itself in the main part of Cuba, in the northwestern part of Haiti, in the other parts of the Isthmus, in two parts of the submarine ridge from the Isthmus towards Malpelo and in three curious parts of the Andes, viz. at the northern end and at 7" N.L. of the Andean ridge east of the Magdalene River and east of the Gulf of Maracaibo.
By making use of the gravity field in the Antillean region we can derive a geo- physical interpretation of the first of the two directions. This field is characterized by a belt of strong negative anomalies, running from the meridian of 65"W in Venezuela to Haiti. The crustal deformation in this whole belt can be explained by uniaxial compression in the crust in an azimuth of about N 35"E, which can best be accounted for by a movement in this direction of the South American continent relative to the Caribbean area [5, page 385 e. S.]. As the negative anomaly belt stops near Haiti, we may well suppose that the shear-plane on the NW side of the moving block coincides with the Beata Ridge and, further to the SW, with the Panama part of the Isthmus. We may perhaps surmise that this twisted part of the Isthmus has entirely been brought about by the shear movement of which in that case the total magnitude would equal the length of this part, i.e. about 200 km.
This movement of the South American continent may well be responsible for the previously mentioned ridges in this direction to the south of the Isthmus. Attributing these ridges to fault-planes caused by the movement, we can understand the presence of volcanic islands, as e.g. the Galapagos Islands on these ridges.
For the causes of this relative movement of the South American continent we have no doubt to look at the mantle. We must suppose that during the periods of tectonic activity the mantle is subject to convection-currents, which exert drag- forces on the crustal blocks in which the crust is divided [5, chapt. 1 l]. The currents are probably brought about by the earth's cooling. They have velocities of a few cm per year and, because of the plastic character of the mantle, make only a half turn. This takes about 40 - 60 million years, during which the crust is subject to tectonic activity. By bringing the cooled upper half of the mantle (having, because of thermal contraction, higher density) down and the warmer ma:ter (being there- fore lighter) up, the stability in the mantle is restored. A period of several hundreds of million years is needed before the mantle, because of the cooling at the outside and the warming up of the lower mantle by the core, is again unstable. A new period of tectonic activity is then possible. In the present period such activity is

going on and the crustal blocks have, therefore, a certain mobility of which the velocity is of the order of a few cm per year.
The second preferred direction in the topography may probably be explained as the result of the fact that a plane of maximum shear-stress in the crust must always be accompanied by a second plane at right angles to it in which a shear- stress of the same value works. If we assume the first plane to be near to vertical to the plane of the crust, and the direction of the shear-stress in this plane to be about horizontal, the second plane is also close to vertical and the direction of the shear-stress likewise nearly horizontal. We can, therefore, understand that it also gives rise to horizontal shear movements in the .crust and that these movements -
have a direction about perpendicular to the movements caused in the first plane of maximum shear-stress.
We now return to the gravity results cbtained by Hr. Ms. "Walrus". Examining the submarine ridges to the south of the Isthmus, which we attributed to horizontal shear-movements in the crust, we see that these ridges are about isostatically com- pensated; the gravity profiles crossing these ridges do not show important isostatic anomalies, especially not for the local isostatic reduction. This confirms our inter- pretation about the origin of these ridges by crustal shear-movements. The absence of strong stresses normal to these faultplanes explains the tendency towards isostatic equilibrium of the ridges. Some compression must, however, be there for accounting for the fact that these planes give rise to the formation of ridges.
For the ridges in the azimuth of about N 35"E this need not surprise us. The shear-movements going on along the San Andreas fault in California show the crustal block to the NE of that fault to move southeastwards with respect to the block on the oceanside. This movement leads us to surmise a mantle-current in this direction and we can understand that it gives crustal compression in the ridges mentioned.
The supposition of compression in this direction is corroborated by the Andean ranges north of the equator which have likewise an azimuth of about N 35"E and which also point to compression at right angles to this direction. We can derive another confirmation from a curious result given by all four gravity profiles on the westcoast of South America. I n each profile we see a fairly strong negative anomaly in the station just outside the coast, i.e. in the stations Nrs. 963, 966, 983 and 987, while the same is shown by the station 965, 984 and 985, over shallow water, between the profiles. For the four stations in the profiles we obtained the anomalies:
I Anomalies (expressed in mgal)
Stations I T = 30 km

PART I ATLANTIC, CARIBBEAN AND PACIFIC CRUISES 3 1
I t seems probable that we can draw a parallel between these stations and two comparable stations to the southeast of the island of Timor in the Indonesian Archipelago. The corresponding profiles nrs. 11 and 12 [4] gave in the stations Nrs. 2 12 and 2 17, respectively, the following anomalies :
Anomalies (expressed in mgal) Stations ~
Indonesian 1 T = 30 km
Both sets of gravity profiles run towards strongly rising coasts. The Andes as well as Timor show clear evidence of rapidly increasing elevation. For Timor we know the cause of this rising. This island is situated in the belt of strong negative anomalies in the Indonesian Archipelago [4, maps 1, 2 and 31 which is probably caused by the downbuckling of the earth's crust under the effect of the horizontal compression of the crust by a current-system in the mantle. I n this belt the com- pression presses the crust down far below its isostatic equilibrium. This brings about a strong deficiency of matter, which reveals itself by the negative anomalies. I n a recent period the compression must have shown a decrease and as a result of this, the crust, in some parts of the belt, has been able to readjust by rising its isostatic equilibrium.
The most spectacular rising was shown by the island of Timor, which rose above sea-level and in its highest point attained an elevation of 2920 m. The gravimetric survey, carried out by DE SNOO [6, pages 2 1 1-2 171 has shown that the island not only reached isostatic equilibrium but that it now shows positive anomalies of more than 150 mgal. We may conclude [5, page 3751 that since the stress-release leading to the rising of Timor, a new period of compression occurred which led to a wave-formation here of the crust of shorter wave-length than that of the down- buckling ofthe crust elsewhere in the anomaly-belt. This leads to the further pressing upwards of the island and the downpressing of the adjacent belt to the southeast of it, thus causing the high positive gravity anomalies in Timor and the negative ones to the southeast, mentioned above. The fact that actually crustal deformation in the Archipelago is going on, is demonstrated by the shear movement in Sumatra, occurring during earthquakes, where the Sumatran crustal block moves towards the SSE with regard to the westcoast of that island and the adjoining Indian Ocean crustal block.
The writer of this paper thinks, that on the westcoast of the Andes in the area surveyed by Hr. Ms. "Walrus", a similar phenomenon takes place. The Andes have shown strong recent rising, and we may well assume that the compression towards the SE, of which we found evidence, causes a wave-formation of the crust
Archipelago
near the coast of South America of fairly short wave-length, pressing down the
R = 0 km l l
R = 116.2 km R = 232.4 km

crust in a narrow belt just outside the present coast, as demonstrated by the negative gravity anomalies mentioned above, and further pressing upwards the Andes coastal range.* The writer must, however, emphazise the tentative character of this explana- tion, based on the comparison of this area to that near the island of Timor. A better founded interpretation must wait till the gravimetric and geologic survey of the Andes is further advanced.
Before leaving the gravity field in the Pacific, the writer may draw attention to the field of positive anomalies over the basin south of Panama. It is shown by the gravity profiles 6 and 7 over Panama, where we see that it gets less towards the south southwest. We see it strongly in profile lb, at right angles to the South American coast, but in profile 2 it has a smaller value, in profile 3 it is still less and in profile 4 it has practically disappeared.
This field of positive isostatic anomalies may perhaps be compared to similar positive fields over the deep basins of the Indonesian Archipelago, i.e. the southern and northern Banda basins and the Celebes Sea. We find them also over deep basins in other island-arc areas, as e.g. over the Caribbean Sea. Most of these basins show evidence of having recently subsided to great depth. This has, e.g. in the last few years also been demonstrated by FALLOT and KUENEN for the Medi- terranean basin south of the French and Italian Riviera, which can likewise be considered as an island-arc basin [7]. If such a recent subsidence could also be proved for the basin south of Panama, our comparison would receive important further support. In that case the explanation of the origin of the island-arc basins by convection-currents of moderate size in the subcrustal mantle layer, could probably also be applied here. This explanation is based on the consideration that the concentration of crustal matter in the arc - which we know to have a greater percentage of radio-active matter than subcrustal rocks - slowly leads to a heating up of this underlying mantle matter and, therefore, to a convection-current rising under the surrounding arc and subsiding under the basin. Such a current could account for the origin of the basin [5, par. 11-2 and 11-10], [8] especially because at a depth of 500-900 km such currents would bring about a change of modification of the Iron-Magnesium-Silicate of which the mantle for a great part consists and which gives a greater decrease of volume in the area where the subsiding current occurs, i.e. in the area inside the arc, than the thermal effect of convection alone can produce. This could as well account for the rapid sinking down of the basin as for the positive gravity anomalies over that basin.
I t is interesting to see that towards the SSW the basin is less enclosed by tectonic ranges than further to the NNE. This may well be the cause of the disappearing towards the SSW of'the positive anomalies.
The gravity profile 5, running towards Puntarenas (Costa Rica), does not show any important gravity anomalies. In the curve of local isostatic anomalies, station
*) Perhaps these effects near Timor and along the Andes are not brought about by a smaller wave- formation, but by thrust faulding along a shear-plane dipping down under Timor and under the Andes, lifting up these mountain ranges and depressing the adjacent belts. This would likewise cause positive gravity anomalies in the mountain ranges and negative anomalies in the adjacent belts. The fault-planes may have been brought about by the crustal downbuckling leading to the origin of the ranges.

PART I ATLANTIC, CARIBBEAN AND PACIFIC CRUISES 33
1004, just outside the shelf, shows a negative anomaly, but it has only a value of- 19 mgal. Perhaps this anomaly has the same significance as those along the westcoast of South America, but its value is so small, that it hardly permits such far-reaching conclusions.
We shall now turn our attention towards the gravity results obtained on the Caribbean side of the Panama Canal. In profile 6 we see a fairly large negative anomaly in station 101 7. If our hypothesis is right about the Isthmus of Panama being brought about by one of the main faultplanes of the crust, along which the north-northeast-ward shift of the South American continent with respect to the crustal block to the WNW of it takes place, it seems obvious .to attribute this negative anomaly to the shear-movement. I t may be caused by a slight overriding of the South American block over the other block.
The stations 1018 - 1022 do not show large anomalies, especially not in the field of local isostatic anomalies. In the field of regional anomalies, R = 232.4 km, it is slightly positive. These results check well with the field in the eastern part of the Caribbean; the positive anomalies are slightly larger there. Profile 8 at right angles to the South American coast to the SW of Cartagena does not show great anomalies; the anomaly value decreases somewhat towards the coast.
Profile 9, on the contrary, shows spectacular values. Station 1028, north of Baranquilla, is still about normal, but the stations 1029-1032 all show strong negative values. In station 1030 the anomaly for local isostatic reduction is even - 126 mgal and for R = 232.4 km - 1 19 mgal. This deepest value faces the WNW- ward continuation of the Andean range to the west of the Gulf of Maracaibo. For interpreting these great negative anomalies we can make use of the gravity map of the Antillean area, edited by the Geophysical department of the "Bataafsche Petroleum Maatschappij" at The Hague. We see that the negative anomalies of profile 9 are the continuation of the belt of strong negative anomalies running from east of the island of Curasao, north of the islands of Bonaire, Cura~ao and Aruba, and north of the coast of Columbia. This belt seems to end abruptly between stations 1029 and 1028; it does not there enter the main land of South America, except with some weak negative anomalies which appear to connect it with an irregular and partly weak negative belt, more or less following the valley of the Magdalena River.
The belt of strong negative anomalies, of which Hr. Ms. "Walrus" has found the western continuation, combined with the strong negative belt running from the area of Venezuela south of Santa Margarita via Trinidad, Tobago and Barbados and outside the Antilles up to the southeast part of Cuba, form the belts of great crustal downbuckling, which can be interpreted as being caused by the NNE movement of the South American continent with regard to the adjacent area. The Andean ranges north of the equator can probably be explained as great faultplanes, along which the movement, possibly combined with the overriding of one side over the other, takes place. The curious WNW parts of these ranges could then be accounted for as the effect of the great compression, caused by the movement. The greatest negative anomaly, found in station 1030, could thus be explained. The fact that in the Caribbean further away from the coast, no continuation of

such large negative anomalies has been found, can probably be accounted for by the Beata Ridge faultplane, continuing towards Panama, which separates the crustal block to the NW of that plane from that compressed in the area near sta- tion 1030.
These considerations finish the interpretation offered here of the gravity results obtained by Ir. BAKKER and Ir. OTTO, the scientists of the expedition of Hr. Ms. submarine "Walrus" of the Netherlands Navy. From the scientific side one of the main objects of this expedition was to get more data in the Isthmus area, as well as to the north and south of it, about the supposed relative movement of the South American continent to the NNE with regard to the Caribbean area. I t must here be mentioned that this supposition is based on the gravity field over the Antilles and in the Caribbean which for the greatest part has been observed by MAURICE EWING, LAMAR WORZEL, LYNN SHURBET and other collaborators of EWING and partly also by HARRY HESS on board of submarines of the U.S. Navy, U.S.S. 42, Barracuda, and Conger. This important scientific work may thankfully here be acknowledged.
One of the further objects of the expedition was to get more data about the way different Andean ranges seem to end a t the northcoast of South America. Lastly it was intended to measure gravity along the Pacific coasts of Costa Rica, Panama, Columbia and Ecuador.
As the above interpretational attempt may show, the results allow conclusions and hypothesises of great importance and so sincere thanks are due to the officers and crew of Hr. Ms. "Walrus", to the authorities of the Royal Netherlands Navy, and to the scientists who carried out the observations.
References
[l] Memorial volume on the occasion of the 70th Anniversary of Professor Vening Meinesz. Transac- tions of the Geological Section of the Koninklijk Nederlands Geologisch Mijnbouwkundig Genootschap. No. XVIII. N.V. Boek- en Kunstdrukkerij v/h Mouton en Co., 'S-Graven- hage 1957.
[2] VENING MEINESZ, F. A., Theory and Practice of Pendulum Observations at Sea. Waltman, Delft. 1929.
[3] vENING MEINESZ, F. A., Gravity Expeditions at Sea 1934-1939. Volume 111. Waltman, Delft, 1941.
[4] VENING MEINESZ, F. A., Gravity Expeditions at Sea 1923-1938. Volume IV. Delftsche Uit- gevers Maatschappij, Delft, 1948.
[5] VENING MEINESZ, F. A. and HEISKANEN, W., The Earth and its Gravity Field. McGraw Hill, New York, 1958.
[6] TEXEIRA, CARLOS, AS anomalias da gravidade na parte portuguesa de ilha de Timor, Garcia de Orta, vol. I, 1954.
[7] KUENEN, PH. H., FAURE-MURET, A., LANTEAUME, M. and FALLOT, P., Observations sur les flyschs des Alpes Maritimes. Bulletin GCodtsique de France, t. VII, 1957.
[8] MEIJERING, J. L. and ROOYMANS, C. J. M., On the Olivine-Spine1 Transition in the Earth's Mantle. Proc. Koninkl. Ned. Akad. v. Wetenschappen, Ser. B, 61, No. 5, pages 333-344, 1958, Amsterdam.

rngal
Prof i le no. l a
rngal
+ 6 0
+ 4 0 .............. ....................................................................................... .........7/.<I ................................... 1 1 -C.---.\_
K ,H/--- . \
................................................................................. d:xs. . \ -Y: ... L...........
977 9% 979 980 961 9a2 983
Prof i le no. 3
mgal + 6 0 .................. ................................................................................... ................... ,.--. . -. + 4 0 ......................................L...... ....L ................ ......
Puntarenas
P ro f i l e no. 5
mgal
mgal + 100 .......
mgal + 20 .... .- .........................................................................................................
*.-
1022 1023 1024 1025 1026
P r o f i l e no. 8
P ro f i l e no. 9

mgol +l20 ... ... ,-.- . +l00 ............ > -... ..............................................
/ \
. . 961 962 963 964 Buenoventuro
P ro f i l e no. l b
mgol + 40 ....................................................................................................................................
P r o f i l e no. 40
mgol +l00 .................................
+ 80
mgol +40 .................... ...
mgol ,100 ........................................................................................................................................................................................................
+80 ............................................................................................................................. . . - ...........................................................................
P ro f i l e no. 6
local isostat ic anon
- . - . - . -. -. -. - . - regional i sos ta t i c I
------------- regional i sos ta t i c
0 100 I
hor izonta l sca le 1
ver t i ca l scale 1
l i n e - i n t e r v a l i n o
bfi le no. 9

Pro f i l e no. 2
I
994 99 3 982 961 980 969 9;e 987
P r o f i l e no. 4 b
mgal +go ..........................................................................................................
A--- ................................. ....... , ............... - - .....................................
1015 1014 1013 1012 972 Panama
P r o f i l e no. 7
local isostat ic anomal ies, T = 3 0 km . R = 0 km
regional i sos ta t i c anomal ies. T = 3 0 km , R = 116.2 km
reg ional i s o s t a t i c anomal ies, T = 3 0 km. R = 232.4 k m
0 100 200 300 k m l I
ho r i zon ta l sca le 1 : 5 0 0 0 0 0 0
ve r t i ca l scale 1 : 5 0 0 0 0 0
l i n e - i n t e r v a l i n oceans = 1 0 0 0 m = 10 mgal


ATLANTIC, CARRIBBEAN AND PACIFIC CRUISES
3 TABLES
The results of the observations are given in the following tables. They are published in the same way as in Gravity Expeditions at Sea, 1923-1938, vol. IVY except the two essential differences, already mentioned in the Introduction, page 9.
Besides the columns with the mean errors are omitted. Table 1 contains the free-air and isostatic anomalies with regard to normal
gravity values according to Cassinis' formulae. The columns are:
1. Station-number 2. Latitude 3. Longitude 4. Seadepth in metres 5. Free-air anomaly 6. Local Airy anomaly, T = 30 km 7-1 1. Regional Airy anomalies for different radii, T = 30 km.
Table 2 contains the effects of topography and compensation. The columns are:
1. Effect of topography, zones A-0, 2. Local Airy reduction, effect of compensation, zones A-0,, T = 30 km 3. Local Airy reduction, effects of topography and compensation, zones 18-1,
T = 30km 4-13. Idem for Regional Airy reductions for different radii, T = 30 km.
The computation of the topographic and isostatic corrections has been done by the Isostatic Institute at Helsinki and partly by the Geophysical Department of the N.V. Bataafsche Petroleum Maatschappij.
Sincere thanks are expressed to both Institutes for their computations. The elaboration of the observations was done at the Delft Geodetic Institute.

TABLE 1 Free-air and isostatic anomalies
Latitude
'P
Longitude 1
Cura~ao I11 2050 3260 900
2910
50 2055 1830 21 15 1307
3716 3855 380 1 2940 1631
Paramaribo 82
3260 3803 4102
4331 4717 4855 2735 3873
433 1 4351 5177 5567 5710
5378 5577 4880 4870 4870
1680 3050 200
4400 4400
4400 4650 4840 5030 5190
Depth in
metres
Anomalies in milligal --
Free- air

PART I ATLANTIC, CARIBBEAN AND PACIFIC CRUISES 3 7
TABLE 2 Effects of topography and compensation
~ Reductions in 0.1 milligal
Topog. comp. t + c A-0, 18-1
- 579 -185 -1085 -200 -1983 -214 -1173 -213 -1560 -193
R = 29.05
comp. t + c A-0, 18-1
- 602 -185 -1069 -200 -1981 -215 -1199 -214 -1520 -193
cornp. t + c A-0, I 18-1
cornp. I t + c A-0, 1 18-1 t+c I A-0, 1 18-1

Nr.
890 891 892 893 894
895 896 897 898 899
900 901 902 903 904
905 906 907 908 909
910 911 912 913 914
915 916 917 918 919
920 921 922 923 924
925 926 927 928 929
930 931 932 933 934
Latitude
P
25O22.5' N 24O32.5' N 23O37.5' N 22O56.5' N 22"09.0' N
21°25.0' N 20°24.0' N 19O38.0' N 19"Ol.O' N 18O58.5' N
19"OO.O' N 19"02.0f N 18O57.0' N 18"22.0f N 17O44.5' N
17O07.0' N 16O31.0' N 13O37.0' N 13O04.0' N 12"24.0r N
11°46.0' N 10°57.5' N 10°42.5' N 1l011.0' N 12"06'45"N
12"OO.O' N 13O19.8' N 14"16.01 N 15O13.0' N 17O52.0' N
18O30.0' N 19"30.0f N 24"33'05"N 26"08.0f N 26O27.0' N
26O51.5' N 26O47.0' N 27O02.5' N 27O18.0' N 27O36.0' N
27O50.C' N 28O07.5' N 28O22.0' N 28O39.0' N 28O52.5' N
TABLE 1 Free-air
Longitude 1
27O24.0' W 29O29.0' W 31°51.5' W 33O32.5' W 35O46.0' W
37O24.5' W 39O29.5' W 41°23.5' W 43O32.5' W 45"OO.O' W
46O29.0' W 47O59.0' W 49O30.5' W 51°31.0' W 53O32.5' W
55O37.0' W 57O38.0' W 63O40.0' W 64O36.5' W 64O56.5' W
65O20.0' W 65O51.0' W 66"OO.O' W 66O48.0' W 68"55'26"W
69O14.5' W 69O51.5' W 69O56.0' W 70°02.0' W 74O47.5' W
74O47.0' W 74O29.0' W 8lo48'30"W 75O37.0' W 74O05.0' W
72O22.0' W 70°44.0' W 68O38.5' W 66O41.0' W 64O40.5' W
62O48.0' W 60°37.0' W 58O52.0' W 56O34.0' W 54O42.0' W
and isostatic
Depth in
metres
5320 5680 5790 5370 6070
5450 5100 5230 3940 3600
3565 3600 4410 5095 4560
5700 4550 1370 3250 4400
2950 330 220 700
Curaqao 111
1300 3170 4290 3940 1600
1650 3180
Key West 4710 4800
5180 5520 5510 5490 5150
5365 6000 5750 5990 5860
anomalies (continued)
Free- air
- 20
- 11
- 8
- 2 5 - 5 - 16
- 13 - 6 - 20 - 26 - 8
- 41
+ 2 1 0
-100
- 89
- 2 1
+l66
- 35 - 97 - 58
- 7
+ 8 - 98 + 25 - 2 3
0
- 4 1 - 43 - 26 - 3 1 - 7 - 2
- 1 7 - 2 1 - 2 5 - 2 7
Anomalies in milligal
R=O
- 17
+ 10
+ 3
- 1 0 - 5 - 22
- 13 - 2 3 - 19 - 22 - 1 9
- 31
- 1 1 + 9 - 4 6
- 40
- 2 1
+ 96
- 15 - 87 - 47
- 2 8
- 18 - 52
- 1 + 9
- 3 6 - 36 - 17 - 1 7
- 1 1 - 2 0 - 1 7 - 1 5
29.05
- 16
+ 18
+
- -
- 21
- l1 - 2 4 - 18 - 20 - 2 0
- 27
- 1 2 + l 0 - 3 9
- 35
- 2 1
+ 94
- 13 - 86 - 47
- 2 8
- 18 - 48
+ 2 + l 1
- 3 5 - 35 - 14 - 1 1
- 9 - 2 4 - 1 4 - 1 0
58.1
- 18 - 6 + 1 + 4 + 3 + 4 + 6 + 8
+ 24 - 4 + 3 + 6 + 6 + 5 + 7 + 6
8 + 1 0
- 9 - 7 - 5 - 7 - 9 - 9 - 8 - 4 - 3 - 2 - 5 - 6 - 4 - 2
5 - 2 4 - 6
- 2 3
- l1 - 2 9 - 20 - 22 - 2 6
- 27 + 2 5 + 9 + 5 - 6 - 8 - 5 - 1
- 1 6 + 9 - 3 1
- 29 + 1 7 + 7 + 8 + 7 + 5 + 2 - 4
- 2 0 - 7 + 7 + 8 + 1 0 + 1 0 + 9 + 4
+ 88
- 11 - 86 - 48
- 5 - 5 - 4 - 8 - 1 0 - 1 0 - 8 - 3 1
- 21 - 42
+ 2 + 9 +
- 3 8 - 36 - 14 - 8
- 3 - 2 - 1 - 4 - 6 - 6 - 5 - 1 1
T = 3 0 k m
116.2
- 19
+ 26
+ l 2
- 8 - 25
- 13 - 3 1 - 21 - 22 - 3 0
- 25
- 2 3 + l 2 - 2 2
- 26
- 2 2
+ 85
- 12 - 85 - 48
- 3 3
- 26 - 34
0 - 1 - 2 - 6 - 7 - 8 + 7
- 3 9 - 37 - 14 - 8
0 - 1 - 3 - 6 - 9
- 1 0
p - 17
+ 25
+ l 6
0 + 3 + 4 - 1 1 - 26
- 16 - 2 8 - 22 - 21 - 3 1
- 21
- 3 4 + 2 1 - 7
- 23
- 2 7
+ 84
- 16 - 79 - 41
- 3 7
- 32 - 21
+ 2 2 8 + 1 0 + 1 1
- 3 7 - 35 - 14 - 1 1
- 5
- 15
+ 22
+ 2 1
- 1 3 - 28
- 2 1 - 2 6 - 22 - 19 - 3 2
- 17
- 4 1 + 2 9 + 6
- 19
- 34
+ 79
- 22 - 75 - 28
- 4 2
- 34 - 14
+ 4 6
- 3 5 - 33 - 14 - 1 4
- 2
PART I ATLANTIC, CARIBBEAN AND PACIFIC CRUISES 39
TABLE 2 Effects of topography and compensation (continued)
~ Reductions in 0.1 milligal

Nr.
TABLE 1 Free-air and isostatic anomalies (continued) I I I
Latitude
'P
Longitude I,
Depth in
metres
I Anomalies in milligal
i I Free- i 1 air 1- R=O 1 29.05 ( 58.1 1 116.2 1 174.3 ( 232.4

PART I ATLANTIC, CARIBBEAN AND PACIFIC CRUISES 4 1
TABLE 2 Effects of topography and compensation (continued)
T O ~ O g
$3648 $3521 +3125 $2910 $2234
$2042 $1989 $1802 $1974 $2240
$2050 $2319 $2430 $2511 $2640
$1836 + 410 $2541 $1143 $ 47
$ 126 $1623 $2109 $1897 $2087
$2132 $2228 $2457 $ 1036 $ 445
+l083 $ 94 $1678 $2246 $2016
$ 935 $ 653 $2063 $2119 $1934
$2139 $2099 $2068 $1187 $2052
milligal
R = 116.2 R = 174.3 R = 232.4 TiG+FbT- p-
R = 0 ' R = 29.05 --
corn~ . l t i c l C O ~ ~ . l t + ~ A-O2
-3224 -3116 --2796 -2437 -1947
-1740 -1700 -1684 -1817 -1889
-1794 -2009 -2094 -2169 -2217
-1819 -1201 -2129 - 948 - 601
- 275 - 970 -1662 --l822 -1692
-1861 -1868 -1750 - 937 - 403
- 912 - 4 1 3 -1321 -1844 -1751
-1239 -1215 -1648 -1705 -1914
-1874 -1817 - 1803 -1503 --l654
Reductions in 0.1
R = 58.1
C O ~ P . 1 t + ~ 18-1
-1111 -1072 - 985 - 916 - 807
- 813 - 812 - 811 - 798 - 783
- 774 - 785 - 818 - 835 - 820
- 796 - 778 - 753 - 737 - 368
- 256 - 269 - 265 - 396 - 532
- 419 - 262 - 141 - 26 $ 63
A-O2
-3222 -3124 -2824 -2391 -1948
-1731 -1689 -1710 -1812 -1782
-1796 -2007 -2084 -2156 -2177
-1878 -1350 -2095 - 939 - 654
- 303 - 927 -1581 -1825 -1638
-1837 -1828 -1606 - 923 - 445
- 898 - 5 0 1 -1285 -1779 -1700
-1297 -1267 -1576 -1646 -1890
-1867 -1836 - 1789 -1555
18-1
-423 -415 -396 -379 -359
-358 -357 -357 -355 -353
-350 -350 -362 -354 -346
-344 -337 -327 -325 -164
-134 -122 -113 -141 -184
-142 - 83 - 39 - 3 $ 28
$ 11 $ 1 0 - 36 - 92 -136
-185 -207 -220 -222 -221
-223 -235 -239 -240 -215
18-1
-412 -404 -385 -370 -351
-350 -349 -349 -347 -345
-342 -342 -354 -345 -337
-335 -329 -319 -317 -161
-126 -121 -110 -138 -178
-137 - 81 - 38 - 2 $ 28
$ 10 $ 9 - 35 - 89 -132
-179 -200 -213 -215 -216
-218 -230 -232 -233
18-1
-644 -629 -590 -557 -510
-511 -511 -510 -506 -500
-496 -497 -525 -516 -501
-496 -487 -471 -465 -230
-172 -173 -16q -22 -30,
-237 -141 - 70
0 $ 54
$
18-1
-409 -402 -383 -368 -349
-348 -347 -347 -345 -343
-340 -340 -352 -343 -335
-333 -327 -317 -315 -161
-126 -121 -111 -140 -176
-136 - 80 - 37 - 1 $ 30
$ 11 $ 9 - 34 - 89 -123
-180 -200 -212 -216 -216
-219 -229 -232 -231 -208
A-0,
-3005 -2918 -2635 -2241 -1812
-1672 -1628 -1642 -1717 -1732
-1676 -1857 -1955 -2027 -2026
-1742 -1507 -1881 -1085 - 655
- 400 - 821 -1282 -1684 -1511
-1657 -1460 -1234 - 804 - 476
- 766
A-O2
-3183 -3091 -2797 -2360 -1926
-1731 -1689 -1715 -1826 -1844
-1778 -1983 -2064 -2137 -2146
-1865 -1428 -2042 -1006 - 667
- 376 - 898 -1460 -1798 -1605
-1789 -1683 -1426 - 892 - 493
- 859
A-0,
-2527 -2455 -2217 -1897 -1530
-1432 -1393 -1401 -1450 -1463
-1419 -1566 -1655 -1717 -1713
-1467 -1263 -1573 - 980 - 563
- 356 - 686 -1048 -1409 -1286
-1390 -1186 -1001 - 664 - 404
A-0,
-3207 -3104 -2792 -2411 -1939
-1730 -1689 -1685 -1817 -1874
-1787 -1999 -2078 -2152 -2190
-1831 -1247 -2105 - 941 - 622
- 284 - 949 -1622 -1810 -1658
-1836 -1841 -1690 - 926 - 414
- 900 - 4 4 9 -1300 -1812 -1711
-1247 -1220 -1612 -1672 -1891
-1855 -1829 - 1801 -1510
18-1
-473 -462 -440 -421 -395
-395 -395 -394 -392 -389
-385 -385 -401 -392 -384
-379 -374 -363 -360 -181
-138 -134 -126 -163 -212
-163 - 97 - 46
0 $ 36
$ 14 -607 -1084 -1430 -1528
-1358 -1304 -1389 -1504 -1651
-1724 - 1724 - 1628 -1483 -1446
- 5 9 8 -1209 -1639 -1663
-1366 -1337 -1494 -1604 -1812
-1855 -1825 - 1748 -1570 -1554
$ - -1 -2
-3 -3 -3
$ 14 - 40 -105 -145
-212 -236 -251 -250 -249
-251 -264 -275 -270 -244
-340 -333
-330 -351 -365 -366 --338
-1282 -1378
-1446 -1457 - 1368 -1256 -1217
- 555 - 550
- 535 - 577 - 604 - 615
576

*. N
~~
NN
~
I-
WI
T)
~
r-
z~
iz~
-
r-
m~
*
-0
-O
N
*m
m+
+
NQ
~O
OO
W-
NW
O
r-lr)*rr)* m
m~
~+
w
=m
--
N
m
~m
--
~N
N~
N
m
m-
N
-m
m~
N
-m
m-
+++ I I
1 + 1 ++
++
+I
+ I
I I
++ +
++
+I
I I
+++ + 1 ++ 1 +
+I
++ +++++
++
I I
l
1+1++ +
++
I I
I
I I+
+
++
++
I I
+
++ +
[+
+l
+
+l
+l
+
[+
+I
LC
*
~L
ON
O
I~
)*
*w
-
~-
1r
)m
m N
N*
~I'- N
O*^-
~-
*L
oz
~
--
m0
3
~N
W-
W N
*~
*z
N
* m
wm
--
N
N
-4
-N
N
N
-N
~N
m
+m
z+
mw
m
mm
om
*
r-
zm
m~
-
+m
mm
_
~m
22
~
-N
W~
I-
-
m-
-a
m
r-
m~
o~
m
-+
or
-
m-
-
m~
m
NN
N
O
mm
--
m
r-
or
-m
m
NN
m
+l
1
+1
]
+I
++
l
1 1
+1
+
++
+l
++
+I+
I
+I
++
1++1
I
++
I I
I
I I
+
I
cd .* 3
a a
E a
&.9Z
n
E 9
3 PI
e, PI
.b
4 3 3
33
33
33
33
3 3
33
33
33
33
3 3
33
33
35
33
3 3
33
33
33
33
3 3
33
33
Y
4
.& *
e
:,
m
r-
mb
*
~N
W-
W C
OQ
~~
T)
m~
mm
c?
*
WW
W*
I
-~
W-
N
~O
OW
- W
*L
O~
N m
~0
mm
W
g zffg
?g
ZffgEY
ZX
fPz C
fAgC
f ZgS
C f ffzf
f Y
zff6 ?
g?gE
'2:2
E$
cl 4
ww
wr
-W
w
r-
ww
w
ww
ww
w
ww
ww
w
ww
ww
w
ww
ww
w
ww
ww
w
r-
r-
wa
r-
r-r-r-r-r-
F9
U
ZZ
ZZ
Z
Zm
mm
Z
ZZ
ZZ
Z
ZZ
ZZ
Z
ZZ
ZZ
Z
ZZ
ZZ
Z
ZZ
ZZ
Z
ZZ
ZZ
Z
ZZ
ZZ
Z
a 3
. W a
*m
m~
*
++
+h
+ a+
++
O
-N
~C
O W
++
;?
WN
WC
O~
:h
+$
;?
-m
mo
++*a W
W~
WO
+g;.- N
CO
O~
~
++
++
a m
~w
m~
+
h+
++
W
~W
-N
+++a;? ---N
I--
2
TT
YT
F
P9
aP
a F
a9
9F
a
9Y
99
9
ca
a9
7
T9
9P
ca
P
YT
ca
F
F9
99
9 P
acaP
ca
N---0
O
NO
00
O
-d
Nm
*
*"r)lr
)W
W
bW
WQ
,
QiQ
icO
CC
b
bW
OW
b bcO
Qizz =
==
=z
0-
mm
*
rr)wt.C
Om
0
-m
m*
Ir)w
t.CO
m
O-
Nm
*
ma
r-
wm
0
-m
m*
m
ar
-w
m
0-
mm
*
ww
ww
w
ww
ww
w
mm
mm
m
mm
mm
m 0
00
00
0
00
00
----- -
--
3-
N
NN
NN
hl
mm
mm
m
mm
mm
m
mm
mm
m
mm
mm
m z
zz
zz
zz
zz
z z
zz
zz
zz
zs
s z
zz
zz
+

PART I ATLANTIC, CARIBBEAN AND PACIFIC CRUISES 43
TABLE 2 Effects of topography and compensation (continued)
1 Reductions in 0.1 milligal
Topog. cornp. A-0,
cornp. A-0,
comp. t+c A-0, 1 18-1
-1528 -266 -1287 -146 - 824 - 65 - 663 + 2 - 629 - 22
cornp. t+c A-0, 1 18-1
-1275 - 448 -1060 - 253 - 704 - 117 - 5 6 9 - 13 - 537 - 48

GRAVITY EXPEDITIONS, 1948-1 958, VOL. v
TABLE 1 Free-air and isostatic anomalies (continued)
Nr.
1025 1026 1027 1028 1029
Latitude
V
10°17.6' N 10°06.3' N 11°01.6' N 11°23.6' N 1 1°39.8' N
11°51.5' N 12"12.0f N 12O28.7' N
Longitude 1
' 76O28.2' W 76O02.9' W 75O31.5' W 75O02.1' W 74O37.0' W
74"lO.O' W 73O04.1' W 72O10.7' W
Depth in
metres
2450 400 860
1500
-124 - 4 1 - 5 1
Anomalies in milligal
l Free- I T = 30 km
- 82 - 82 - 81
-124 - 4 5 - 5 9
air 1 R=O 129.05 58.1
- 9 - 2 6 - 3 1
- 5 - 2 - 2 - 2 - 4 - 5 - 6 - 81
-120 - 4 8 - 6 9
- 1 1 - 2 2 - 2 7
- 4 0 + 8 - 4
-119 - 51 - 77
- 1 3 - 2 1 - 2 6
116.2 r1-
- 80
- 3 - 3 3 - 4 0
- 77 - 75
+ 5 - 3 7 - 4 6
+ l 2 - 3 9 - 4 8

PART I ATLANTIC, CARIBBEAN AND PACIFIC CRUISES 45
TABLE 2 Effects of topography and compensation (continued)
Reductions in 0.1 milligal

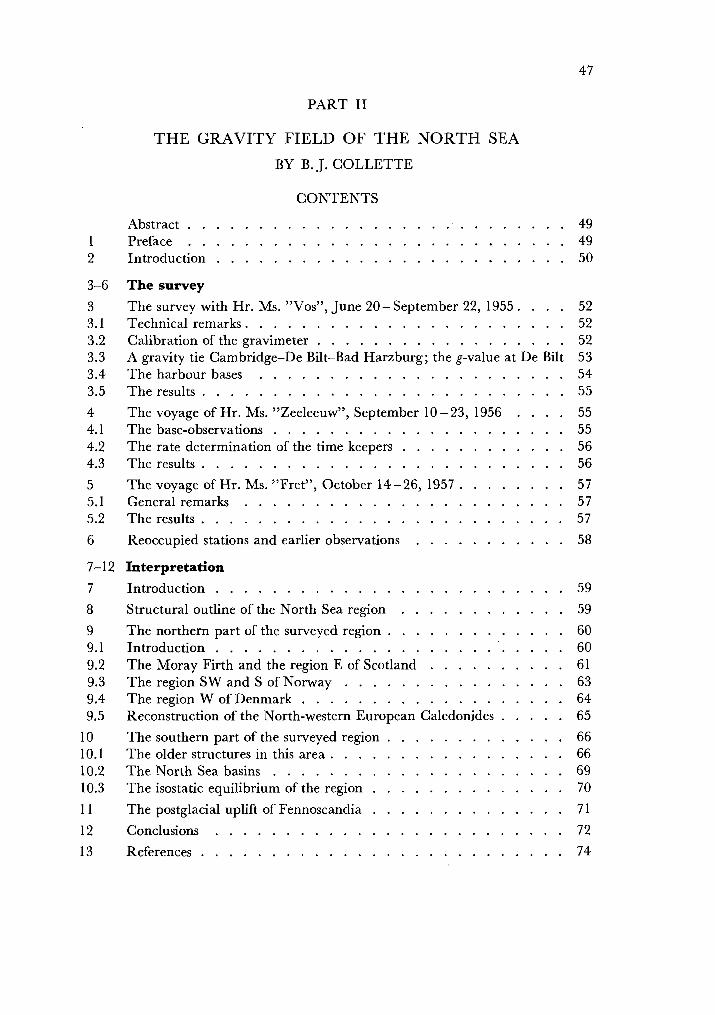
PART I1
THE GRAVITY FIELD OF THE NORTH SEA
BY B . J . COLLETTE
CONTENTS
. . . . . . . . . . . . . . . . . . . . . . . . . . . Abstract 49
. . . . . . . . . . . . . . . . . . . . . . . . . . . 1 Preface 49 . . . . . . . . . . . . . . . . . . . . . . . . . 2 Introduction 50
The survey
. . . . The survey with H r . MS . "Vos". June 20- September 22. 1955 52 . . . . . . . . . . . . . . . . . . . . . . . Technical remarks 52
. . . . . . . . . . . . . . . . . . Calibration of the gravimeter 52 A gravity tie Cambridge-De Bilt-Bad Harzburg; the g-value at De Bilt 53
. . . . . . . . . . . . . . . . . . . . . . The harbour bases 54 . . . . . . . . . . . . . . . . . . . . . . . . . . The results 55
. . . . The voyage of H r . MS . "Zeeleeuw". September 10 -23. 1956 55 . . . . . . . . . . . . . . . . . . . . . The base-observations 55
. . . . . . . . . . . . The rate determination of the time keepers 56 . . . . . . . . . . . . . . . . . . . . . . . . . . The results 56
. . . . . . . . The voyage of H r . MS . "Fret". October 14 - 26. 1957 57 . . . . . . . . . . . . . . . . . . . . . . . General remarks 57
. . . . . . . . . . . . . . . . . . . . . . . . . . The results 57
. . . . . . . . . . . 6 Reoccupied stations and earlier observations 58
7-1 2 Interpretation . . . . . . . . . . . . . . . . . . . . . . . . . Introduction
. . . . . . . . . . . . Structural outline of the North Sea region
. . . . . . . . . . . . . The northern part of the surveyed region . . . . . . . . . . . . . . . . . . . . . . . . . Introduction
. . . . . . . . . . The Moray Firth and the region E of Scotland . . . . . . . . . . . . . . . . The region SW and S of Norway
. . . . . . . . . . . . . . . . . . . The region W of Denmark . . . . . Reconstruction of the North-western European Caledonides
. . . . . . . . . . . . . 10 The southern part of the surveyed region 66 . . . . . . . . . . . . . . . . . 10.1 The older structures in this area 66
. . . . . . . . . . . . . . . . . . . . . 10.2 The North Sea basins 69 . . . . . . . . . . . . . . 10.3 The isostatic equilibrium of the region 70
. . . . . . . . . . . . . . 1 1 The postglacial uplift of Fennoscandia 71 . . . . . . . . . . . . . . . . . . . . . . . . . 12 Conclusions 72
. . . . . . . . . . . . . . . . . . . . . . . . . . 13 References 74
LIST O F FIGURES
The North Sea gravity survey. Gravity stations . . . . . . . The North Sea gravity survey. Isostatic anomalies
. . . The gravity field NE of Scotland. Gravity stations
The gravity field NE of Scotland. Isostatic anomalies . . . . . Three gravity sections over the Moray Firth region
. . . Possible modes of origin of a graben (not to scale)
. . . . . . . . . . Structural map of the North Sea
The symmetric development of North-Western Europe . The gravity field between 50" and 52"N and 0" and 3"E
. . . . . . . . The postglacial uplift of Fennoscandia
. . . enclosed
enclosed . . . . . . . . . 61
. . . . . . 61
. . . . . . 62
. . . . . . 63
. . . enclosed
. . . . . . 66
. . . . . . 68
. . . . . . 73
LIST O F TABLES
I The results of 1955 . . . . . . . . . . . . . . . . . . . . . . 79
I I The results of 1956 . . . . . . . . . . . . . . . . . . . . . . 82
I11 The results of 1957 . . . . . . . . . . . . . . . . . . . . . . 83
IV Free-air and isostatic anomalies and' the effects of topography and compensation . . . . . . . . . . . . . . . . . . . . . . . . . 84
. . . . . V Seismic data in the North Sea (U.S. Hydrographic Office) 96

THE GRAVITY FIELD OF THE NORTH SEA
In the years 1955, '56 and '57 the North Sea was surveyed with remote control gravimeters and the Vening Meinesz pendulum apparatus, on board of crafts of the Royal Netherlands Navy. About 250 new stations were occupied, of which 64 in a more detailed survey off the Scottish coast.
The geology of'the area and the continuation of the structures under the North Sea is discussed. All isostatic anomalies appear to be related to known or inferred geological structures and their isostatic compensation. The opinion that the Scottish and the Norwegian Caledonides are directly connected is not supported by facts. A bifurcation of the Caledonian system is probable instead. Isostatic equilibrium seems to prevail also in the area of the post-Hercynian North Sea basins. However, these basins may be slightly negative with respect to the sediment supplying regions.
In the surveyed region no influence of the post-glacial uplift of Fennoscandia can be perceived.
1 Preface
The gravity survey of the North Sea, the initiative being taken by Professor VENING MEINESZ, could not have been possible without the cooperation of many.
First of all we pay tribute to the indispensable service of the Royal Netherlands Navy. The Admiralty continued its fine tradition of rendering service to the Earth sciences by alloting in 1955 Hr. Ms. Frigate "Vos" for the survey of the shallower part of the area, a year later Hr. Ms. Submarine "Zeeleeuw" for measurements in the deeper part of the North Sea and in 1957 Hr. Ms. Frigate "Fret" for a detailed survey of the Moray Firth and surroundings.
In this tribute we include the officers, petty-officers and men of the ships. We treasure the pleasantest memories of the time spent on board.
From those ashore who were concerned in the actual organization of the voyages we mention especially Commander J. JELLEMA of the Operational Office of the Navy Department.
The Bataafsche Petroleum Maatschappij contributed by putting remote control gravimeters at our disposal. We are greatly indebted to this company and in partic- ular to Mr. A. VAN WEELDEN and Dr. B. BAARS. We also thank Mr. M. K. HOMMES, Mr. P. C. PRINS and Mr. H. F. G. ROSENBERC, who acted as operators in 1955.
We are under great obligation to the Norwegian Government for giving per- mission to dive in the Norwegian territorial waters.
We thank the British Geological Survey for connecting the harbour bases of Hr. Ms. "Vos" to the British gravity network, in special Dr. W. BULLERWELL who also supplied information on the base station at Inverness.
The Isostatic Institute in Helsinki, under the direction of Dr. E. NISKANEN, computed the isostatic reductions for the observations of 1955 and 1956, for which we are much obliged.
The voyage with Hr. Ms. "Zeeleeuw" was prepared at the Meteorological Institute at De Bilt. We thank its head-director, Mr. C. J. WARNERS, for the received hospitality and Dr. R. DORRESTEIN for his advice.
Particular gratitude goes to Mr. R. D. SCHUILING, who assisted us before and during the voyage with Hr. Ms. "Zeeleeuw".
We gratefully acknowledge to the U.S. Navy Hydrographer for his permission to use and publish the results of three seismic observations in the North Sea.

Whenever problems arose, there was always Professor VENING MEINESZ to be relied upon, for which I wish to express my great appreciation.
The voyages with Hr. Ms. "VOS" and Hr. Ms. "Zeeleeuw" were sponsored by the Netherlands Geodetic Commission, the voyage with Hr. Ms. "Fret" by the University of Utrecht. We express our sincerest gratitude to the Commission and to the Principals of the University.
I t is almost impossible to record the names of those with whom we discussed the interpretation of the data. May it suffice to thank them together.
Finally we thank Professor M. G. RUTTEN for perusing the manuscript and giving helpful criticism.
2 Introduction
The greater part of the North Sea being too shallow for pendulum measurements in a submarine (except with very beautiful weather which, however, seldom holds in this area), only the development of remote control gravimeters made it possible to undertake a survey of the region.
The first part of the survey was made with Hr. Ms. Frigate "Vos" in 1955. The staff of the ship consisted of Lieutenant-Commander F. DE BLOCQ VAN KUFFELER, Commanding Officer Lieu tenant J. J. VALK, Executive Officer Lieutenant J. ZOCK, Chief Engineer Lieutenant R. H. BERTS Lieutenant S. W. F. HENDRIKSE After the summer leave Lts. VALK and BERTS were replaced by Lieutenant P. H. KUIPERS, Executive Officer Sub Lieutenant R.N.N.R. A. S. PLUIM
Between the 20th of June and the 22nd of September over 150 stations were occupied in the area between the meridian of Greenwich in the Channel and the 50-fathoms line in the N (about 58"N). This period was not entirely spent at sea as it was interrupted by the summer leave, a docking period of a week and several spells of bad weather. To reset the range of the gravimeter several harbours had to be called at.
The instrument used was a North American Gravimeter with a Robert Ray remote control equipment, put at our disposal by the B.P.M. Of this company Mr. M. K. HOMMES, Mr. H. F. G. ROSENBERG and Mr. P. C. PRINS ~uccessively as- sisted with the measurements.
The British Geological Survey connected our harbour bases in England and Scotland with the British bases. The Norwegian and Danish Geodetic Surveys supplied information on their bases at Bergen, Kristiansand and Esbjerg.
In December a further connexion was made with the N.A.G. no. 72 between Hook of Holland and Harwich to ensure a good adjustment between the British and Dutch bases.
In January 1956 we put off to sea again with Hr. Ms. "Vos", then under com-

PART I1 THE GRAVITY FIELD OF THE NORTH SEA 5 1
mand of Lieutenant-Commander J. C. L. LEEKSMA, to calibrate the echo-sounding apparatus.
The less shallow part of the North Sea was surveyed with Hr. Ms. Submarine "Zeeleeuw" in September 1956. The staff of the ship was formed by Lieutenant J. W. OOSTERBAAN, Commanding Oficer Lieutenant A. F. DE BRU~NE, Executive Officer Lieutenant N. KOOIJMAN, Chief Engineer Lieutenant R. R. LENDERINK, Navigator Lieutenant C. H. E. BRAINICH VON BRAINICH FELTH Lieutenant R. C. M. DE QUAIJ Lieutenant R. DEN BOEFT
This part of the survey lasted from the 10th to the 23rd of September. 34 new positions were occupied at sea, thus covering the area up to the 61st latitude degree, and one position of Hr. Ms. "Vos" was reoccupied. Visits were paid to Kristiansand and Bergen. Mr. R. D. SCHUILING accompanied us on this trip, taking care of the time registration. Time signals were taken before and after each dive with the Time Signal Oscillograph designed by DE HAAS (1956).
The outcome of one of the pendulum observations, viz. the one in the Moray Firth, led to the survey of the area off the Scottish coast with Hr. Ms. Frigate "Fret" in October 1957. The staff of Hr. Ms. "Fret" consisted of Lieutenant-Commander V. R. IJ. WINKELMAN, Commanding Officer Lieutenant B. WEEKE, Executive Officer Lieutenant J. M. DE JONG, Chief Engineer Lieutenant R. ZIMMERMANN, Navigator Lieutenant R.N.N.R. D. C. BOM, Surgeon Sub Lieutenant W. PRINS Sub Lieutenant C. J. RAMEAU
Between the 18th and the 26th of October measurements were made a t 64 ne~v positions, as a rule 5 to 8 miles apart. The pendulum station in question was reoccupied. A same combination of instruments was used as in 1955. The observations were connected on land to the base station at Inverness of a gravity survey carried out privately by Dr. W. BULLERWELL and Dr. J. PHEMISTER.
Calibration of the gravimeters was achieved in 1955 on a provisional base of the B.P.M., in 1957 on a more definite base, both in the Netherlands. In March 1956 Mr. G. J. BRUINS and the author undertook a trip to Germany to check the former base value with the base Bad Harzburg - Torfhaus. The connexion Bad Harzburg - De Bilt - Cambridge, resulting from these measurements and from the connexion Hook of Holland - Harwich, showed that the value of g at De Bilt is about 1.3 to 1.4 mgal too low. To avoid confusion the value of 981 268.0 mgal has nevertheless been maintained.
The sections 3 to 6 give the particulars on the voyages; sections 7 to 12 deals with the interpretation of the results.

3-6 THE SURVEY
3 The survey with Hr. Ms. "Vos", June 20 - September 22, 1955
3.1 Technical remarks
The measurements were made with the North American Gravimeter no. 72 with a remote control equipment and watertight housing constructed by ROBERT RAY, Houston, serial number 20. The range of the gravimeter was about 90 mgal.
A crane, to lower the instrument with, was mounted not far from the bow at starboard, 5 m over the waterline. Much dexterity was required to prevent a swaying of the housing during the lowering and hoisting. Once the housing bumped against the hull of the ship. Broken photo tubes and a disarranged gravimeter were the sad consequence. Since then, at windforce 5 to 6 Beaufort scale we usually interrupted the measurements.
An observation took about 20 to 30 minutes, the greater time of which was spent in the lowering and weighing of the anchor. When anchored, Decca-readings were made, generally of two Decca- chains, for which purpose an extra Decca-set had been installed. Because of the occurrence of the so-called sky-wave, an interfering radio wave reflected by a ionospheric layer, which exists only during the night, observations were made during day-time only, unless the position could be fixed by conventional means.
Serious hindrance was felt in some cases from the tidal current, especially in the Channel. The current put tension on the cable, which set the gravimeter vibrating. Microseisms occurring after a storm also obstructed a reading sometimes.
The maximum depth at which observations were made was 50 fathoms. The length of the electrical cable and the anchoring capacity of the frigate formed the limiting conditions.
In several instances we dismantled the instrument to use it as a land gravimeter making provisional checks and connexions.
3.2 Calibration of the gravimeter
During and after the survey the gravimeter was calibrated on a provisional base of the B.P.M. between De Bilt and Vught. No change of the scale factor occurred.
In March 1956 a definite calibration was accomplished on the German gravimeter base Bad Harzburg - Torfhaus, for which a difference is given of 84.70 mgal (dif- ference between the pendulum sites: 85.6 mgal). Eleven trips were made between the two sites, which resulted in a scale factor of 0.091 12.
The N.A.G. no. 72, together with the N.A.G. no. 62, was subjected to several instrumental tests. Some remarkable facts were revealed. I t was found that better results were obtained if the dial was put in a fixed position (a high reading) in the interval between two observations. A series ofobserva- tions in the tower of the Meteorological Institute at De Bilt (gravity difference 8.80 mgal) further- more showed that the scale factor of the instruments is not strictly linear. Differences in reading up to 0.9% occurred. The curves obtained resemble very much the curve recently given by GILBERT (1958) of the N.A.G. no. 137. For the rest the scale factor of the N.A.G. no. 72 can be given by
m j = 0.09149-0.00074-
1020 ' if m is the arithmetic mean of two readings.
The mean error of one reading of the N.A.G. no. 62 proved to be less than 0.01 mgal, the same error of the N.A.G. no. 72 was about 0.02 mgal. The N.A.G. no. 72 moreover sometimes gave readings which were about 0.1 mgal out. This effect can possibly be attributed to the dial that was used for land measurements.
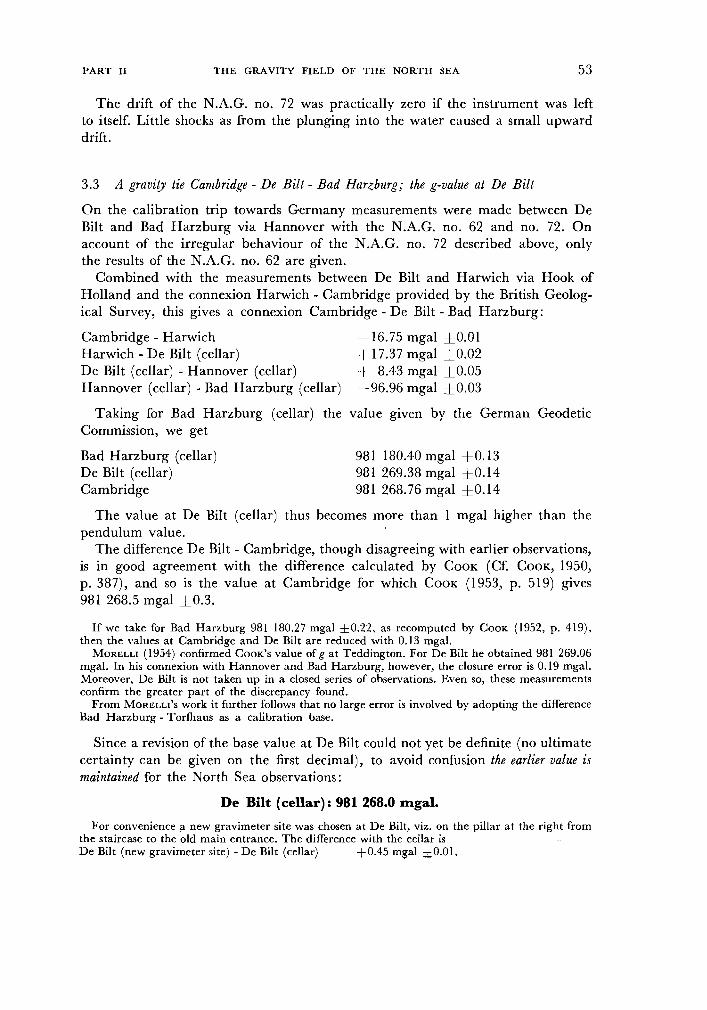
PART I1 THE GRAVITY FIELD OF THE NORTH SEA 5 3
The drift of the N.A.G. no. 72 was practically zero if the instrument was left to itself. Little shocks as from the plunging into the water caused a small upward drift.
3.3 A gravity tie Cambridge - De Bilt - Bad Harzburg; the g-value at De Bilt
On the calibration trip towards Germany measurements were made between De Bilt and Bad Harzburg via Hannover with the N.A.G. no. 62 and no. 72. On account of the irregular behaviour of the N.A.G. no. 72 described above, only the results of the N.A.G. no. 62 are given.
Combined with the measurements between De Bilt and Harwich via Hook of Holland and the connexion Harwich - Cambridge provided by the British Geolog- ical Survey, this gives a connexion Cambridge - De Bilt - Bad Harzburg:
Cambridge - Harwich 1 6 . 7 5 mgal f 0.01 Harwich - De Bilt (cellar) + 17.37 mgal f0.02 De Bilt (cellar) - Hannover (cellar) + 8.43 mgal f 0.05 Hannover (cellar) - Bad Harzburg (cellar) -96.96 mgal f 0.03
Taking for Bad Harzburg (cellar) the value given by the German Geodetic Commission, we get
Bad Harzburg (cellar) De Bilt (cellar) Cambridge
981 180.40 mgal f 0.13 981 269.38 mgal f0.14 981 268.76 mgal f 0.14
The value at De Bilt (cellar) thus becomes more than 1 mgal higher than the pendulum value.
The difference De Bilt - Cambridge, though disagreeing with earlier observations, is in good agreement with the difference calculated by COOK (Cf. COOK, 1950, p. 387), and so is the value at Cambridge for which COOK (1953, p. 519) gives 981 268.5 mgal f0.3.
If we take for Bad Harzburg 981 180.27 mgal k0.22, as recomputed by COOK (1952, p. 419), then the values at Cambridge and De Bilt are reduced with 0.13 mgal.
MORELLI (1954) confirmed COOK'S value of g at Teddington. For De Bilt he obtained 981 269.06 mgal. In his connexion with Hannover and Bad Harzburg, however, the closure error is 0.19 mgal. Moreover, De Bilt is not taken up in a closed series of observations. Even so, these measurements confirm the greater part of the discrepancy found.
From MORELLI'S work it further follows that no large error is involved by adopting the difference Bad Harzburg - Torfllaus as a calibration base.
Since a revision of the base value at De Bilt could not yet be definite (no ultimate certainty can be given on the first decimal), to avoid confusion the earlier value is maintained for the North Sea observations :
De Bilt (cellar) : 981 268.0 mgal.
For convenience a new gravimeter site was chosen at De Bilt, viz. on the pillar at the right from the staircase to the old main entrance. The difference with the cellar is De Bilt (new gravimeter site) - De Bilt (cellar) 10.45 mgal 10.01.
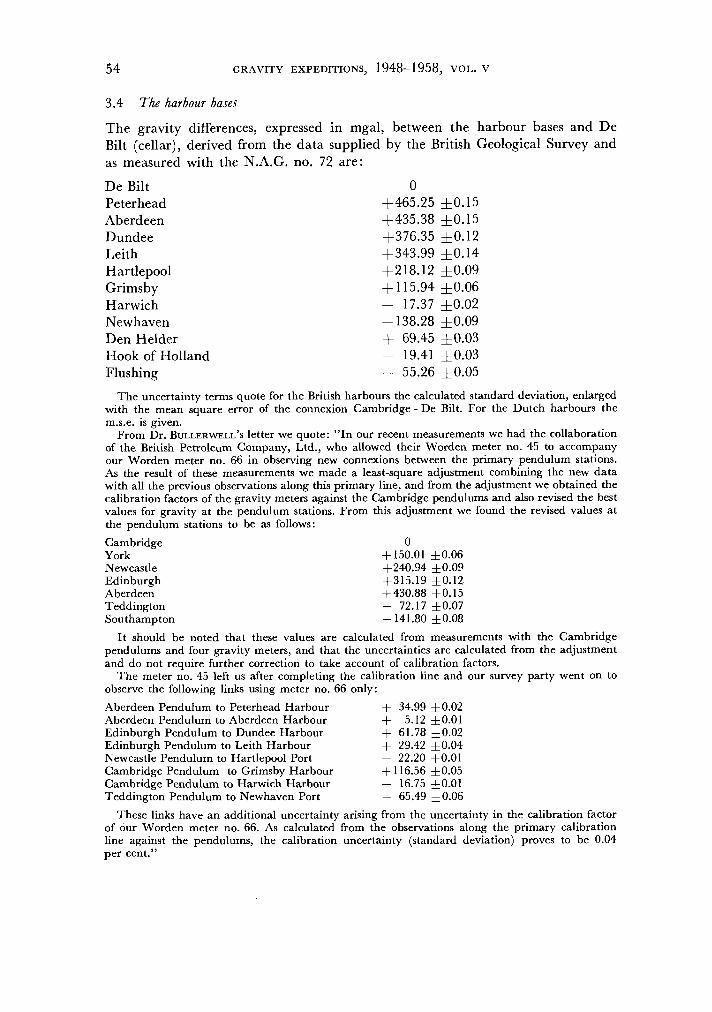
3.4 The harbour bases
The gravity differences, expressed in mgal, between the harbour bases and De Bilt (cellar), derived from the data supplied by the British Geological Survey and as measured with the N.A.G. no. 72 are:
De Bilt 0 Peterhead +465.25 f 0.15 Aberdeen +435.38 f0.15 Dundee +376.35 f0.12 Leith +343.99 f0.14 Hartlepool +218.12 f 0.09 Grimsby + 115.94 f0.06 Harwich - 17.37 f0.02 Newhaven - 138.28 f0.09 Den Helder + 69.45 f0.03 Hook of Holland - 19.41 f0.03 Flushing - 55.26 f0.05
The uncertainty terms quote for the British harbours the calculated standard deviation, enlarged with the mean square error of the connexion Cambridge - De Bilt. For the Dutch harbours the m.s.e. is given.
From Dr. BULLERWELL'S letter we quote: "In our recent measurements we had the collaboration of the British Petroleum Company, Ltd., who allowed their Worden meter no. 45 to accompany our Worden meter no. f33 in observing new connexions between the primary pendulum stations. As the result of these measurements we made a least-square adjustment combining the new data with all the previous observations along this primary line, and from the adjustment we obtained the calibration factors of the gravity meters against the Cambridge pendulums and also revised the best values for gravity at the pendulum stations. From this adjustment we found the revised values at the pendulum stations to be as follows:
Cambridge 0 York + 150.01 *0.06 Newcastle +240.94 *0.09 Edinburgh +315.19 *0.12 Aberdeen +430.88 *O. 15 Teddington - 72.17 *0.07 Southampton - 141.80 *0.08
It should be noted that these values are calculated from measurements with the Cambridge pendulums and four gravity meters, and that the uncertainties are calculated from the adjustment and do not require further correction to take account of calibration factors.
The meter no. 45 left us after completing the calibration line and our survey party went on to observe the following links using meter no. 66 only:
Aberdeen Pendulum to Peterhead Harbour + 34.99 *0.02 Aberdeen Pendulum to Aberdeen Harbour + 5.12*0.01 Edinburgh Pendulum to Dundee Harbour + 61.78 *0.02 Edinburgh Pendulum to Leith Harbour + 29.42 *0.04 Newcastle Pendulum to Hartlepool Port - 22.20 *0.01 Cambridge Pendulum to Grimsby Harbour + 1 16.56 *0.05 Cambridge Pendulum to Harwich Harbour - 16.75 *0.01 Teddington Pendulum to Newhaven Port - 65.49 *0.06
These links have an additional uncertainty arising from the uncertainty in the calibration factor of our Worden meter no. 66. As calculated from the observations along the primary calibration line against the pendulums, the calibration uncertainty (standard deviation) proves to be 0.04 per cent."

PART I1 THE GRAVITY FIELD OF THE NORTH SEA 5 5
3.5 The results
Table I gives the observations reduced to sea level. All values refer to De Bilt 981 268.0 mgal. The positions and the anomalies are given in Table IV and Fig. 1.
In the northern part of the surveyed region we had to use the Decca outside the reliability circles. Both the North British and the Danish chain were then read. Discrepancies up to several miles sometimes occurred between those readings (mainly E-W due to the E-W direction of the lanes). As a rule the reading of the nearest Decca transmitter was taken as the position.
In Table IV an estimate is given of the uncertainty in the latitude. In a few cases it attains more than 0.5 mile, as a rule it is less.
The greater part of the positions obtained by Decca were recomputed by Professor G. J. BRUINS and his staff. From the computations it appeared that the discrepancies between the readings of two chains are real and that their cause should not be looked for in the construction of the so-called Decca-hyperbolas on the Decca navigation charts.
If a closed series of observations was not made, only the harbour of departure is given. If the harbour of departure and of arrival are the same, it is mentioned twice.
The closure errors were distributed evenly over the interjacent stations. The mean error, m,, allows for the uncertainty of the adjusting, the mean error of the harbour bases and the uncertainty in the depth determination. The mean error of the anomalies is obtained by combining m, with the mean error of the latitude and the uncertainty of the topographic and isostatic reductions.
4 The voyage of Hr. Ms. yyZeeleeuwyyy September 10 - 23, 1956
4.1 The base-observations
Because of some technical trouble on the outward voyage, only the results of the observations after the voyage could be used. The periods of the outer pendulums (mean time) were at De Bilt (cellar) :
Oct. 3
Nov. 13
T8, (in sec)
from which the mean period T was taken at
T8, (in sec)
T = 0.5000261 sec and T8,-T8, = 61.5 X 10⁻⁷ sec
The difference in period of the left and the middle pendulum, obtained by two separate observations in which the left pendulum was given amplitude equal but opposite to the amplitude of the middle pendulum, was
At Kristiansand two observations were made to compensate for the cancelling of the standardiza- tion before the voyage. The difference with the gravimeter observation of 1955 (same berth) was 2.1 mgal.

4.2 The rate determination of the time keepers
Two chronometers, the Nardin no. 2 12 (sidereal time) and 208 1 (mean time) have been used. The rate determination has been realized with the Time Signal Oscillo- graph developed by DE HAAS (1956). For the comparison between mean time and sidereal time chronometer, a special method was developed.
In the TSO, radio-second-signals and a signal of the chronometer are made visible on an oscillo- graph screen. The latter signal is retarded to coincide with the radiosignal with an accuracy of 0.001 second. In practice this accuracy was somewhat less, probably due to an irregularity in the calibration.
The method is less suited for a sidereal time chronometer. To cope with this difficulty, the under- mentioned procedure was followed. The mean time chronometer was used to provide a time base on the oscillograph. At the same time it was put in series with the sidereal time chronometer and a battery. This latter circuit was thus closed only if parts of the half seconds of both chronometers in which contact is made, overlapped. With a relay these opening and closing times of the circuit were transmitted to a second circuit in which a 2000 c/s generator, providing a block voltage, had been inserted. This second circuit was connected with the radio input socket of the TSO and thus a signal of growing and decreasing length appeared on the oscillograph screen. The second in which the signal disappeared was read and the block-waves of the last signal were counted, thus determining the state of the sidereal time chronometer with respect to the mean time chronometer with an ac- curacy of 0.0005 second. By delaying the time base by a fixed fraction of a second, which could be done by means of the delaying mechanism of the TSO, several measurements were made in one coincidence interval.
Time signals were taken before and after each dive from Rugby MSF at 5, 10, 15 and 20 Mc/s. The comparison between mean time and sidereal time chronometer was made immediately after and before.
4.3 The results
Table I1 gives the results reduced to sea level. All values refer to De Bilt 981 268.0 mgal. The positions and the anomalies are given in Tabel IV and Fig. 1.
The positions were determined with Decca (near Denmark and Scotland) and from dead reckoning adjusted by visual checks. No use could yet be made of the newly installed North Scottish Decca chain.
T,,, is the period of the waves as measured from the record, 6, the second order correction, m, the mean error of this correction.
The earlier experiences on the nature of the waves are confirmed again, except for stations 1193 to 1196 for which the effect of the vertical accelerations is too great compared to that of the horizontal ones. This may be due to the length of the waves, which was smaller than the ship's length. On the whole, the second order corrections were kept low by diving deep (Cf. VENINC MEINESZ, 1953).
Next the change of temperature during the observation is given. d stands for the difference between the reduced periods of the main pendulums. v is the difference in the mean of the periods of the main pendulums if taken
according to the mean time or to the sidereal time chronometer, followed between brackets by the number of coincidence intervals over which the mutual rate of both chronometers could be determined in the record. w,/w, is the ratio of the weights attributed to the results according to the sidereal time (W,) and the mean time ( W , ) chronometer. For this the number of coincidence intervals and the quality of the rate determination of the sidereal time chronometer were taken as a

PART I1 THE GRAVITY FIELD OF THE NORTH SEA 57
measure. m, is the mean error in g, due to the uncertainty of the rate determination, which was taken to be at least 1.2 mgal.
The rate of the mean time chronometer with respect to the sidereal time chronometer could not always be measured over the full length of the record. This was due to the circumstance that the pendulums are virtually isochronous with the latter chronometer on these latitudes. To obtain as many coincidences as possible, the pendulums were released l/, or l/, second after the click of the interruptor of the mean time chronometer. This was checked visually by adjusting the mean time chronometer on giving eclipses of half a second. Besides, the duration of the observation was taken longer than usual, at 38 minutes, of which two times 7 minutes at high paper speed.
m, is the mean error due to the uncertainty in the determination of the E-W component of the current, which was read from the existing tables.
m, is the mean error of each observation. The mean of the mean errors of all sea observations is 2.3 mgal.
5 The voyage of Hr. Ms. yyFretyy, October 14 - 26, 1957
5.1 General remarks
Again use was made of a North American Gravimeter, no. 110, with a remote control equipment of ROBERT RAY, Houston. The N.A.G. no. 110 had been cal- ibrated by the B.P.M. on a base in the Netherlands derived from the German base Bad Harzburg - Torfhaus. The scale factor was taken from this calibration at 0.09320 (m.s.e. 0.00005). No additional observations were made on the linearity of the instrument.
During this voyage all the resets of range of the gravimeter had to be carried out at sea. Nevertheless, the closing-error was very small.
The series of measurements were started at Invergordon and finished at Inverness. A check was made over land and the latter base was connected with the base station at Inverness of a gravity survey of Scotland, which has been carried out privately by Dr. W. BULLERWELL and Dr. J. PHEMISTER. The difference from Cambridge is :
Inverness +435.72 mgal +0.18
From this we obtained for the harbour bases De Bilt 0 Invergordon (harbour) f466.79 mgal k0.20 Inverness (harbour) f443.12 mgal f 0.18 The uncertainty terms quote the standard deviation.
In the neighbourhood of the Pentland Firth the tidal currents proved to be so violent that we had to abandon our intention to make measurements in this area. In other instances weights were fastened to the gravimeter housing to ensure a proper lowering to the sea floor.
5.2 The results
Table I11 gives the results reduced to sea level. All values refer to De Bilt 981 268.0 mgal. The positions and the anomalies are given in Table IV and in Figs. 2 and 3.
The positions were determined with the new North Scottish Decca chain. No hindrance was felt from the sky-wave, so we could work day and night.

Again our depth limit was about 50 fathoms, which explains the irregular spacing of the observations farther out to sea. The observations were adjusted visually.
6 Reoccupied stations and earlier observations
At Esbjerg we connected our harbour station with a station of the Danish Geodetic Institute in front of the Frelsers Kirke, for which a value of g is given of 981 569.68 mgal. We obtained 981 567.1 mgal f 0.4. For a station of the Norwegian Geodetic Survey at Kristiansand (58"09'00"N/ 8"00140"E, height 7.344 m), a value of g is given of 981 774.43 mgal. Applying a free-air and a Bouguer reduction and a correction for the latitude difference, this gives 981 775.2 mgal for our station no. 1033. With the gravimeter we obtained 981 773.1 mgal f 0.4, with the pendulums 981 775.2 mgal f 1.6. For a station at Bergen (6Oo23'25"N/5"19'00"E, height 2.710 m) a value ofg is given of 981 953.48 mgal. From it we get for our station no. 1208,981 954.9 mgal. Our pendulum station gives 981 955.4 mgal f2.2.
When considering the foregoing values we should keep in mind the correction that has to be applied to the base value at De Bilt (Cf. 3.3).
Station no. 1037 was measured in 1955 and reoccupied in 1956. The positions do not exactly coincide but the difference in latitude can be neglected. The depths were the same. With the gravimeter we obtained 981 723.1 mgal f0.3, with the pendulums 981 726.9 mgal f 1.5.
The correspondence at station no. 1227 was less fine. The pendulum observation in 1956, reduced to sea level, gave 981 735.4 mgal +2.5 (depth 59 m), the gravimeter observation in 1957, 981 746.3 mgal h 0 . 4 (depth 64.7 m). No satisfactory explanation can be offered for this difference. I t may be caused by a difference in position (the uncertainty term of the latitude determination of the pendulum station was 2.5 miles). Since the station was occupied twice with the gravimeter (Table 111) and the navigation during that voyage was more accurate, the gravimeter value is given in Table IV.
In 1938 two pendulum observations were made with Hr. Ms. "0.13" about half-way between Holland and England (VENING MEINESZ, 1948; stations no. 837 and 843). Station no. 837 fits in fairly well, giving an isostatic anomaly of $9 mgal not far from our station no. 1073 ($4 mgal). Station no. 843, however, gives an anomaly of + 13 mgal half-way between our stations no. 1070 and 1074 (-2 and + 2 mgal).
In 1939 an observation was made with Hr. Ms. "0.16" (Ib., station no. 844), not far from our stations no. 1138 and 1139. Station no. 844 gave an isostatic anomaly of $47 mgal, station no. 1138 of + 11 and station no. 1139 of -7 mgal. The observation of 1939 was the only measurement of that voyage, the purpose of the voyage being chiefly the study of the second order corrections. A tuning fork was used as a time keeper. This clock afterwards showed a technical imperfection, which may have influenced the rate considerably. I t seems therefore best to discard the older observation.
The results obtained by BROWNE and COOPER (1952) in the Channel fit in very well with our observations.
HAALCK (1935a and b) performed some measurements with an experimental static sea-borne gravimeter N of Helgoland. Our values are systematically lower than HAALCK'S values, except for the more northern observations of his series. The reason for this discrepancy will have to be found in HAALCK'S disregarding of the BROWNE terms (BROWNE'S paper on the subject dates from 1937), the weather being rather rough.
N~RGAARD (1936), also using a static gravimeter, made allowance for the ship's movements by imitating these on land afterwards, thus finding an empiric correction. His results in the Skagerrak partly tally with our observations (station no. 1194), partly disagree (station no. 1193). His value for the harbour of Kristiansand (58"08.0'N/8"00.0'E), g, = 98 1 763 mgal, is more than 10 mgal out. This latter fact suggests that our data can be maintained.
There is a good correspondence with the data on land (DE BRWN, 1955; VAN WEELDEN, 1957; unpublished material on Scotland). Near Hartlepool a negative exists, contrary to what is indicated by DE BRUYN. The small shifts occurring along the Dutch coast result mainly from a difference in calibration and in the adopted base value of De Bilt. On the Danish coast, at 57'N, the contours on land point to a gravimetric high off-shore, whereas we found a low. The hypothetic contours in the Skagerrak have to be revised.
Finally, mention may be made of an interesting estimate of the mean free-air anomaly of the southern part of the North Sea by COOK (1950), based on a comparison of the deflexions of the vertical at Greenwich and Southampton as calculated from gravity, and as geodetically determined. The figure given (a free-air anomaly over much of the North Sea of less than - 10 mgal) agrees remarkably well with the actual data.

7-12 INTERPRETATION
7 Introduction
The relationship is discussed between the new data on the gravity field and the geological structure and history of the countries around the North Sea. All the gravity anomalies appear to be connected with known or inferred geological struc- tures. A reconstruction is given of the course of the North-western European Caledon- ides and the extension and depth of the post-Hercynian sedimentary basins is examined.
The geological structures are found to be compensated isostatically and it is concluded that no real deviations of the isostatic equilibrium occur, though the basin area as a whole may be slightly negative with respect to the sediment supplying regions. Within the limits of error no influence of the postglacial rise of Fennoscandia can be perceived.
8 Structural outline of the North Sea region
The geological maps of the countries around the North Sea show the following geological units (Fig. 5 ; Cf. HOLTEDAHL, 1953 ; BAILEY, 1939 and 1948; FOURMA- RIER, 1954; JONES, 1948; PANNEKOEK, 1956).
Precambrium is exposed in South Norway and in the extreme NW of Scotland. In both regions thrustfaults mark the transition towards the series of the Caledonian system, in South Norway with movements of the Caledonian over the Precambrium to the SE, in Scotland to the WNW (Moine thrust). Also in Belgium Caledonian structures occur (in the Brabant Massif and in the Ardennes), which are, however, for the greater part covered by younger series.
The nearly E-W Caledonian structures of the Brabant Massif are generally supposed to coalesce to the W with the British Caledonides. The relation between the NE-SW British and Norwegian Caledonides will be treated in the following pages.
In Hercynian times rift valleys originated in South Norway and in Scotland, the Oslo Graben and the Midland Valley. Besides, in Scotland, considerable transcurrent faults developed (the Great Glen Fault).
Important, roughly E-W, Hercynian folding occurred in Belgium, SW-England and Wales. With the exception of a small area in Northern France (the Boulonnais), these structures are not exposed in the coastal areas of the North Sea. Also farther N, in the southern part of the Netherlands and in Central England Hercynian structures occur.
These latter structures are of a quite different character. The boundary between these structures and the more southern ones is known as the boundary between Palaeo- and Meso-Europe. I t runs N of the Ardennes, the Boulonnais, the Wealden anticline (Kent) and through Southern Wales.
The younger sedimentation covered the greater part of the area, in which several basins developed: the North Sea basin, the NW-German basin, the Danish basin, the basin of Paris, the Hampshire basin and the basin of London. No large tectonic movements affected these basins afterwards.

A major tectonic event was the Cainotoic (late Tertiary to Pleistocene?) upheaval of Scandinavia and Scotland, to which, probably, the formation of the Skagerrak and the Norwegian Channel has to be related. All present-day topographic relief results from these movements.
In the Quaternary Fennoscandia and Scotland became centers of the successive glaciations. Equilibrium restoring forces, effecting a rise of the crust, are still active in the former region.
The area of the North Sea was thus the stage for a long series of geological events. The structures bearing witness are not, however, all neatly arranged and separated, but partly intersect and overlap.
HOLTEDAHL emphasizes the non-parallelism of the Caledonian and the older structures in Scan- dinavia. In the Upper Palaeozoic the Caledonian underground of Belgium came to be divided into several blocks, which responded differently to the Hercynian orogeny. The younger sedimenta- tion was not confined to the basins mentioned, the division land-sea changed continuously and is still doing so, and what we called basins are in fact regions of maximal subsidence in a much wider area of sedimentation.
9 The northern part of the surveyed region
In this region Caledonian structures are predominant. The leading notion asssumes a direci, NE-SW connexion between the Scottish and Norwegian parts of the Caledonian system. The opposing view is that the Norwegian Caledonides continue via Denmark towards Germany and that the Scottish structures turn off northward or even north-westward (Cf. STILLE, 1923-'25, plate 14; SCHWINNER, 1934; BEURLEN, 1939, pp. 199-200; VON ZWERGER, 1948).
The resemblance between the Norwegian and the Scottish Caledonides is striking, though some points regarding the correlation of the stratigraphy remain open (Cf. FRODIN, 1922; HOLTEDAHL, 1939 and '52; READ, 1956). However, there are a few, structural facts that support the idea of deviating strikes in the sea-covered area, viz. the N-S strike of the Shetlands and a change of strike of the Norwegian structures near the W-coast of South Norway (from nearly ENE-WSW to nearly N-S). Furthermore, in Denmark and North Germany magnetic and gravimetric anomalies occur, that stand in no relation to the younger geological history (BROCKAMP, 1941, pp. 172-175) and which must therefore be attributed to older basement structures (the "Peribalticum").
According to HOLTEDAHL (1925) there is an important analogy between the Scottish structures and the Caledonian structures of Spitzbergen.
In the N, beyond the surveyed area, a bifurcation of the Caledonian system is found, one branch running via Bear Island towards Spitzbergen, the other on the continent to the ENE. The region in between the two branches, the Barents Sea shelf, has only slightly been affected by the Caledonian orogeny. Overthrusting is restricted to the real foreland borders.
In a reconstruction of the Caledonides the effect of the Great Glen Fault must be taken into account. This transcurrent fault runs as a straight line through the Scottish Highlands and has brought about a sinistral displacement of about 100 km (KENNEDY, 1946).

PART II THE GRAVITY FIELD OF THE NORTH SEA 6 1
According to Dr. PITCHER (personal communication), the south-westward continuation of this fault can be found in North-western Ireland, where SE of the Donegal granite a transcurrent fault passes. This fault has a displacement of at least 15 km (see also PITCHER and CHEESMAN, 1954) in a sinistral way, as becomes clear from observations on smaller accompanying faults (LEEDAL and WALKER, 1954). The known length of the Great Glen Fault thus becomes about 600 km.
9.2 The Moray Firth and the region E of Scotland
The detailed survey of the Moray Firth (Figs. 2 and 3) yielded a clue for the inter- pretation of the anomaly field E and NE of the Scottish coast. The negative anomaly in this Firth attains about 40 mgal in the center and is bordered by very steep gradients, of about 40 mgal over 9 km. There is no direct connexion between this anomaly and the anomaly of - 19 mgal to the NE (pendulum station).
The explanation of the Moray Firth anomaly must be sought in the presence of
Fig. 2a The gravity field NE of Scotland, Gravity stations
Fig. 2b (overlay) Isostatic anomalies (T= 30 km, R=O) De Bilt: g = 981 263.0 mgal

1 0 1
3
Fig. 3 Three gravity sections over the Moray Firth region (NW-SE). For position see Fig. 2a
a large granitic batholith at small depths. The positive anomalies found SE of the Moray Firth negative can be related to basic rocks.
For the interpretation of the Moray Firth anomaly the following possibilities have been considered. First, the crustal block SE of the Great Glen Fault might have been depressed as a torsional effect near the end of the fault. Secondly, the anomaly may be caused by an isostatically compensated mass deficiency of the subsurface rock, which rock could then be light sediment or granite.
Against the first possibility it may be objected that the large gradient to the N of the anomaly is not at right angles to the (prolonged) direction of the Great Glen Fault. Neither does the steep gradient to the SE of the anomaly fit in with this idea, since under these circumstances the anomaly must be expected to be asymmetric.
This leads us to the second possibility. Applying a formula, given by BULLARD and COOPER (1948, p. 342), to the measured gradients it follows that a body of more than 10 km thickness with a density contrast of 0.3 is needed to produce the actual field. Although a thin sedimentary cover may be present (Cf. READ and MACGREGOR, 1948, p. 77), it cannot reach this dimension. We thus come to the hypothesis of a non-exposed, shallow-seated granitic batholith.
Further inland large granitic bodies do occur, the so-called newer granites (READ and MACGREGOR, 1948, Fig. 12). Granitic batholiths are known to evoke large negative anomalies such as found in the Moray Firth (Cf. SCHWINNER, 1931; GOGUEL, 1950; THIRLAWAY, 1951; MURPHY, 1952; BOTT, 1953 and '56). There are no direct indications for the presence of a batholith. The Helmsdale granite, to the NW of the Moray Firth, cannot be considered as such, since accepting KENNEDY'S ideas (1946) on the displacement of the Great Glen Fault, the region NW of the fault has to be shoved back a hundred kilometers into north-eastward direction to obtain its position in Caledonian times. In the part of the Northern Highlands which by this reconstruction will come to border the Moray Firth region, no granites are exposed. This, however, complies with the fact that the negative anomalies (except a small area near Inverness) are confined to the sea.
The postulation of a density contrast of 0.3 to account for the negative anomalies implies that

PART 11 THE GRAVITY FIELD OF THE NORTH SEA 63
the positive anomalies in the area are caused by heavy, basic rock. This is confirmed by the fact that the positive anomalies SE of the Moray Firth negative, which continue on land, are associated there with the basic rocks of the Buchan Platform.
Like the known structures on land, the granitic batholith must be of Caledonian age. The anom- alies can thus be said to represent Caledonian structural trendlines.
Exactly the same relation between the sign of the anomalies and acidity of the underlying rock can be assumed to exist farther off the coast. In the area covered by the gravimeter survey Scottish Caledonian trends can be noticed. Farther seaward the wide spacing of the pendulum stations, however, does not allow any definite conclusions on structural directions.
There is no need to suppose that each part of this region of alternating heavy and light subsurface masses is in local isostatic equilibrium, since the wave length of these disturbances is much smaller than the wave length of the rigid crust (Cf. VENING MEINESZ, 1948). The density variations in the upper part of the crust will therefore probably not be reflected - or only feebly so - in the position of the Mohorovicic-discontinuity. The alternation of positive and negative anomalies being accounted for by the regional geology, only the mean anomaly is of importance for the question of isostasy. Since this mean, taken over the area N of the 57th latitude degree, differs only slightly from zero - disregarding for the moment the
stations near the Norwegian coast - it may be concluded that isostatic equilibrium
crust urevails.
a 9.3 The region S W and S of Norway
Near the Norwegian coast we find the Skagerrak and the Norwegian Channel.
. . . . . . . . . . . . .
. . . . . . . . . . . In the Skagerrak depths up to 800 m occur.
b The floor is rather irregular but becomes flatter towards the NW. The topography
I I of the Norwegian Channel has all the asDects of a graben.
U
Seven profiles were made, distributed c over the full length of the trench. Neither
2
e Fig. 4 Possible modes of origin of a graben
(not to scale)
the local nor the regional isostatic anoma- -
lies show any relation to the topography.
If the trench were a graben with inclined fault planes (Fig. 4a and b; Cf. VENING MEINESZ, 1950) or an effect of (glacial) erosion (Fig. 4c), negative anomalies must have been found over the deeper parts. As things are, the trench presumably is a graben in isostatic equilibrium of a type sketched in Fig. 4d and e. In Fig. 4d the shaded part presents a heavier part of the crust which was in regional isostatic equilibrium, but sank down when tension faults developed. In Fig. 4e a hypothetic process changed the density in the depth. From our point of view there is no choice between these two

possibilities. For the rest the problem must be seen in relation to the Cainozoic upheaval of Scandinavia and Scotland (e.g. HOLTEDAHL, 1953). This young topography seems to be in isostatic equilibrium as well.
The isostatic anomalies near the Norwegian coast may now be rest anomalies, resulting from an imperfect adjusting of the local isostatic equilibrium, or they are geological anomalies caused by compensated anomalous masses in the upper part of the crust.
In both cases a heavy rock may be the seat of the anomaly; in the former case as an uncompensated load, in the latter as a compensated one, the effect of its compensation being small compared to the direct effect on account of the small dimensions of the disturbing body. That the disturbing masses are bound to be seated in heavier (basic) rocks is made clear by the following table:
Station Anomaly Exposed country rock Composition
1206 1 +36 1 gabbros of Karmsy 1 basic
l
1209 + 30 1208 (Bergen) + 20 1207
1204 1 + 9 / anorthosites of Egenund 1 ultrabasic
1199 1 - 3 1 birkremites of Egenund 1 more acid
rock complex of Bergen (gabbros, am- phibolites, anorthosites, mangerites)
basic to ultrabasic
1 variable 1033 (Kristiansand) 1193
Only for station 1194 do we have no direct indications. The geological data are borrowed from the geological map (HOLTEDAHL, 1953). Farther inland acid rocks are dominating. The fact that the greater part of the anomalies on the Norwegian coast is positive, is thus in good agreement with the geology of the area (Cf. HEISKANEN, 1926 and SCHWINNER, 1928). The question of the age of the basic and ultrabasic complexes has not yet been definitely settled. HOLTEDAHL (BAILEY and HOLTEDAHL, 1938, p. 24) puts them partly Precambrian, partly Caledonian.
+ 2
+ 15
1 +57 l ultrabasic rocks of South-eastern Norway (e.g. arendalites)??
Whether the N-S directions in the gravity field W of Norway actually represent a Caledonian structure or result from an interfering of Precambrian, Caledonian and Tertiary effects, cannot be said with certainty. Anyhow, the absence of other directions in this region tells strongly in favour of a N-S course of the Caledonides, since it can hardly be supposed that alle Caledonian influence has been wiped out from the gravity field.
alternating acid and basic rocks
unknown
9.4 The region W of Denmurk
We follow VON ZWERGER (1948) in his interpretation of the structural directions in Denmark and attribute the abnormal anomalies to Caledonian basement struc- tures (definition Peribalticum; Cf. 9.1).
Two E-W positive axes can be recognized, the Silkeborg and the Little Belt or South-Jutlandic axis (Fig. 5). The former seems to be essentially a basement structure, the latter axis fbrmed a

PART II THE GRAVITY FIELD OF THE NORTH SEA 65
submarine ridge during the Mesozoic and Tertiary between the NW-German basin and the Danish subbasin. On this ridge the Triassic is found at depths of less than 1000 m. To the N the younger sediments increase in thickness to more than 2500 m. In the extreme north of Denmark the Triassic again occurs at only 500 m depth (GREGERSEN and SORGENFREI, 1951).
On account of the interference of older and younger structures it is difficult to decide to what degree isostatic equilibrium in this region has been realized.
If the anomalies are corrected for the influence of the post-Triassic sediments and their isostatic compensation, which adds 5 to 10 mgal to the present anomalies, the mean anomaly over the region becomes positive. This, however, does not necessarily imply that the region is out of equilibrium, since a positive influence may be present from the mentioned basement structures, analogous to what was seen on the Norwegian coast (where the "basement" is not covered by younger sediments).
Off the coast the gravity field has the same character as on land, which points to a continuation of the subsurface structures, i.e. the region belongs to the Peri- balticum.
The disturbance of the contourlines along the northern part of the Danish West coast (see 6) may be interpreted perhaps as due to Rhenic structures (VON ZWERGER'S third Rhenic zone or East Frisian depression). This would imply that the direction of the Danish coast has been determined by the subsurface structure and is thus a tectonic direction.
Farther out to sea the anomalies become smaller. To the NW the course of the zero contour suggests a change of direction of the underlying structures. If this is real, a continuous transition is present from the E-W direction in Denmark to the N-S direction W of South Norway.
9.5 Reconstruction of the North-western European Caledonides
A reconstruction is given of the Caledonian trends in the northern part of the North Sea (Fig. 5).
Since no indication was found for a change of direction of the Great Glen Fault, we assume that this fault keeps its direction, passing SE of the Shetlands and dis- appearing in the continental edge off Norway. To obtain the position of the Shetlands before the origin of the fault (Lower Carboniferous?), the crustal block NW of the fault has to be shifted back about 100 km to the NNE. Thus we get an important, roughly N-S structure about half-way Scotland and Scandinavia.
The Shetlands are characterized by positive anomalies (Cf. gravity map of Europe, DE BRUYN, 1955). This may be explained by the occurrence of rocks that resemble very much those of the Buchan Platform (Cf. 9.2). On account of this resemblance we assume that the Shetlands and the Buchan Platform form part of an arched structure, possibly accompanied over its full length by positive anomalies. The Scottish Caledonides thus turn N, broken off by the continental edge N of the North Sea.
I t has been argued that the gravity anomalies off the Norwegian coast point to a N-S course of the Caledonian structures. So the geologically observed change of strike on land must be real, the Norwegian Caledonides turning S and presumably submerging in the Peribalticum, as assumed by VON ZWERGER.
We draw attention to the surprising symmetry of the NW-European Caledonian system in the given reconstruction (Fig. 6, modified after HOLTEDAHL, 1938).

The central zone of the system bifurcates both to the N and to the S. The overthrusting phenomena are restricted to the real fore-land boundaries. Further, there is a striking resemblance between the North Sea and the Barents Sea. In both regi- ons, left relatively undisturbed by the Caledonian orogeny, sedimentary basins developed during the Mesozoic and Tertiary. Hercynian structures, viz. those of Nova Zembla and of the Ardennes, border the basin areas to the NE and to the S respectively.
The resemblance between Scotland and Spitzbergen, the N-S strike of the Shet- lands, the change of strike in SW-Norway and the basement structures in the Peri- balticum all find a natural explanation in the above-developed picture. One point, however, remains to be solved, the ques- tion of what became of that part of the Caledonian system that lay NW of Nor- way between Spitzbergen and Scotland. Can this be found on Greenland, which then should have moved W as proposed by WEGENER? The first geological data point into this direction: striking resem- blance between the Eleonore Bay Forma- tion on Greenland and the Hekla Hook se- diment~ on Spitzbergen ; overthrustingover the fore-land to the W like the Moine thrust in Scotland and the overthrusting on Spitz- bergen (Professor E. WENK, Ziirich, in a lecture on the Danish East Greenland Expeditions at Utrecht, February 1959; Cf. HARLAND, 1958, who arrives at a much the same conclusion).
10 The southern part of the surveyed Fig. 6 The symmetric development of North- region
western Europe. Dashes : Caledonian 10.1 The older structures in the area Crosses: Hercynian Hatched: post-Hercynian ~d imen ta - Caledonian structures also occur in several tion "massifs" in Belgium as higher lying
parts of the pre-Devonian basement. The smaller massifs have been incorporated in the Hercynian folding. The largest, the Brabant Massif, acted rather as a buffer to this folding.
South of the Brabant Massif we find the folded Ardennes, N of it the late Palaeozoic lies relatively undisturbed. Analogously we find in Great Britain strongly folded late Palaeozoic in Cornwall and

PART 11 THE GRAVITY FIELD OF THE NORTH SEA 6 7
Wales, farther N the folding has been far less intensive. Here too, higher lying parts of the pre- Devonian basement mark this change in tectonics, viz. the outcropping Cambro-Silurian of Wales, the subsurface high of East Anglia and several smaller structures between these two highs (Cf. WOOLDRIDGE and LINTON, 1938; BULLARD et al., 1946).
VAN LECKWIJK (1956) recently opposed the current opinion on the role of the Brabant Massif during the Hercynian folding on account of the occurrence of thick series of essentially Carboniferous sediments on the eastern offshoot and on the N-flank of the Brabant Massif. Since this implies that the concerning part of the region during the Carboniferous participated in the geosynclinal sub- sidence, it would follow that the Massif could not act as a pressure barrier. Mechanically there is no reason, however, for this conclusion. For a consolidated block at greater depth still acts as a pressure barrier since the stress trajectories concentrate at the block, which gives a pressure shadow region in the higher parts. Besides, farther W the Massif almost certainly did not to the same degree partake in the Carboniferous subsidence and so a pressure shadow effect must have been present horizontally too. Further, the observation that the intensity of the folding decreases when approaching the Massif, is quite in harmony with the pressure barrier idea, and not contradicting it, as argued by VAN LECKWIJK.
Together with the Ardennes the Brabant Massif and its western continuation formed a tectonic high in Mesozoic times, partly above sea-level, partly as a sub- marine ridge.
At the end of the Mesozoic this high becomes less important as a basin boundary. On the con- tinental side its role seems somewhat to be taken over by the axis of Artois. Tertiary strata are found on the Brabant Massif, together with the relics of Cretaceous sediments (FOURMARIER, 1954). The basin of London developed on what is supposed to be the western prolongation of the Brabant Massif (SHERLOCK, 1947).
The mean anomaly over the region is positive. This can be attributed to the higher position of the pre-Mesozoic basement, the "Palaeozoic floor", with respect to the basins to the N and S (see 10.3). For the rest the gravity field reflects the complexity of the structural history.
DE M A G N ~ E (1 948, analysing the gravity map of Belgium ( JONES, 1948 and '5 l ) , remarked that the Cambro-Silurian may well contain important massifs of basic eruptive rocks of great density. The magnetic anomalies of Belgium (HOGE, 1950) support this suggestion.
The N-flank of the Brabant Massif and the East Anglia High are accompanied by positive anomalies. The positive anomalies of the interjacent part of the North Sea suggest that the general fall of the basement in East Anglia to the E (BULLARD et. al., 1946; CHATWIN, 1954), which is accompanied by a constriction of the gravity contours, is but a local phenomenon. Presumably the East Anglia High and the Brabant Massif form the higher parts of one large basement structure, bordering the North Sea basin to the S.
The change of positive into negative anomalies near Ostende cannot be related to a change in position of the Paleaozoic floor (Cf. LEGRAND, 1950) and must therefore be caused by a change of composition of the basement rock, possibly framed tectonically by faults (MORTELMANS, 1955). Nearer to the English coast the form of the Palaeozoic floor may well play an important part again.
A very conspicuous feature of the gravity field in the Dover Strait and the ad- joining English and continental regions is the predominance of nearly N-S contour lines (Fig. 7). Important N-S directed structures must be hidden in the subsurface, . -
on the age of which we have no information.

Fig. 7 The gravity field between 50" and 52"N and 0" and 3"E
rngal.
The region has been subjected to differential vertical movements: in the Tertiary a direct open connexion must have existed between the basin of Paris and the North Sea basin, over the subbasin of Arras, i.e. E of the present sea connexion. Such movements may equally well have determined the Quaternary breach from the Atlantic towards the North Sea.
A secondary curving of the contour lines suggests that the Hercynian structures, underlying the axis of Artois (ABRARD, 1948; PRUVOST and PRINGLE, 1924), continue towards the English coast in a direction of about N 300°E (Cf. WOOLDRIDGE and FLINTON, 1938, Figs. 47 and 48).
Also the Wealden anticline (EDMUNDS, 1954) is marked by secondary curvings of the N-S running contours only. The explanation must be that the history of this structure (subsidence, folding, uplift), which resulted in an anticline at the surface, did not leave its imprint on the form of the Palaeozoic floor. The few borings that reached this floor support this view (Cf. EDMUNDS, Fig. 14).
Contour in terval l s o s t a t i c 5 m i l l i g a l s
0 -15
. . . . . . . . . . anoma l ies . . . . .

PART I1 THE GRAVITY FIELD OF THE NORTH SEA
10.2 The North Sea basins
The North Sea area comprises two main basins, the basin of NW-Germany and the North Sea basin sensu stricto. On land the boundary between the basins is formed by the Mid Netherlands Ridge (SUNG, 1955).
In the NW-German basin huge salt layers were deposited during the Permian, in the North Sea basin this salt is lacking. The Triassic in NW-Germany developed in a rim facies, in England it is continental (GIGNOUX, 1950). Whether in these times both regions were separated already is possible (Cf. PANNEKOEK, 1956, Fig. 8), though not certain. According to GIGNOUX the development of both basins since the Jurassic followed different lines; the data supplied by VISSER and SUNG (see PANNE- KOEK, 1956) with regard to the Netherlands support this view.
The Mid Netherlands Ridge appears as a relative maximum on the gravity map of the Netherlands (VAN WEELDEN, 1957). This maximum can be followed up in the North Sea to about 55"N. From it the ridge is inferred to extend to the N, forming there too the separation between the two basins.
Near Vlieland, one of the Dutch Frisian Isles, the gravity maximum is related to positive magnetic anomalies (Cf. VELDKAMP, 195 1).
For the rest the ridge should not be seen as a solid barrier. Probably it consisted for the greater part of time only of a series of islands or of submarine elevations, remaining behind in the general subsidence of the area.
On land the basin areas are characterized by negative anomalies. There is a relation between the magnitude of the anomalies and the thickness of the younger sediments (Fig. 5).
The post-Triassic sediments in NW-Germany increase in thickness from 1500 m near the Danish border to 2500 - 4000 m near the Elbe (HELMS, VON HECHT and KEHRER, 1955). Gravity decreases with some tens of mgal. Exactly the same thing can be observed on the southern border of the NW-German basin (Cf. BENTZ, 1949, pp. 37, 96172, and DE BRUYN, 1955). Farther E this simple relation is obscured by the complicated conditions in the basement (the Peribalticum; Cf. REICH, 1949 and SCHLEU~ENER and C~oss, 1952).
The general fall to the NW of the basement in the Netherlands is accompanied by a change from positive anomalies in the SE to negative anomalies in the N and the W. The Central Graben which developed on the N-flank of the Brabant Massif, opening towards and forming part of the North Sea basin, is marked by strong negative anomalies, the Mid Netherlands ridge by positive anomalies.
Also the change of depth of the Palaeozoic floor in East Anglia from slightly more than 100 m near Cambridge to 800 m near Hunstanton (BULLARD et al., 1946; CHATWIN, 1954) is marked by a change from positive into negative anomalies. Farther N the sloping of the basement to the E (EDWARDS and TROTTER, 1954, Fig. 18; WILSON, 1948) is characterized by a N-S course of the gravity contours and again by a change from positive into negative anomalies. The observed relation between negative anomalies and the occurrence of Coal Measures (COOK and THIRLAWAY, 1951; COOK, HOSPERS and PARASNIS, 1951) does not invalidate this general picture.
We generalize this relation and interpret the negative anomalies found in the sea-covered area as caused by Mesozoic and Tertiary sediments. The zero contour then roughly represents the northern limit of the North Sea basins. A quantitative approach of' the problem is given in the next section.
We recall that little can be said on the transition towards and the extension of the Danish subbasin on account of the influence of the basement structures (9.4).
Beyond the "limits" of the basins also sedimentation occurred, but it did not result in a thick series of sediments (Cf. EASTWOOD, 1953 on the Jurassic system in Northern England. The fact that in England much of the Mesozoic series has been eroded must be ascribed to the Tertiary upheaval of Scotland).

Our interpretation is supported by the results of three seismic stations in the North Sea of the U.S. Hydrographic Office, which point to an increase of sediments from 57" to 55"N (Table V).
The region E of the Mid Netherlands Ridge is characterized by salt tectonics. The irregularities in the gravity field of the corresponding part of the North Sea may be related to these tectonics. The structures are partly influenced by the Rhenic direction, especially in the eastern part of the region (HECHT, VON HELMS and KEHRER, 1955; VON ZWERGER, 1948; Cf. 9.4).
Saxonian folding occurred on a small scale, giving structures in the Bentheim direction (nearly E-W) near the Dutch-German border. Going W this direction is replaced by the (also Saxonian) Subhercynian direction (roughly N 125"E). On the gravity map this change of direction is reflected in the details of the contour lines. Out to sea the Subhercynian direction can be followed about 80 km. Farther W it occurs again NE of East Anglia. Next it is then found in England, viz. in East Yorkshire (WILSON, 1948) in the Cleveland and the Market Weighton anticlines.
Regarding the Saxonian directions it can be observed that there is a general parallelism with the N-flank of the basement structure to which the Brabant Massif and the East Anglia High belong. We therefore believe that the variations of direction of the Saxonian folding primarily represents an adaptation of the folding to the subsurface structure. That the folding is not everywhere synchronous (Cf. WILSON, 1948) might be related to a differential giving way of the structures and their underground. Adaptation to the subsurface might also be the reason that on the whole the deformations of the Mesozoic in England are weaker than in the eastern part of the region.
10.3 The isostatic equilibrium of the region
We have seen that in the southern part of the surveyed region there is a relation between the gravity anomalies and the depth of the Palaeozoic floor. Can this relation fully account for the observed anomalies?
Miss SUZANNE CORON (1952) computed the effect of the post-Triassic sediments of the basin of Paris and arrived at the conclusion that the regional trend of the anomalies in that region can be explained by these sediments and their isostatic compensation.
To answer this question we postulate that the anomaly field can be described by a series of negative and positive zones: the negative of the North Sea basins, the positive of the East Anglia High, the Brabant Massif and the Ardennes, and the negative of the basins of Paris and Hampshire. Next we suppose that the anomalies are caused by a harmonic mass distribution at depth z = 0 and a same mass dis- tribution of reversed sign at depth z = T, the isostatic compensation of the former masses. According to a formula given by BULLARD and COOPER (1948), the attraction of a mass A sin p x at depth z is - 2n kA sin p x e-pz. The combined effect of disturbing mass and its compensation is thus ( l -e-p=) times the direct effect. Taking the width of each structure at roughly 210 km and T at 30 km, this factor is 0.36.
We thus have to account for a gravity wave of about three times the observed amplitude, or 75 mgal (25 mgal being roughly the difference between the positive

PART I1 THE GRAVITY FIELD OF THE NORTH SEA 7 1
and the negative zones). With a density contrast between sediment and basement of 0.3, this means that about 6000 m of sediment is needed to produce the observed field. If also deeper crustal layers of density larger than 2.7 are involved in the wave pattern of the surface, this figure can be put somewhat lower, say at 5000 m.
This order of magnitude for the total thickness of sediments fits in very well with the known data (Cf. 10.2). This implies that isostatic compensation has been realized. For, if the crust had retained its normal thickness, there would also be a mass deficiency at the lower boundary of the crust. The combined effect of this mass deficiency and that of the sediments attains 2.28 times the direct effect and in that case only less than 1000 m of sediment could be present. This figure is much too low.
From the data given by REICH and VON ZWERGER (1943) it appears that the mean of all published densities of NW-German rocks of all depths can be taken at 2.4.
UMBGROVE (1951), starting from the geology of the Netherlands, estimated the total thickness of post-Carboniferous sediments in the North Sea basin at 7500 - 9000 m.
Of course a simple harmonic mass distribution is not present in our area. In a Fourier series terms of larger wave length will appear, accounting for the predominance of negative anomalies when seen along a N-S profile from the 50th to the 55th latitude degree. This is in accordance with the geology: the area of sedimentation in this direction outranges the structural highs. For the rest the pattern is two-dimensional only in approximation.
The foregoing implies that besides the vertical movements the process of basin formation also brought about a thinning of the crust, provided at least that the crust was in equilibrium before the sinking started and that no disturbing influences from the mantle were or are present.
A different aspect of the question of the equilibrium is formed by the general level of the anomalies. If seen locally, i.e. not beyond the surveyed area, one would conclude that also for the region as a whole the equilibrium has been realized. However, with respect to the mean level ( + l 3 mgal; 1.6. p. 2) over the region covered by DE BRUYN'S map of Europe and North Africa, our region is certainly negative. The same holds if we apply a different formula for normal gravity deduced by HEISKANEN (1938) which gives for these latitudes a value of about 7 mgal higher than the international formula does. Compared with the positive anomalies farther on the continent, it might mean that the region of basin formation as a whole is negative with respect to the sediment supplying regions. If this feature would be a universal one, some further indication may be found in it for the solution of the problem of basin formation.
1 1 The postglacial uplift of Fennoscandia
The gravity field of the North Sea region is compatible with the outcome of a recent theoretical study on the subject of the postglacial uplift of Fennoscandia: outside the area of unloading (the melting of the icecap) no important movements occur (BURGERS and COLLETTE, 1958).
Figure 8 presents the form of the postglacial depression at several moments. The form at the moment of unloading, taken at right angles to the longer axis of the formerly ice-covered region, was developed into a Fourier series. The vertical movements could*thus be computed as a function of the distance to the origin.

Around the originally depressed, negative area a broad, positive bulge originates, which moves inward and eventually again disappears. Secondary waves occur if the depth of the substratum is taken finite or if we postulate other continuous or abrupt changes with depth of the viscosity. From the transition layer between 200 and 900 km depth a similar effect will arise, if this layer does represent a phase transition (Cf. VENING MEINESZ, 1956; MEIJERING and ROOYMANS, 1958).
The appearance of the positive bulge implies that the negative area is smaller than the rising one. The large geological anomalies of the actual field (HEISKANEN, 1926; WIDELAND, 1954 and '56; NISKANEN, 1939; Cf. 9.3) preclude the recognition of such an effect. Identification of the positive zone is therefore impossible. Nevertheless, it may well be present.
The same holds for secondary wave systems. Such systems, if of small amplitude, may easily be hidden in the geological anomalies. However, a zonal system of larger amplitude, conceivable as an effect of the transition zone, does not exist in our region. Neither does it in the region SE of the Bothnian Gulf, for which region ANDREJEV (1938) showed that all the gravity anomalies can be related to known or probable geology.
The gravity field does not yield any information on the present-day tilting to the NW of the Netherlands and Belgium (EDELMAN, 1954; JONES, 1950). This tilting might be related to a secondary wave movement of the substratum. Another possibility is a supply of light, crustal material from the SE (spreading of the molten root of the Alps; Cf. VENING MEINESZ, 1954). Epeirogenetic movements of unknown origin (Cf. PANNEKOEK, 1954; EDELMAN, 1954) cannot, however, be precluded.
12 Conclusions
The new gravity data enabled us to design a structural sketch of the North Sea area (Fig. 5). Starting from a detailed survey of the region NE of Scotland, which showed that the anomaly pattern in the Moray Firth must probably be explained by an alternation of acid and basic rock in the subsurface, the direction of the Caledonian trends between Scotland and Norway was discussed. The Shetlands were brought in their original position by a shift to the NE, i.e. along the Great Glen Fault. The simplest reconstruction is then obtained by assuming that the Scottish structures turn off in a northward direction, joining the strike of the Shet- lands. In a similar way the Norwegian structures would turn off to the S and farther southward to the E, disappearing in the Peribalticum (Denmark and North Germany). The resulting picture of North-western Europe is to a high degree symmetric, the North Sea area forming the image of the Barents Sea shelf area (Fig. 6). The large anomalies along the Norwegian coast were traced back to basic and ultrabasic rocks, exposed in the coastal regions. The anomalies over the trench round S- and SW-Norway suggest that this structure has originated in a way as has been sketched in Fig. 4d and e. For the rest the origin of the trench should be seen in relation to the Cainozoic upheaval of the rim of North-western Europe.
Farther S we come into an area of basin formation. The basins are characterized by negative anomalies, the separating ridges by positive anomalies. This enabled us to indicate the probable extent of the basins (the North Sea basin sensu strict0 and the NW-German basin) and of the ridge in between (the Mid Netherlands Ridge). These structures together with the Brabant Massif and the basins of Paris and Hampshire appeared to be mutually in isostatic equilibrium, which implies that the process of basin formation somehow affected also the deeper layers of the crust. As a whole this region tends to be negative with respect to the sediment supplying regions.

PART I1 THE GRAVITY FIELD OF THE NORTH SEA 7 3
Apart from this feature the region is in isostatic equilibrium, the anomaly dis- tribution being accounted for by the structures in the subsurface. No great effects of the post-glacial readjustment of equilibrium of Fennoscandia are present outside the area of upheaval. This is in accordance with recent theoretical insights into the problem (Fig. 8). Vertical movements of small amplitude may nevertheless occur, their effect upon gravity being hidden in the uncertainty term of the geological corrections.
1 The fo rm of the depress~on I S given
650 a t several moments of i t s development
Fig. 8. The postglacial uplift of Fennoscandia

13 References
R. ABRARD, Gtologie de la France. Payot, Paris, 1948.
B. ANDREJEV, The geological significance of the gravity map of Karelia, Finland and Leningrad region. Materials of the Central Geol. and Prosp. Inst., fasc. 7, Moscou, pp. 1-26, 1938.
E. B. BAILEY, Geological map of the British Islands 1 : 1584000, 3rd Edition, 1939.
E. B. BAILEY, The structural history of Scotland. Rep. 18th Int. Geol. Congr. London, Part I, pp. 230-255, 1948.
E. B. BAILEY and 0. HOLTEDAHL, Northwestern Europe Caledonides. Reg. Geol. d. Erde, Bd 2, Abschn. 11, Leipzig, 1938.
A. BENTZ, Erdol und Tektonik in N.W. Deutschland. Amt fiir Bodenforschung, Hannover-Celle, 1949.
K. BEURLEN, Erd- und Lebensgeschichte. Verlag Quelle und Meyer, Leipzig, 1939.
M. H. P. BOTT, Negative gravity anomalies over acid "intrusions" and their relation to the struc- ture of the earth's crust. Geol. Mag., Vol. 90, pp. 257-267, 1953.
M. H. P. BOTT, A geophysical study of the granite problem. Quart. J. Geol. Soc., Vol. 112, pp. 45-67, 1956.
B. BROCKAMP, Zum Bau des tieferen Untergrundes in Nordost-Deutschland. Jahrb. Reichstelle f. Bodenforschung, Bd 61, pp. 157-185, 1941.
B. C. BROWNE and R. I. B. COOPER, Gravity measurements in the English Channel. Proc. Roy. Soc. B, vol. 139, pp. 42C447, 1952.
J. W. DE BRUYN, Isogam maps of Europe and North Africa. Geoph. Prospecting, Vol. 111, 1-14, 1955.
E. C. BULLARD and R. I. B. COOPER, The determination of the masses necessary to produce a given gravitational field. Proc. Roy. Soc. A, 194, pp. 332-347, 1948.
E. C. BULLARD, T. F. GASKELL, W. B. HARLAND and C. KERR-GRANT, Seismic investigations on the Palaeozoic floor of East England. Phil. Trans. Roy. Soc., Ser. A, Vol. 239, pp. 29-94, 1946.
J. M. BURGERS and B. J. COLLETTE, On the problem of the postglacial uplift of Fennoscandia, I and 11. Proc. Kon. Ned. Ak. Wet., A'dam, Ser. B, 61, pp. 221-241, 1958.
C. P. CHATWIN, The Hampshire Basin and Adjoining Areas. Br. Reg. Geol., 2nd ed., 1948.
C. P. CHATWIN, East Anglia and Adjoining areas. Br. Reg. Geol., 3rd ed., 1954.
A. H. COOK, The calculation of deflexions of the vertical from gravity anomalies. Proc. Roy. Soc. A, vol. 204, pp. 374-395, 1950.
A. H. COOK, Comparison of the acceleration due to gravity at the National Physical Laboratory, Teddington, the Bureau International des Poids et Mesures, Stvres, the Physikalische-Tech- nische Bundesanstalt, Brunswick and the Geodetic Institute, Potsdam. Proc. Roy. Soc. A, vol. 213, pp. 408424, 1952.
A. H. COOK, Adjustment of the principal gravity observations in Great Britain. M.N.R.A.S., Geoph. Suppl., vol. 6, no. 8, pp. 494-534, 1953.
A. H. COOK, J. HOSPERS and D. S. PARASNIS, The results of a gravity survey in the country between the Clee Hills and Nuneation. Quart. J. Geol. Soc., Vol. 107, pp. 287-306, 1951.
A. H. COOK and H. I. S. THIRLAWAY, A gravimetric survey in the Bristol and Somerset Coalfields. Quart. J. Geol. Soc., Vol. 107, pp. 255-286, 1951.
S. CORON, Anomalies isostatiques ntgatives des bassins stdimentaires. Essai d'interprttation de la carte isostatique du bassin parisien. Congr. Gtol. Int., Comptes Rendus 19me session, fasc. IX, pp. 51-83, Alger, 1952.
T. EASTWOOD, Northern England. Br. Reg. Geol. 3rd ed., 1953.
T. EDELMAN, Tectonic movements as resulting from the comparison of two precise levellings. Geol. en Mijnbw. (nw. ser.) 16e jg. pp. 209-213, 1951.
F. H. EDMUNDS, The Wealden District. Br. Reg. Geol. 3rd ed., 1954.
F. H. EDMUNDS and K. P. OAKLEY, The Central England District. Br. Reg. Geol. 2nd ed., 1947.

PART I1 THE GRAVITY FIELD OF THE NORTH SEA 75
W. EDWARDS and F. M. TROTTER, The Pennines and Adjacent Areas. Br. Reg. Geol. 3rd ed., 1954.
P. FOURMARIER, Prodrome d'une description gtologique de la Belgique. Soc. GCol. de Belgique, Litge, 1954.
G. FRODIN, On the analogies between the Scottish and Scandinavian portions of the Caledonian mountain range. Bull. Geol. Inst. Upsala, Vol. XVIII, p. 199 ff., 1922.
M. GIGNOUX, GCologie stratigraphique, 4e Cd., Masson et Cie, Paris, 1950.
R. L. G. GILBERT, An investigation into the calibration of gravity meters. Geoph. Journ., Vol. 1, pp. 330440, 1958.
J. GOGUEL, InterprCtation GCologique. In: Mesures gravimttriques en Bretagne. Publ. Bur. Rech. GCol. GCoph. no. 8, Paris, 1950.
-4. GREGERSEN and TH. SORGENFREI, Efterforskingsarbejdet i Danmarks dybere undergrund. Medd. Dansk Geol. For., Kcabenhavn, Bd 12, pp. 141-151, 1951.
H. HAALCK, Messungsergebnisse mit dem statischen Schweremesser auf der Nord- und Ostsee und in Norddeutschland. Zeitschr. f. Geoph., X I Jahrg., pp. 55-74, 1935a.
H. HAALCK, Verzeichnis der im Jahre 1934 mit dem statischen Schweremesser auf der Nord- und Ostsee und in Norddeutschland gemessene Schwerewerte. Zeitschr. f. Geoph., X I Jahrg., pp. 134-143, 1935b.
TH. DE HAAS, A new method and a new instrument for the determination of the chronometer correction by means of radio time signals. Bull. GCod., nouv. str., no. 39, pp. 20-28, 1956.
W. B. HARLAND, The Caledonian sequence in Ny Friesland, Spitsbergen. Quart. J. Geol. Soc., Vol. 114, pp. 307-342, 1958.
F. HECHT, H. VON HELMS and W. KEHRER, Reflection-seismic exploration of Schleswig-Holstein, Germany and its geological interpretation by well-data. Proc. Fourth World Petr. Congr., Section I, pp. 715-730, Rome 1955.
W. HEISKANEN, Schwerkraft und Isostatische Kompensation in Norwegen. Veroff. Finn. Geod. Inst. no 5, 1926.
W. HEISKANEN, Investigation on gravity formulae. Publ. Isost. Inst. of the I.A.G., no. 1, Helsinki, 1938.
E. HOGE, In: Symposium sur les mouvements rtcents du sol belge et les enseignements qu'ils ap- portent. IIIe Congrts Nat. de Sciences, Vol. 4, pp. 31-45, Bruxelles, 1950.
0. HOLTEDAHL, Some points of structural resemblance between Spitzbergen and Great Britain and between Europe and North America. Avh. Norske Vidensk. Akad. i Oslo, I, Matem.- Naturv. Klasse, no. 4, pp. 1-20, 1925.
0. HOLTEDAHL, Correlation notes on Scottish-Norwegian Caledonian geology. Norsk Geol. Tidsskr., Bd 19, pp. 326339, 1939.
0. HOLTEDAHL, The structural history of Norway and its relation to Great Britain (7th William Smith Lecture). Quart. J. Geol. Soc., Vol. 108, pp. 65-98, 1952.
0. HOLTHEDAHL, Norges Geologi (with geological map 1 : 1000 000). Norges Geologiske Under- scakelse, no. 164, Oslo, 1953.
L. JONES, Le levC gravimktrique de la Belgique. Bull. Soc. Belge de Gtol., Vol. 57, pp. 568-574, 1948.
L. JONES, Les premiers rtsultats de la comparison du Deuxitme Nivellement GCnCral (1948) avec des nivellements anciens. Bull. Soc. Belge de GCol., Vol. 59, pp. 156-162, 1950.
L. JONES, Les anomalies isostatiques en Belgique. Inst. GCogr. Militaire, Bruxelles, 195 1.
0. T. JONES, The structural history of England and Wales. Rep. 18th Int. Geol. Congress, London, Part I, pp. 216229, 1948.
W. Q.KENNEDY, The Great Glen Fault. Quart. J. Geol. Soc., Vol. 102, pp. 42-72, 1946.
W. P. VAN LECKWIJCK, Tableaux d'une aire instable au PalCozoique suptrieure: la terminaison orientale d~ Massif du Brabant aux confins Belgo-NCerlandais. Gedenkboek H. A. Brouwer. Verh. Kon. Ned. Geol. Mijnb. Genootschap, Geol. Ser., XVI, pp. 252-273, 1956.
G. P. LEEDAL and G. P. L. WALKER, Tear folds in the Barnesmoore area, Donegal. Geol. Mag., vol. 91, pp. 116-120, 1954.

R. LEGRAND, Carte geologique et hypsomCtrique du socle palCozoique de la Belgique, completCe par les allures gCnCral du crCtace. Bull. Soc. Belge de GCol., Vol. 59, pp. 318-341, 1950.
M. MACGREGOR and A. G. MACGREGOR, The Midland Valley of Scotland. Br. Reg. Geol., 2nd ed. (revised), 1948.
I. DE M A G N ~ E , Commentaire gtologique sur la nouvelle carte gravimttrique de la Belgique. Bull. Soc. Belge de GCol., Vol. 57, pp. 576588, 1948.
J. L. MEIJERING and C. J. M. ROOYMANS, On the olivine-spine1 transition in the earth's mantle. Proc. Kon. Ned. Ak. Wet. A'dam. Ser. B, 61, pp. 333-344, 1958.
C. MORELLI, Contribution to the European gravity net. 1st. Naz. di Geofisica, Roma, 1954.
G. MORTELMANS, Considerations sur la structure tectonique et la stratigraphie du Massif du Brabant. Bull. Soc. Belge de Gtol., Vol. 64, pp. 179-2 18, 1955.
TH. MURPHY, Measurements of gravity in Ireland. Dublin Inst. for Adv. Studies, Geophys. Mem. no. 2 part 3, 1952.
E. NISKANEN, On the upheaval of land in Fennoscandia. Ann. Acad. Scient. Fennicae, Ser. A, 53, no. 10, pp. 1-30, 1939.
G. NQRGAARD, Statische Schweremessungen auf See. Verh. 8. Tagung Balt. Geod. Komm., pp. 127-140, 1936.
A. J. PANNEKOEK, Tertiary and quarternary subsidence in the Netherlands. Geol. en Mijnbw. (nw. ser.) 16e jg., pp. 156164, 1954.
A.J. PANNEKOEK, Geological history of the Netherlands. Gov. Printing Office, Den Haag, 1956.
J. PHEMISTER, The Northern Highlands. Br. Reg. Geol., 2nd ed., 1948.
W. S. PITCHER and R. L. CHEESMAN, Summer field meeting in N.W. Ireland with an introductory note on the geology. Proc. Geol. Ass., Vol. 65, pp. 345-371, 1954.
J. PRINGLE, The South of Scotland. Br. Reg. Geol., 2nd ed. (revised), 1948.
P. PRUVOST and J. PRINGLE, A synopsis of the geology of the Boulonnais, including a correlation of the Mesozoic rocks with those of England, with report of excursion. Proc. Geol. Ass., XXXV, pp. 29-67, 1924.
H. H. READ, The last twenty years' work on the Moine Series of Scotland. Gedenkboek H. A. Brou- wer. Verh. Kon. Ned. Geol. Mijnb. Genootschap, Geol. Ser., XVI, pp. 330-354, 1956.
H. H. READ and A. G. MACGREGOR, The Grampian Highlands. Br. Reg. Geol., 2nd ed., 1948.
H. REICH, Die Geophysikalische Erforschung N.W. Deutschlands, 1932-1947. Ein uberblick. Erdo1 U. Tekt., p. 21, 1949.
H. REICH and R. VON ZWERGER, Taschenbuch der angewandten Geophysik. Ak. Verlagsgesellsch. Becker U. Erler, Leipzig, 1943.
A. SCHLEUSENER and H. C~oss , Schwerekarten von Zentraleuropa nach Gravimetermessungen. Congr. GCol. Int., Comptes Rendus 19me session, fasc. IX, pp. 85-109, Alger, 1952.
R. SCHWINNER, Geologische Bemerkungen zu den Norwegischen Schweremessungen. Gerl. Beitr. z. Geoph., Bd 19, pp. 107-133, 1928.
R. SCHWINNER, Die Schwere am Ostrande des Fennoskandischen Schildes. Gerl. Beitr. z. Geoph., Bd 34, pp. 436472, 1931.
R. SCHWINNER, Die Germanische Nord-Siidsenke. Geol. Rundschau, Bd 25, pp. 2638, 1934.
R. L. SHERLOCK, London and Thames Valley. Br. Reg. Geol., 2nd ed., 1947.
H. STILLE Gottinger Beitrage zur saxonischen Tektonik. Abh. Preuss. Geol. Landesanst., Neue Folge, Heft 95, 1923-'25.
G. C. L. SUNG, The Wealden formation in the Netherlands. Proc. Fourth World Petr. Congr., Section I, pp. 151-160, Roma, 1955.
H. I. S. THIRLAWAY, Measurements of gravity in Ireland. Dublin Inst. for Adv. Studies, Geoph. Mem., no. 2, part 2, 1951.
J. H. F. UMBGROVE, Structural boundaries of the Netherlands and the origin of Holland. Geol. en Mijnbw. (nw. ser.), 13e jg., pp. 2 13-2 18, 1951.

PART I1 THE GRAVITY FIELD OF THE NORTH SEA 7 7
J. VELDKAMP, The geomagnetic field of the Netherlands, reduced to 1945.0. Publ. Roy. Neth. Met. Inst., no. 134, De Bilt, 1951.
F. A. VENING MEINESZ, Theory and practice of pendulum observations at sea. Publ. Neth. Geod. Comm., Waltman, Delft, 1929. Idem, Vol. 2, 1941.
F. A. VENING MEINESZ, Gravity expeditions at sea, Vol. IV, Idem, 1948.
F. A. VENING MEINESZ, Les "graben" africains, rksultats de compression ou de tension dans la croiite terrestre? Bull. Inst. Roy. Col. Belge, Vol. 21 no. 2, 1950.
F. A. VENING MEINESZ, The second order corrections for pendulum observations at sea. Proc. Kon. Ned. Ak. Wet. A'dam, Ser. B, 56, pp. 218-227, 1953.
F. A. VENING MEINESZ, Earth-crust movements in the Netherlands resulting from Fennoscandian postglacial isostatic readjustment and Alpine foreland rising. Proc. Kon. Ned. Ak. Wet. A'dam, Ser. B, 57, pp. 142-155, 1954.
F. A. VENING MEINESZ, A phase-transition-layer bztween 200 and 900 km depth in the earth? Proc. Kon. Ned. Ak. Wet. A'dam, Ser. B, 59, pp. 1-10, 1956.
A. VAN WEELDEN, History of gravity observations in the Netherlands. Note accompanying the Bouguer gravity map etc. Gedenkboek F. A. Vening Meinesz. Verh. Kon. Ned. Geol. Mijnbk. Genootschap, Geol. Ser., XVIII, pp. 305-309, 1957.
B. WIDELAND, Topographic-isostatic reduction of the Swedish gravity stations. Medd. nr. 23, R. Allm. Kartverk, 1954.
B. WIDELAND, Topographic-isostatic anomaly maps of Sweden. Medd. nr. 26, R. Allm. Kartverk, 1956.
V. WILSON, East Yorkshire and Lincolnshire. Br. Reg. Geol., 1948.
R. VON ZWERGER, Die tiefere Untergrund des Westlichen Peribaltikums. Abh. Geol. Landesanst. Neue Folge, Heft 210, Berlin, 1948.


PART I1 THE GRAVITY FIELD OF THE NORTH SEA
TABLE I The results of 1955
Nr. 1 Date 1955 1 Base station(s) l Peterhead
,, ,>
Peterhead, Aberdeen ,, >, 2 7 > Y
> > ,, ,, 9 ,
,, 3 ,
>, > >
2, >)
2, 9 ,
,, > >
,, 7 2
> > ,, > > ,, > > , ,
Aberdeen 7,
3 ,
5 >
,, 3,
Den Helder, Den Helder 2, 3 ,
Den Helder, Den Helder 9 2 9 9
, > > 9
3 > 2,
> 9 ,, ,> 9,
,> 9 ,
, , ,, 2, ,, >, 2,
> > >, > > > >
> > ,, >, > >
,, 9 ,
2, 9 ,
2 7 2,
Den Helder, Den Helder ,, ,, 3 , 9,
Den elder, H. of Holland H. of Holland I, Flushing

TABLE I The results of 1955 (continued)
Glosure 1 go ,g
I I . . I error
July, 20 20 2 0 2 1 2 1 2 1 2 1 22 22 22 22 22 22 2 5 2 6
Aug., 6 6 6 6 6 7
3 1 3 1 3 1 3 1 3 1 3 1 3 1 3 1 3 1
Sept., 1 1 1 1 1 1
-. 1 l
H . of Holland I , Flushing
Base station(s) Nr.
3, 9 >
Flushing, Newhaven
Date 1955
2 ) 2 9
Newhaven, Newhaven , , >, , , ,> ,, 3 ,
9 ) , , >, , ,
Newhaven 9 ,
Den Helder, Grimsby
7 7 9 9
Grimsby Den Helder, Den Helder
,, >,
> Dundee, Leith
,, ,> 3 , 9 ,
2 2 ,, 2, 9,
,, ,, ,, 9 ,

PART II THE GRAVITY FIELD OF THE NORTH SEA 8 1
Nr .
1141 1142 1143 1144 1145 1146 1147 1148 1149 1150 1151 1152 1153 1154 1155 1156 1157 1158 1159 1160 1161 1162 1163 1164 1165 1166 1167 1168 1169 1170 1171 1172 1173 1174 1175 1176 1177 1126 p )
1178 1179 1180 1082 1181
l) reoccupied at Sept. 20 2, discarded; see Sept. 20 3, check station; see Sept. 1 ') check station; see Sept. 2
(continued)
Closure error
f0.2
+ 0.9 ?
+ 1.8
+0.1
go
981614.5 614.1 616.5 556.6 559.6 546.7 547.6 549.7 546.4 564.0 572.1 583.1 551.1 566.0 570.2 550.9 512.3 471.8 484.0 497.9 479.6 514.4 488.4 481.8 480.1 485.5 507.7 452.1 443.7 433.6 432.1 451.6 453.9 443.7 439.2 436.5 43 1 .O 429.8 222.2 206.0 188.6 210.9 204.1
Numbers in italics indicate a reoccupation or a discarded value
TABLE I The results of 1955 ' Base station(s)
Sekt., 9 9 9
11 11 11 11 11 12 12 12 12 12 12 13 13 13 13 14 14 14 14 14 14 15 15 16 17 17 17 17 17 17 17 18 18 18 18 20 20 20 20
1 20
Dundee, Leith j j 2,
9 , 9 ,
Leith, Hartlepool > 2,
j) > j
> > 97
> > > 7
> > > >
> j > 3
2, >)
2 9 3 9
> > >)
2 , 2 3
> j 2,
> 7
2, > 3
> > 5 9
9, >)
) > > >
I > 2 )
j > 3 3
3 3 >, >) > >
9 , > >
>) >)
Hartlepool Hartlepool, station 1 126
>, j1
> ) 9 1
2, >)
> > 9 9
> > 9 ,
>) >)
7 9 > >
> 1 >
7 9 7 >
2 ) ,> Hook of Holland I, Harwich
2 7 ,> 9 , ,, 9 ) > j
j 7 )

TABLE I1 The results of 1956
Change d U
Nr. Sept. subm. '56
m I sec 1 milligal 10-' sec
1 1033 {
Kristiansand 0 -0.17 72 - (0) -
0 -0.08 72 - (0) -
1193 14 15.7 3.5 -0.7 0.2 +0.02 58 0 (3) 2 1194 14 42.2 8.4 -0.1 0 $0.08 65 - 0.5(6) 1 1195 14 42.2 7.6 -0.3 0.1 t 0 . 0 8 66 + 9.5(4) 1 1196 14 42.2 7.6 0 0.1 t0 .02 78 - 0.5(6) 2 1197 15 42.2 9.8 2.4 0.5 -0.02 54 + 5.5(6) 2 1198 15 88.0 10.0 0 0 $0.03 64 + 1 (4) 1 1199 15 33.1 8.3 0.5 0.1 +0.01 60 + 12 (4) 1 1200 15 42.2 11.6 1.7 0.4 +0.17 59 $ 1.5(3) 2 1201 15 57.5 11.2 1.0 0.2 +0.25 71 + 8.5(8) 1 1202 16 57.5 11.2 1.9 0.4 -0.02 75 + 8.5(5) 0.7 1203 16 57.5 9.5 0.1 0 -0.04 64 + 3.5(5) 1 1204 16 42.2 8.5 0.3 0.1 0 68 + 3.5(5) 0.7 1205 16 72.7 10.0 0.2 0.1 0 66 + 3.5(4) 1 1206 16 42.2 9.7 0.3 0.1 -0.01 64 + 2 (6) 1 1207 17 42.2 8.5 0.8 0.2 t0.04 65 + 18.5(6) 0.7 1208 17 1 Bergen 0 +0.02 68 + l l (5) 0.5 1209 17 57.5 9.3 0.1 0 t0 .02 70 - 1 (6) 1 1210 17 57.5 9.1 0 0 -0.14. 75 - 3.5(6) 1 1211 18 57.5 8.7 0.6 0.2 -0.20 67 + 5.5(5) 0.5 1212 18 42.2 8.5 0.2 0.1 -0.02 64 + 2 (5) 0.7 1213 18 57.5 11.0 0.1 0 0 57 - 7.5(6) 1 1214 18 42.2 10.0 0.1 0 +0.23 68 + 4 ( 6 ) 1 1215 18 42.2 9.6 0 0 t 0 . 0 4 73 - 1 (5) 1 1216 19 42.2 11.0 0.2 0.1 -0.09 65 + 0.5(6) 1 1217 19 42.2 11.8 0.1 0 -0.10 74 + 6 ( 6 ) 0.5 1218 19 42.2 12.1 0.2 0.1 +0.09 67 + 3.5(6) 1 1219 19 42.2 10.2 0.2 0.1 +0.18 71 - 5 (5) 0.7 1220 19 42.2 10.1 0.2 0.1 +0.25 74 + 4 (4) 0.7 1221 20 42.2 9.8 0.2 0.1 -0.13 70 + 2.5(6) 1 1222 20 42.2 10.2 0 0 - 0 . 1 6 64 + l 2 (6) 0.7 1223 20 42.2 11.5 0.1 0 -0.01 71 + 3 (6) 1 1224 20 42.2 11.4 0 0 - 8.5(6) 0.7 1037 21 42.2 11.6 0 0 +0.30 + 0.5(5) 1 1225 21 42.2 11.5 0.2 0.1 -0.03 l226 21 42.2
Numbers in italics indicate a reoccupation of a gravimeter station l) station 1227 has been discarded; Cf. Table I11
milligal
I I

PART II THE GRAVITY FIELD OF THE NORTH SEA 8 3
TABLE I11 The results of 1957
1228 1229 1230 1231 1232 1233 1234 1235 1236 1237 1238 1239 1240 1241 1242 1243 1244 1245 1246 1235 l )
1247 1248 1249 1250 1251 1252 1253 1254 1255 1256 1257 1258 1249') 1259 1260 12273)
Numbers
l) check station; see Sept. 19 7 check station; see Sept. 21 3 , reoccupied pendulum station 4 , check station; see Sept. 20
check station; see Sept. 22
18 18 18 18 18 18 19 19 19 19 19 19 19 19 19 20 20 20 20 20 20 20 21 21 21 21 21 21 21 21 21 21 21 22 22 22
in italics
+0.2
-0.2
indicate
981735.6 734.2 713.3 714.6 719.1 722.4 731.1 742.7 752.2 736.6 750.8 771.9 763.1 737.7 732.1 763.3 730.3 739.5 744.5 742.6 731.1 726.7 753.0 739.3 717.6 741.9 737.4 736.6 751.1 766.7 750.2 748.5 753.4 744.3 743.7 746.5
a reoccupation
0.1 0.2 0.2 0.2 0.2 0.2 0.2 0.2 0.2 0.2 0.2 0.2 0.2 0.2 0.2 0.2 0.2 0.2 0.2 0.2 0.2 0.2 0.2 0.2 0.2 0.2 0.2 0.2 0.2 0.2 0.2 0.2 0.2 0.3 0.3 0.3
1261 1262 1263 1264 1265 12454) 1266 1267 1268 1269 1270 1271 1272 1273 1274 1275 1276 1277 1278 1279 1280 1281 1282 1283 1284 1285 1286 1287 1288 1289 1290 1291 1227') 1292 1293
22 22 22 22 22 22 22 23 23 23 23 23 23 23 23 23 23 24 24 24 24 24 24 24 24 24 25 25 25 25 25 25 25
;!
+1.1
- 1.4
l.3
981757.1 760.7 759.8 763.2 764.9 740.3 755.6 747.0 762.8 771.1 783.3 796.9 834.9 841.4 859.0 868.7 873.8 882.3 857.7 867.9 874.0 862.0 871.1 865.2 817.8 865.5 856.2 803.7 810.6 788.4 786.5 764.1 746.0
0.3 0.3 0.3 0.3 0.3 0.3 0.4 0.4 0.4 0.4 0.4 0.4 0.4 0.4 0.4 0.4 0.4 0.4 0.4 0.4 0.4 0.4 0.4 0.4 0.4 0.4 0.4 0.4 0.4 0.4 0.4 0.4 ~ !!:

Longitude I
TABLE IV Free-air and isostatic anomalies and
Depth in
metres
Kristiansand 87.8 73.2 84.6 95.1
97.9 88.3 65.9 69.5 78.7
81.0 82.4 60.4 38.9 27.1
41.5 45.1 63.6 7 1.4 88.3
94.2 73.7 67.7 29.9 27.8
24.4 24.1 25.9 25.6 30.2
37.5 43.9 37.8 34.8 38.7
29.6 33.9 36.9 49.4 58.9
40.3 33.2 28.7 32.6 16.8
Anomalies in milligal l Free- T = 3 0 k m

PART II THE GRAVITY FIELD OF THE NORTH SEA 85
the effects of topography and compensation
Reductions in 0.1 milligal
R = O R = 29.05 R = 58.1 R = 116.2 R = 174.3 R = 232.4 Topog-
0 + 4 6 + l + 4 7 + l + 4 8 + l $ 6 4 + 5 + 7 4 + l 3 + 6 9 + 2 9 + 6 0 - 6 6 -16 - 6 7 -16 - 6 9 -16 - 6 8 -16 - 6 2 -15 - 5 2 - 1 4 + 50 - 53 -22 - 54 -22 - 55 -22 - 56 -23 - 55 -26 - 48 - 32 + 58 - 36 -21 - 36 -21 - 33 -20 - 24 -19 - 14 -15 - 8 - 6 + 65 - 57 -23 - 57 -23 - 57 -22 - 54 -22 - 51 -22 - 41 - 21
+ 68 - 57 -24 - 57 -24 - 57 -24 - 55 -25 - 53 -25 - 44 - 29 + 61 - 52 -23 - 52 -23 - 52 -23 - 51 -24 - 47 -28 - 40 - 35 + 4 5 - 4 6 -19 - 4 6 -19 - 4 7 -19 - 4 6 -20 - 4 5 -23 - 3 7 - 2 9 + 4 8 - 4 5 -16 - 4 6 -16 - 4 7 -17 - 4 8 -17 - 4 9 -19 - 4 4 - 2 3 + 54 - 48 -13 - 48 -13 - 49 -13 - 49 -13 - 48 -12 - 41 - 10
+ 5 6 - 5 0 -10 - 5 0 -10 - 5 1 -10 - 5 0 - 8 - 4 3 - 6 - 3 5 - 2 + 5 7 - 5 7 - 8 - 5 7 - 8 - 5 8 - 8 - 5 3 - 8 - 4 2 - 5 - 3 2 0 + 4 1 - 4 9 - 6 - 5 1 - 6 5 1 - 6 - 4 7 - 5 - 3 7 - 2 - 2 8 + 3 + 2 7 - 4 0 - 3 - 4 1 - 3 - 4 3 - 3 - 4 1 - 1 - 3 5 + 3 - 2 6 + l 1 + 2 5 - 2 4 -10 - 2 5 -10 - 2 4 - 9 - 2 8 - 9 - 2 7 - 9 - 2 5 - 7
+ 2 8 - 3 1 1 0 - 3 1 -10 - 3 3 -10 - 3 6 -10 - 3 7 - 9 - 3 2 - 7 + 3 1 - 3 5 -13 - 3 5 -13 - 3 7 -13 - 3 7 -13 - 3 8 -14 - 3 4 - 1 5 + 4 4 - 4 -22 - 3 -22 + 2 -21 + l 4 -20 + 2 3 -14 $ 2 2 - 3 + 49 - 44 -18 - 44 -18 - 43 -17 - 38 -15 - 30 -11 - 22 - 2 $ 61 - 5 1 -20 - 5 1 -20 - 5 0 -20 - 4 8 -18 - 4 2 -17 - 3 6 - I 1
+ 6 5 - 5 3 -20 - 5 2 -20 - 5 1 -19 - 4 9 -20 - 4 6 -21 - 3 8 - 2 3 + 51 - 46 -21 - 46 -21 - 46 -21 - 44 -22 - 43 -24 - 35 - 30 + 4 6 - 4 3 -20 - 4 3 -20 - 4 4 -20 - 4 3 -21 - 4 2 -24 - 3 5 - 3 0 + 2 1 - 1 2 - 8 - 1 2 - 8 - 1 2 - 8 - 1 0 - 7 - 7 - 6 - 5 - 4 + l 9 - 1 7 -10 - 18 -10 - 1 6 -10 - 1 5 - 9 - 1 2 - 8 - 1 0 - 6
+ l 7 - 3 - 4 - 3 - 4 - 3 - 4 0 - 3 + 4 0 + 4 + 5 + l 7 - 7 - 5 - 7 - 5 - 6 - 5 - 6 - 3 - 5 - 1 - 4 + 4 + l 8 - 1 0 - 7 - 1 0 - 7 - 1 0 - 7 - 9 - 6 - 5 - 5 - 4 - 3 + l 8 - 1 5 - 8 - 1 6 - 8 - 1 5 - 8 - 1 5 - 7 - 1 2 - 5 - 9 - 2 + 2 1 - 1 6 - 9 - 1 7 - 9 - 1 5 - 9 - 1 4 - 8 - 1 1 - 7 - 8 - 5
+ 2 6 - 1 8 - 8 - 1 8 - 8 - 1 6 - 8 - 1 3 - 7 - 1 1 - 5 - 8 - 2 + 3 0 - 1 4 - 8 - 1 3 - 8 - 1 0 - 8 - 8 - 7 - 6 - 5 - 3 - 2 + 2 6 - 5 - 9 - 5 - 9 - 3 - 9 - 2 - 7 0 - 3 + l + 3 + 2 4 - 4 - 8 - 4 - 8 - 3 - 8 0 - 7 t 3 - 3 + 3 + 3 + 2 7 - 5 - 9 - 4 - 9 - 2 - 9 + 2 - 8 + 4 - 4 + 5 + 2
+ 2 7 - 1 3 - 5 - 1 3 - 5 - 1 1 - 5 - 1 0 - 3 - 9 - 1 - 6 + 3 + 2 3 - 1 5 - 8 - 1 5 - 8 - 1 3 - 8 - 1 1 - 6 - 9 - 4 - 7 0 + 2 5 - 1 8 - 7 - 1 6 - - 7 - 1 5 - 7 - 1 2 - 6 - 9 - 2 - 7 4- 2 t 3 4 - 1 5 - 8 - 1 3 - 8 - 1 1 - 8 - 9 - 7 - 6 - 3 - 3 + 2 + 4 0 - 1 3 - 8 - 1 1 - 8 - 8 - 8 - 4 - 7 - 2 - 3 0 + 3
+ 2 8 - 1 6 - 7 - 1 4 - 7 - 1 3 - 7 - 1 0 - 5 - 6 - 1 - 4 + 5 + 2 3 - 1 3 - 6 - 1 2 - 6 - 1 1 - 6 - 7 - 4 - 4 - 1 - 2 + 5 + 2 0 - 1 7 -10 - 17 -10 - 1 4 - 9 - - l 0 - 7 2 2 - 16 ' E 1;:
l - 1 5 l - 1 2 l - 9 - 8 + 12 - l 1 - - 1 0 - 8 - 9 - 7 - 5 - 3 - 3 + 3

GRAVITY EXPEDITIONS, 1948-1 958, VOL. v
TABLE IV Free-air and isostatic anomalies and
Nr.
1078 1079 1080 1081 1082
1083 1084 1085 1086 1087
1088 1089 1090 1091 1092
1093 1094 1095 1096 1097
1098 1099 1100 1101 1102
1103 1104 1105 1106 1107
1108 1109 1110 1111 1112
1113 1114 1115 1116 1117
1118 1119 1120 1121 1122
rnp,
0.2 0.2 0.2 0.2 0.2
0.3 0.1 0.1 0.1 0.1
0.1 0.1 0.2 0.1 0.1
0.1 0.1 0.1 0.1 0.1
0.1 0.1 0.1 - 0.2
0.3 0.3 0.3 0.3 0.1
0.3 0.3 0.3 0.4 0.3
0.3 0.3 0.3 0.3 0.2
0.3 0.4 0.4 0.4 0.4
Latitude
P7
53O07.8' N 52O10.2' N 51°57.1' N 51°49.2' N 51°29.7' N
51°31.2' N 51°30.1' N 51°29.9' N 51°50.1' N 51°49.4' N
51°49.6' N 51°50.9' N 51°48.7' N 51°15.3' N 51°09.8' N
51°10.6' N 50°49.5' N 50°18.0' N 50°20.5' N 50°1 1.9' N
50°27.1' N 50°39.8' N 50°40.3' N 50°45.6' N 53O42.0' N
53O39.9' N 53O39.6' N 53O37.2' N 53O37.7' N 53O40.8' N
53O09.9' N 53O20.5' N 53O29.2' N 53O31.7' N 53O31.9' N
53O33.1' N 53O33.4' N 53O34.8' N 53O36.1' N 53O33.1' N
53O46.8' N 53O46.5' N 53O49.6' N 53O51.2' N 53O59.9' N
Longitude 1
1°29.8' E 3O36.3' E 3O53.8' E 3O28.9' E 2O42.2' E
2O20.3' E 1°54.2' E 1°28.9' E 1°35.2' E 1°57.5' E
2O20.4' E 2O45.9' E 3O08.7' E 2O39.9' E 1°58.2' E
1°35.6' E 1°17.6' E 0°03.7' E O"40.5' E 1°00.5' E
1°07.7' E 0°53.9' E 0°24.9' E 0°18.3' E 3O52.5' E
3O14.7' E 2O39.1' E 1°56.2' E 1°16.5' E 0°22.7' E
4O35.6' E 4'54.2' E 5O07.1' E 5O23.7' E 5O30.1' E
5O40.6' E 5O47.7' E 5O59.1' E 6O14.8' E 6O39.1' E
6O33.9' E 6O48.3' E 7O19.4' E 7O37.5' E 7O51.3' E
'
Depth in
metres
26.8 28.7 15.6 19.8 32.9
27.1 47.0 18.9 19.5 25.0
44.8 39.8 31.5 21.0 33.9
54.9 11.4 48.5 38.3 35.7
22.0 43.9 21.0
5.8 40.3
42.1 30.2 23.8 25.6 19.2
23.0 19.0 24.7 19.2 22.0
23.8 26.1 23.8 18.3 17.4
24.7 17.8 27.0 22.0 34.8
m,
0.2 0.1 0.4 0.4 0.4
0.4 0.4 0.4 0.4 0.4
0.4 0.4 0.4 0.4 0.4
0.4 0.4 0.2 0.2 0.2
0.2 0.2 0.2 0.3 0.1
0.1 0.1 0.1 0.1 0.2
0.3 0.3 0.3 0.3 0.3
0.3 0.3 0.3 0.3 0.3
0.3 0.3 0.3 0.3 0.3
Free- air
+ 0.2+ - 3.2 - 1.2- + 6.5 + 0.2
+ 3.9
- 9.6- - 3.3 + 3.0
+ 2.3 + 2.1+ + 3.3 - 5.5
-15.3 - 7.7
- 12.8
- 9.5 - 5.3
- 16.0 - 8.6-
-18.1 -24.7 - 8.5- - 2.7 - 14.4
- 1.4- + 0.1 + 1.1 - 7.0 -11.9
-12.5 -12.7 -17.2 -19.7
- 9.6 - 1.4- - 11.5 -12.6 -21.5
Anomalies in milligal
R=O
0.8+ - 2.5
0.4- + 7.2 + 1.7
+ 4.4
8.5- - 2.7 + 3.5
+ 3.4 3.1+
+ 4.2 - 3.9
-11.2 - 5.4
-13.1-10.8-10.5- - 9.8
- 7.3 - 2.4
-16.3-15.1-15.1 - 15.3
9.0-
-25.7 9.5-
- 3.1 - 13.8
1.6- - 0.3- + 1.3 - 6.9 -11.6
-12.1 -12.0 -16.6 -19.2
-12.6-11.3
- 9.0 0.9-
- 9.6 -11.0 -19.3
30 km
116.2
1.3+ - 1.9
0 .1+ + 7.6 + 2.4
+ 5.7
7.4- - 1.8 + 4.8
+ 4.6 4.1+
+ 4.7 - 2.9
-10.3 - 4.2
8.5- 8.2-
- 7.6
- 5.0 - 0.5
- 14.6 8.7-
-18.0 -25.6
9.3- - 2.4 - 12.9
1.4- 0.1
+ 1.5 - 6.9 -11.5
-11.9 -11.8 -16.3 -18.7 -10.7
- 8.6 0.4-
- 8.9 -10.4- -18.5
29.05
0 .9+ - 2.5
+ 7.2 + 1.7
+ 4.6
8.5- - 2.6 + 3.5
+ 3.6 3.2+
+ 4.1 - 3.8
-14.5-12.0-12.0-11.5-11.1
-11.1 - 5.3
-12.1-10.5-10.5-10.1-
- 9.7
- 7.2 - 2.3
- 15.3 9.0-
-18.4-18.3 -25.7
9.6- - 3.1 - 13.8
1.6- 0.3-
+ 1.3 - 6.9 -11.6
-12.0 -12.0 -16.6 -19.1 -11.2
- 9.0 0.8-
- 9.5 -11.0 -19.2
T =
58.1
1.0+ - 2.5
0 . 4 - 0 . 4 - + 7.2 + 2.1
+ 4.9 -19.8-17.8-17.6-17.3-16.3-15.5-14.7
8.2- - 2.4 + 3.9
+ 3.9 3.4+
+ 4.1 - 3.4
-10.8 - 5.0
9.9- - 9.3
- 6.6 - 1.7
- 15.1 8.8-
-18.1 -25.6
9.4- - 2.9 - 13.6
1.6- 0.3-
+ 1.3 - 6.9 -11.6
-12.0 -12.0 -16.5 -19.1 -11.1
- 8.9 0.7-
- 9.4 -10.9 -19.0
174.3
2.0+ - 1.2
0.3+ + 8.3 + 3.0
+ 6.6
6.6- - 1.0 + 5.7
+ 5.4 5.0+
+ 5.6 - 2.0 -10.3-
- 9.6 - 3.4
7.0- 7.0-
- 6.4
- 4.0 + 0.5
-14.8-14.0-12.8-12.0 - 13.7
8.5-
-17.8 -25.4
8.8- - 1.7 - 11.9
1.1- + 0.1 + 1.7 - 6.7 -11.3
-11.6 -11.5 -15.9
- 8.2 0.1+
- 8.5 9.9
-17.9
232.4
2.8 - 0.6
1.2 + 9.0 + 3.7
+ 7.5
6.1 - 0.6 + 6.9
+ 6.4 5.8
+ 6.1 - 1.3
9.6
- 9.1 - 2.9
6.0 6.1
- 5.8
- 3.2 + 1.4
- 12.9 8.2
-17.5 -25.0
8.0 - 0.5 - 10.7
0.7 + 0.4 + 2.0 - 6.3 -11.0
-11.3 -11.2 -15.7
-18.4-18.1 -10.5-10.2
- 7.7 0.3
- 8.2 - 9.5 -17.5

PART 11 THE GRAVITY FIELD OF THE NORTH SEA 8 7
the effects of topography and compensation (continued)
Topog-
raphy
Reductions in 0.1 milligal
R
cornp. A-0 ,
- 3 - 9
0 - 4 - 3
- 8 - 4 + 7 + 3 + 3
- 12 - 11 - 8 + 6 + 8
+ l1 + 21 - 5 + 6 + 13
+ 15 + 7 + 9 + 15 - 21
- 20 - 19 - 16 - 13 + 4
- 10 - 9 - 8 - 6 - 6
- 6 - 5 - 5 - 3 + 4
- 6 - 2 + 3 + 4 + 1
comp. t + c A-0% 18-1
l
cornp. t + c A-0, 18-1
cornp. t + c "A"-"0'; / 1 0 1 18-1

GRAVITY EXPEDITIONS, 1948- 1958, VOL. v
TABLE IV Free-air and isostatic anomalies and
Nr.
1123 1124 1125 1126 1127
1128 1129 1130 1131 1132
1133 1134 1135 1136 1137
1138 1139 1140 1141 1142
1143 1144 1145 1146 1147
1148 1149 1150 1151 1152
1153 1154 1155 1156 1157
1158 1159 1160 1161 1162
1163 1164 1165 1166 1167
"%
0.4 0.2 0.4 0.4 0.4
0.4 0.3 0.3 0.3 0.2
0.2 0.3 0.3 0.3 0.4
0.6 0.6 0.3 0.3 0.3
0.1 0.2 0.2 0.2 0.3
0.3 0.3 0.3 0.2 0.2
0.2 0.2 -
0.3 0.3
0.2 0.3 0.3 0.3 0.4
0.4 0.3 0.3 0.3 0.3
Latitude
P
54O03.9' N 54O16.8' N 54O08.2' N 54O16.1' N 54O06.6' N
53O53.0' N 56O33.9' N 56O39.6' N 56O40.8' N 56"09.01 N
56O09.3' N 56O09.1' N 56O09.3' N 56O08.9' N 56"08.g1 N
56O08.3' N 56O05.5' N 56O13.6' N 56O09.5' N 56O08.7' N
56O09.6' N 55O29.1' N 55O29.7' N 55O28.5' N 55O28.7' N
55O28.3' N 55O30.2' N 55O30.6' N 55O31.3' N 55O32.3' N
55O23.8' N 55'25.0' N 55"28'10.9"N 55O04.8' N 54O47.0' N
54O35.4' N 54O51.5' N 54O49.8' N 54O49.0' N 54O48.9' N
54O49.5' N 54O49.7' N 54O51.8' N 54O46.8' N 54O50.9' N
Longitude L
8O09.5' E 8O08.9' E 7O31.1' E 7O11.5' E 6O58.1' E
6O36.8' E 3O52.5' E 4O18.7' E 5O04.2' E 7O25.7' E
6O29.5' E 5O38.0' E 4O47.5' E 3O45.3' E 3O16.8' E
Z"14.7' E 1°20.2' E 0°31.3' E 0°38.1' W l"35.5' W
2O29.4' W 0°42.5' W 0°09.6' E 1°07.4' E 1°59.2' E
Z"45.7' E 3O43.0' E 4O39.9' E 5O32.5' E 6O24.9' E
7O15.4' E 7O48.0' E 8"26'08.8"E 8O06.9' E 8O04.8' E
8O04.9' E 6O40.2' E 5O45.8' E 4O50.3' E 3O58.7' E
3O07.4' E Z"34.3' E 1°41.5' E 0°50.5' E 0°53.6' W
Depth in
metres
19.2 20.1 40.3 38.4 34.8
24.7 68.6 48.5 63.1 28.4
41.2 53.1 53.1 66.8 67.7
78.7 81.4 92.4 74.1 56.7
52.2 92.4 67.7 62.2 65.0
43.0 34.8 34.8 53.1 43.9
29.3 2 1 .O
Esbjerg '15.6 13.0
13.5 41.2 42.1 42.1 46.7
33.9 24.7 28.4 66.8 63.1
Free- 1 lir
Anomalies in milligal
0.3 0.3 0.3 0.3 0.3
0.3 0.2 0.2 0.2 0.2
0.2 0.2 0.2 0.2 0.2
0.2 0.2 0.2 0.2 0.2
0.2 0.3 0.3 0.3 0.3
0.3 0.3 0.3 0.3 0.3
0.3 0.3 0.3 0.3 0.4
0.4 0.3 0.3 0.3 0.3
0.3 0.3 0.3 0.3 0.3
R 0
-20.5 -23.8 - 10.3 -21.8 - 14.4
-11.2 + 3.6 - 2.1- + 4.8 + 14.2
+23.7 + 7.9 +13.2 + 6.7 + 18.5
+11.0 - 7.4
1.2- + 1.9
4.5+
+ 2.9 2.2+
- 8.2
- 6.2 - 12.3 + 4.7 + 13.1 +22.6
+ 2.2 + 16.2 + 16.1 +29.6 + 15.8
8.2- - 18.9 - 2.8 -20.1 + 15.0
-12.5 -20.0 -24.5 -10.3
-21.6 -24.6 -12.1 -22.5 - 15.1
-11.4 + 4.5
0 + 5.5 + 14.8
+24.4 + 8.4 +14.3 + 7.7 + 19.7
+12.1 - 6.2 - 0 . 7 - + 2.3 + 3.0+
+ + 0.9 + 3.1+
- 7.5
- 4.8 - 10.8 + 6.3 + 13.4 +22.9
+ 2.9 + 16.1 + 15.8 +29.5 + 16.1
- 7.9- - 18.6 - 2.3 - 19.4 + 15.5
-11.3 - 18.2 -22.9 -10.4 +
29.05
-20.5 -23.8 -10.3 -21.8 - 14.3
-11.2 + 3.7
2.0- + 4.8 + 14.2
+23.6 + 7.8 +13.2 + 6.8 + 18.6
+11.0 - 7.4
1.2- + 2.0
4.5+
+ 3.1 2.2+
- 8.2
- 6.1 - 12.5 + 4.7 + 13.0 +22.8
+ 2.2 + 16.3 + 16.0 +29.6 + 15.8
8.2- - 18.8 - 2.8 -20.1 + 14.9
-12.6 -20.0 -24.7 -10.2
T =
58.1
-20.1 -23.6 -10.3 -21.7 - 14.3
-11.0 + 3.7
1.9- + 4.9 + 14.4
+23.5 + 7.8 +13.3 -1 6.8 + 18.6
+11.1 - 7.3
+ 2.2 5.0+
4.1+11.4+11.3+12.8+14.9+15.9+15.7 + 3.5
2.3+ - 8 . 1 - 9 . 4 - 9 . 4 - 9 . 3 - 9 . 2 - 8 . 6 - 8 . 0
- 8.2
- 6.0 - 12.4 + 4.8 + 13.0 +22.9
+ 2.3 + 16.4 + 16.0 +29.6 + 15.9
8.1 - 18.7 - 2.8 -20.1 + 15.1
-12.5 -20.0 -24.6 -10.3
6.0+10.6+10.8+11.6+13.2+14.2+14.1
30 km
116.2
- 19.6 -23.3 - 9.9 -21.4 - 14.0
-10.7 + 3.8
1.9- + 4.9 + 14.6
+23.5 + 7.9 +13.1 + 6.9 + 18.7
+11.2 - 7.0
1 .1-0 .6 + 3.3
7.0+
+ 5.1 3.1+
- 8.1
- 6.3 - 12.6 + 4.7 + 13.2 +23.1
+ 2.7 + 16.6 + 15.8 +29.9 + 16.2
- 7.7- - 18.6 - 2.6 -20.0 + 15.0
-12.8 -20.5 -24.7 - 9.7
174.3
-18.9 -22.9 - 9.2 -20.7 - 13.4
-10.2 + 3.9
1.8- + 5.0 + 14.6
+23.6 + 8.0 +13.2 + 7.1 + 18.9
+11.4 - 6.6
0 + 4.9
9.1
+ 6.7 4 .3+
- 8.0
- 6.4 - 12.7 + 4.5 + 13.2 +23.3
+ 2.8 + 16.6 + 15.5 +29.8 + 16.4
7.4- - 18.4 - 2.6 -20.1 + 14.9
-12.9 -20.4 -24.5 - 8.8
232.4
-18.6 -22.4 - 8.8 -20.4 - 13.0
- 9.9 + 2.8
1.8 + 4.8 + 14.4
+23.5 + 7.9 +13.0 + 7.0 + 18.7
+11.7 - 6.1 + 1.2 + 6.8 +10.4
+ 8.0 5.8
- 7.8
- 6.5 - 12.8 + 4.6 + 13.3 +23.5
+ 3.0 + 16.6 + 15.3 +29.4 + 16.3
7.2 - 18.0 - 2.3 -19.9 + 15.1
-12.7 -20.3 -24.0
7-6

PART I1 THE GRAVITY FIELD OF THE NORTH SEA
the effects of topography and compensation (continued)
Reductions in 0.1 milligal
Topog-
raphy comp. t + c 1 A-0 , ( 18-1 comp. A - 0 ,
+ 1 - 2 - 4 - 1 3 - 1 1
- 9 - 3 7 - 37 - 3 5 - 12
- 2 0 - 2 6 - 3 0 - 37 - 39
- 4 6 - 5 0 - 5 0 - 4 0 - 5
+ 61 - 27 - 4 0 - 4 0 - 35
- 27 - 21 - 24 - 2 4 - 19
- 1 5 - 3 + l 2
1 -- 4
- 6 - 21 - 22 - 2 3 - 21
- 20 - 21 - 22 - 33 + 2 1
t + c 18-1
- 3 - 4 - 5 - 6 - 6
- 6 -19 -17 -15 -13
-15 -15 -17 -19 -19
-19 -18 -18 -15 -19
-24 -17 -15 -16 -17
-17 - 18 - 16 -15 -14
-12 -10 - 9 - 9 - 8
- 6 -10 -12 -13 -16
-15 - 14 -14 -12 -18

Nr. Latitude
a,
Longitude I ,
TABLE IV Free-air and isostatic anomalies and
I l
Depth 1 Anomalies in milligal
in Free- T = 30 km
metres l I air R=O 1 29.05 58.1 ( 116.2 1 1 7 4 . 3 5 1
59.5 52.2 39.3 33.9 43.9
48.5 43.9 41.2 39.3 36.6
18.6 15.6 13.0 26.5
Peterhead
Aberdeen Dundee
Leith Hartlepool Grimsby
Harwich Newhaven
Den Helder H. of Holland
Flushing
188 152 670 165 141
54 1 157 376 153 171
324 111 285 2 62 280
Bergen 132 346 143 1 48

PART I1 THE GRAVITY FIELD OF THE NORTH SEA 9 1
the effects of topography and compensation (continued)
Topog-
raphy
Reductions in 0.1 milligal
comp. A-0 ,
comp. t+ c A-0 , 1 18-1
$ 1 0 + 4 - 1 1 + 3 - 1 4 - 9 - 17 - 14 - 15 - 19

TABLE IV Free-air and isostatic anomalies and
Longitude A
Depth in
metres
162 114 119
141 92
151 104 65
Invergordon 18.3 41.2 47.9 56.4
29.0 37.5 71.1 65.0 50.0
46.4 45.4 58.0 57.0 66.2
86.9 83.9 87.8 84.8 79.9
88.8 24.4 27.8 41.2 54.0
50.0 57.0 53.1 38.4 65.3
Anomalies in milligal '

PART I1 THE GRAVITY FIELD OF THE NORTH SEA
the effects of topography and compensation (continued)
Topog-
raphy comp. t + c A-0, 18-1
Reductions in 0.1 milligal
comp. I t + c I comp. 1 t + c 1 comp. 1 t + c A-0, 18-1 A-0, 18-1 A-0, 18-1
comp. t + c A-0, 18-1

Longitude 3,
TABLE IV Free-air and isostatic anomalies and
Depth 1 Anomalies in milligal
in metres Free- I
Inverness

! PART I1 THE GRAVITY FIELD OF THE NORTH SEA
the effects of topography and compensation (continued)
Topog-
raphy
Reductions in 0.1 milligal
comp. t+c A-0, i a i - 1 + l 5 -41 - 4 -39 - 1 1 -38 - 2 3 -35 - 2 8 -34
- 33 --33 - 40 -31 - 4 4 -30 - 16 -35 - 18 -36
- 17 -38 - 17 -39 - 17 -40 - 14 -42 - 2 2 -43
- 25 -44 - 29 -44 - 31 -45 - 31 -46 - 3 4 -47
- 3 6 -45 - 3 8 -43 - 41 -42 - 4 5 -40 - 4 8 -39
- 4 4 -39 - 4 1 -38 - 3 8 -40 - 36 -41 - 4 9 -36
- 5 5 -33 - 41 -34 - 3 2 -37 - 2 5 -37 +l59 -42
+227 -43
comp. A-0,
comp. A-0 ,
comp. t + c 1 A-0, 1 18-1 comp. t+c A-0, 18-1

TABLE V Seismic data in the North Sea (U.S. Hydrographic Office)
l ) Assumed velocity
Water depth
A Thickness (km) Sediments
B Velocities (kmlsec)
L t . 1 long.
57"04'N 01°25'E 57"OO'N 00°58'E 55"16'N 02"19'E
High velocity
rock
4.96 4.85
(4.90) l )
0.09 0.09 0.04
Sediments
l 1 2 1 3
0.61 0.54 0.39
- -
3.00
1.71 1.71 1.73
2.26 2.26 2.03
2.64 2.58 0.54
-
-
(3.40)')

PART I11
MEASUREMENTS OF GRAVITY IN SURINAM
BY J. VELDKAMP
Expedition: 29th July - 19th August 1957


MEASUREMENTS OF GRAVITY IN SURINAM
Introduction
In 1956 a geophysical station was set up at Paramaribo by the combined activity of the Government of Surinam, the Royal Netherlands Meteorological Institute at De Bilt, the Netherlands Postal and Telegraph Service, the Organisatie ZWO (Ne- therlands Organisation for Pure Research), and the Stichting WOSUNA (Foun- dation for the Advancement of Research in Surinam and the Netherlands Antilles).
This geophysical station was set up for carrying out part of the programme for the International Geophysical Year; the researches concerned the variations of geomagnetism, the structure of the ionosphere and the radio-radiation of the sun.
On the occasion of an inspection of this station, the present author carried out a number of gravity measurements with the assistance of cand. geogr. J. J. G. M. VAN BOECKEL, who was charged with the care for the geophysical station at Parama- ribo. These measurements were of interest for the interpretation of the measurements which had been made in 1949 on board Hr. Ms. "0.24" in the Atlantic Ocean offsurinam and French Guyana (see Part I). On the other hand these measurements fitted in the programme for the I.G.Y., which recommends measurements of the gravity where they may be done in combination with other geophysical measure- ments.
The measurements were made on request of the Netherlands Geodetic Commis- sion which put the Askania-gravimeter Gs. 9, nr. 70 at my disposal for this purpose. Professor G. J. BRUINS of the Delft Geodetic Institute assisted in changing the measuring-range for measurements near the equator. In Surinam measurements are possible along the railway Paramaribo - Kabel - Dam and along the rivers. The Marowijne river was chosen because main-voltage for loading the accumulators of the gravimeter is available in the Mission Hospital on Stoelmanseiland.
The Government Railway Department of Surinam gave its cooperation to the measurements along the railway to Kabel and further to Dam. A special draisine was put at my disposal for the traject Paramaribo - Kabel; the traject Kabel - Dam was covered with the aid of some trolleys. For the measurements along the Marowijne river assistance was given by the Surinam Aluminium Company, which gave hospitality at Moengo and which took care of the transport from Moengo to Albina and back.
The Director of the Mission Hospital on Stoelmanseiland put his canoe at my disposal for the journey from Albina to Stoelmanseiland and back. The Surinam Central Bureau for Aerial Survey gave information about the coordinates and the heights of the measuring stations.
The measurements
The measurements were connected with HARDING'S measurements in 1945 (see [l]) who found the value g = 978.0500 gal on the runway end of the first side walk south

of the operation tower on the airfield "Zanderij". This station served as base-station for the measurements along the railway Paramaribo - Dam and along the Maro- wijne river.
Whereas the Askania-gravimeter has an accuracy of 0.01 mgal under favourable conditions, this accuracy was not nearly attained during the measurements in Surinam. Considerable closing errors appeared, due to transport and varying voltage of the accumulators, so that an uncertainty of one to two mgal is present at the endpoints of the profiles.
Table 1 shows the results of the measurements. (The tables and a map of Surinam are printed on pages 105-1 11.) In column 8 the gravity value is given by the position of the spring; columns 9 and 10 refer to the checking of the gravimeter by changing the position of a small weight inside the gravimeter.
During the measurements along the Marowijne river the temperature of the thermostate had to be lowered from 40 to 35 "C on account of the lowering voltage of the accumulators. I t appeared that this manipulation had some influence on the measurements as was observed at Paramaribo; a correction was therefore applied.
Table 2 gives a summary of the measurements reduced in gal. In Table 3 the measured values are compared with the normal gravity values,
whereas in columns 7 and 8 the values of the free-air anomalies and the Bouguer anomalies are tabulated.
Comparison with other measurements
Until now only a few measurements of gravity have been carried out in the sur- rounding countries, viz. at Georgetown, at Cayenne and at some places along the river Amazone, all by HARDING in 1949 (see [l]). All these measurements show a gravity deficit which extends apparently over a great part of South-America. Except for this regional deviation which also causes the negative anomalies in Surinam, the decrease of gravity unto a distance of 150 km from the coast is striking.
Deeper inland the gradient becomes smaller, except for the irregularities as in the neighbourhood of Kabel. In the last case we see probably the influence of the
Fig. 1 Left, rree-air anomalies along a profile through the Atlantic Ocean off French Guyana (see part I); right, free-air anomalies after measurements at stations from Albina to Stoelmans- eiland

PART I11 MEASUREMENTS OF GRAVITY IN SURINAM 101
big granite intrusion, which is indicated on the geological maps of the Geological Service and the Surinam Central Bureau for Aerial Survey. The measurements have been reduced to sea level and connected with the pendulum measurements carried out in 1949 (see Fig. 1 and 2). The curve shows a difference of 6 mgal
Fig. 2 Free-air anomalies along a profile perpendicular to the coast of Surinam (see part I) and after measurements at stations from Parimaribo to Dam
between the gravimetric observation and the pendulum measurements at Parama- ribo. Taking into account the possible error of the measurements and the different bases on which the constants of the pendulum and the gravimeter depend, this difference is not alarming; moreover the measurements have not been made at exactly the same place. We see a maximum in the curves near the coast of Surinam and a minimum at great distance from the coast in the ocean; this is quite clear in the profile over Paramaribo (see Fig. 2). Although in Fig. 1 the pendulum meas- urements do not fit to the measurements along the Marowijne river as there is a considerable difference in longitude, one sees even here the same trend as in the profile over Paramaribo.
Isostatic reduction and comparison with a model of the earth's crust
The Isostatic Institute at Helsinki has calculated the isostatic corrections, and the result is tabulated in Table 4. After applying these corrections, the curve of the anomalies becomes somewhat flatter by local reduction than by regional reduction, so that the supposition R = 0 gives a better approximation.
I n order to facilitate the interpretation of the found curve of anomalies, gravity values have been calculated for a model of the earth's crust, taking into account some geological data published in [2].
Surinam forms a part of the Guyanese shield. I n the upper north we find a region of holocene and upper tertiary deposits, which cover the northern slope of this shield. A zone of sediments which are partly unconsolidated has a width in- creasing from 30 km near the Marowijne river, which borders French Guyana, to 150 km near the Corantijn river, which forms the border with British Guyana. The thickness of these sediments increases towards the coastline. The greatest thickness was found by refraction seismography in the north east of Nickerie on the coast where about 2000 m was recorded. By drilling in Nickerie the basement was encountered at 1500 m. The southern border of the zone of sediments follows a line from Albina to Zanderij in almost east-west direction.

Under Paramaribo the thickness is unknown, but it can be estimated to be about 1000 m. South of this line the basement complex consisting of granits, schists and dolerites of mesozoic to pre-cambric age, reaches the surface.
A section through the crust which rather well accounts for the anomalies observed, is shown in Figure 3.
mgal mgal + 20 - .................................................
................................................. 0 -
. 20 - 20
Fig. 3 Below: Model of the earth's crust, assuming a gradual change from ocean to continent under local isostasy
Above: Gravity anomalies calculated after the model
The thickness D of the normal crust is supposed to be 28 km, the density of the crust Q , = 2.85 against Q, = 3.3 of the subcrustal rock. Supposing isostatic equilib- rium, the thickness x of the crust under the ocean bottom must be
where d is the depth of the sea and Q, is the density of the sea-water. Taking d = 4 km, one finds x = 7.56 km.
A gradual change is supposed for the thickness of the crust from the coast to the deep sea under local isostasy. This model is in agreement with the crustal section of the continental margin as found by WORZEL and SHURBET [3].
The calculation of the influence of the ocean was made by means of formula (1) (see Fig. 5), taking AB = 300 km, d = 4 km, Q = -1.85 (being the difference of the densities of the oceanic crust and the sea-water). The influence of the crustal bottom was calculated by formula (2) (see Fig. 6) with CD = 300 km, d = 11.56 km, d, = 16.44 km, Q = 0.45 (the difference between the densities of the crust and the subcrustal rock). The anomalies of the gravity over this crustal profile are drawn in Fig. 3. At the border of the ocean (point A) a maximum of about + 25 mgal is found, caused by the inclined bottom of the crust; a negative anomaly of - 15 mgal coincides with point B, where the depth of the ocean begins to diminish gradually. There is a fair correspondence between the calculated curve and the curve of the found anomalies of Fig. 2, except for a general deficiency of gravity over the whole area.
I t appeared that the anomalies practically remain the same if we take Q , = 2.67 and Q, = 3.27 as is done by the Isostatic Institute at Helsinki. Refinement of the

PART I11 MEASUREMENTS OF GRAVITY IN SURINAM
Fig. 4 The vertical component of the attraction exerted in P by an infinite bar with density e and
cross-section PAB is g = 2ye sin a + h In - cos a 71 " l
Fig. 5 The vertical attraction of a semi-infinite strip with cross-section CABD is in P :
7 2 g = 2ye (h(ql-q,) sin a + h ln - cos a + dq, . . . . . . . . . . . . . . . . . 71 l (1)
v, = n or zero for P at the left or at the right of A respectively
Fig. 6 The vertical attraction of a semi-infinite strip CABD is in P :
7 2 g = 2ye (h(q , -~ , ) sin a + h ln - cos a + (dl+d,) m,-dlql . . . . . . . . . . . .
7 1 l (2
calculation might be obtained by supposing a flat or prismatic layer of sediments on the slope of a granitic crust. A rough estimate of the thickness of such a layer is possible from the values found by seismic refraction measurements and by drilling in Nickerie; from these figures we might estimate the thickness of the sedimental layer in the coastal region of Surinam to be about 2 km. It is rather probable that this sedimental layer is regionally compensated. By taking into account these sediments the calculated curve of the anomalies is changed somewhat, but not very much.
Results of calculations with a more detailed model are not presented as the number of pendulum measurements in the ocean is too small to allow a good comparison with the calculated gravity.

Conclusion - In the region of Surinam where the measurements were made, gravity is lower than normal. The anomalies can be explained by assuming a gradual change from the continental into the oceanic crust, under local isostatic equilibrium.
Acknowledgement
Mr. J. J. G. M. van BOECKEL, in charge of the Geophysical Station at Paramaribo, assisted in the measurements.
Mr. J. A. As, scientific assistant of the Royal Netherlands Meteorological In- stitute at De Bilt, derived the formules (1) and (2) and assisted in the calculations.
References [l] Woods Hole Oceanographic Institution. Unplublished manuscript, Ref. no. 54-53, World
Gravity Measurements 1952, 1954. [2] Geologie en Mijnbouw, Suriname-nummer, pages 141-260, 1953. [3] WORZEL, J. L. and SHURBET, G. C., Proc. Nat. Acad. Sci., 41, 458, 1955.

PART 111 MEASUREMENTS OF GRAVITY IN SURINAM
Fig. 7 Surinam

29-7-57 id. id. id.
30-7-57 id. id. id. id.
31-7-57 id. id. id. id. id. id. id. id.
1-8-57
2-8-57 id. id. id. id. id. id. id. id.
4-8-5 7
5-8-57
6-8-57 id. id.
7-8-57 id. id.
8-8-57 id.
9-8-57
10-8-5 7 id. id. id. id.
TABLE 1 Gravity measurements in Surinam
Paramaribo Paramaribo (Harbour) Paramaribo Zanderij
Zanderij Kwakoegron Guyana Goldplacer Brownsberg Kabel
Date
Kabel Abontjeman Sikakamp Dam Sikakamp Abontjeman Kabel Zanderij Paramaribo
Time Station
Paramaribo Paramaribo Lelydorp Onverwacht Republiek Zanderij Republiek Onverwacht Paramaribo
Paramaribo
Temperature of instrument
Moengo
Dial reading
AI bina Bigiston Herminadorp
Langatabbetje Langatabbetje Stoelrnanseiland
Stoelmanseiland Stoelmanseiland
Stoelmanseiland
Stoelmanseiland Gakaba Mooisanti Nason Langatabbetje

PART 111 MEASUREMENTS OF GRAVITY IN SURINAM 107
I Galvanometer l Total dial reading at 40 'C 1 Calibration
zero pos. reading ( Calibration weight left I Calibration weight right 1 value

TABLE 1 Gravity measurements in Surinam (continued) I l l
Date 1 Station
1 1-8-57 id. id. id. id. id.
Time
Langatabbetje Herminadorp Abeneko Bigiston Albina Moengo
Temperature of instrument
Moengo
Paramaribo
Paramaribo
Paramaribo
i Dial
readins 1

PART III MEASUREMENTS OF GRAVITY IN SURINAM
Galvanometer l Total dial reading at 40 "C 1 Calibration
zero pos. 1 reading I Calibration weight left I Calibration weight right ( value

TABLE 2 Summary of the measurements
Station
Paramaribo (Harbour) Paramaribo Lelydorp Onverwacht Republiek Zanderij
Measurements I Observed gravity g
29 July 31 July 2 Aug. 2 Aug.
44.25 44.39 44.27
40.40 40.47 40.47
978.0806 (+, 0.001) 978.080 978.0726 978.065 978.0576 978.0500 (basevalue)
Zanderij Kwakoegron Guyana Goldplacer Brownsberg Kabel
Kabel Abontjeman Sikakamp Dam
Paramaribo Moengo
Moengo Albina Bigiston Abeneko Herminadorp Langatabbetje Nason Mooisanti Gakaba Stoelmanseiland
30 July 31 July
35.33
31 July 31 July 35.33
36.97 36.95 36.95
415 Aug. 1211 3 Aug.
l::;; r;::;: 617 Aug. 1011 1 Aug.
52.22 50.63 48.91
47.05 46.10
.43.75
A52.17 50.60 48.97 47.76 47.12 45.61 45.56 45.08 44.89 44.12

PART I11 MEASUREMENTS OF GRAVITY IN SURINAM
TABLE 3 Free-air and Bouguer anomalies
Station Latitude l l Lon- gitude 1
Paramaribo (Harbour) Lelydorp Onverwacht Republiek Zanderij Kwakoegron Guyana Goldplacer Brownsberg Kabel Abontjeman Sikakamp Dam
Albina Bigiston Abeneko Herminadorp Langatabbetje Nason Mooisanti Gakaba Stoelmanseiland
Height in
metres
Observed gravity
Normal gravity
so
978.102 978.100 978.098 978.096 978.095 978.092 978.090 978.088 978.087 978.086 978.084 978.083
978.096 978.095 978.093 978.091 978.089 978.085 978.083 978.080 978.079
Free-air anomaly
mgal
Bouguer anomaly
mgal
TABLE 4 Local and regional airy reductions
Lon- gitude
Paramaribo (Harbour) Lelydorp Onverwacht Republiek Zanderij Kwakoegron Guyana Goldplacer Brownsberg Kabel Abontjeman Sikakamp Dam
Albina Bigiston Abeneko Herminadorp Langatabbetje Nason Mooi Santi Gakaba Stoelmanseiland
Free-air anomaly
mgal
Reductions in milligals T = 30 km
R=O
-6 -6 -5 -5 -5 -2 -2 -5 -1 -1
0 0
-6 -5 -5 -4 -3 -2 -1 + l + l
29.05
-6 -6 -5 -5 -5 -2 -2 -5 -1 - I
0 0
-6 -5 -5 -4 -3 -2 -1
116.2
-6 -6 -4 -5 -5 -1 -1 -4
0 0
+ l + l
-6 -5 -4 -4 -3 -2
58.1
-6 -6 -5 -5 -5 -2 -1 -5 -1
0 + l
0
-6 -5 -4 -4 -3 -2
+ l + l + l +2
174.3
-6 -5 -4 -4 -5 -1
0 -4
0 + l +2 + l
-6 -5 -3 -3 -2 -1
232.4
-6 -5 -4 -4 -4
0 + l -2 +2 +2 + 3 +2
-6 -5 -3 -3 -2
0


DUTCH MARITIME

I GRAVITY STATIONS


Moseley
894 0
Monaco
U
Trough
887


I
Printed by the Topographic Service, Netherlands.


Compiled and drawn according to the Bathymetric Chart of the Atlantic Ocean, Gravity Expeditions at Sea, Volume IV, 1948

GRAVITY STATIONS IN T

iTIONS IN THE NORTH SEA


55:
540-
5.30-
k af Holland 52:
gravi rneter s tat ion Hr. Ms. "Vos" 1 9 5 5
0 pendul urn observat ion Hr . Ms. "Zeeleeuw" 1 9 5 6
@ gravi rneter s t a t i o n reoccupied by s u b m a r i n e (or vice v e r s a ) 51-
A base harbours
- . . - . . - . . . . - . . 2 0 f a t h o m depth contour
- . . . . . - . . . . . - . . . - . . .
Topagraphy a f t e r the B r i t i s h A d m i r a l t y Map 2 3 3 9 56
I 4" 6" B" 9" l o o 1 l 0

l sos ta t i c anomalies ( 7 De B i l t : g -D81 2 6
0 +a
+l2
+ l 0 +7

QRAVITY w r r D r n o l v s l!W3-1958, VOL. v PART n THE O U ~ FIELD OF THE NORTH SEA
Fig. lb The North Sea gravity survey, Isostatic anomalies
)mdies ( T - 30 km, R - 0 ) Ig m981 268.0 rngal


. . . - 2 -12 -16 -18
r n ~ n e d a r e a
De Bilt k of Holland
l
l l
l

STRUCTURAL MAP OF T
I 1 f rom seismic ( observattons

.P O F THE NORTH SEA
4 O 5 O 9" 1 1 ° 1
. . . . . . . . . . . . . . . .
D O O O D . . . O O O D O
D . O . . O O . O O . D O
. . . a D D O D O D D
D D . . D D O D
Ca~nozoic faul t system , of Skagerrak o n d

- l ( f r o m selsmfc I observat ions l
- 0 . .
S . . . 0
* - a . . *
. . 0 0 0 0 . .
. 0 . 0 . . . . D
O O . g D . . . D .
0 . s .
. S D .
. . D .
D . . .
. D . .
* . . . D D
D D 0 0 0
* D D D
. D D .
O D D D .
D D D D
. D . . D
O D D .
* D 0 D
. D D *
D . . .
* . . D D
0 0 0 0 . 0
B a s i n o f
A N T I C L I N E
Old T e r t i a r y open
N o r t h S e a B a s i n

in d i r e c t i o n of Rhenic i n f l u e n c e s
Danish Westcoast ?
Area of s a l t s t r u c t u r e s
Mesozoic and younger
Ca ledon~an
( w i t h Hercyn ion cove r ; Paloeo - Eu rope )
P recambr i um
Negat ive axes of -1-1-1
Caledonion age T ronscu r ren t f au l t
+-+-+- P o s i t i v e axes o f ---- Caledon ian age
O v e r t h r u s t
Recons t ruc ted p o s i t ~ o n Boundary between
Pa laeo -and Meso- Europe
t h e Great Glen F a u l t Increas ing th ickness
1-v F a u l t ( d i p - s l ~ p ) o f Meso-and - Cainozoic sed iments , i n f e r r e d f r o m
Idem, i n f e r red f r o m geological d a t a
I hyd rog raph i c cha r t s