great investment opportunity in center city with museum estates - nria llc
TRANSCRIPT
This project management presentation has been prepared by National Realty & Investment Advisors, LLC (“NRIA”) on the
basis of information obtained from NRIA and other public sources. It is believed to be reliable as of the specifi ed date.
NRIA does not undertake any duty or obligation to update the information. NRIA does not make or give any representation,
warranty or guarantee, whether express or implied, that the information contained in this presentation or otherwise
supplied to the recipient, at any time by or on behalf of NRIA whether in writing or not, relating to the property project
discussed herein is 100% complete or 100% accurate or that it has been or will be audited or independently verifi ed.
Reasonable care has been taken in compiling, preparing and furnishing the information. This presentation provides a
project management guide only and it is not intended to be exhaustive and, in particular, does not contain disclosure of
any of the risks associated with the opportunity which you will fi nd in your NRIA project management disclosures. This
presentation is not to be construed as investment, tax or legal advice in relation to the relevant subject matter. You must
seek your own legal or other professional advice.
This presentation contains statements that are forward-looking statements. These forward-looking statements, which are
subject to risks, uncertainties and assumptions, include projections of future fi nancial performance, anticipated growth
strategies and anticipated trends in the business. These statements are only predictions based on current expectations and
projections about future events, subject to change due to actual results, market conditions, performance and achievements.
Any estimate or forecast contained in this presentation is not a promise or representation by NRIA as to future matters
and nothing contained in the information should be relied upon as a representation as to be guaranteed. NRIA guarantees
your satisfaction with your project only. See your 100% Money Back Guarantee for details.
Executive Summary
Property Description
Area Overview
Comparable Properties
The Market
Investment Requirement
1
2
3
4
5
6
TABLE OF CONTENTS
1 ExecutiveSummary
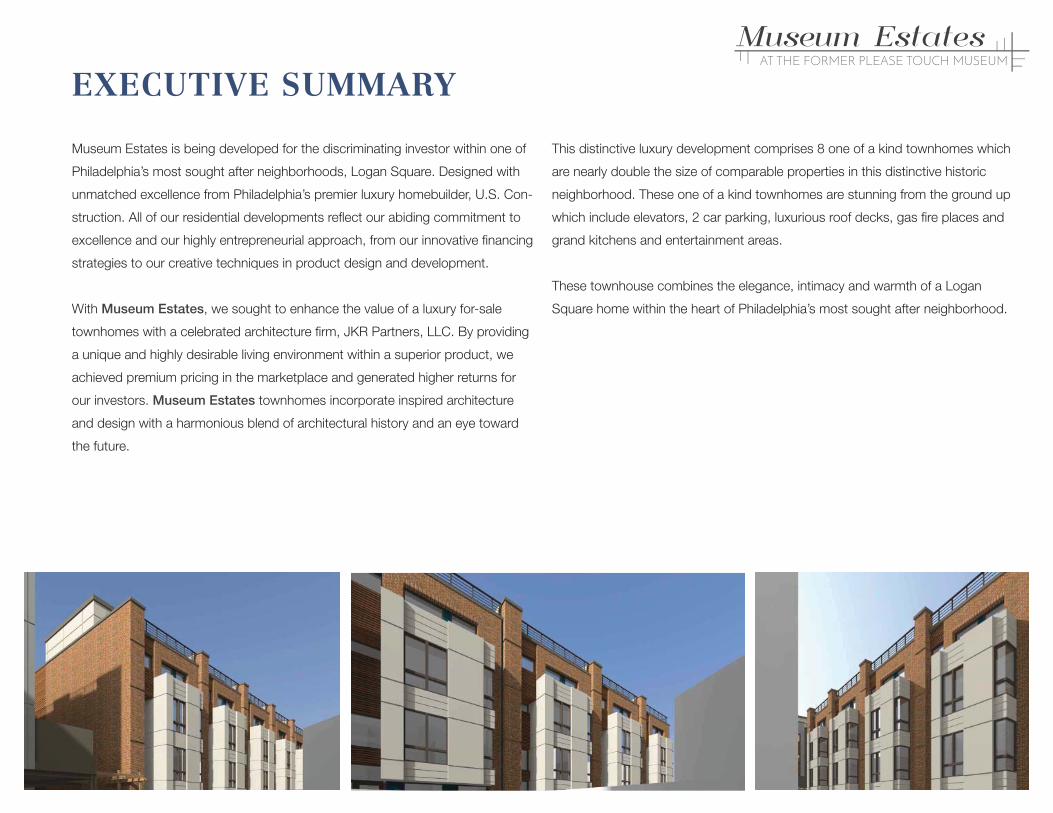
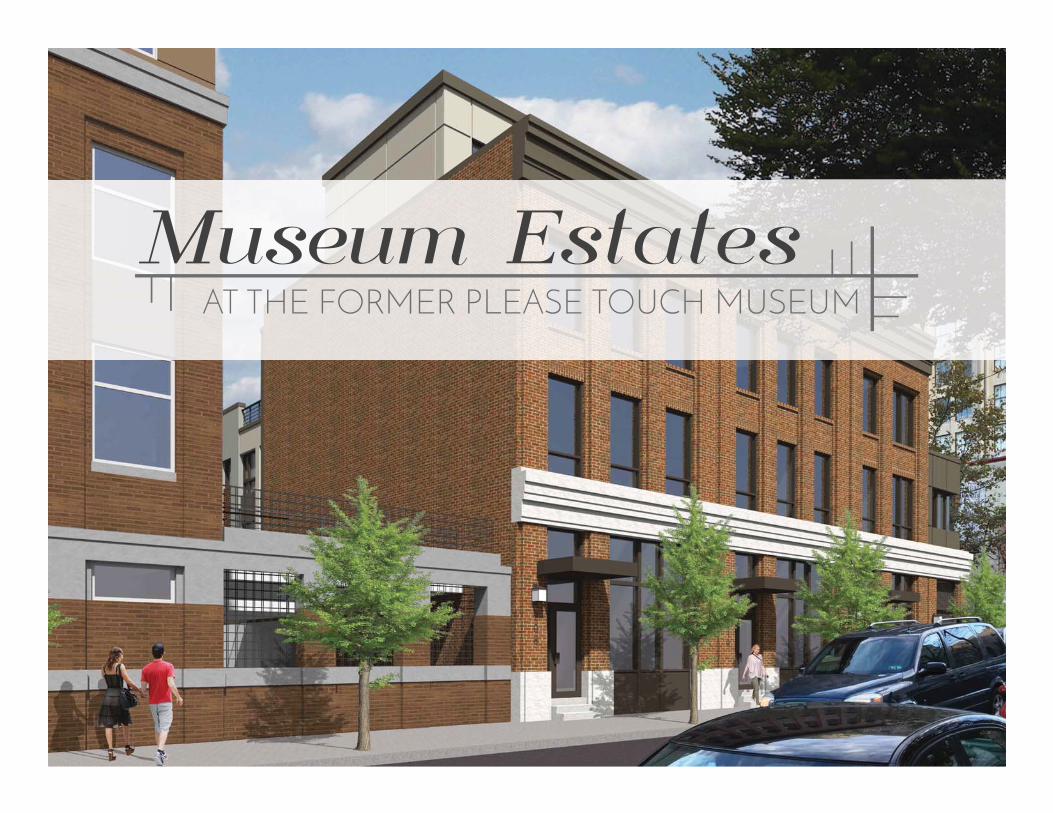
Museum Estates is being developed for the discriminating investor within one of
Philadelphia’s most sought after neighborhoods, Logan Square. Designed with
unmatched excellence from Philadelphia’s premier luxury homebuilder, U.S. Con-
struction. All of our residential developments refl ect our abiding commitment to
excellence and our highly entrepreneurial approach, from our innovative fi nancing
strategies to our creative techniques in product design and development.
With Museum Estates, we sought to enhance the value of a luxury for-sale
townhomes with a celebrated architecture fi rm, JKR Partners, LLC. By providing
a unique and highly desirable living environment within a superior product, we
achieved premium pricing in the marketplace and generated higher returns for
our investors. Museum Estates townhomes incorporate inspired architecture
and design with a harmonious blend of architectural history and an eye toward
the future.
This distinctive luxury development comprises 8 one of a kind townhomes which
are nearly double the size of comparable properties in this distinctive historic
neighborhood. These one of a kind townhomes are stunning from the ground up
which include elevators, 2 car parking, luxurious roof decks, gas fi re places and
grand kitchens and entertainment areas.
These townhouse combines the elegance, intimacy and warmth of a Logan
Square home within the heart of Philadelphia’s most sought after neighborhood.
EXECUTIVE SUMMARY

2 PropertyDescription
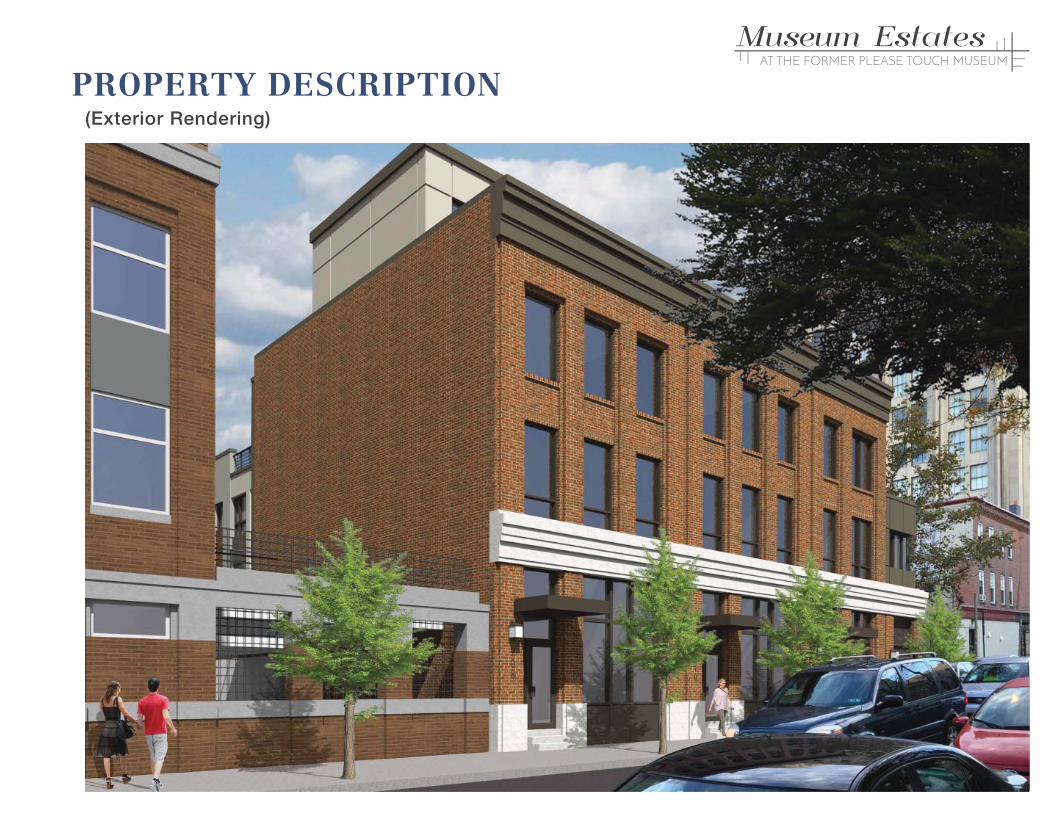
PROPERTY DESCRIPTION(Exterior Rendering)
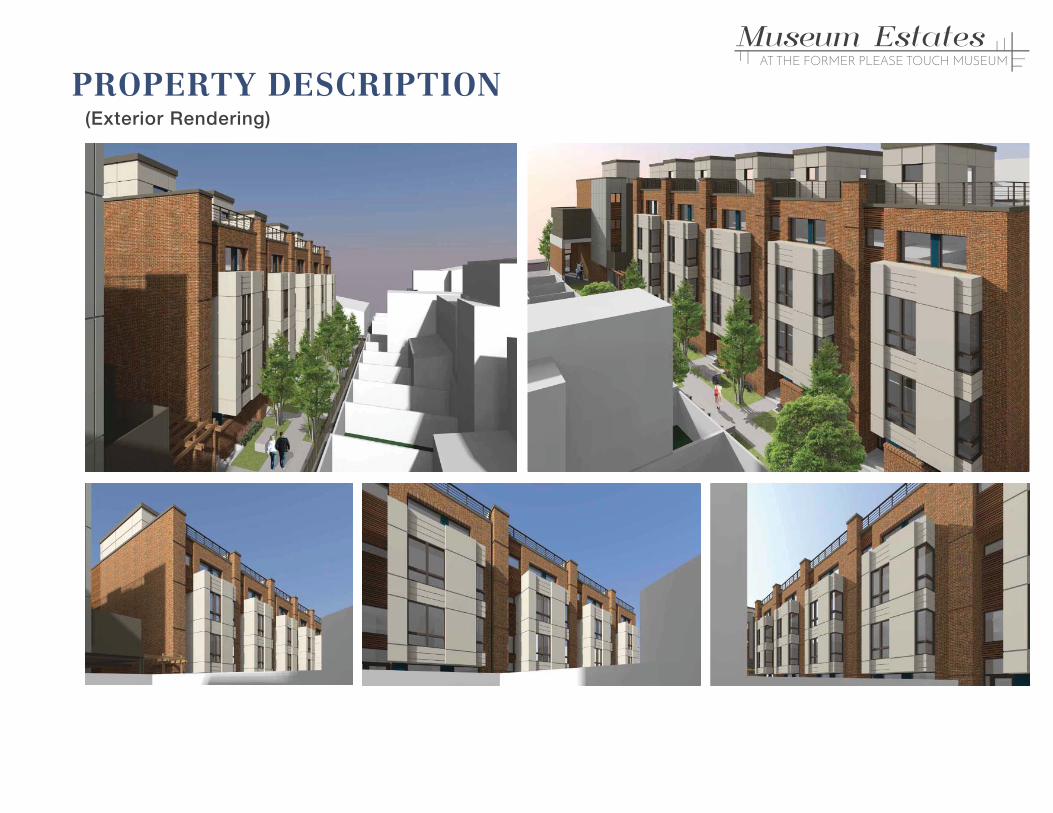
PROPERTY DESCRIPTION(Exterior Rendering)
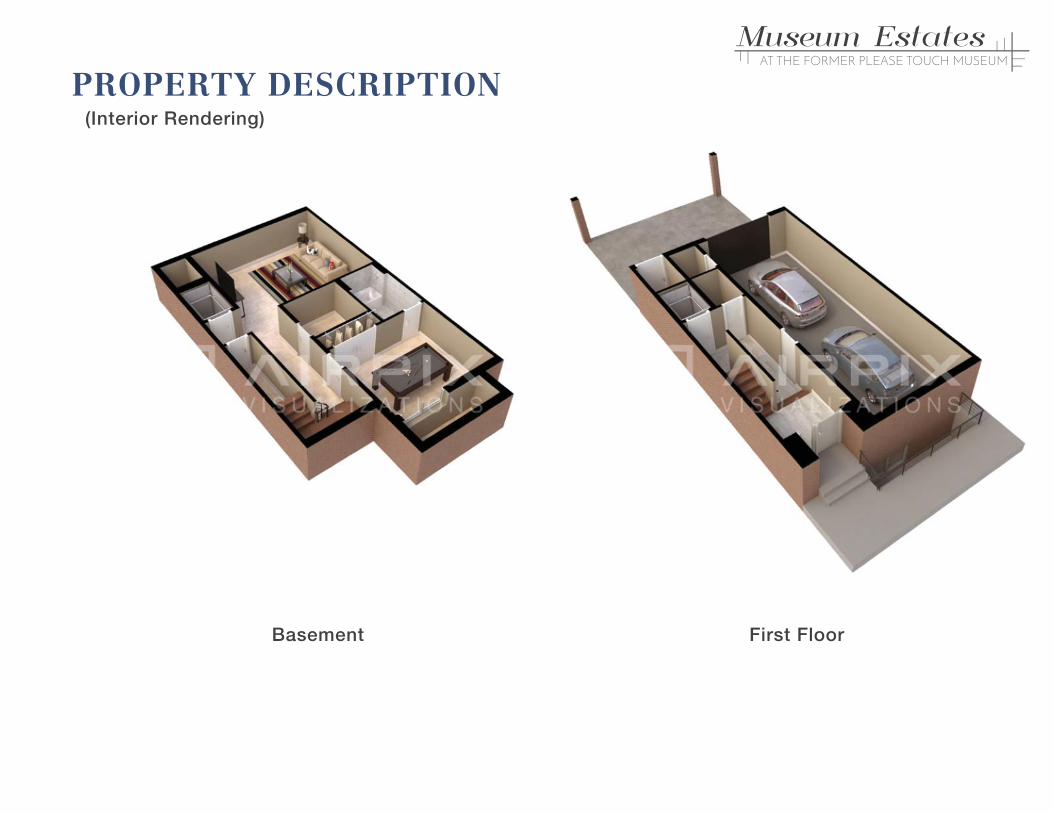
PROPERTY DESCRIPTION(Interior Rendering)
Basement First Floor
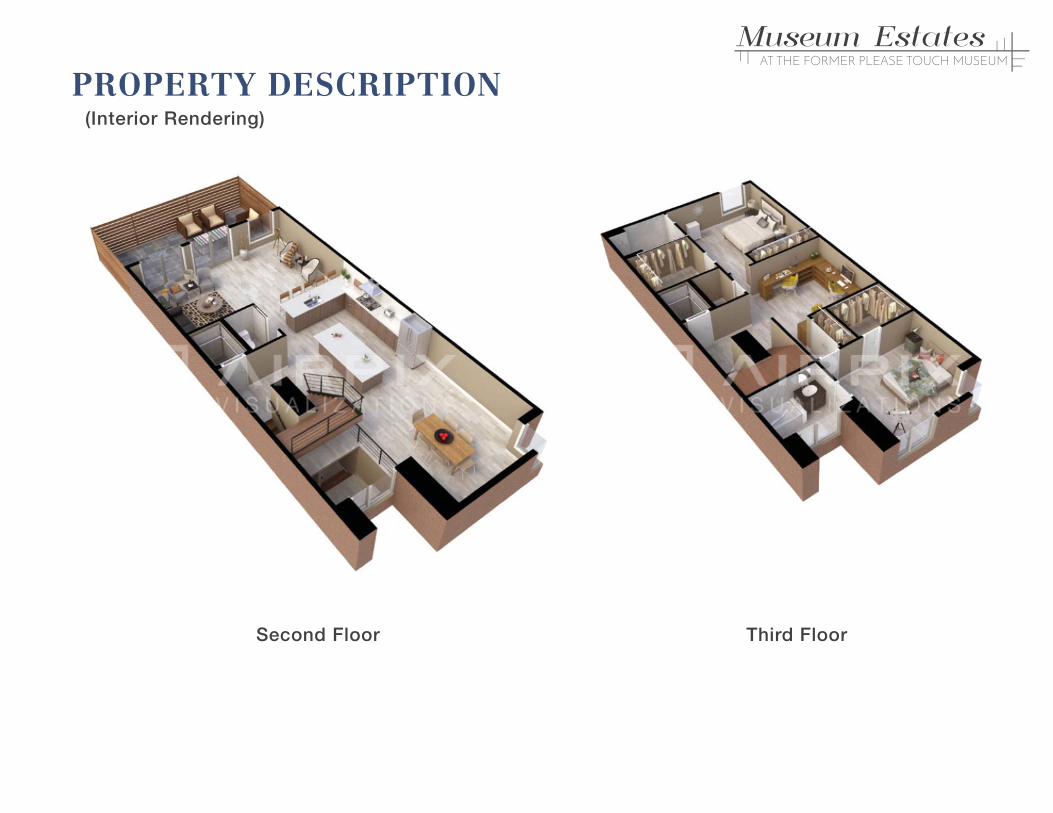
PROPERTY DESCRIPTION(Interior Rendering)
Second Floor Third Floor
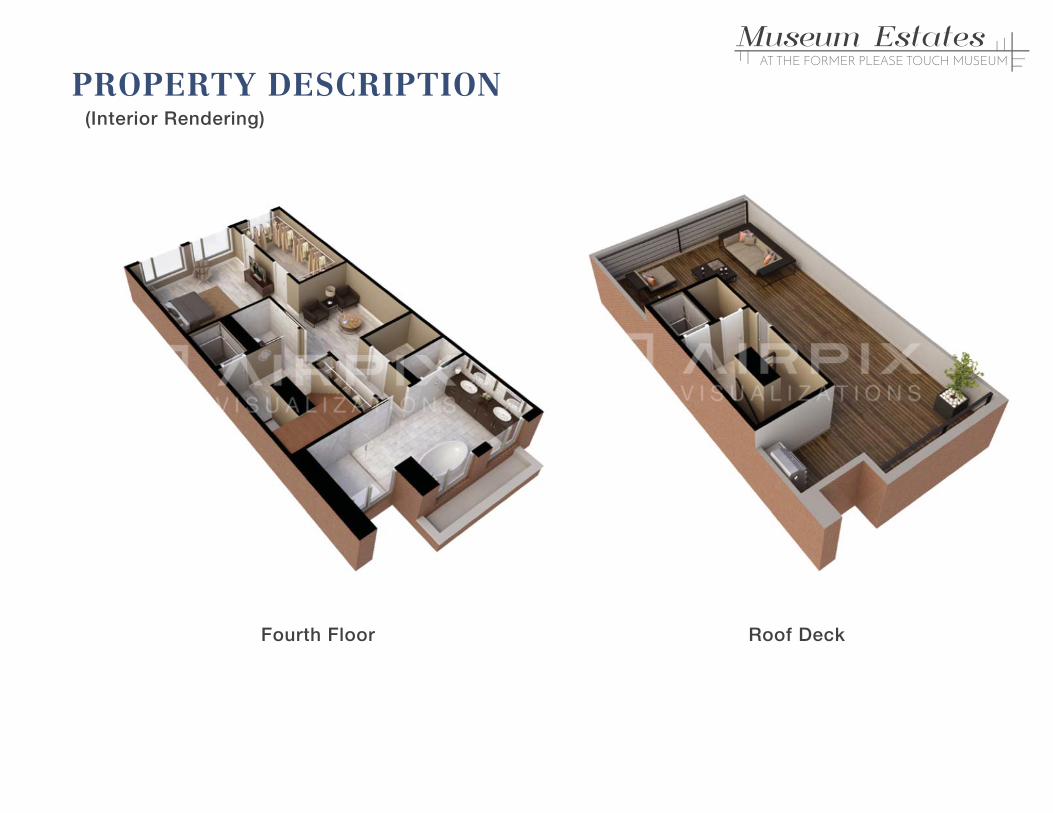
PROPERTY DESCRIPTION(Interior Rendering)
Fourth Floor Roof Deck
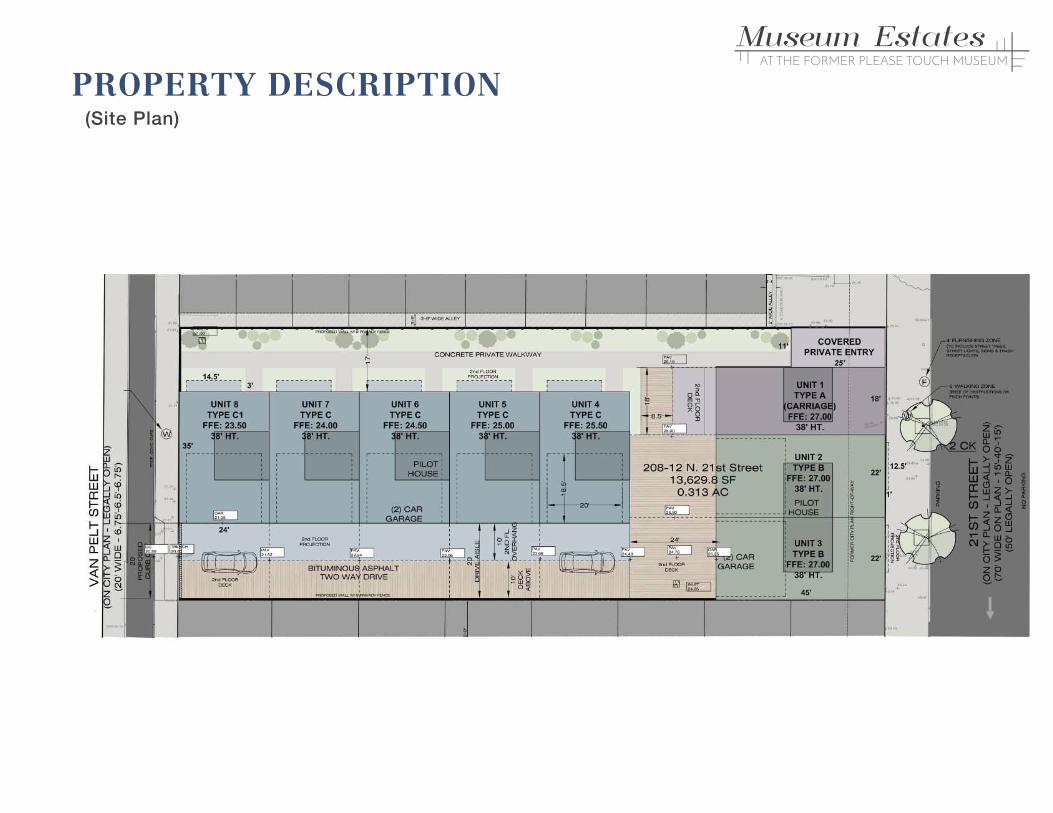
PROPERTY DESCRIPTION(Site Plan)
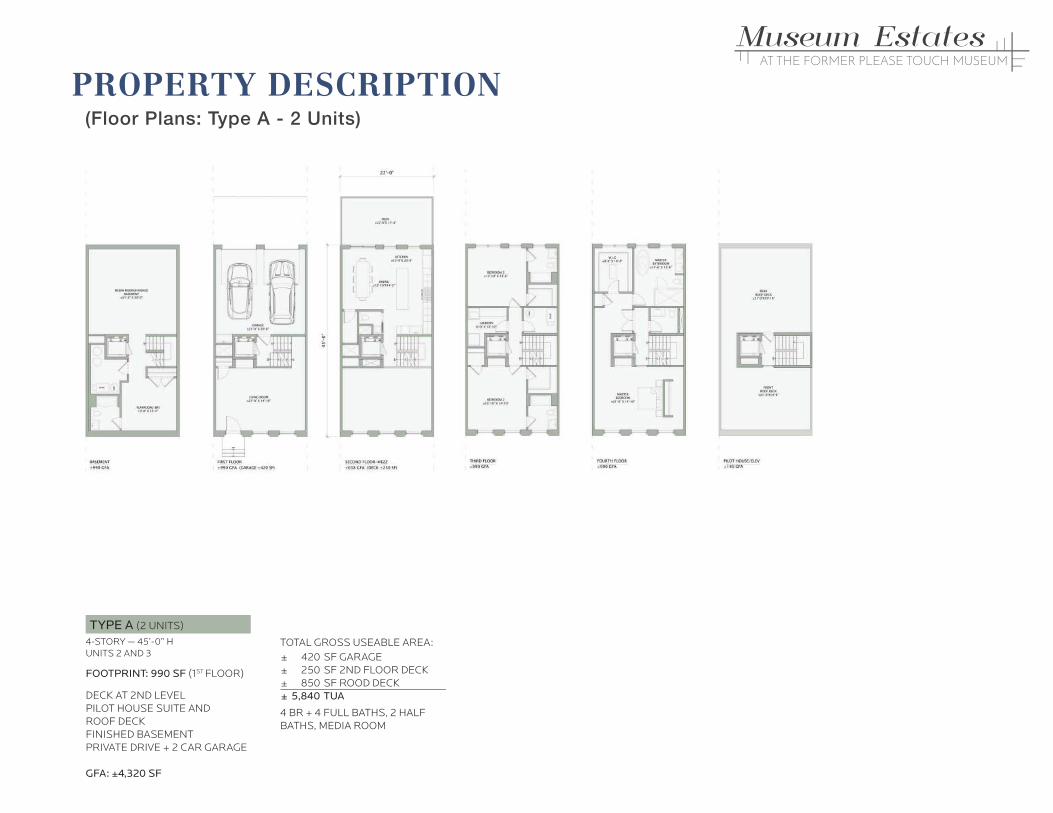
PROPERTY DESCRIPTION(Floor Plans: Type A - 2 Units)
4-STORY — 45’-0” HUNITS 2 AND 3
FOOTPRINT: 990 SF (1ST FLOOR)
DECK AT 2ND LEVELPILOT HOUSE SUITE AND ROOF DECKFINISHED BASEMENTPRIVATE DRIVE + 2 CAR GARAGE
GFA: ±4,320 SF
TYPE A (2 UNITS)
±±±±
TOTAL GROSS USEABLE AREA:420250850
5,840
SF GARAGESF 2ND FLOOR DECKSF ROOD DECKTUA
4 BR + 4 FULL BATHS, 2 HALF BATHS, MEDIA ROOM
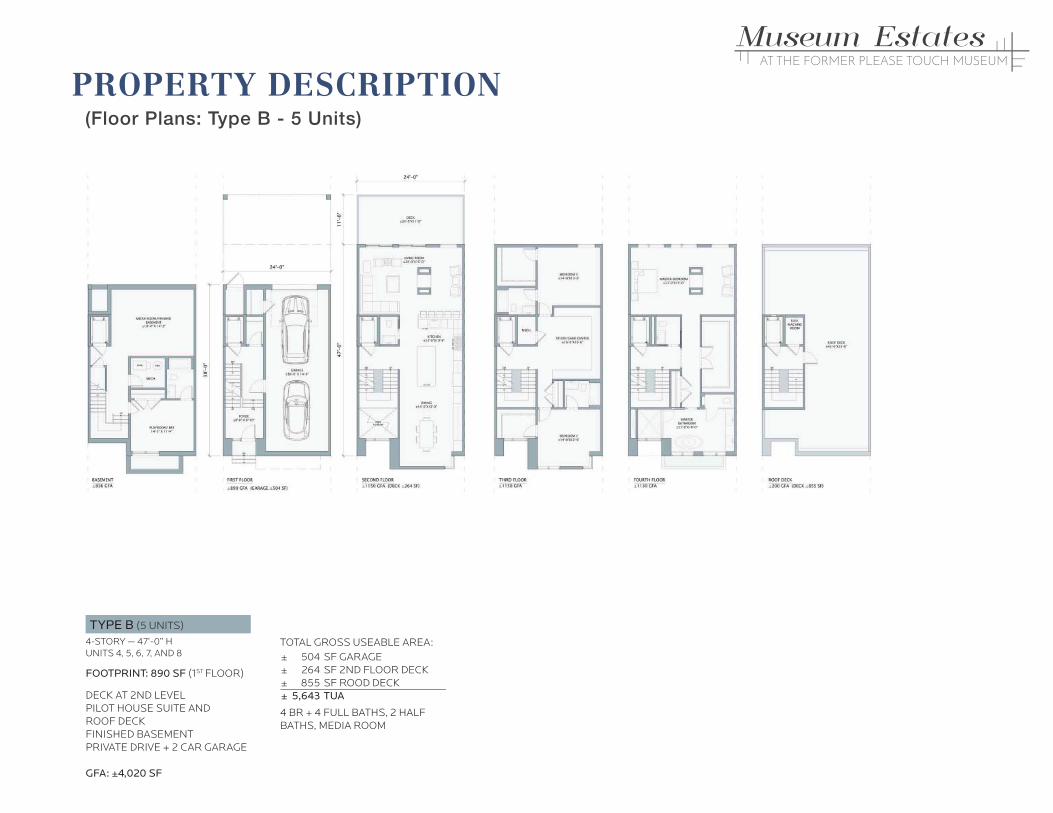
PROPERTY DESCRIPTION(Floor Plans: Type B - 5 Units)
4-STORY — 47’-0” HUNITS 4, 5, 6, 7, AND 8
FOOTPRINT: 890 SF (1ST FLOOR)
DECK AT 2ND LEVELPILOT HOUSE SUITE AND ROOF DECKFINISHED BASEMENTPRIVATE DRIVE + 2 CAR GARAGE
GFA: ±4,020 SF
TYPE B (5 UNITS)
±±±±
504264855
5,643
SF GARAGESF 2ND FLOOR DECKSF ROOD DECKTUA
4 BR + 4 FULL BATHS, 2 HALF BATHS, MEDIA ROOM
TOTAL GROSS USEABLE AREA:
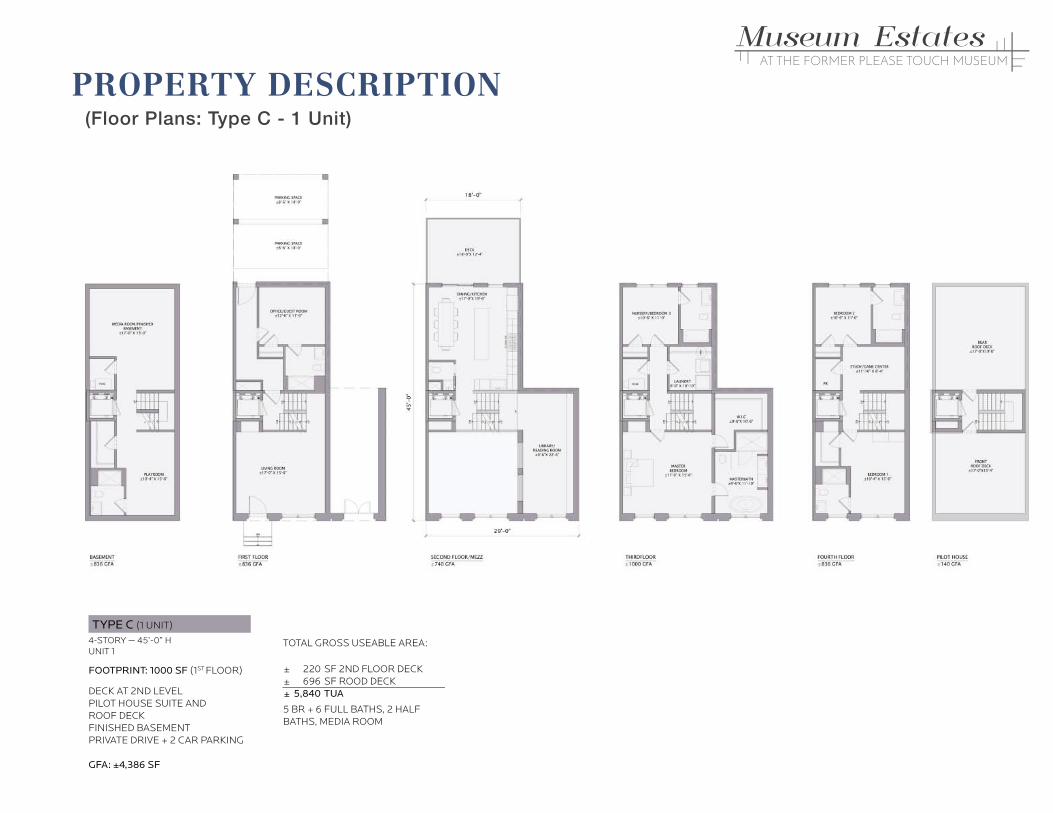
PROPERTY DESCRIPTION(Floor Plans: Type C - 1 Unit)
4-STORY — 45’-0” HUNIT 1
FOOTPRINT: 1000 SF (1ST FLOOR)
DECK AT 2ND LEVELPILOT HOUSE SUITE AND ROOF DECKFINISHED BASEMENTPRIVATE DRIVE + 2 CAR PARKING
GFA: ±4,386 SF
TYPE C (1 UNIT)
±±±
TOTAL GROSS USEABLE AREA:
220696
5,840
SF 2ND FLOOR DECKSF ROOD DECKTUA
5 BR + 6 FULL BATHS, 2 HALF BATHS, MEDIA ROOM
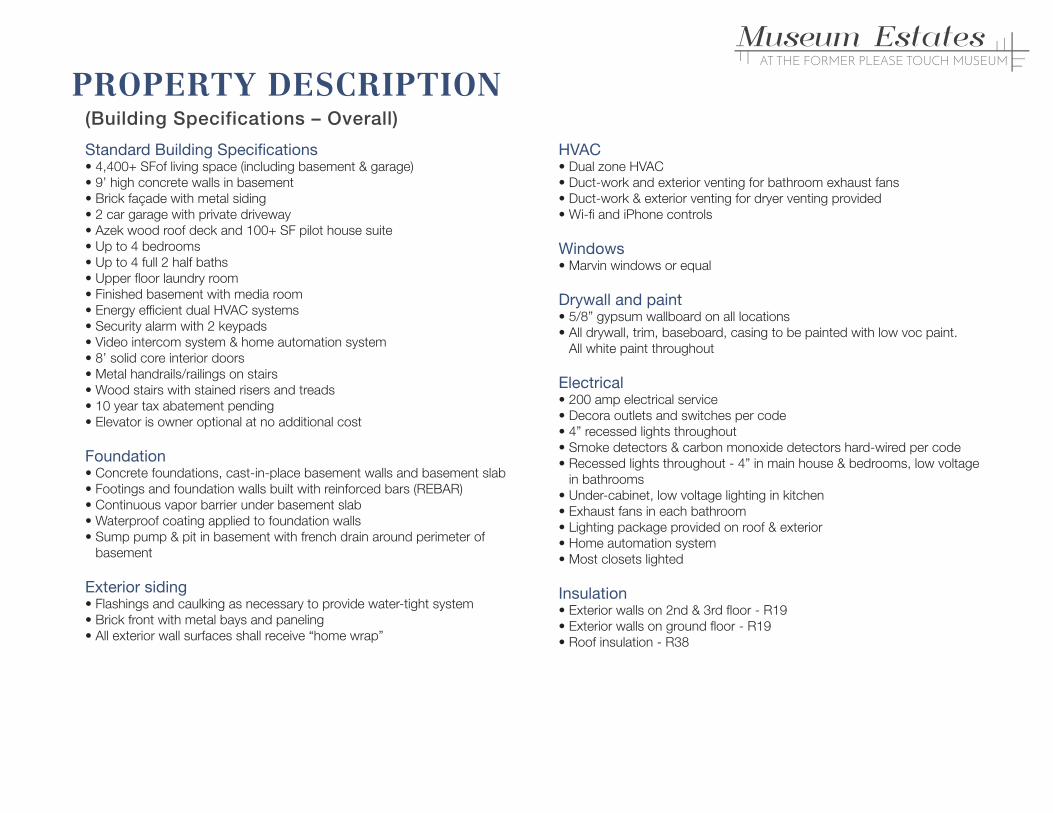
Standard Building Specifi cations• 4,400+ SFof living space (including basement & garage)
• 9’ high concrete walls in basement
• Brick façade with metal siding
• 2 car garage with private driveway
• Azek wood roof deck and 100+ SF pilot house suite
• Up to 4 bedrooms
• Up to 4 full 2 half baths
• Upper fl oor laundry room
• Finished basement with media room
• Energy effi cient dual HVAC systems
• Security alarm with 2 keypads
• Video intercom system & home automation system
• 8’ solid core interior doors
• Metal handrails/railings on stairs
• Wood stairs with stained risers and treads
• 10 year tax abatement pending
• Elevator is owner optional at no additional cost
Foundation• Concrete foundations, cast-in-place basement walls and basement slab
• Footings and foundation walls built with reinforced bars (REBAR)
• Continuous vapor barrier under basement slab
• Waterproof coating applied to foundation walls
• Sump pump & pit in basement with french drain around perimeter of
basement
Exterior siding• Flashings and caulking as necessary to provide water-tight system
• Brick front with metal bays and paneling
• All exterior wall surfaces shall receive “home wrap”
HVAC• Dual zone HVAC
• Duct-work and exterior venting for bathroom exhaust fans
• Duct-work & exterior venting for dryer venting provided
• Wi-fi and iPhone controls
Windows• Marvin windows or equal
Drywall and paint• 5/8” gypsum wallboard on all locations
• All drywall, trim, baseboard, casing to be painted with low voc paint.
All white paint throughout
Electrical• 200 amp electrical service
• Decora outlets and switches per code
• 4” recessed lights throughout
• Smoke detectors & carbon monoxide detectors hard-wired per code
• Recessed lights throughout - 4” in main house & bedrooms, low voltage
in bathrooms
• Under-cabinet, low voltage lighting in kitchen
• Exhaust fans in each bathroom
• Lighting package provided on roof & exterior
• Home automation system
• Most closets lighted
Insulation• Exterior walls on 2nd & 3rd fl oor - R19
• Exterior walls on ground fl oor - R19
• Roof insulation - R38
PROPERTY DESCRIPTION(Building Specifications – Overall)
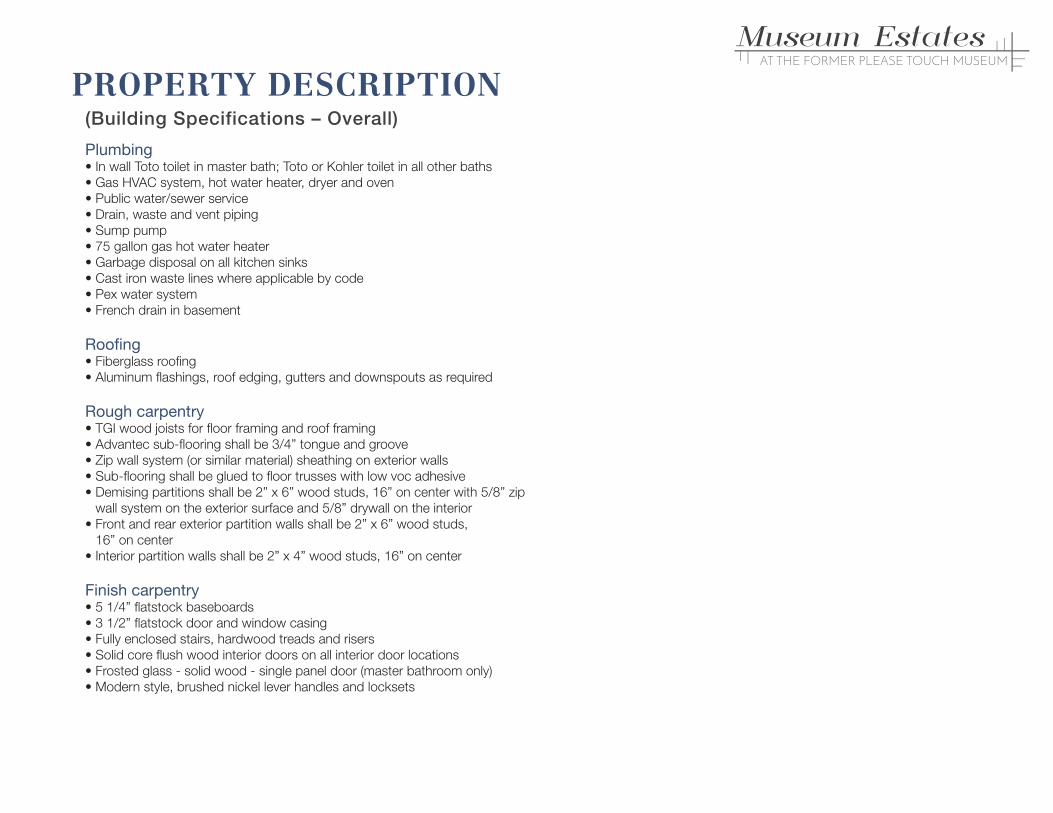
Plumbing• In wall Toto toilet in master bath; Toto or Kohler toilet in all other baths
• Gas HVAC system, hot water heater, dryer and oven
• Public water/sewer service
• Drain, waste and vent piping
• Sump pump
• 75 gallon gas hot water heater
• Garbage disposal on all kitchen sinks
• Cast iron waste lines where applicable by code
• Pex water system
• French drain in basement
Roofi ng• Fiberglass roofi ng
• Aluminum fl ashings, roof edging, gutters and downspouts as required
Rough carpentry• TGI wood joists for fl oor framing and roof framing
• Advantec sub-fl ooring shall be 3/4” tongue and groove
• Zip wall system (or similar material) sheathing on exterior walls
• Sub-fl ooring shall be glued to fl oor trusses with low voc adhesive
• Demising partitions shall be 2” x 6” wood studs, 16” on center with 5/8” zip
wall system on the exterior surface and 5/8” drywall on the interior
• Front and rear exterior partition walls shall be 2” x 6” wood studs,
16” on center
• Interior partition walls shall be 2” x 4” wood studs, 16” on center
Finish carpentry• 5 1/4” fl atstock baseboards
• 3 1/2” fl atstock door and window casing
• Fully enclosed stairs, hardwood treads and risers
• Solid core fl ush wood interior doors on all interior door locations
• Frosted glass - solid wood - single panel door (master bathroom only)
• Modern style, brushed nickel lever handles and locksets
PROPERTY DESCRIPTION(Building Specifications – Overall)
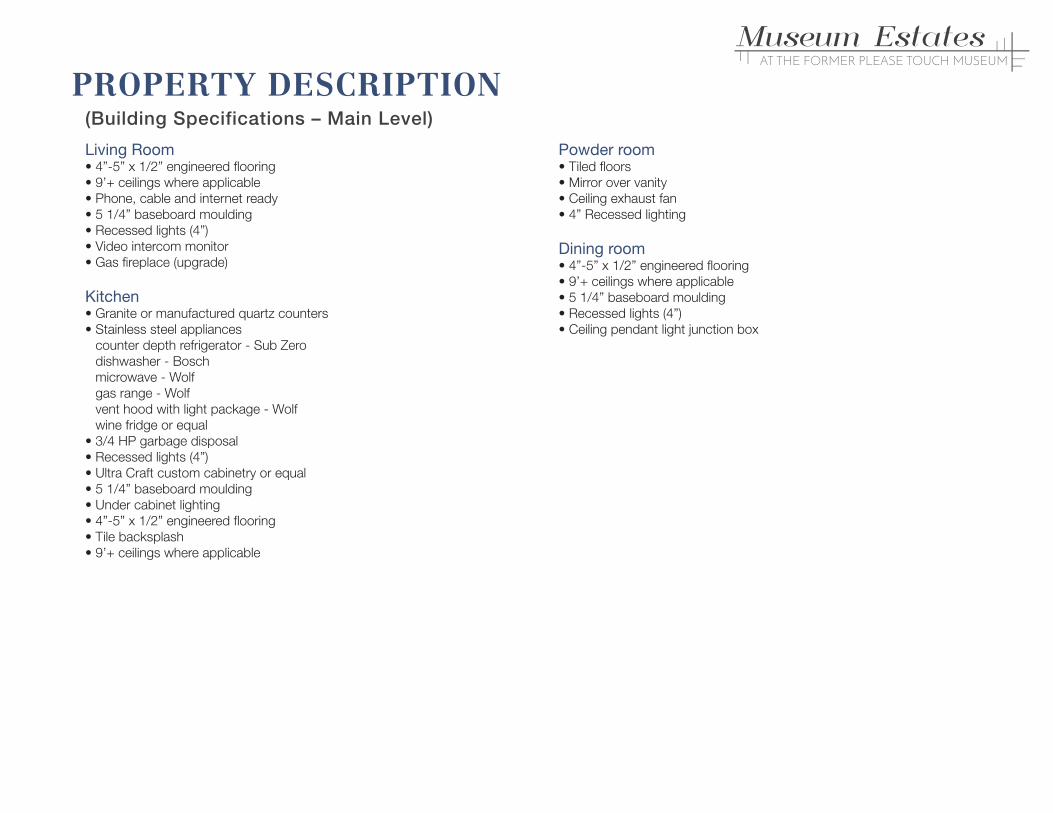
Living Room• 4”-5” x 1/2” engineered fl ooring
• 9’+ ceilings where applicable
• Phone, cable and internet ready
• 5 1/4” baseboard moulding
• Recessed lights (4”)
• Video intercom monitor
• Gas fi replace (upgrade)
Kitchen• Granite or manufactured quartz counters
• Stainless steel appliances
counter depth refrigerator - Sub Zero
dishwasher - Bosch
microwave - Wolf
gas range - Wolf
vent hood with light package - Wolf
wine fridge or equal
• 3/4 HP garbage disposal
• Recessed lights (4”)
• Ultra Craft custom cabinetry or equal
• 5 1/4” baseboard moulding
• Under cabinet lighting
• 4”-5” x 1/2” engineered fl ooring
• Tile backsplash
• 9’+ ceilings where applicable
Powder room• Tiled fl oors
• Mirror over vanity
• Ceiling exhaust fan
• 4” Recessed lighting
Dining room• 4”-5” x 1/2” engineered fl ooring
• 9’+ ceilings where applicable
• 5 1/4” baseboard moulding
• Recessed lights (4”)
• Ceiling pendant light junction box
PROPERTY DESCRIPTION(Building Specifications – Main Level)
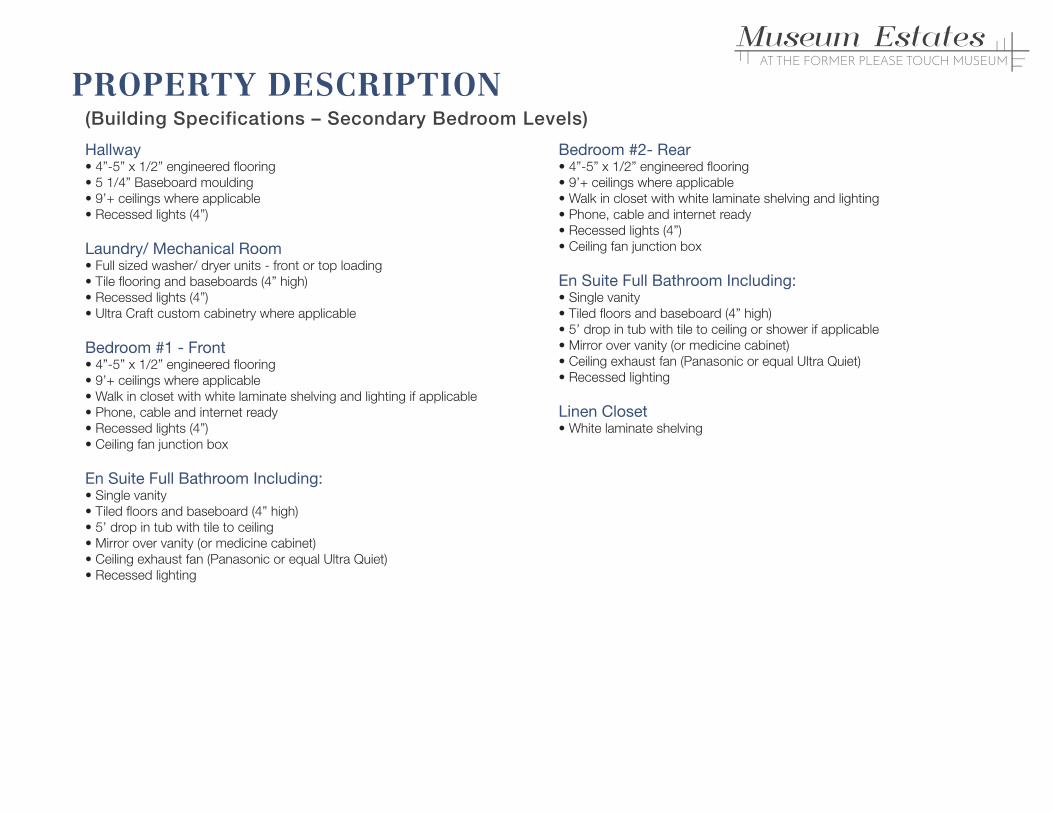
Hallway• 4”-5” x 1/2” engineered fl ooring
• 5 1/4” Baseboard moulding
• 9’+ ceilings where applicable
• Recessed lights (4”)
Laundry/ Mechanical Room• Full sized washer/ dryer units - front or top loading
• Tile fl ooring and baseboards (4” high)
• Recessed lights (4”)
• Ultra Craft custom cabinetry where applicable
Bedroom #1 - Front• 4”-5” x 1/2” engineered fl ooring
• 9’+ ceilings where applicable
• Walk in closet with white laminate shelving and lighting if applicable
• Phone, cable and internet ready
• Recessed lights (4”)
• Ceiling fan junction box
En Suite Full Bathroom Including: • Single vanity
• Tiled fl oors and baseboard (4” high)
• 5’ drop in tub with tile to ceiling
• Mirror over vanity (or medicine cabinet)
• Ceiling exhaust fan (Panasonic or equal Ultra Quiet)
• Recessed lighting
Bedroom #2- Rear• 4”-5” x 1/2” engineered fl ooring
• 9’+ ceilings where applicable
• Walk in closet with white laminate shelving and lighting
• Phone, cable and internet ready
• Recessed lights (4”)
• Ceiling fan junction box
En Suite Full Bathroom Including: • Single vanity
• Tiled fl oors and baseboard (4” high)
• 5’ drop in tub with tile to ceiling or shower if applicable
• Mirror over vanity (or medicine cabinet)
• Ceiling exhaust fan (Panasonic or equal Ultra Quiet)
• Recessed lighting
Linen Closet• White laminate shelving
PROPERTY DESCRIPTION(Building Specifications – Secondary Bedroom Levels)
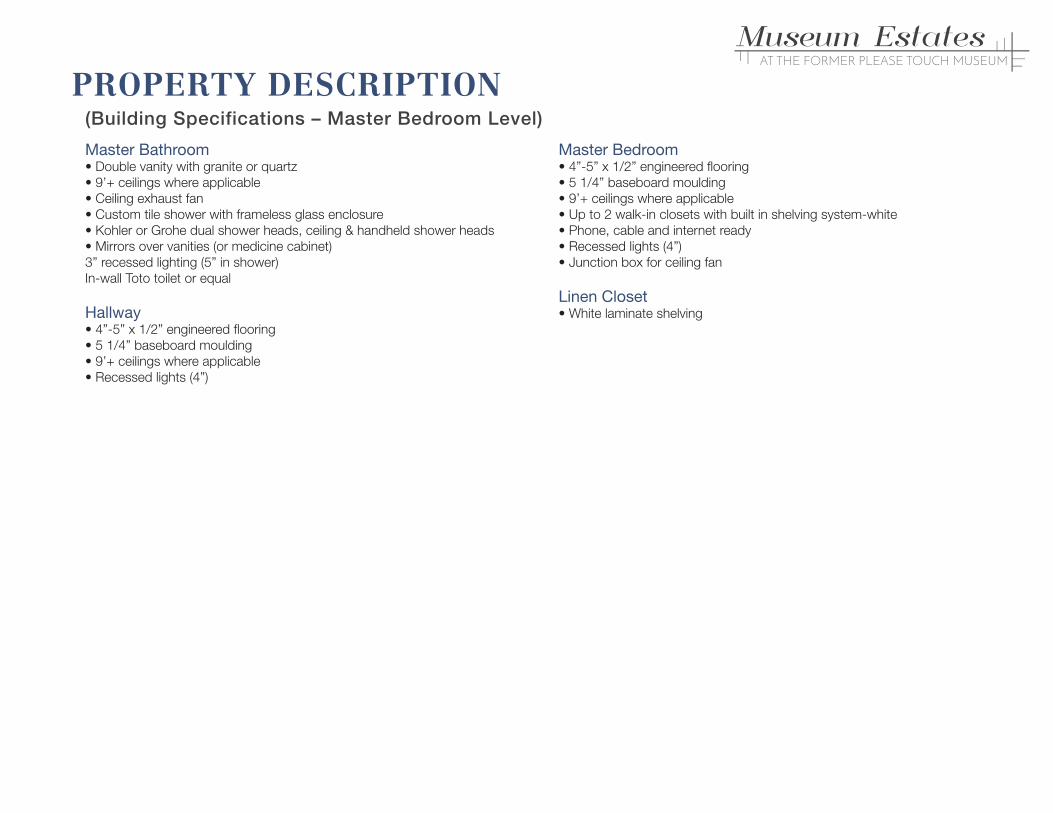
Master Bathroom• Double vanity with granite or quartz
• 9’+ ceilings where applicable
• Ceiling exhaust fan
• Custom tile shower with frameless glass enclosure
• Kohler or Grohe dual shower heads, ceiling & handheld shower heads
• Mirrors over vanities (or medicine cabinet)
3” recessed lighting (5” in shower)
In-wall Toto toilet or equal
Hallway• 4”-5” x 1/2” engineered fl ooring
• 5 1/4” baseboard moulding
• 9’+ ceilings where applicable
• Recessed lights (4”)
Master Bedroom• 4”-5” x 1/2” engineered fl ooring
• 5 1/4” baseboard moulding
• 9’+ ceilings where applicable
• Up to 2 walk-in closets with built in shelving system-white
• Phone, cable and internet ready
• Recessed lights (4”)
• Junction box for ceiling fan
Linen Closet• White laminate shelving
PROPERTY DESCRIPTION(Building Specifications – Master Bedroom Level)
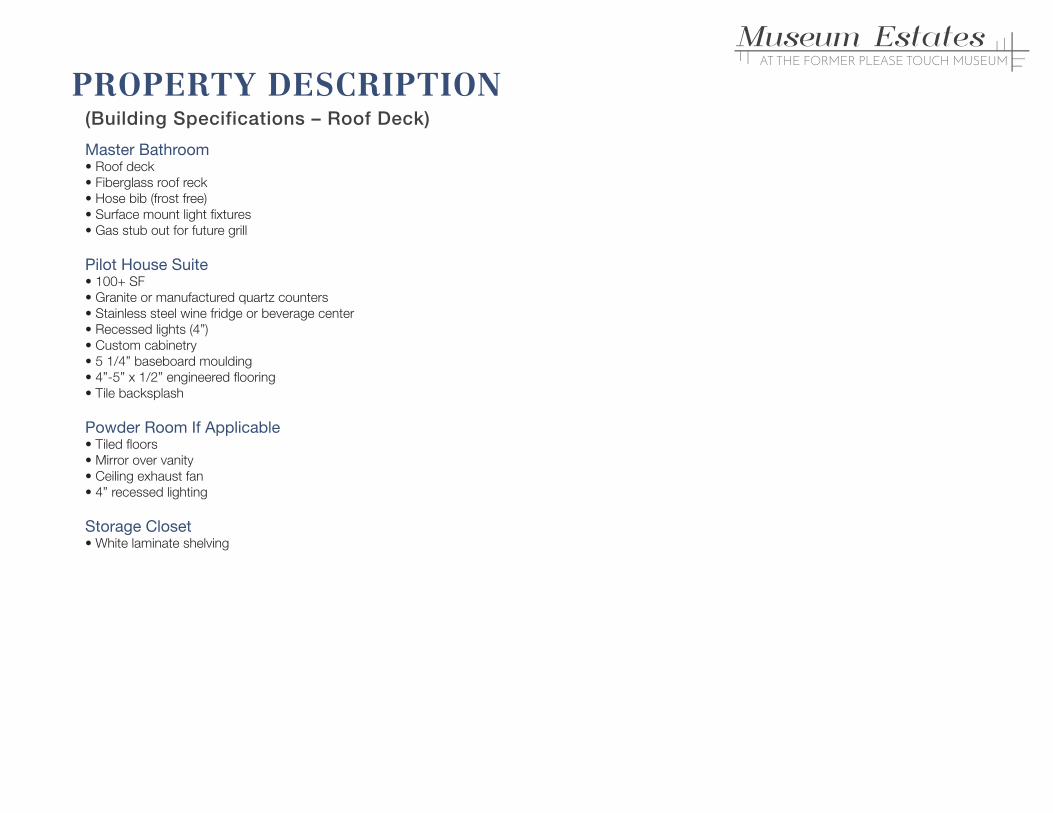
Master Bathroom• Roof deck
• Fiberglass roof reck
• Hose bib (frost free)
• Surface mount light fi xtures
• Gas stub out for future grill
Pilot House Suite• 100+ SF
• Granite or manufactured quartz counters
• Stainless steel wine fridge or beverage center
• Recessed lights (4”)
• Custom cabinetry
• 5 1/4” baseboard moulding
• 4”-5” x 1/2” engineered fl ooring
• Tile backsplash
Powder Room If Applicable• Tiled fl oors
• Mirror over vanity
• Ceiling exhaust fan
• 4” recessed lighting
Storage Closet• White laminate shelving
PROPERTY DESCRIPTION(Building Specifications – Roof Deck)
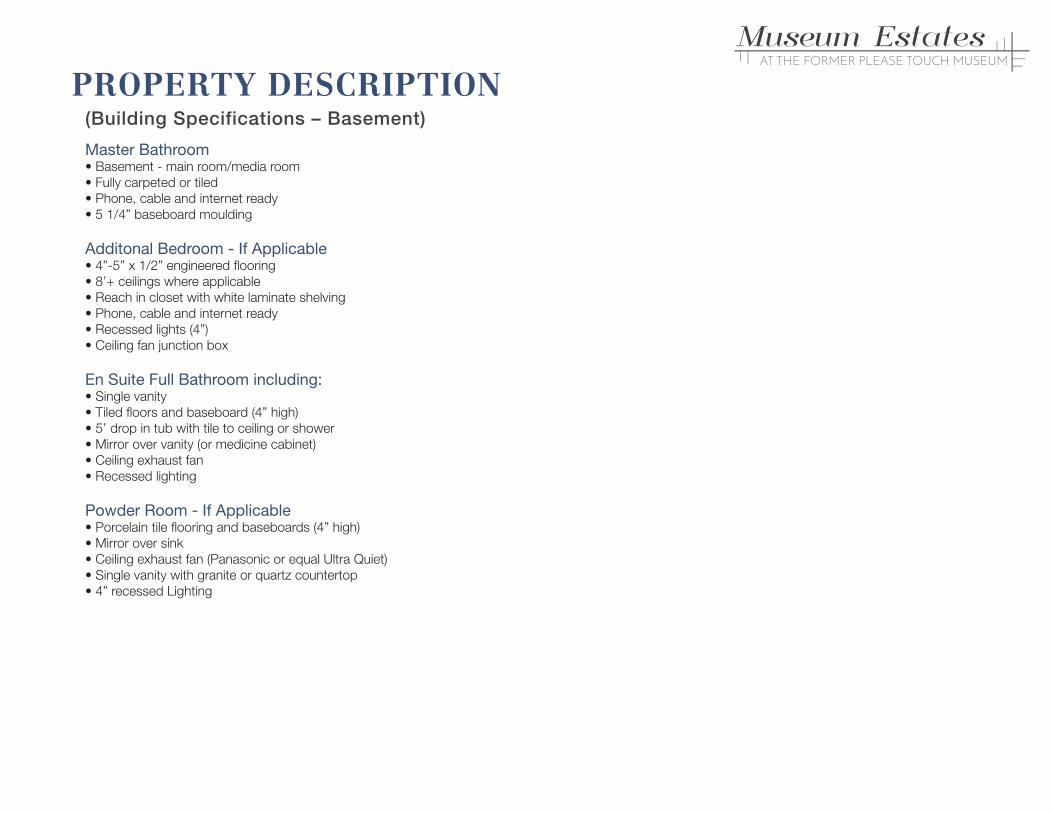
Master Bathroom• Basement - main room/media room
• Fully carpeted or tiled
• Phone, cable and internet ready
• 5 1/4” baseboard moulding
Additonal Bedroom - If Applicable• 4”-5” x 1/2” engineered fl ooring
• 8’+ ceilings where applicable
• Reach in closet with white laminate shelving
• Phone, cable and internet ready
• Recessed lights (4”)
• Ceiling fan junction box
En Suite Full Bathroom including: • Single vanity
• Tiled fl oors and baseboard (4” high)
• 5’ drop in tub with tile to ceiling or shower
• Mirror over vanity (or medicine cabinet)
• Ceiling exhaust fan
• Recessed lighting
Powder Room - If Applicable• Porcelain tile fl ooring and baseboards (4” high)
• Mirror over sink
• Ceiling exhaust fan (Panasonic or equal Ultra Quiet)
• Single vanity with granite or quartz countertop
• 4” recessed Lighting
PROPERTY DESCRIPTION(Building Specifications – Basement)

3 AreaOverview
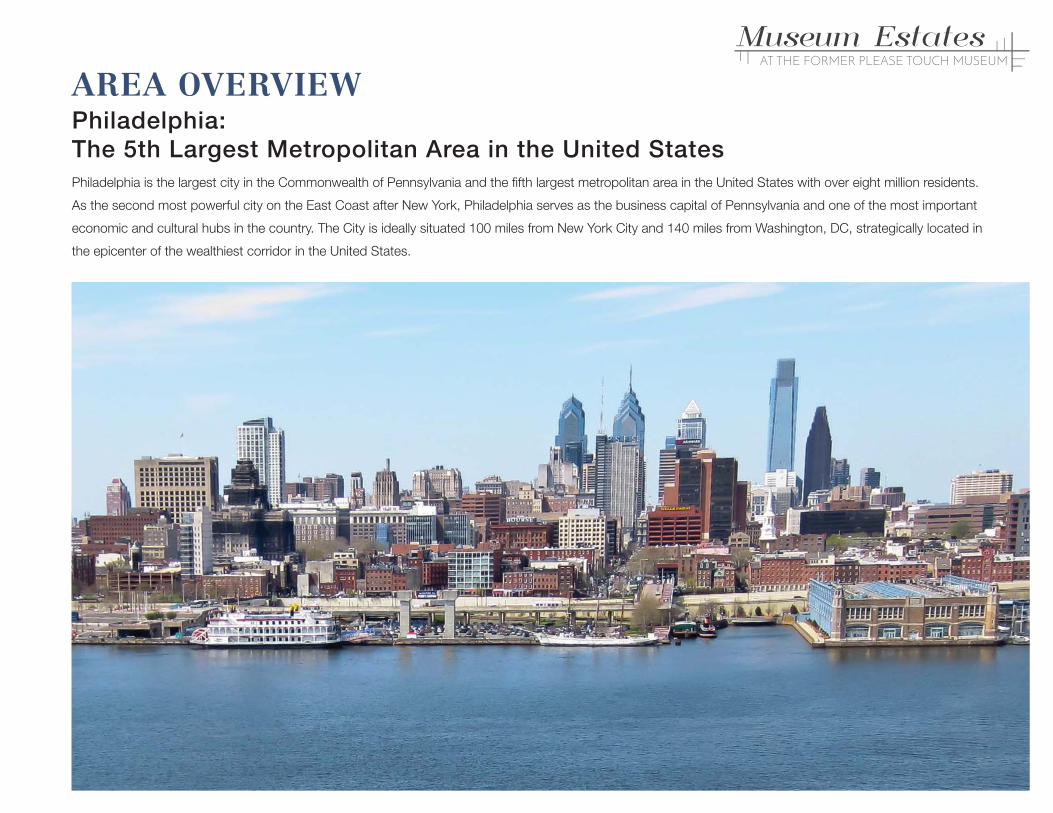
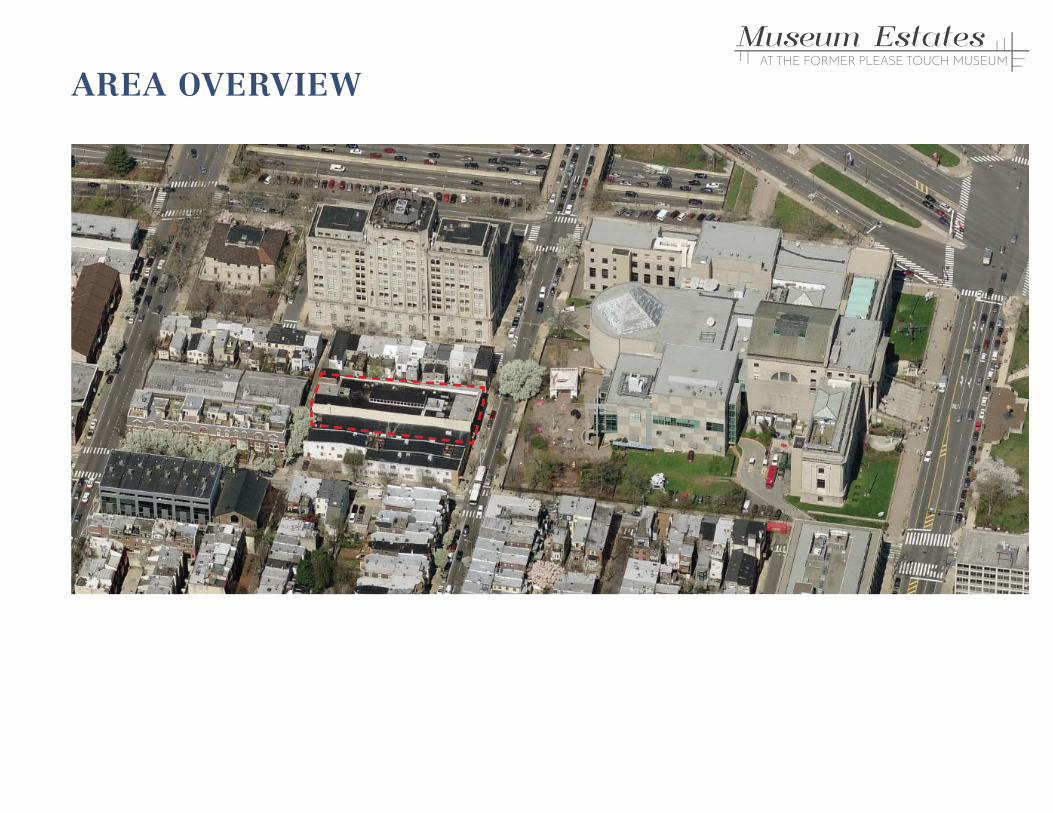
Philadelphia is the largest city in the Commonwealth of Pennsylvania and the fi fth largest metropolitan area in the United States with over eight million residents.
As the second most powerful city on the East Coast after New York, Philadelphia serves as the business capital of Pennsylvania and one of the most important
economic and cultural hubs in the country. The City is ideally situated 100 miles from New York City and 140 miles from Washington, DC, strategically located in
the epicenter of the wealthiest corridor in the United States.
AREA OVERVIEWPhiladelphia:The 5th Largest Metropolitan Area in the United States
Logan Square’s personality defi es a single defi nition. Corporate and municipal offi ce buildings cover swaths of wide streets, creating the bustle of daily commerce.
Luxury high-rises and modern and historic houses line leafy side streets. The museums that border the broad, tree-lined Benjamin Franklin Parkway add yet
another dimension. Green spaces — including the square that gives the area its name—provide spots for relaxation, refl ection and fun.
Logan Square, which sits between Broad Street on the east, the Schuylkill River on the west, Market Street on the south and Spring Garden Street on the north,
is home to a number of iconic Philadelphia attractions. The center of the city government’s daily business, City Hall is a natural focal point. Its elaborate architecture
and ornamentation make people stop and take notice — and photos. The architectural equivalent of a wedding cake, the sprawling building is adorned with
carvings of allegorical fi gures and is capped off with a massive statue of William Penn, all designed by Alexander Milne Calder.
What To DoBenjamin Franklin Parkway
Undoubtedly, the neighborhood highlight is the grand Benjamin Franklin Parkway. Its attractions and green spaces captivate residents and visitors. The buildings
on its borders are a who’s-who of culture: The Franklin Institute, The Academy of Natural Sciences of Drexel University, The Barnes Foundation, the Free Library
of Philadelphia, the Rodin Museum, the Ruth and Raymond G. Perelman Building and the Philadelphia Museum of Art. The stretch is also street-party central, with
massive events such as the Fourth of July concert, Made In America,
Philadelphia Marathon, Thanksgiving Day Parade and other large-
scale to-dos taking place throughout the year.
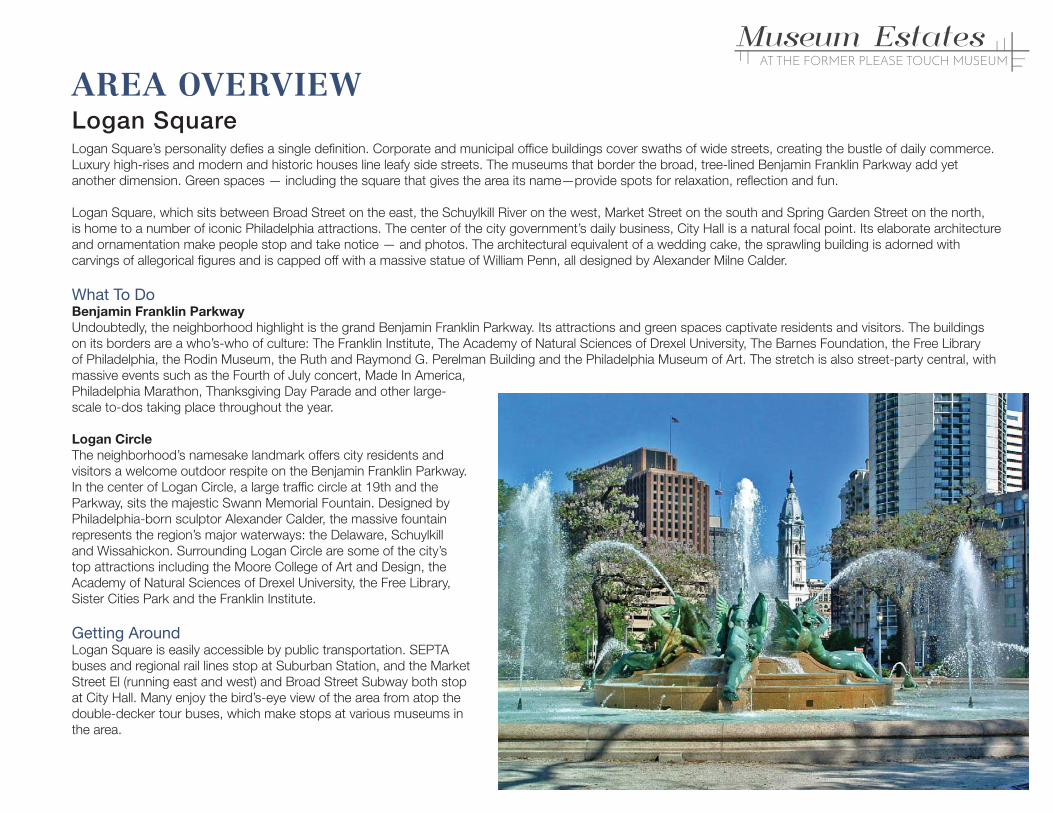
Logan Circle
The neighborhood’s namesake landmark offers city residents and
visitors a welcome outdoor respite on the Benjamin Franklin Parkway.
In the center of Logan Circle, a large traffi c circle at 19th and the
Parkway, sits the majestic Swann Memorial Fountain. Designed by
Philadelphia-born sculptor Alexander Calder, the massive fountain
represents the region’s major waterways: the Delaware, Schuylkill
and Wissahickon. Surrounding Logan Circle are some of the city’s
top attractions including the Moore College of Art and Design, the
Academy of Natural Sciences of Drexel University, the Free Library,
Sister Cities Park and the Franklin Institute.
Getting AroundLogan Square is easily accessible by public transportation. SEPTA
buses and regional rail lines stop at Suburban Station, and the Market
Street El (running east and west) and Broad Street Subway both stop
at City Hall. Many enjoy the bird’s-eye view of the area from atop the
double-decker tour buses, which make stops at various museums in
the area.
AREA OVERVIEWLogan Square
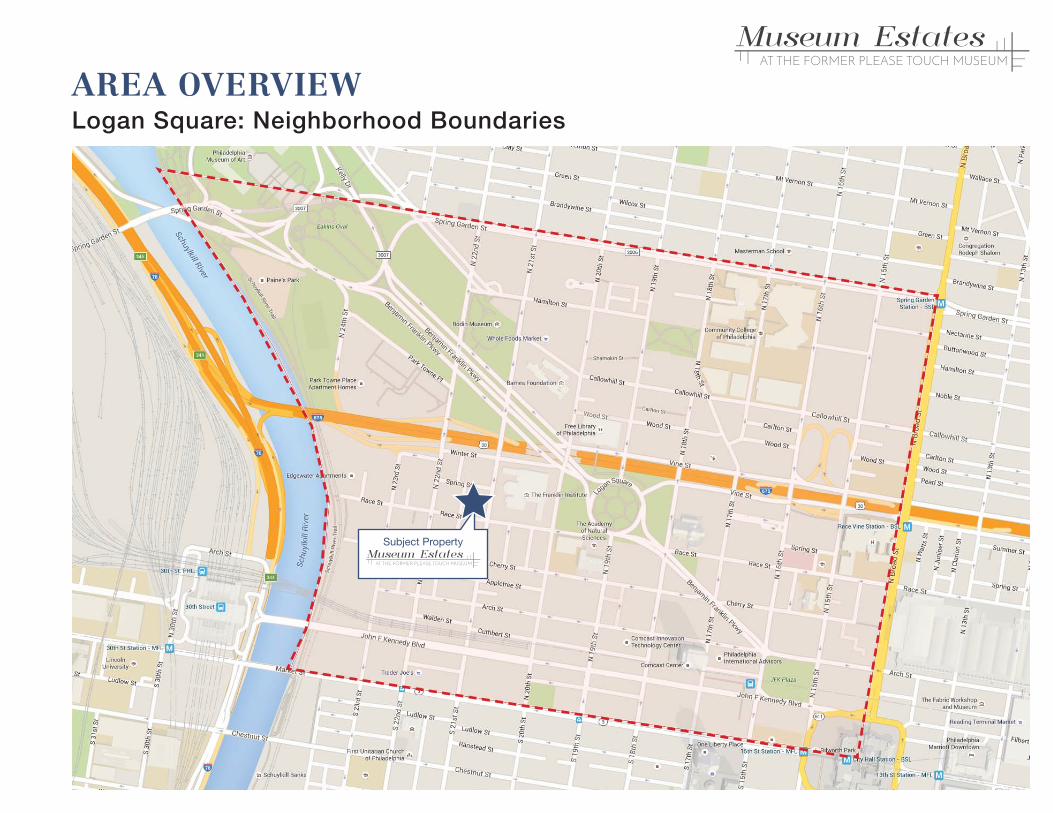
AREA OVERVIEWLogan Square: Neighborhood Boundaries
Subject Property
AREA OVERVIEW
Philadelphia’s economy has undergone a dramatic transformation from its
traditional manufacturing base to one driven by a variety of industries, with a
special emphasis on the healthcare and higher education sectors. Philadelphia
is home to 98 hospitals and more than 90 institutions of higher education, which
employ more than 580,000 highly educated professionals across the region.
The Philadelphia Metropolitan Area is also home to nine Fortune 500 companies,
including AmerisourceBergen, Aramark, Campbell Soup Company, Comcast,
Crown Holdings, E.I. du Pont de Nemours, and Lincoln National, among others.
In 2013, these nine companies generated in excess of $249 billion in annual
revenues, representing nearly 67% of the Philadelphia Metropolitan Area’s gross
metropolitan product (GMP).
The city’s large and diversifi ed economy has helped generate a GMP of
$364 billion, one of the highest in the United States. As of August 2014, the
Philadelphia Metropolitan Area’s unemployment rate stood at 6.7%, lower than
major U.S. cities such as Atlanta, Chicago, and Los Angeles. More recently,
Philadelphia’s fast-growing biomedical and pharmaceutical industries have
brought 14 major pharmaceutical fi rms and nearly 100 biotech fi rms to the
area. Eight of the world’s largest pharmaceutical companies are located within
a 50-mile radius of Philadelphia, including Astra Zeneca, Bristol-Myers Squibb,
GlaxoSmithKline, Janssen Biotech, Merck, and Novo Nordisk. Philadelphia is
also one of the top 15 markets in the U.S. for venture capital investment with
nearly $350 million of committed capital across 105 different investments.
Within a 5-hour drive of 25% of the U.S. population
• State-of-the-art international airport within a two-hour fl ight of half of the
U.S. population
• Amtrak’s 30th Street Station serves nearly 4.2 million riders per year and
offers high-speed trains to New York, Washington, DC, and Boston
• SEPTA has the 6th largest rapid transit system by ridership in the country
• Home to 98 hospitals and over 90 institutions of higher education
• Headquarters of 9 Fortune 500 Companies with revenue of over $249 billion
• CHOP expected to add ~500 full-time doctors, researchers and other
employees
• Penn Health gearing up for $1.5 billion hospital expansion, nearly doubling
bed count
AREA OVERVIEWPhiladelphia: Diversified Economy
AREA OVERVIEWPhiladelphia: Home to the Nation’s Leading Universities
Philadelphia’s educational leadership began in 1740 with the founding of one
of the country’s fi rst universities, the Ivy League, world-class University of
Pennsylvania. Over 250 years later, the region is home to leading universities
specializing in biotechnology, business, fi nance, medicine, and technology,
which produce highly skilled graduates that continue to stimulate Philadelphia’s
economy. Philadelphia is also home to fi ve nationally recognized schools of
medicine, including Drexel University College of Medicine, Philadelphia College
of Osteopathic Medicine, Temple University School of Medicine, Jefferson
Medical College, and the Perelman School of Medicine at the University of
Pennsylvania.
• Second highest number of four-year colleges in the country after New York,
with more than 90 degree-granting institutions
• The second largest student population of any city on the East Coast, with
approximately 368,000 students and more than 66,000 graduates each year
• Highly educated workforce with more than 75% of Center City residents
holding at least a Bachelor’s degree
• Drexel University strategic plan to increase student population by 10,405
students by 2021 and full time employees by 4,119 during same period.
• 32,000 students downtown with an additional 54,000 across the Schuylkill
River in University City
AREA OVERVIEWCenter City: Impressive Population Growth
Center City has experienced the largest and most geographically concentrated
growth in Philadelphia. Since 2000, the Center City core population has
grown by more than 24% driven by a persistent migration of young, urban
professionals seeking to live in an amenity-rich, urban mixed-use environment.
By comparison, the core Center City population growth since 2000 has
exceeded that of major cities,including Boston (7.5%), San Francisco (6.2%),
and New York (5.4%). Center City has one of the highest concentrations of res-
idents with post-secondary education in the United States: in 2000, nearly 68%
of Center City’s residents held at least a Bachelor’s Degree. By 2013, the fi gure
had grown to more than 75%.This incredible population growth, particularly
among educated residents, has contributed to a boom in multifamily deliveries.
Since 2000, approximately 2,100 multifamily units have been delivered in Center
City.
As the third largest downtown population in the US (behind NYC and Chicago),
Philadelphia is ranked as one of the most walkable / bikeable cities in America.
The Center City neighborhood epitomizes this trend (scoring 98 for each) –
refl ecting the new generation of renters favoring walkable, urban neighbor-
hoods. Within Philadelphia, Rittenhouse Square boasts the highest pedestrian
traffi c counts in the city ( approximately 23,000 people per day), and is
especially pedestrian-oriented.
• Over 61% and 63% of residents in a one-mile radius of Walnut and
Chestnut, respectively, take alternative means of transportation to
work, far exceeding the national average of 19%.
This trend is being further encouraged by the City of Philadelphia, which is
revealing a new Bike Share program this fall. With an initial rollout of 150 to 200
stations and over 2,000 bikes to be spread across the city over the next year,
anticipated ridership is around 500,000 trips annually by 2015, with local use
anticipated to surpass 2.5 million trips per year over the fi rst six years of
operations. The growing role of bicycles in Philadelphia will increase the
dynamism and connectivity of the market, signifi cantly expanding the
pedestrian count in Rittenhouse Square and Society Hill.
Center City: By the Numbers
• 288,500 jobs, or 44% of Philadelphia’s total workforce, with a total purchasing
power of $13 billion
• Most diversifi ed workforce in the region with the offi ce sector generating 31%
of all jobs
• 305,000 daily commuters with SEPTA recording a 10.2% and 13.1% increase
for subway and bus routes, respectively, into downtown over the last decade
• 409 cultural institutions as well as 14 colleges / universities and 5 hospitals
• 2nd nationally behind only Manhattan in the number of downtown art and
cultural institutions
• More than 3,200 retail establishments, 11,300 hotel rooms, and 37.5 million
square feet of Class A offi ce space
• 24.2% population growth from 2000 to 2013
• The adjacent University City is one of the nation’s preeminent education,
health, and R&D nodes with UPenn, Drexel, and CHOP, creating a signifi cant
opportunity for Philadelphia’s two largest employment centers to further
integrate and drive growth for the region
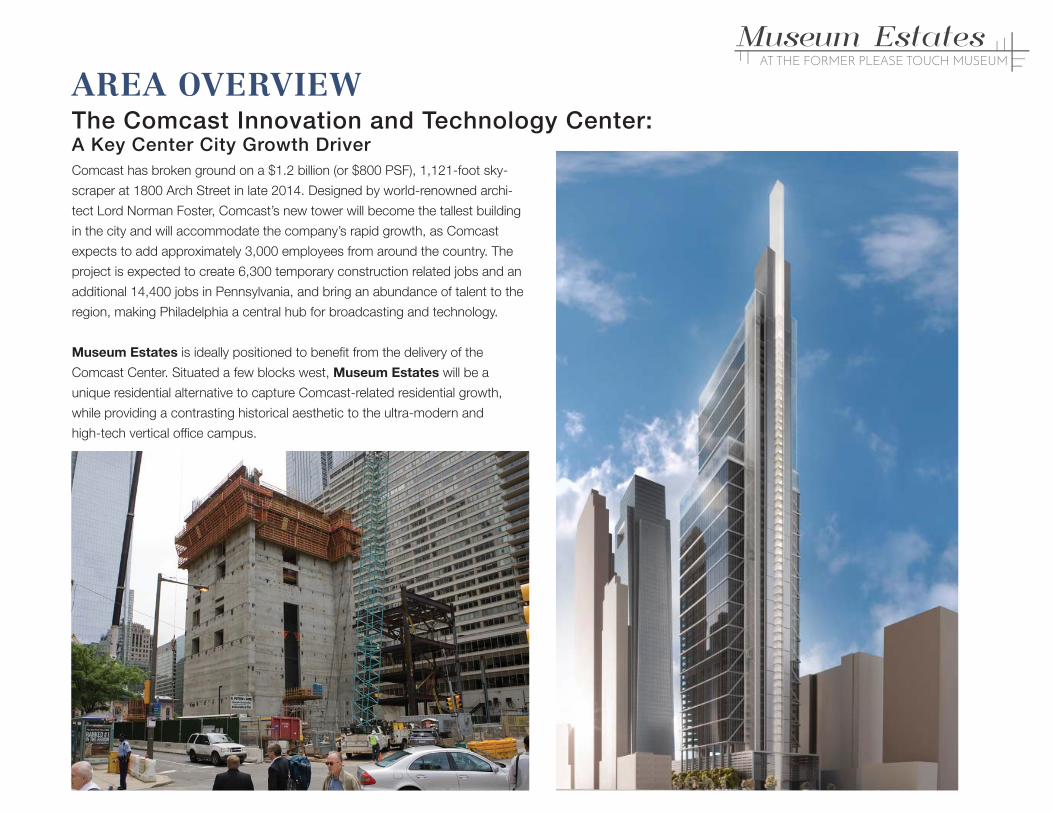
AREA OVERVIEWThe Comcast Innovation and Technology Center:A Key Center City Growth DriverComcast has broken ground on a $1.2 billion (or $800 PSF), 1,121-foot sky-
scraper at 1800 Arch Street in late 2014. Designed by world-renowned archi-
tect Lord Norman Foster, Comcast’s new tower will become the tallest building
in the city and will accommodate the company’s rapid growth, as Comcast
expects to add approximately 3,000 employees from around the country. The
project is expected to create 6,300 temporary construction related jobs and an
additional 14,400 jobs in Pennsylvania, and bring an abundance of talent to the
region, making Philadelphia a central hub for broadcasting and technology.
Museum Estates is ideally positioned to benefi t from the delivery of the
Comcast Center. Situated a few blocks west, Museum Estates will be a
unique residential alternative to capture Comcast-related residential growth,
while providing a contrasting historical aesthetic to the ultra-modern and
high-tech vertical offi ce campus.

4 ComparableProperties
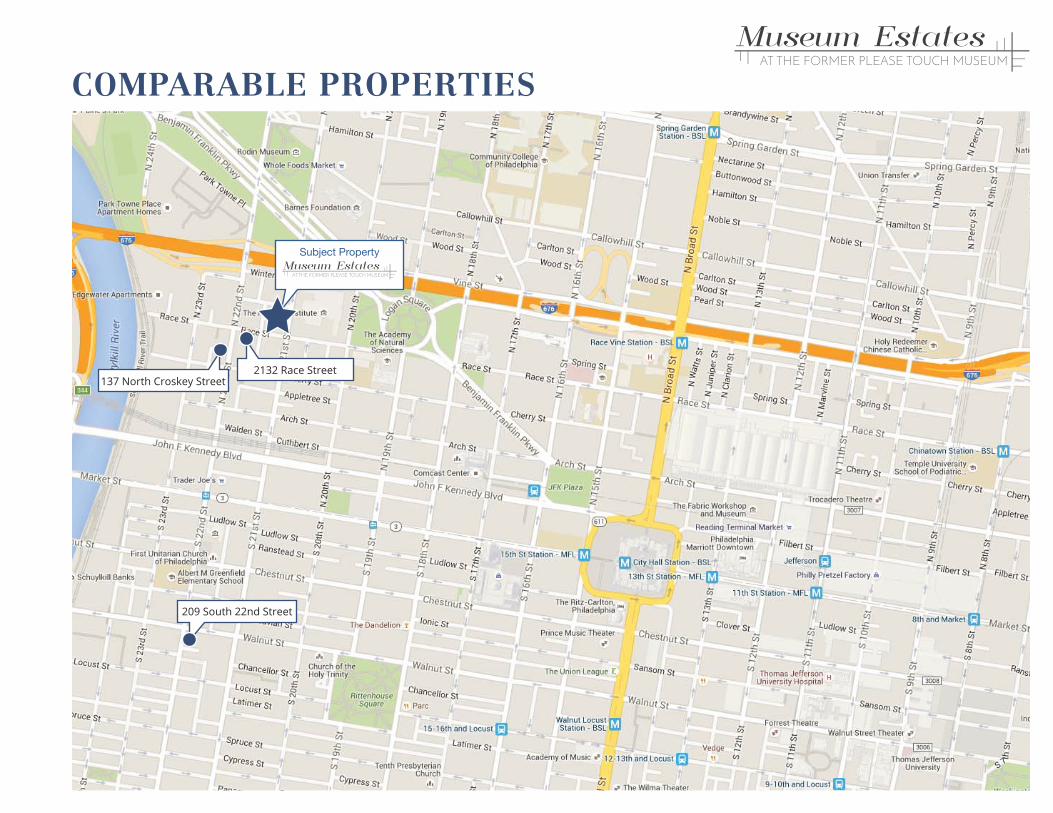
COMPARABLE PROPERTIES
Subject Property
137 North Croskey Street2132 Race Street
209 South 22nd Street
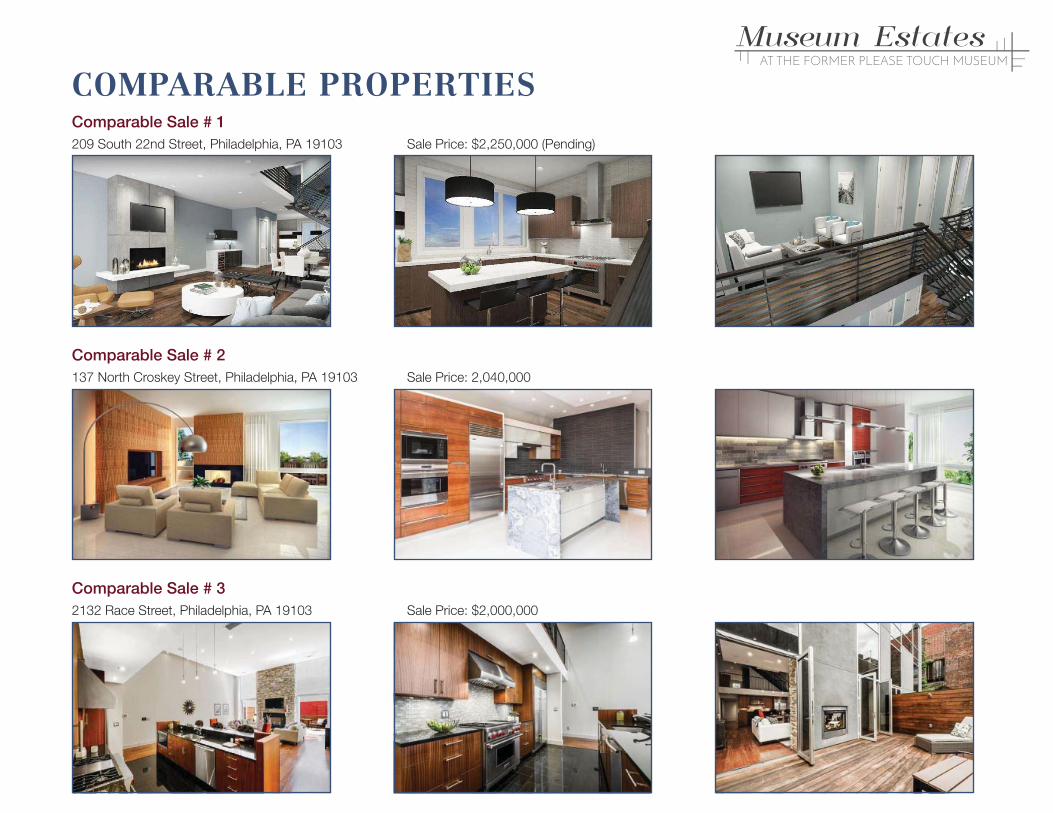
Comparable Sale # 1209 South 22nd Street, Philadelphia, PA 19103 Sale Price: $2,250,000 (Pending)
Comparable Sale # 32132 Race Street, Philadelphia, PA 19103 Sale Price: $2,000,000
COMPARABLE PROPERTIES
Comparable Sale # 2137 North Croskey Street, Philadelphia, PA 19103 Sale Price: 2,040,000

5 TheMarket
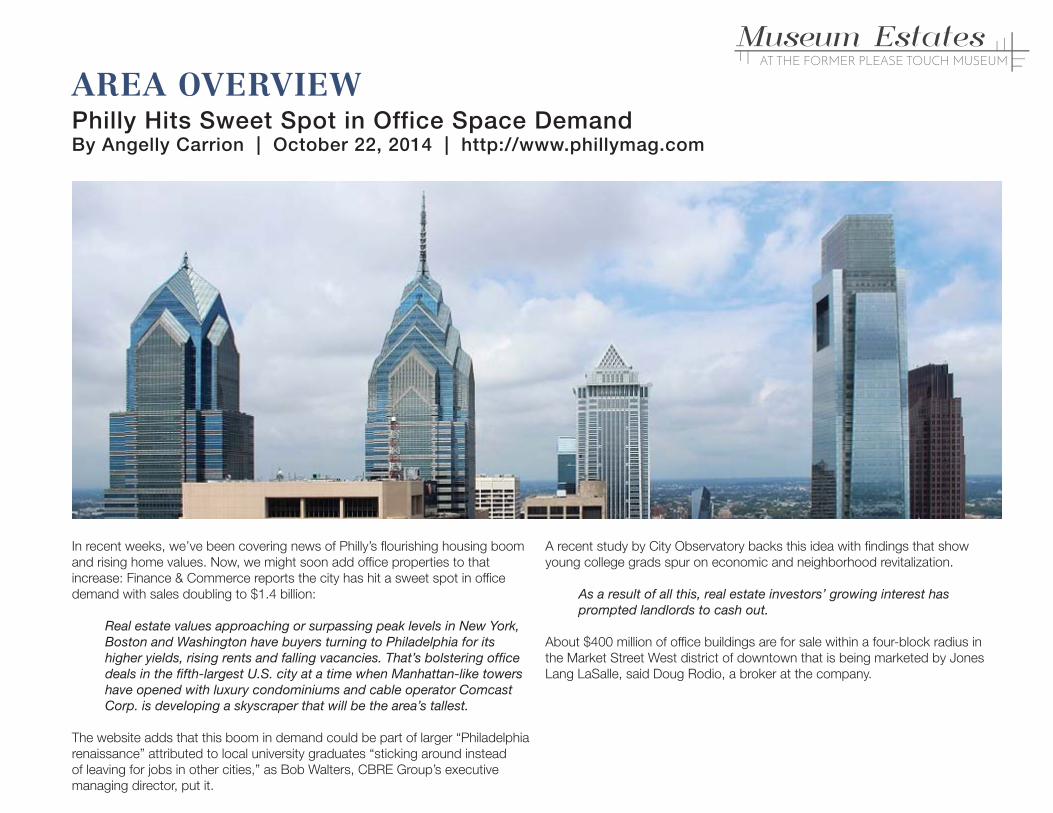
In recent weeks, we’ve been covering news of Philly’s fl ourishing housing boom
and rising home values. Now, we might soon add offi ce properties to that
increase: Finance & Commerce reports the city has hit a sweet spot in offi ce
demand with sales doubling to $1.4 billion:
Real estate values approaching or surpassing peak levels in New York, Boston and Washington have buyers turning to Philadelphia for itshigher yields, rising rents and falling vacancies. That’s bolstering offi ce deals in the fi fth-largest U.S. city at a time when Manhattan-like towers have opened with luxury condominiums and cable operator Comcast Corp. is developing a skyscraper that will be the area’s tallest.
The website adds that this boom in demand could be part of larger “Philadelphia
renaissance” attributed to local university graduates “sticking around instead
of leaving for jobs in other cities,” as Bob Walters, CBRE Group’s executive
managing director, put it.
A recent study by City Observatory backs this idea with fi ndings that show
young college grads spur on economic and neighborhood revitalization.
As a result of all this, real estate investors’ growing interest hasprompted landlords to cash out.
About $400 million of offi ce buildings are for sale within a four-block radius in
the Market Street West district of downtown that is being marketed by Jones
Lang LaSalle, said Doug Rodio, a broker at the company.
AREA OVERVIEWPhilly Hits Sweet Spot in Office Space DemandBy Angelly Carrion | October 22, 2014 | http://www.phillymag.com
AREA OVERVIEWOil, natural gas surge makes Philadelphia the new energy hotspotTom DiChristopher | Javier E. David | November 16, 2014 | http://www.cnbc.com
The city best known for Rocky, cheese steaks and sharp-elbowed sports fans
is developing a new reputation as a nexus of oil and gas transportation, which
bodes well for its economy.
With little fanfare, Philadelphia is undergoing a revolution powered by the U.S.
energy renaissance. Renewed investment and activity in the region’s sprawling
railway network and aging infrastructure is turning the City of Brotherly Love into
a potential energy hub that some believe can rival Houston.
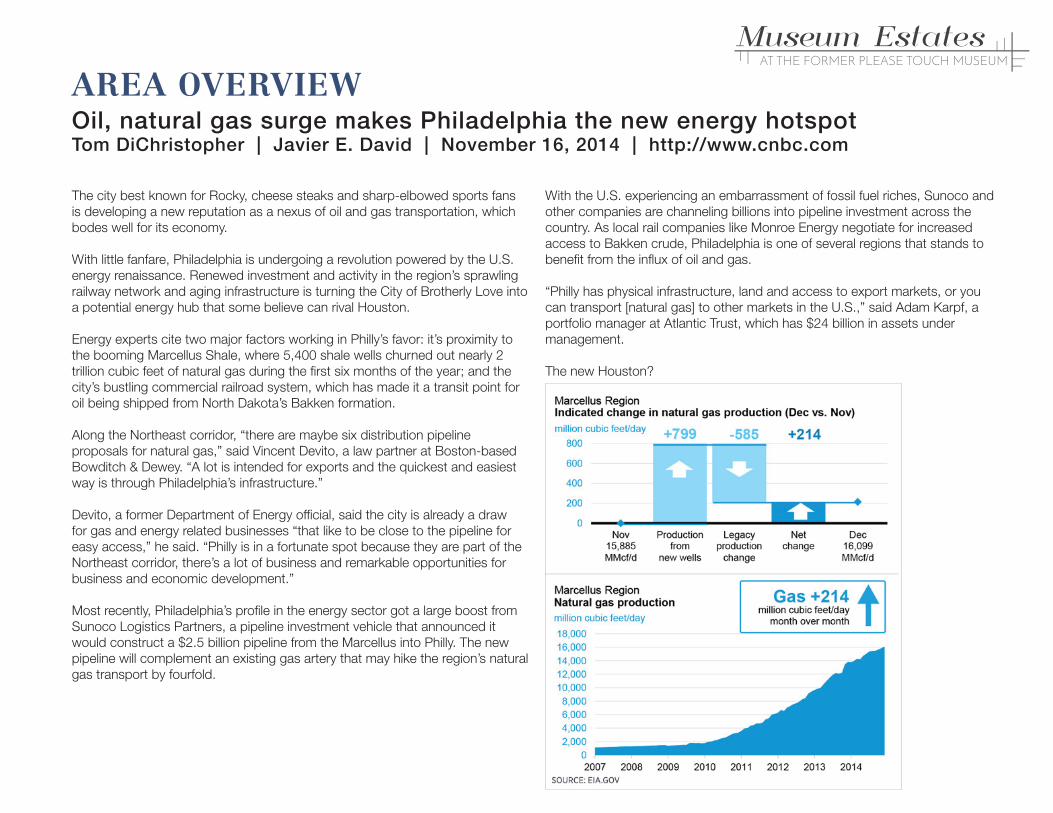
Energy experts cite two major factors working in Philly’s favor: it’s proximity to
the booming Marcellus Shale, where 5,400 shale wells churned out nearly 2
trillion cubic feet of natural gas during the fi rst six months of the year; and the
city’s bustling commercial railroad system, which has made it a transit point for
oil being shipped from North Dakota’s Bakken formation.
Along the Northeast corridor, “there are maybe six distribution pipeline
proposals for natural gas,” said Vincent Devito, a law partner at Boston-based
Bowditch & Dewey. “A lot is intended for exports and the quickest and easiest
way is through Philadelphia’s infrastructure.”
Devito, a former Department of Energy offi cial, said the city is already a draw
for gas and energy related businesses “that like to be close to the pipeline for
easy access,” he said. “Philly is in a fortunate spot because they are part of the
Northeast corridor, there’s a lot of business and remarkable opportunities for
business and economic development.”
Most recently, Philadelphia’s profi le in the energy sector got a large boost from
Sunoco Logistics Partners, a pipeline investment vehicle that announced it
would construct a $2.5 billion pipeline from the Marcellus into Philly. The new
pipeline will complement an existing gas artery that may hike the region’s natural
gas transport by fourfold.
With the U.S. experiencing an embarrassment of fossil fuel riches, Sunoco and
other companies are channeling billions into pipeline investment across the
country. As local rail companies like Monroe Energy negotiate for increased
access to Bakken crude, Philadelphia is one of several regions that stands to
benefi t from the infl ux of oil and gas.
“Philly has physical infrastructure, land and access to export markets, or you
can transport [natural gas] to other markets in the U.S.,” said Adam Karpf, a
portfolio manager at Atlantic Trust, which has $24 billion in assets under
management.
The new Houston?
AREA OVERVIEWOil, natural gas surge makes Philadelphia the new energy hotspotTom DiChristopher | Javier E. David | November 16, 2014 | http://www.cnbc.com
Once it’s up and running, Sunoco Limited’s pipeline will funnel nearly 300,000
barrels per day of natural gas liquids (NGL) to Philadelphia’s Marcus Hook
Industrial Complex.
The city is not what most would normally consider an energy hub. Traditionally,
oil and gas production has taken place in locations further south, like Houston
and New Orleans.
However, the U.S. energy boom has upended many of those assumptions,
transforming unlikely cities into hubs of fossil fuel production. Combined with
a set of refi neries that are being retrofi tted for natgas purposes, Philadelphia
could eventually rival energy powerhouses in Texas and Louisiana, some energy
watchers say.
“Houston is not as close to the demand centers as Philadelphia is. The East
Coast is an amazing engine of demand,” said Michael Krancer, chair of the
energy industry practice at Blank Rome law fi rm.
The city’s 8.4 percent unemployment rate is well above the national average,
and even above Pennsylvania’s. Many of the cities and states that are ground
zero for shale production have seen jobless rates plummet. For that reason,
energy watchers are reasonably optimistic that Philly can see some of the same
magic other oil and gas producing regions have experienced through the shale
boom.
Energy development in the region can help stem a brain drain of educated
professionals out of the area, Krancer added.
“The potential is even greater than Houston,” he said. “The parts of the state
that are benefi ting the most from this are the parts of the state that have been
economically challenged for a generation or two.”
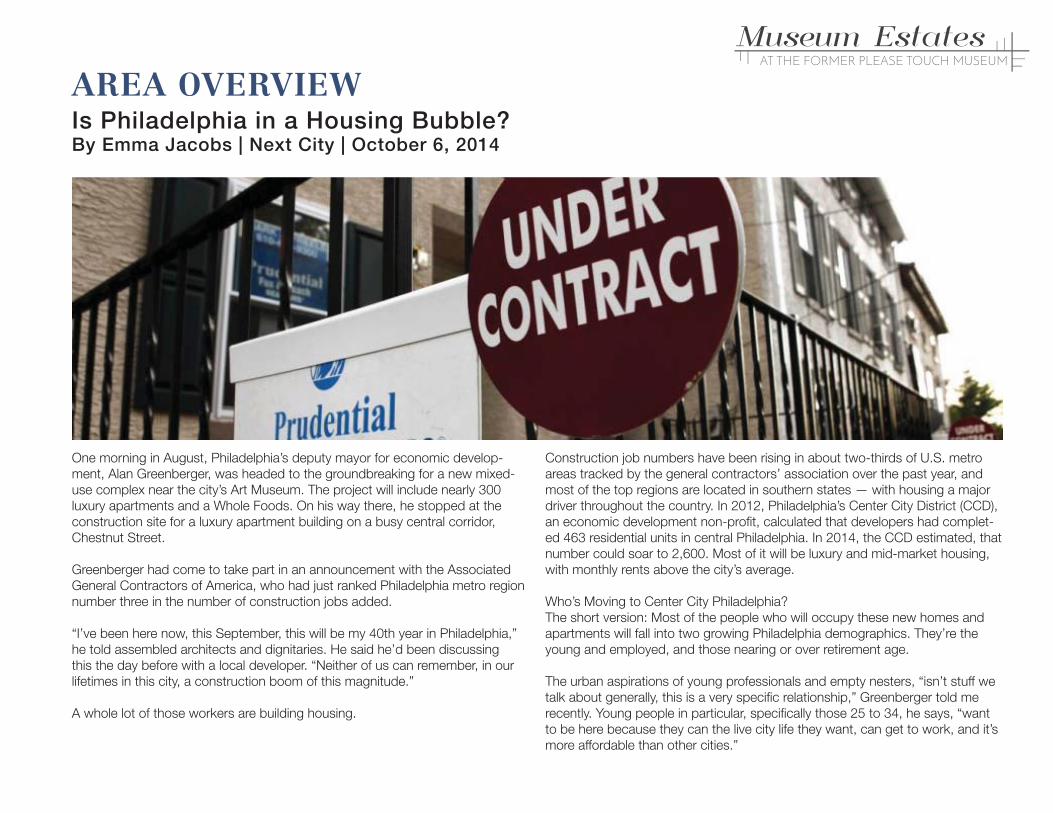
One morning in August, Philadelphia’s deputy mayor for economic develop-
ment, Alan Greenberger, was headed to the groundbreaking for a new mixed-
use complex near the city’s Art Museum. The project will include nearly 300
luxury apartments and a Whole Foods. On his way there, he stopped at the
construction site for a luxury apartment building on a busy central corridor,
Chestnut Street.
Greenberger had come to take part in an announcement with the Associated
General Contractors of America, who had just ranked Philadelphia metro region
number three in the number of construction jobs added.
“I’ve been here now, this September, this will be my 40th year in Philadelphia,”
he told assembled architects and dignitaries. He said he’d been discussing
this the day before with a local developer. “Neither of us can remember, in our
lifetimes in this city, a construction boom of this magnitude.”
A whole lot of those workers are building housing.
Construction job numbers have been rising in about two-thirds of U.S. metro
areas tracked by the general contractors’ association over the past year, and
most of the top regions are located in southern states — with housing a major
driver throughout the country. In 2012, Philadelphia’s Center City District (CCD),
an economic development non-profi t, calculated that developers had complet-
ed 463 residential units in central Philadelphia. In 2014, the CCD estimated, that
number could soar to 2,600. Most of it will be luxury and mid-market housing,
with monthly rents above the city’s average.
Who’s Moving to Center City Philadelphia?
The short version: Most of the people who will occupy these new homes and
apartments will fall into two growing Philadelphia demographics. They’re the
young and employed, and those nearing or over retirement age.
The urban aspirations of young professionals and empty nesters, “isn’t stuff we
talk about generally, this is a very specifi c relationship,” Greenberger told me
recently. Young people in particular, specifi cally those 25 to 34, he says, “want
to be here because they can the live city life they want, can get to work, and it’s
more affordable than other cities.”
AREA OVERVIEWIs Philadelphia in a Housing Bubble?By Emma Jacobs | Next City | October 6, 2014
AREA OVERVIEWIs Philadelphia in a Housing Bubble?By Emma Jacobs | Next City | October 6, 2014
An upscale housing market driven by millennials may sound counterintuitive.
After all, headlines about the generation’s struggles abound. However, Steve
Mullin says that in a metro region with six million residents, it doesn’t take too
many people changing their behavior to result in market shifts. That is to say,
the suburbs don’t have to empty out for the city to require new housing. Mullin,
president of Econsult Solutions, adds that “for 50 years, Philadelphia basically
had no new, quality housing.”
Normally, he says, people move into more expensive housing as their income
improves, freeing up better housing to the next income level until structures in
the worst condition get demolished, and he didn’t see that happening in
Philadelphia, for years.
“What’s going on in Center City is causing it to expand outward,” says Victor
Pinckney, vice president of the Homeowners Association of Philadelphia.
He’s focused on rehabbing homes in Philadelphia neighborhoods north and
northwest of Center City.
Banks are lending again, he says. “Two years ago, three, I tried to do a
refi nance and it wasn’t going nowhere. A year and a half later they were
trying to throw money at me. Nothing had changed on my end.”
Will the Market Break?Mullin thinks Philadelphians are natural pessimists about their long-suffering
economy. “It’s a very Philadelphia thing to say, ‘how can we support two water
ice stands?’”
Greenberger notes there’s some natural anxiety that comes with a construction
boom.
“Boom cycles end,” he acknowledges, but “do they just sort of retreat back
to some sort of manageable level or do they bust?” In this case, he thinks the
strength of the city’s other sectors make it unlikely the fl oor would fall out of the
housing market.
Brad Doremus of realty data tracking fi rm Reis says the metro’s vacancy rate fell
from 4.4 percent at the close of 2011 to 3.3 percent as of mid-2014, and the
market seems ready to absorb new units through the end of the year.
“Past 2014, new construction is projected to outpace net absorption on an
annual basis for a few years,” he added, but, “this is not a big worry — the
market’s long-term average vacancy (since 1980) is around 4.6 percent so it
isn’t a surprise that it would begin slowly moving up again.”
When the CCD presented its fi gures in March, President Paul Levy identifi ed
two potential market constraints: the Philadelphia school district’s funding crisis
and the pace of job growth.
“To the extent that … people are unsure about schools in every neighborhood,
that’s going to limit people’s willingness to stay or buy homes within the city,” he
says.
In an update two weeks ago, he told me, “Every indicator we have seen, as well
as discussions with lenders and developers, suggests that the demand remains
strong for the new units that are coming on line.”
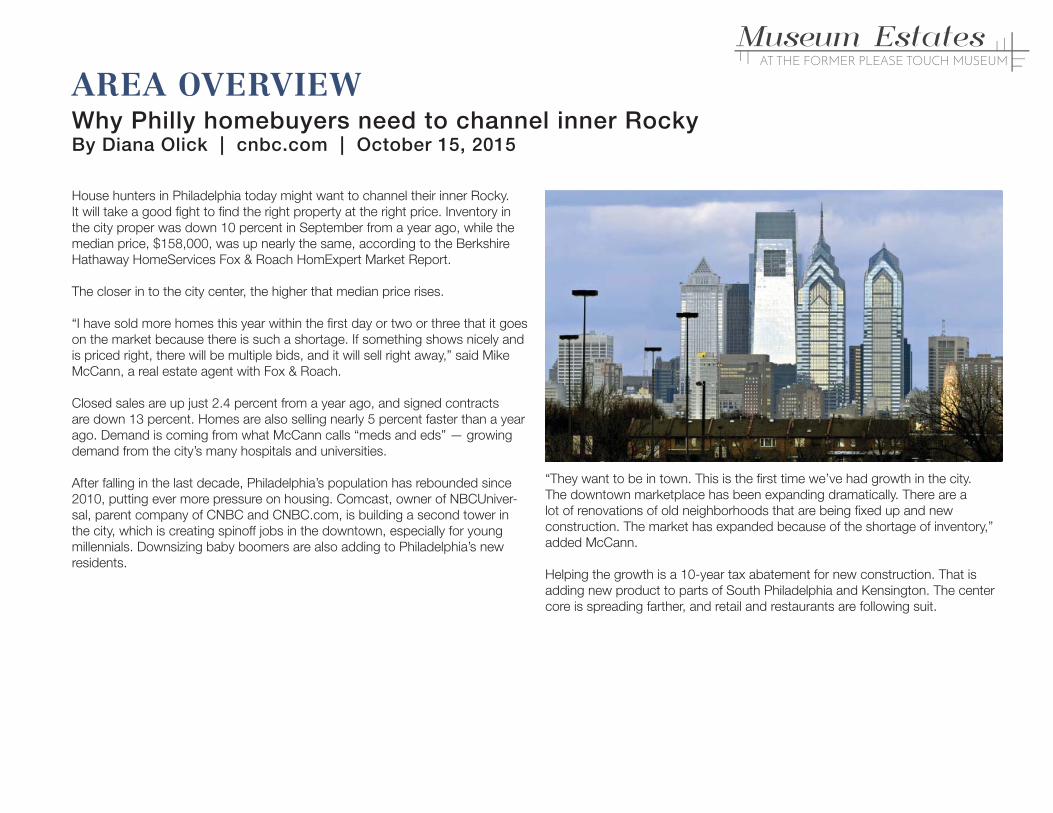
House hunters in Philadelphia today might want to channel their inner Rocky.
It will take a good fi ght to fi nd the right property at the right price. Inventory in
the city proper was down 10 percent in September from a year ago, while the
median price, $158,000, was up nearly the same, according to the Berkshire
Hathaway HomeServices Fox & Roach HomExpert Market Report.
The closer in to the city center, the higher that median price rises.
“I have sold more homes this year within the fi rst day or two or three that it goes
on the market because there is such a shortage. If something shows nicely and
is priced right, there will be multiple bids, and it will sell right away,” said Mike
McCann, a real estate agent with Fox & Roach.
Closed sales are up just 2.4 percent from a year ago, and signed contracts
are down 13 percent. Homes are also selling nearly 5 percent faster than a year
ago. Demand is coming from what McCann calls “meds and eds” — growing
demand from the city’s many hospitals and universities.
After falling in the last decade, Philadelphia’s population has rebounded since
2010, putting ever more pressure on housing. Comcast, owner of NBCUniver-
sal, parent company of CNBC and CNBC.com, is building a second tower in
the city, which is creating spinoff jobs in the downtown, especially for young
millennials. Downsizing baby boomers are also adding to Philadelphia’s new
residents.
“They want to be in town. This is the fi rst time we’ve had growth in the city.
The downtown marketplace has been expanding dramatically. There are a
lot of renovations of old neighborhoods that are being fi xed up and new
construction. The market has expanded because of the shortage of inventory,”
added McCann.
Helping the growth is a 10-year tax abatement for new construction. That is
adding new product to parts of South Philadelphia and Kensington. The center
core is spreading farther, and retail and restaurants are following suit.
AREA OVERVIEWWhy Philly homebuyers need to channel inner RockyBy Diana Olick | cnbc.com | October 15, 2015
AREA OVERVIEWRenters Struggle to Find Available UnitsBy Robert Greenberg | B2R Finance
As the country gains more renters, the demand for affordable rentals is
outstripping supply.
Real estate investors who are able to provide affordable rental housing should
have no problem fi nding tenants in many of the country’s major metropolitan
areas, according to a joint research project about renting from New York
University’s Furman Center and Capital One, which indicated the need for
affordable rentals is growing.
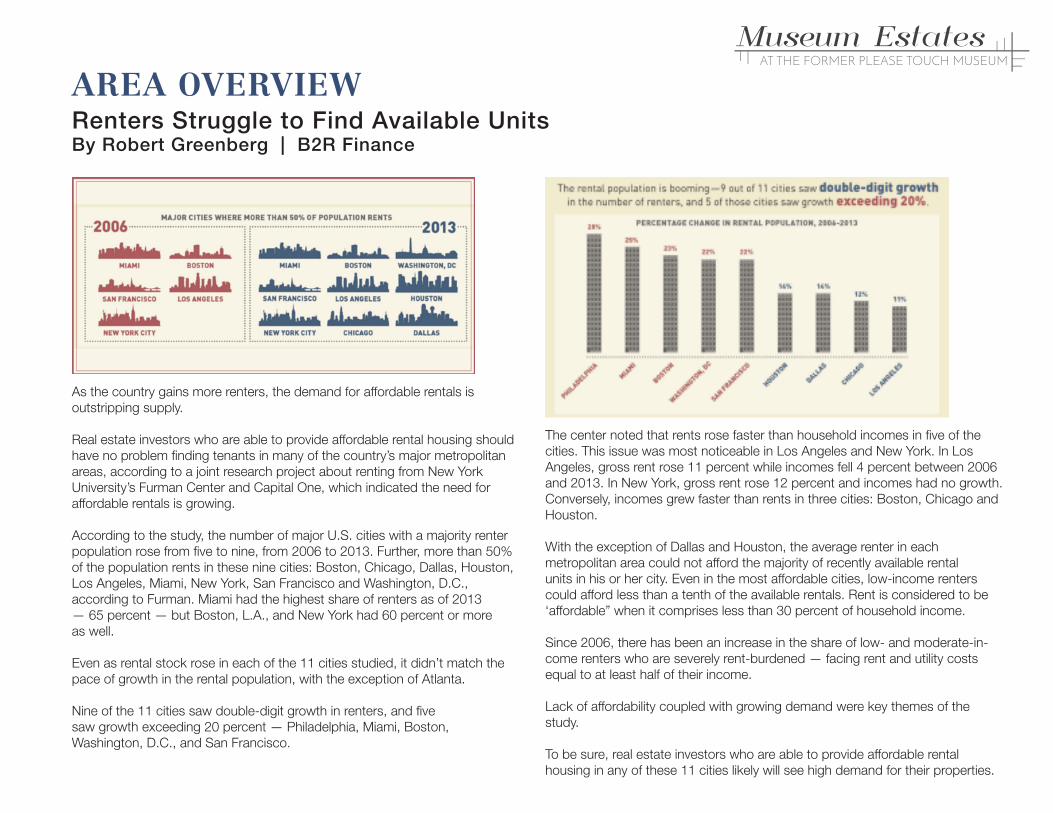
According to the study, the number of major U.S. cities with a majority renter
population rose from fi ve to nine, from 2006 to 2013. Further, more than 50%
of the population rents in these nine cities: Boston, Chicago, Dallas, Houston,
Los Angeles, Miami, New York, San Francisco and Washington, D.C.,
according to Furman. Miami had the highest share of renters as of 2013
— 65 percent — but Boston, L.A., and New York had 60 percent or more
as well.
Even as rental stock rose in each of the 11 cities studied, it didn’t match the
pace of growth in the rental population, with the exception of Atlanta.
Nine of the 11 cities saw double-digit growth in renters, and fi ve
saw growth exceeding 20 percent — Philadelphia, Miami, Boston,
Washington, D.C., and San Francisco.
The center noted that rents rose faster than household incomes in fi ve of the
cities. This issue was most noticeable in Los Angeles and New York. In Los
Angeles, gross rent rose 11 percent while incomes fell 4 percent between 2006
and 2013. In New York, gross rent rose 12 percent and incomes had no growth.
Conversely, incomes grew faster than rents in three cities: Boston, Chicago and
Houston.
With the exception of Dallas and Houston, the average renter in each
metropolitan area could not afford the majority of recently available rental
units in his or her city. Even in the most affordable cities, low-income renters
could afford less than a tenth of the available rentals. Rent is considered to be
‘affordable” when it comprises less than 30 percent of household income.
Since 2006, there has been an increase in the share of low- and moderate-in-
come renters who are severely rent-burdened — facing rent and utility costs
equal to at least half of their income.
Lack of affordability coupled with growing demand were key themes of the
study.
To be sure, real estate investors who are able to provide affordable rental
housing in any of these 11 cities likely will see high demand for their properties.
For more than half a century, suburban growth surpassed growth in cities — in
both population and job growth — but that is changing.
We’ve heard for several years now that the Millennial Generation prefers to live
in city centers and close to their place of employment. Now we are beginning to
hear about jobs moving back into city centers from suburban environments.
For the real estate investor, this trend could open up opportunities for a robust
return on investment in housing located close to the urban core in cities around
the nation.
The country’s largest metropolitan areas are recording faster job growth
downtown — in the city core — than areas located further from the city
center, according to research by the think tank City Observatory, which
analyzed census data.
City Observatory looked at what occurred between 2007 to 2011 and
compared urban cores to their peripheral areas. It defi nes a city center as
the area within 3 miles of the center of each region’s central business district.
In city centers, jobs grew at a 0.5 percent annual rate, but in the surrounding
peripheral portion of metropolitan areas jobs declined 0.1 percent per year. City
centers out-performed the surrounding areas for job growth in 21 of the 41
metropolitan areas examined.
As recently as 2002-2007, peripheral areas were growing much faster
(1.2 percent annually) and aggregate job growth was stagnant in urban
cores (0.1 percent).
The strength of city centers appears to be driven by a combination of the
growing attractiveness of urban living, and the relatively stronger performance of
urban-centered industries (business and professional services, software) relative
to decentralized industries (construction, manufacturing) in this economic cycle.
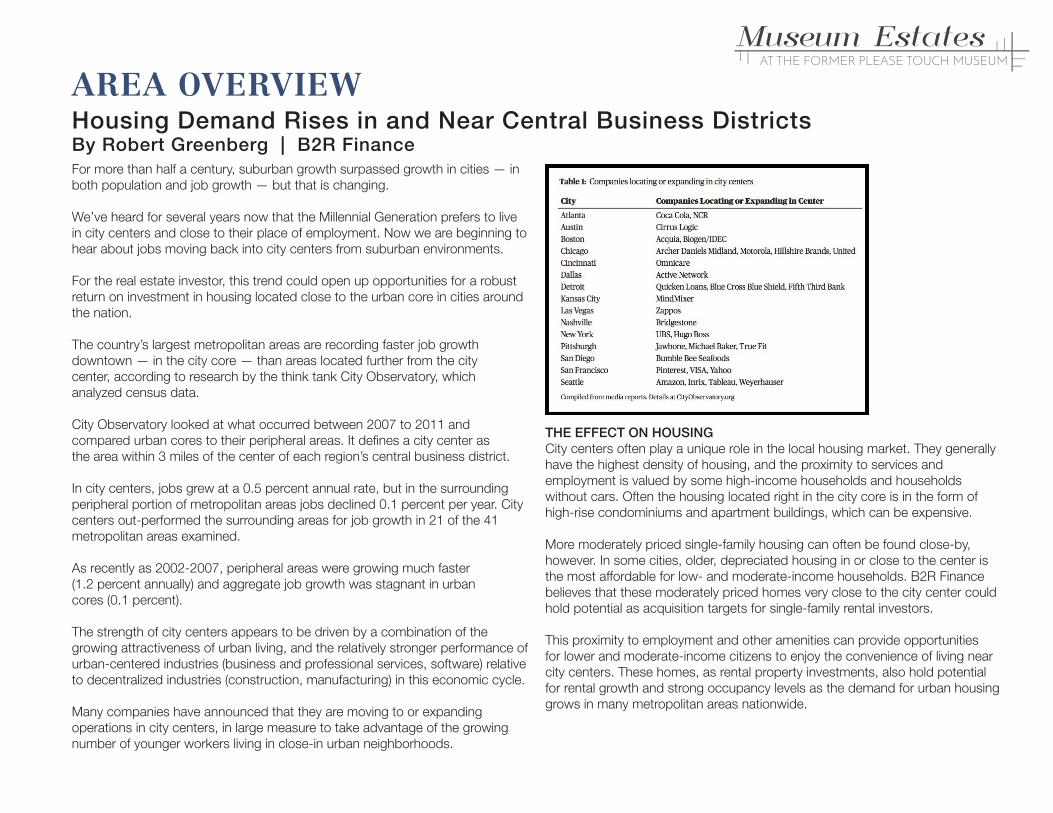
Many companies have announced that they are moving to or expanding
operations in city centers, in large measure to take advantage of the growing
number of younger workers living in close-in urban neighborhoods.
THE EFFECT ON HOUSINGCity centers often play a unique role in the local housing market. They generally
have the highest density of housing, and the proximity to services and
employment is valued by some high-income households and households
without cars. Often the housing located right in the city core is in the form of
high-rise condominiums and apartment buildings, which can be expensive.
More moderately priced single-family housing can often be found close-by,
however. In some cities, older, depreciated housing in or close to the center is
the most affordable for low- and moderate-income households. B2R Finance
believes that these moderately priced homes very close to the city center could
hold potential as acquisition targets for single-family rental investors.
This proximity to employment and other amenities can provide opportunities
for lower and moderate-income citizens to enjoy the convenience of living near
city centers. These homes, as rental property investments, also hold potential
for rental growth and strong occupancy levels as the demand for urban housing
grows in many metropolitan areas nationwide.
AREA OVERVIEWHousing Demand Rises in and Near Central Business DistrictsBy Robert Greenberg | B2R Finance
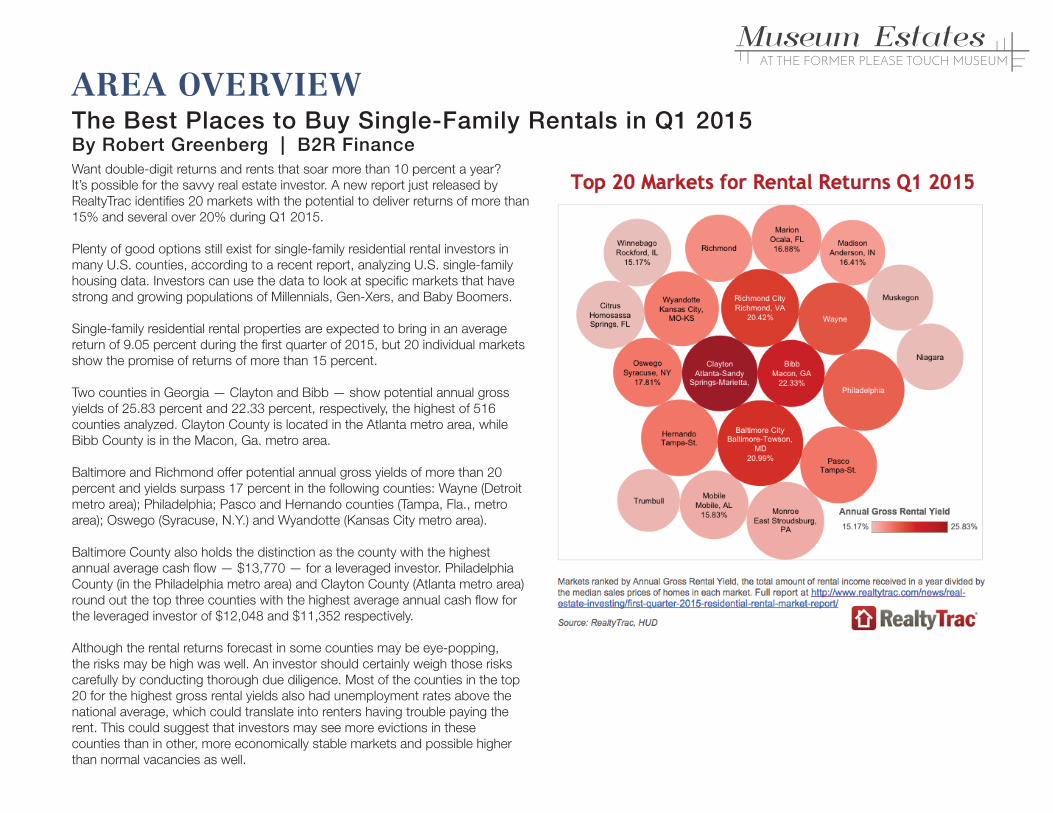
Want double-digit returns and rents that soar more than 10 percent a year?
It’s possible for the savvy real estate investor. A new report just released by
RealtyTrac identifi es 20 markets with the potential to deliver returns of more than
15% and several over 20% during Q1 2015.
Plenty of good options still exist for single-family residential rental investors in
many U.S. counties, according to a recent report, analyzing U.S. single-family
housing data. Investors can use the data to look at specifi c markets that have
strong and growing populations of Millennials, Gen-Xers, and Baby Boomers.
Single-family residential rental properties are expected to bring in an average
return of 9.05 percent during the fi rst quarter of 2015, but 20 individual markets
show the promise of returns of more than 15 percent.
Two counties in Georgia — Clayton and Bibb — show potential annual gross
yields of 25.83 percent and 22.33 percent, respectively, the highest of 516
counties analyzed. Clayton County is located in the Atlanta metro area, while
Bibb County is in the Macon, Ga. metro area.
Baltimore and Richmond offer potential annual gross yields of more than 20
percent and yields surpass 17 percent in the following counties: Wayne (Detroit
metro area); Philadelphia; Pasco and Hernando counties (Tampa, Fla., metro
area); Oswego (Syracuse, N.Y.) and Wyandotte (Kansas City metro area).
Baltimore County also holds the distinction as the county with the highest
annual average cash fl ow — $13,770 — for a leveraged investor. Philadelphia
County (in the Philadelphia metro area) and Clayton County (Atlanta metro area)
round out the top three counties with the highest average annual cash fl ow for
the leveraged investor of $12,048 and $11,352 respectively.
Although the rental returns forecast in some counties may be eye-popping,
the risks may be high was well. An investor should certainly weigh those risks
carefully by conducting thorough due diligence. Most of the counties in the top
20 for the highest gross rental yields also had unemployment rates above the
national average, which could translate into renters having trouble paying the
rent. This could suggest that investors may see more evictions in these
counties than in other, more economically stable markets and possible higher
than normal vacancies as well.
AREA OVERVIEWThe Best Places to Buy Single-Family Rentals in Q1 2015By Robert Greenberg | B2R Finance
Photo credit: Flickr user Jeanette Runyon.In a contributing article to Next City, Emma Jacobs reports that Philadelphia
could be in the midst of an unprecedented housing boom. The growth spurt is
evident throughout the city, which was ranked in third place by the Associated
General Contractors of America in a list of metro regions who saw a rise in
construction jobs.
“Neither of us can remember, in our lifetimes in this city, a construction boom
of this magnitude,” said deputy mayor of economic development Alan
Greenberger during the announcement.
According to Jacobs, the Center City District estimated that in 2012, developers
had constructed 463 residential units in the area. The CCD now predicts
developers could build up to 2,600 residential units, most of which would be
luxury and mid-market housing, this year. Victory Pinckney of the Homeowners
Association of Philadelphia added that “what’s going on in Center City is
causing it to expand outward.”
But how long could this housing bubble last? Here’s more from Next City:
[Steve] Mullin [of Econsult Solutions] thinks Philadelphians are
natural pessimists about their long-suffering economy. “It’s a
very Philadelphia thing to say, ‘how can we support two water
ice stands?’”
“Boom cycles end,” he acknowledges, but “do they just sort of
retreat back to some sort of manageable level or do they bust?”
In this case, he thinks the strength of the city’s other sectors make
it unlikely the fl oor would fall out of the housing market.
Jacobs writes that realty tracking fi rm Reis says “[e]very indicator we have seen,
as well as discussions with lenders and developers, suggests that the demand
remains strong for the new units that are coming on line.”
AREA OVERVIEWPhilly Housing is Having a Growth SpurtBy Angelly Carrion | October 27, 2014 | http://www.phillymag.com
6 InvestmentRequirement
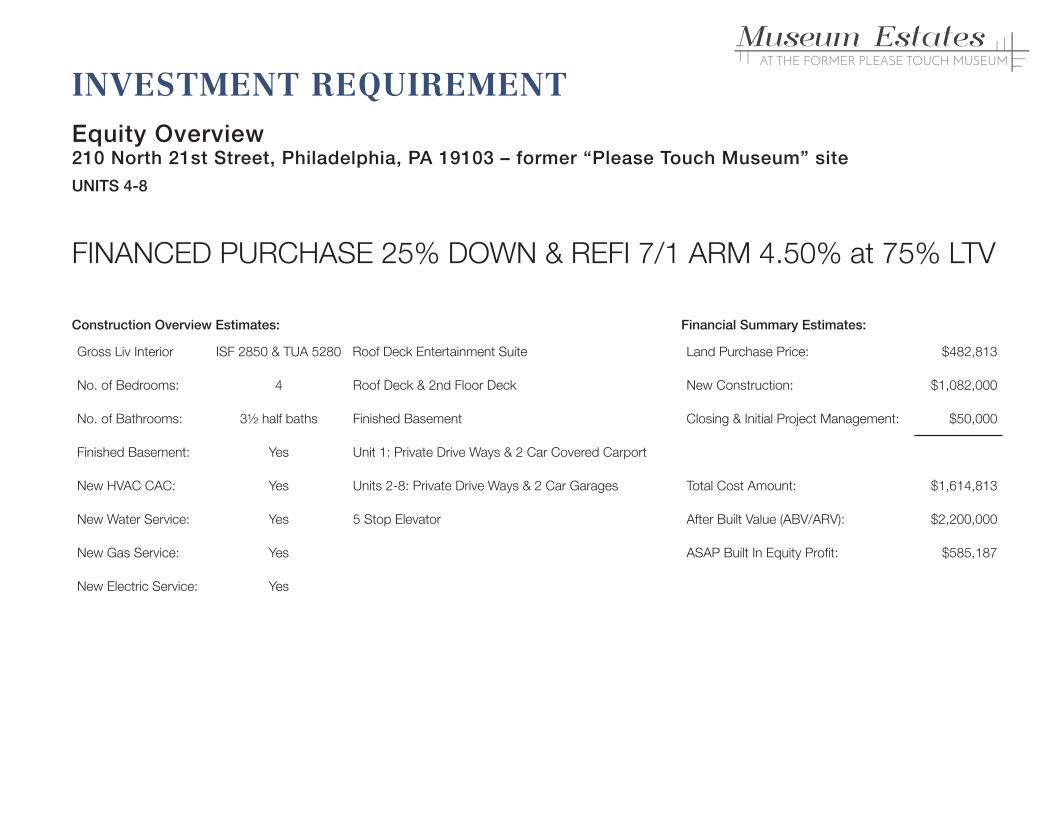
FINANCED PURCHASE 25% DOWN & REFI 7/1 ARM 4.50% at 75% LTV
INVESTMENT REQUIREMENTEquity Overview210 North 21st Street, Philadelphia, PA 19103 – former “Please Touch Museum” siteUNITS 4-8
Construction Overview Estimates:
Gross Liv Interior ISF 2850 & TUA 5280 Roof Deck Entertainment Suite
No. of Bedrooms: 4 Roof Deck & 2nd Floor Deck
No. of Bathrooms: 3½ half baths Finished Basement
Finished Basement: Yes Unit 1: Private Drive Ways & 2 Car Covered Carport
New HVAC CAC: Yes Units 2-8: Private Drive Ways & 2 Car Garages
New Water Service: Yes 5 Stop Elevator
New Gas Service: Yes
New Electric Service: Yes
Financial Summary Estimates:
Land Purchase Price: $482,813
New Construction: $1,082,000
Closing & Initial Project Management: $50,000
Total Cost Amount: $1,614,813
After Built Value (ABV/ARV): $2,200,000
ASAP Built In Equity Profi t: $585,187
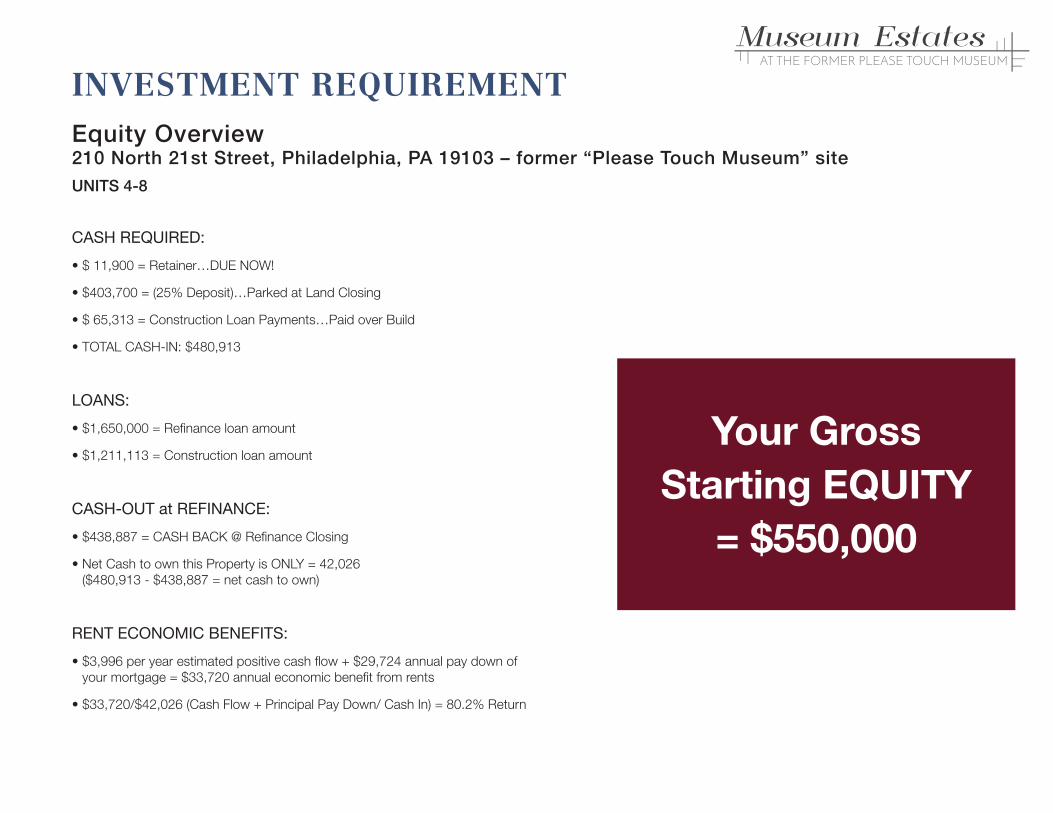
CASH REQUIRED:
• $ 11,900 = Retainer…DUE NOW!
• $403,700 = (25% Deposit)…Parked at Land Closing
• $ 65,313 = Construction Loan Payments…Paid over Build
• TOTAL CASH-IN: $480,913
LOANS:
• $1,650,000 = Refi nance loan amount
• $1,211,113 = Construction loan amount
CASH-OUT at REFINANCE:
• $438,887 = CASH BACK @ Refi nance Closing
• Net Cash to own this Property is ONLY = 42,026
($480,913 - $438,887 = net cash to own)
RENT ECONOMIC BENEFITS:
• $3,996 per year estimated positive cash fl ow + $29,724 annual pay down of
your mortgage = $33,720 annual economic benefi t from rents
• $33,720/$42,026 (Cash Flow + Principal Pay Down/ Cash In) = 80.2% Return
Your Gross
Starting EQUITY
= $550,000
INVESTMENT REQUIREMENTEquity Overview210 North 21st Street, Philadelphia, PA 19103 – former “Please Touch Museum” siteUNITS 4-8
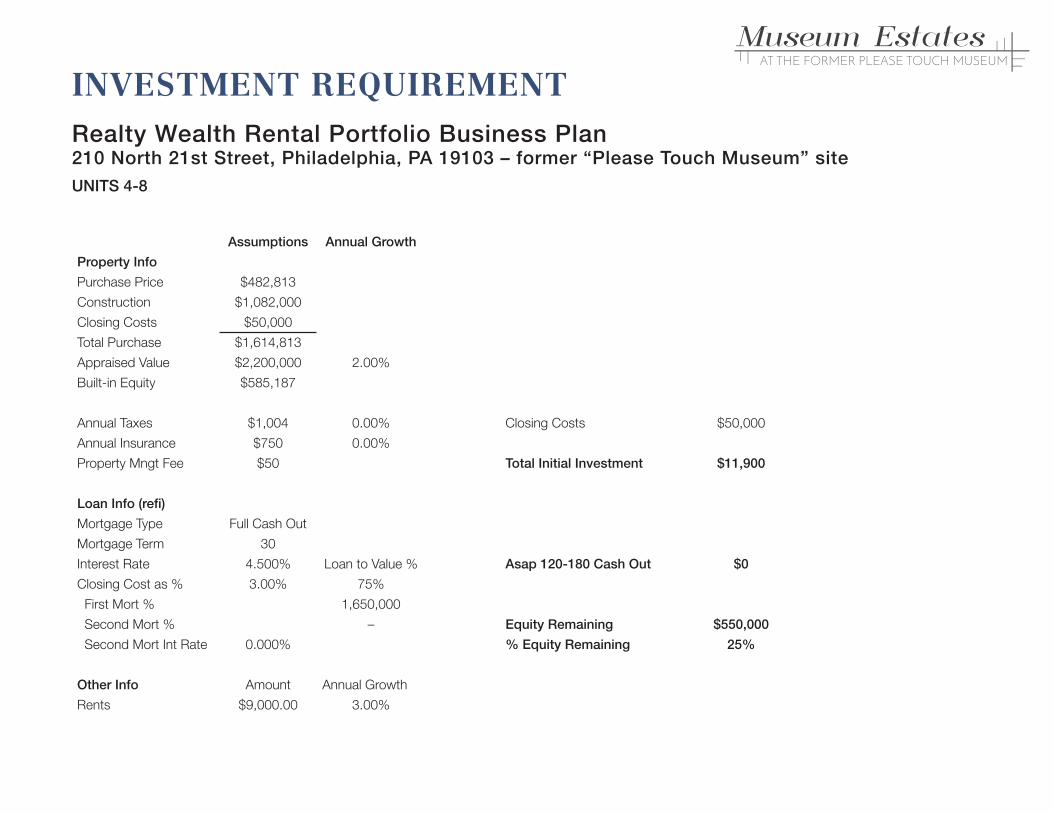
INVESTMENT REQUIREMENTRealty Wealth Rental Portfolio Business Plan210 North 21st Street, Philadelphia, PA 19103 – former “Please Touch Museum” siteUNITS 4-8
Assumptions Annual Growth
Property Info
Purchase Price $482,813
Construction $1,082,000
Closing Costs $50,000
Total Purchase $1,614,813
Appraised Value $2,200,000 2.00%
Built-in Equity $585,187
Annual Taxes $1,004 0.00% Closing Costs $50,000
Annual Insurance $750 0.00%
Property Mngt Fee $50 Total Initial Investment $11,900
Loan Info (refi )
Mortgage Type Full Cash Out
Mortgage Term 30
Interest Rate 4.500% Loan to Value % Asap 120-180 Cash Out $0
Closing Cost as % 3.00% 75%
First Mort % 1,650,000
Second Mort % – Equity Remaining $550,000
Second Mort Int Rate 0.000% % Equity Remaining 25%
Other Info Amount Annual Growth
Rents $9,000.00 3.00%
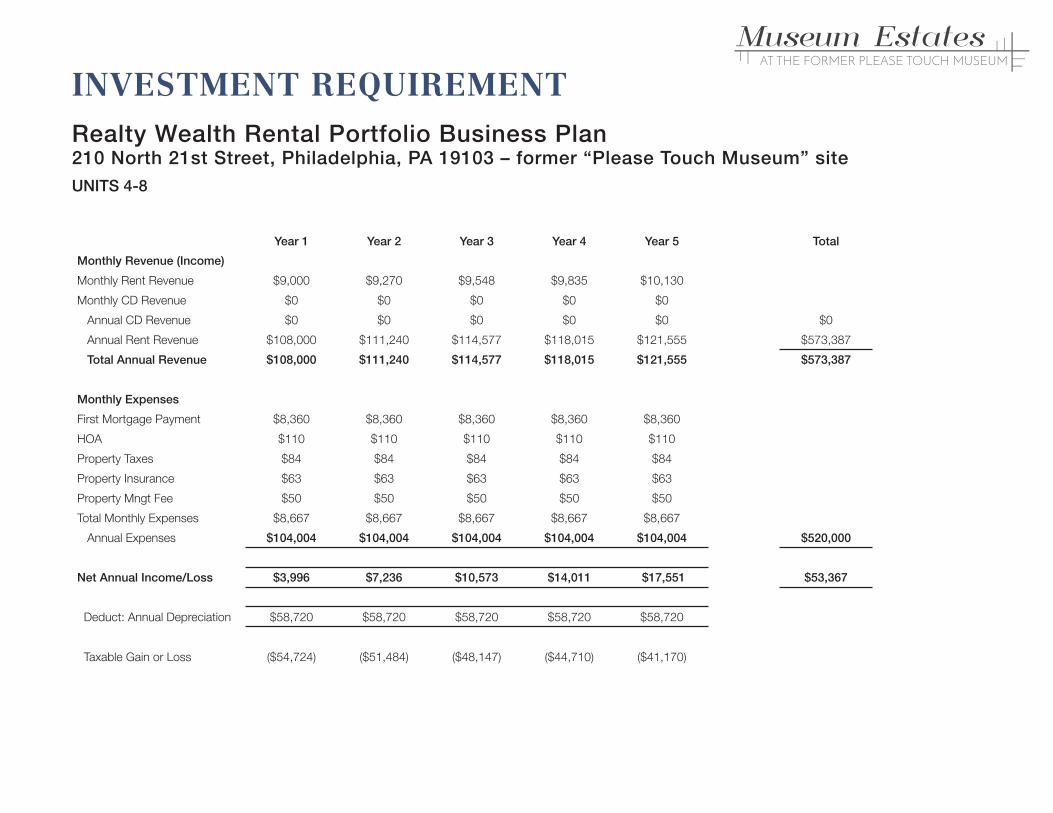
Year 1 Year 2 Year 3 Year 4 Year 5 Total
Monthly Revenue (Income)
Monthly Rent Revenue $9,000 $9,270 $9,548 $9,835 $10,130
Monthly CD Revenue $0 $0 $0 $0 $0
Annual CD Revenue $0 $0 $0 $0 $0 $0
Annual Rent Revenue $108,000 $111,240 $114,577 $118,015 $121,555 $573,387
Total Annual Revenue $108,000 $111,240 $114,577 $118,015 $121,555 $573,387
Monthly Expenses
First Mortgage Payment $8,360 $8,360 $8,360 $8,360 $8,360
HOA $110 $110 $110 $110 $110
Property Taxes $84 $84 $84 $84 $84
Property Insurance $63 $63 $63 $63 $63
Property Mngt Fee $50 $50 $50 $50 $50
Total Monthly Expenses $8,667 $8,667 $8,667 $8,667 $8,667
Annual Expenses $104,004 $104,004 $104,004 $104,004 $104,004 $520,000
Net Annual Income/Loss $3,996 $7,236 $10,573 $14,011 $17,551 $53,367
Deduct: Annual Depreciation $58,720 $58,720 $58,720 $58,720 $58,720
Taxable Gain or Loss ($54,724) ($51,484) ($48,147) ($44,710) ($41,170)
INVESTMENT REQUIREMENTRealty Wealth Rental Portfolio Business Plan210 North 21st Street, Philadelphia, PA 19103 – former “Please Touch Museum” siteUNITS 4-8
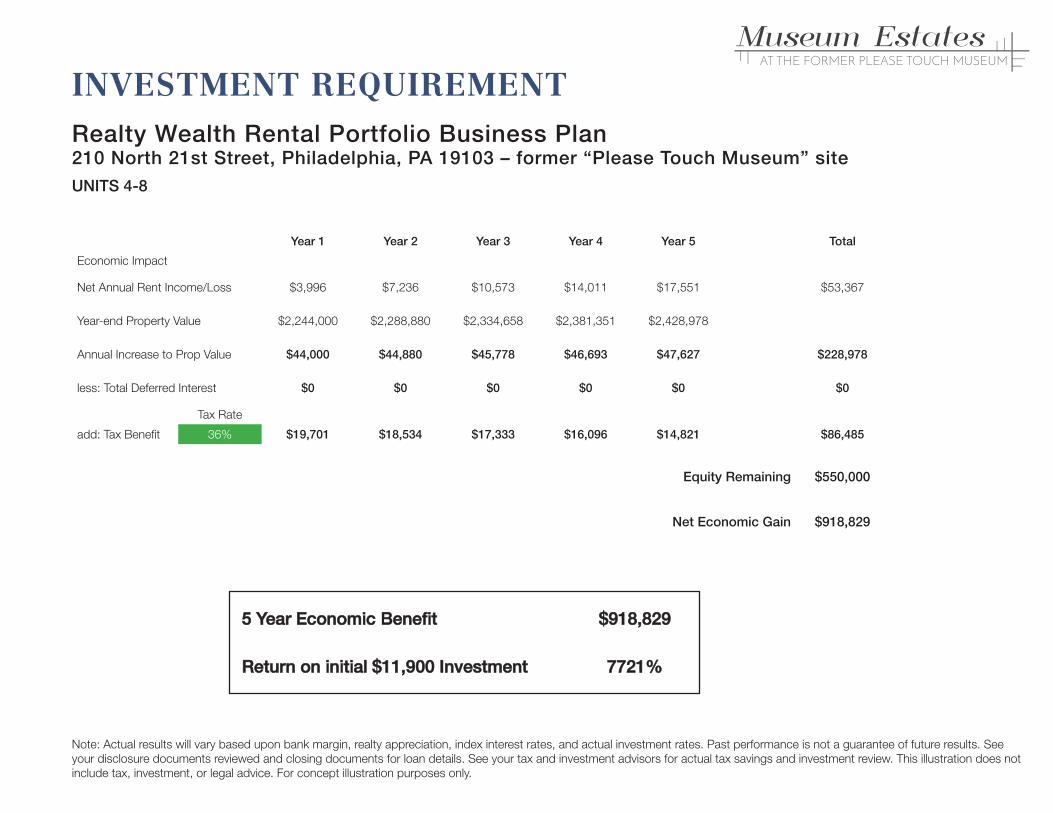
Year 1 Year 2 Year 3 Year 4 Year 5 Total
Economic Impact
Net Annual Rent Income/Loss $3,996 $7,236 $10,573 $14,011 $17,551 $53,367
Year-end Property Value $2,244,000 $2,288,880 $2,334,658 $2,381,351 $2,428,978
Annual Increase to Prop Value $44,000 $44,880 $45,778 $46,693 $47,627 $228,978
less: Total Deferred Interest $0 $0 $0 $0 $0 $0
Tax Rate
add: Tax Benefi t 36% $19,701 $18,534 $17,333 $16,096 $14,821 $86,485
Equity Remaining $550,000
Net Economic Gain $918,829
5 Year Economic Benefi t5 Year Economic Benefi t $918,829$918,829
Return on initial $11,900 InvestmentReturn on initial $11,900 Investment 7721%7721%
Note: Actual results will vary based upon bank margin, realty appreciation, index interest rates, and actual investment rates. Past performance is not a guarantee of future results. See
your disclosure documents reviewed and closing documents for loan details. See your tax and investment advisors for actual tax savings and investment review. This illustration does not
include tax, investment, or legal advice. For concept illustration purposes only.
INVESTMENT REQUIREMENTRealty Wealth Rental Portfolio Business Plan210 North 21st Street, Philadelphia, PA 19103 – former “Please Touch Museum” siteUNITS 4-8