greater toronto area high rise projects · diamond corp scarborough 11/9/2019 king's mill at...
TRANSCRIPT
Greater Toronto AreaHigh Rise Projects
New Homes Monthly Market Report
Data as of November 2019

DATA SOLUTIONSAltusAnalytics
GTA Overview

DATA SOLUTIONSAltusAnalytics
Sales & Remaining Inventory
2015 2016 2017 2018 2019January
February
MarchAprilMayJune July
August
Septemb..
October
November
December
January
February
MarchAprilMayJune July
August
Septemb..
October
November
December
January
February
MarchAprilMayJune July
August
Septemb..
October
November
December
January
February
MarchAprilMayJune July
August
Septemb..
October
November
December
January
February
MarchAprilMayJune July
August
Septemb..
October
November
December
0
1,000
2,000
3,000
4,000
5,000
Sales
1,156
3,564
GTA - Monthly New Home Sales
19,570
21,456
18,045
26,35534,408 21,153 25,057
7,417 3,743 9,032
2015 2016 2017 2018 2019
0
5,000
10,000
15,000
20,000
Rem. Inv.
5,143
14,396
GTA - Monthly New Home Remaining Inventory
High Rise
Low Rise
High Rise
Low Rise

DATA SOLUTIONSAltusAnalytics
2015 2016 2017 2018 2019 2020
$400,000
$500,000
$600,000
$700,000
$800,000
$900,000
$1,000,000
$1,100,000
$1,200,000
$1,300,000
NH Benchmark Price
$1,075,215
$866,827
Monthly New Home Benchmark Price (excludes extremes)
2015 2016 2017 2018 2019
$400,000
$600,000
$800,000
$1,000,000
$1,200,000
$1,400,000
$1,600,000
$1,800,000
$2,000,000
Avg. $
Monthly Avg. Asking Price by Product Type (includes all projects)
Pricing
Product TypeApartment
Detached
Semi Detached
Townhouse
Project TypeHigh Rise
Low Rise

DATA SOLUTIONSAltusAnalytics
2009 2010 2011 2012 2013 2014 2015 2016 2017 2018 2019 2020
0
5,000
10,000
15,000
20,000
25,000
30,000
35,000
Rem. Inv.
5,143
14,396
19,539
GTA - Monthly New Home Remaining Inventory
2015 2016 2017 2018 2019 2020
0
2,000
4,000
6,000
8,000
10,000
12,000
Rem. Inv.
230
3,689
10,477
GTA - Monthly High Rise Rem. Inv. by Construcon Status
Remaining Inventory
High Rise
Low Rise
Construcon StatusPre-Construcon
Under Construcon
Standing Inventory
DATA SOLUTIONSAltusAnalytics
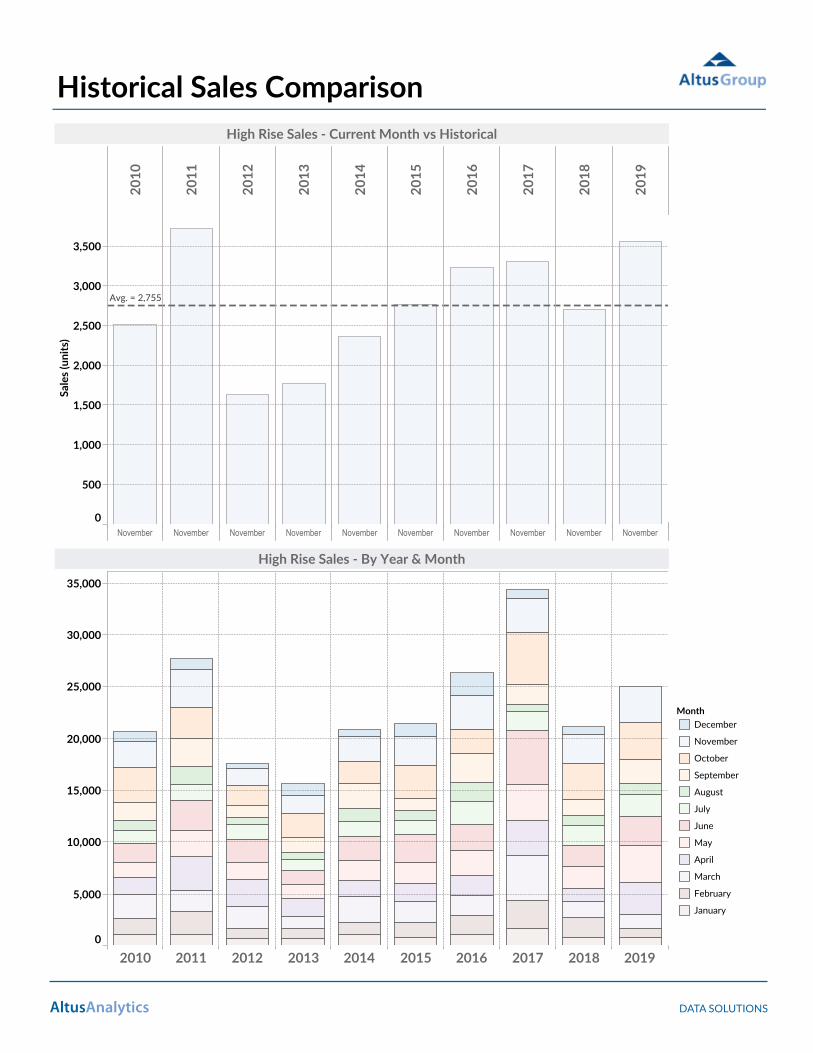
2010
2011
2012
2013
2014
2015
2016
2017
2018
2019
November November November November November November November November November November
0
500
1,000
1,500
2,000
2,500
3,000
3,500
Sales (units)
Avg. = 2,755Avg. = 2,755Avg. = 2,755Avg. = 2,755Avg. = 2,755Avg. = 2,755Avg. = 2,755Avg. = 2,755Avg. = 2,755Avg. = 2,755
High Rise Sales - Current Month vs Historical
2010 2011 2012 2013 2014 2015 2016 2017 2018 20190
5,000
10,000
15,000
20,000
25,000
30,000
35,000
High Rise Sales - By Year & Month
MonthDecember
November
October
September
August
July
June
May
April
March
February
January
Historical Sales Comparison

DATA SOLUTIONSAltusAnalytics
© 2019 Mapbox © OpenStreetMap
GTA - Acve High Rise Sites by Current Month Sales
Forest Hill Condominiums: 298
Universal City Condominiums - Tower Three: 148
Galleria 02: 125
Charisma on the Park - South Tower: 112
Nordic Condos: 102
Saint: 270
King's Mill at Backyard Condos: 210
Thornhill: 149
Stella at Southside: 100
20/Twenty Towns: 100
© 2019 Mapbox © OpenStreetMap
GTA - Top 10 Sites by Current Month Sales
Current Sites

DATA SOLUTIONSAltusAnalytics
Current Month High Rise Sales Breakdown
Opened in Prev. 12 Mo.2,395
Opened More Than 13 Mo. Ago318
Opened This Month851
Sales by Opening Date
Old Toronto1,330
Etobicoke289
Mississauga280
Scarborough274
North York218
Vaughan505
Sales by Municipality/Area
Pre-Construction: 2,840
Under Construction: 693Standing Inventory: 31
Sales by Const. Status
1 Bedroom755
1 Bedroom + Den912
2 Bedroom1,144
2 Bedroom + Den: 251
Studio: 213
3 Bedroom &Up: 271
Sales by Unit Type
Yes: 1,987
Call First: 1,577
No: 0
Sales by Sites with Broker Cooperaon
$500 to$600/sf: 280
$600 to$700/sf: 198
$700 to$800/sf: 921
Pricing Not YetAvailable: 0*
$800 to$900/sf: 629
$900 to$1,000/sf: 151
Over $1,000/sf:1,348
< $500/sf: 37
Sales by Price Range
Monthly Sales Breakdown
*Projects with current price per sf yet to be determined
DATA SOLUTIONSAltusAnalytics
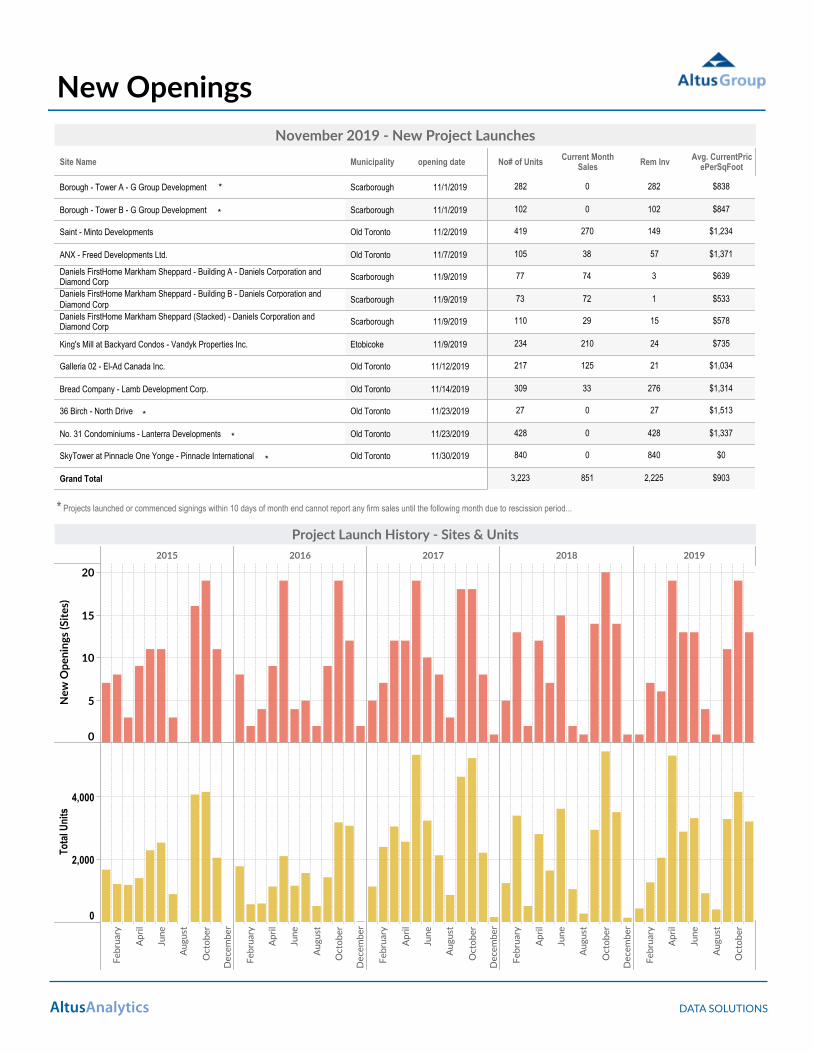
Site Name Municipality opening date No# of Units Current MonthSales Rem Inv Avg. CurrentPric
ePerSqFoot
Borough - Tower A - G Group Development Scarborough 11/1/2019
Borough - Tower B - G Group Development Scarborough 11/1/2019
Saint - Minto Developments Old Toronto 11/2/2019
ANX - Freed Developments Ltd. Old Toronto 11/7/2019
Daniels FirstHome Markham Sheppard - Building A - Daniels Corporation andDiamond Corp Scarborough 11/9/2019
Daniels FirstHome Markham Sheppard - Building B - Daniels Corporation andDiamond Corp Scarborough 11/9/2019
Daniels FirstHome Markham Sheppard (Stacked) - Daniels Corporation andDiamond Corp Scarborough 11/9/2019
King's Mill at Backyard Condos - Vandyk Properties Inc. Etobicoke 11/9/2019
Galleria 02 - El-Ad Canada Inc. Old Toronto 11/12/2019
Bread Company - Lamb Development Corp. Old Toronto 11/14/2019
36 Birch - North Drive Old Toronto 11/23/2019
No. 31 Condominiums - Lanterra Developments Old Toronto 11/23/2019
SkyTower at Pinnacle One Yonge - Pinnacle International Old Toronto 11/30/2019
Grand Total
$8382820282
$8471020102
$1,234149270419
$1,3715738105
$63937477
$53317273
$5781529110
$73524210234
$1,03421125217
$1,31427633309
$1,51327027
$1,3374280428
$08400840
$9032,2258513,223
November 2019 - New Project Launches
2015 2016 2017 2018 2019
February
April
June
August
October
December
February
April
June
August
October
December
February
April
June
August
October
December
February
April
June
August
October
December
February
April
June
August
October
0
5
10
15
20
New Openings (Sites)
0
2,000
4,000
Total Units
Project Launch History - Sites & Units
* Projects launched or commenced signings within 10 days of month end cannot report any firm sales until the following month due to rescission period...
New Openings
*
*
*
*
*
DATA SOLUTIONSAltusAnalytics
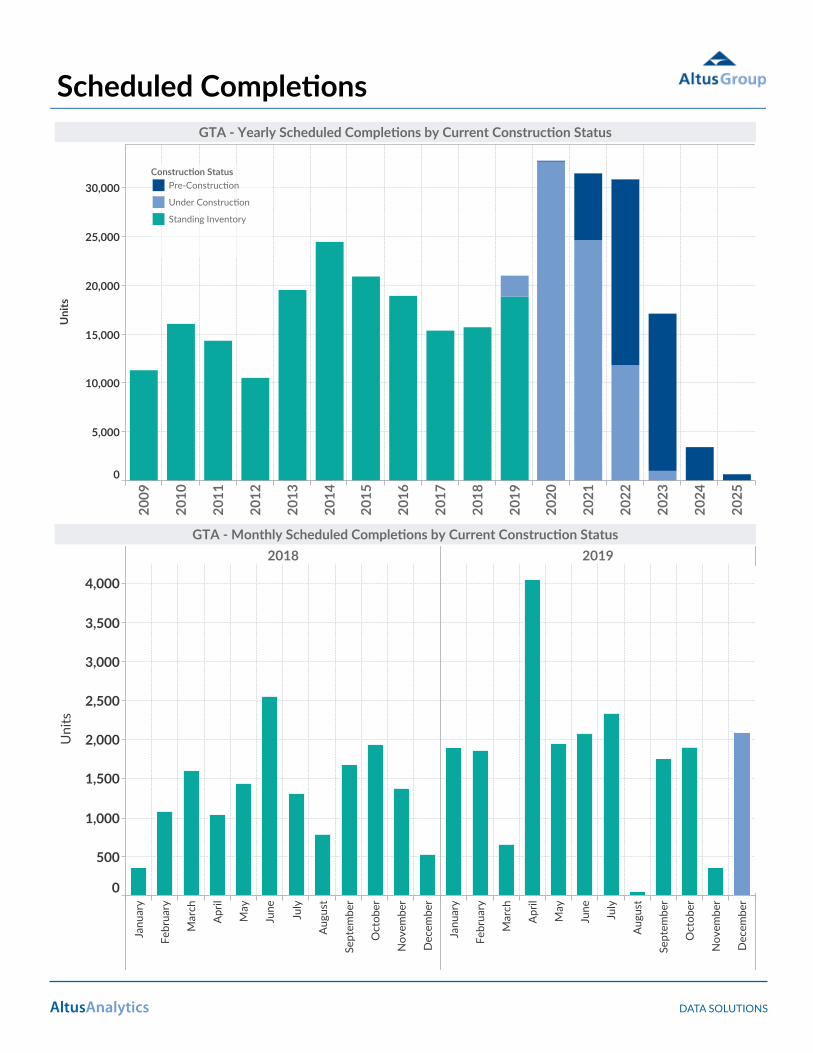
2009
2010
2011
2012
2013
2014
2015
2016
2017
2018
2019
2020
2021
2022
2023
2024
2025
0
5,000
10,000
15,000
20,000
25,000
30,000
Units
GTA - Yearly Scheduled Compleons by Current Construcon Status
2018 2019
January
February
March
April
May
June
July
August
September
October
November
December
January
February
March
April
May
June
July
August
September
October
November
December
0
500
1,000
1,500
2,000
2,500
3,000
3,500
4,000
Units
GTA - Monthly Scheduled Compleons by Current Construcon Status
Scheduled Compleons
Construcon StatusPre-Construcon
Under Construcon
Standing Inventory

DATA SOLUTIONSAltusAnalytics
Top Builders - YTD

DATA SOLUTIONSAltusAnalytics
Top Builders - Last 12 Months
DATA SOLUTIONSAltusAnalytics
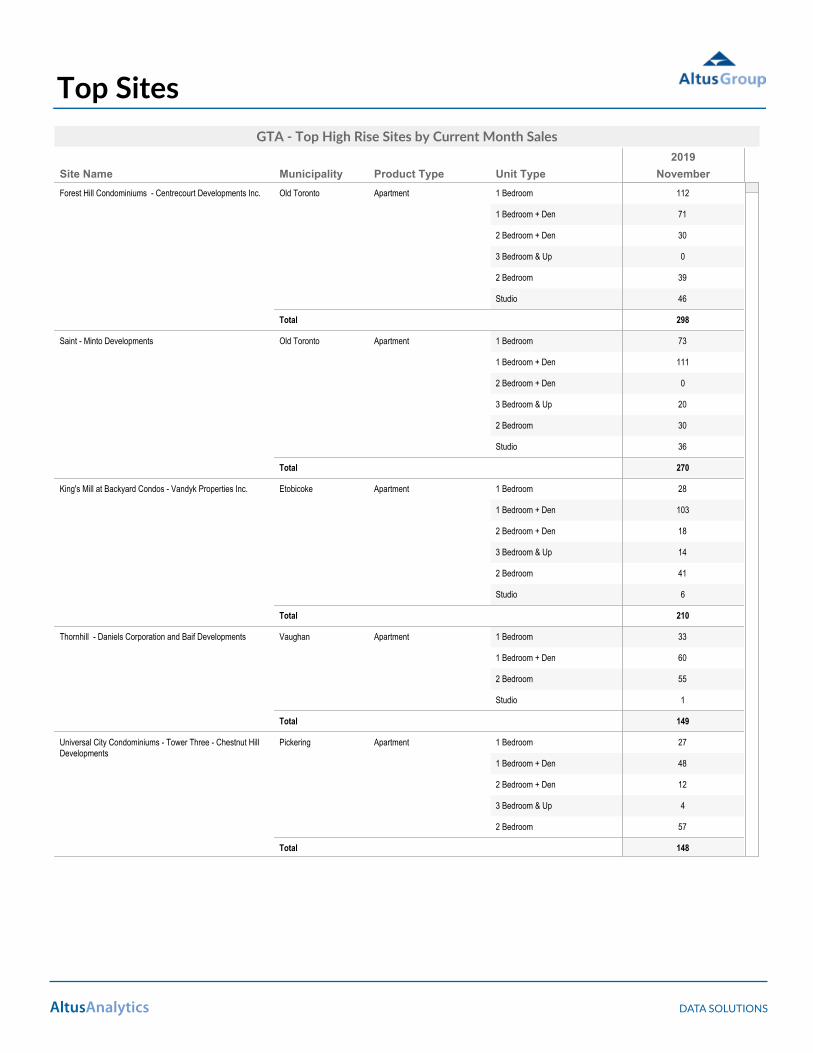
Site Name Municipality Product Type Unit Type2019
November
Forest Hill Condominiums - Centrecourt Developments Inc. Old Toronto Apartment 1 Bedroom
1 Bedroom + Den
2 Bedroom + Den
3 Bedroom & Up
2 Bedroom
Studio
Total
Saint - Minto Developments Old Toronto Apartment 1 Bedroom
1 Bedroom + Den
2 Bedroom + Den
3 Bedroom & Up
2 Bedroom
Studio
Total
King's Mill at Backyard Condos - Vandyk Properties Inc. Etobicoke Apartment 1 Bedroom
1 Bedroom + Den
2 Bedroom + Den
3 Bedroom & Up
2 Bedroom
Studio
Total
Thornhill - Daniels Corporation and Baif Developments Vaughan Apartment 1 Bedroom
1 Bedroom + Den
2 Bedroom
Studio
Total
Universal City Condominiums - Tower Three - Chestnut HillDevelopments
Pickering Apartment 1 Bedroom
1 Bedroom + Den
2 Bedroom + Den
3 Bedroom & Up
2 Bedroom
Total
46
39
0
30
71
112
298
36
30
20
0
111
73
270
6
41
14
18
103
28
210
1
55
60
33
149
57
4
12
48
27
148
GTA - Top High Rise Sites by Current Month Sales
Top Sites

DATA SOLUTIONSAltusAnalytics
Current Market Parameters & Trend by Area
$962/sf$965/sf
$848/sf $895/sf
$904/sf $1,005/sf
$1,275/sf$1,371/sf
$709/sf $766/sf
$740/sf
$692/sf $723/sf
Avg. = $960/sf
Avg. = $863/sf
Avg. = $957/sf
Avg. = $1,330/sf
Avg. = $737/sf
Avg. = $684/sf
Avg. = $705/sf
Last 13 Months
5.00.0
6.8 11.8
8.64.7
5.6 9.5
3.8
13.2
37.0
11.8 9.8
Avg. = 3.7
Avg. = 5.7
Avg. = 6.2
Avg. = 4.5
Avg. = 6.2
Avg. = 13.3
Avg. = 7.9
Last 13 Months
1,249 sf 1,375 sf
856 sf 962 sf
870 sf 937 sf
913 sf 878 sf
794 sf 740 sf
882 sf
922 sf
949 sf
Avg. = 1,315 sf
Avg. = 898 sf
Avg. = 879 sf
Avg. = 900 sf
Avg. = 795 sf
Avg. = 865 sf
Avg. = 924 sf
Last 13 Months
416 Area East York
Etobicoke
North York
Old Toronto
Scarborough
York
905 Area 905 All Muni.
$740/sf
$766/sf
$1,371/sf
$1,005/sf
$895/sf
$965/sf
$723/sf
Avg. Asking Price/SF
416 Area East York
Etobicoke
North York
Old Toronto
Scarborough
York
905 Area 905 All Muni.
882 sf
740 sf
878 sf
937 sf
962 sf
1,375 sf
949 sf
Avg. Remaining Unit Size (SF)
416 Area East York
Etobicoke
North York
Old Toronto
Scarborough
York
905 Area 905 All Muni.
37.0
13.2
9.5
4.7
11.8
0.0
9.8
Avg. Absorption Rate (Sales/Site)
Market Parameters by Area

DATA SOLUTIONSAltusAnalytics
Current Month Sales Compared to Previous Year by Submarket
SubMarket Municipality
November 2019Apartment Loft Stacked Total
November 2018Apartment Loft Stacked Total
Bloor - Yorkville Old Toronto
Central Waterfront Old Toronto
Don Mills - York Mills North York
Downtown Core Old Toronto
Downtown East Old Toronto
Downtown West Old Toronto
Etobicoke Waterfront Etobicoke
Highway7 - Yonge Markham
Richmond Hill
Mississauga City Centre Mississauga
North Toronto Old Toronto
North Yonge Corridor North York
North York East North York
North York West North York
Not Applicable Brampton
Burlington
Clarington
East York
Etobicoke
Georgina
Halton Hills
Markham
Milton
Mississauga
Newmarket
Oakville
Old Toronto
Oshawa
Pickering
Scarborough
Vaughan
Whitby
Whitchurch-Stouffville
York
Sheppard Corridor North York
Thornhill Vaughan
Toronto East Old Toronto
Toronto West Old Toronto
Yonge - St. Clair Old Toronto
Grand Total
5454 1414
3535 5959
36036 1239
7474 1616
374374 2929
109109 177177
22 99
108
0
3375
0
18
2
513
2
8080 519519
123123 139139
606 16610
440 505
13820118 27027
87
5
5
272
274
150
24
298
69
17
200
35
30
0
0
287
0
4
8
126
8
33
1
3
136
2
2
26
0
0
87
5
5
264
241
149
24
298
66
17
64
35
28
0
0
285
0
4
8
100
11
10
10
26
53
265
130
0
27
1
185
8
26
3
0
169
10
0
52
54
2
20
30
0
37
4
0
0
54
1
0
11
10
10
24
33
235
130
0
27
148
4
26
3
0
169
10
0
52
0
34034 301301
233233 99
4921037 344030
16715152 2710271
47047 11
3,564285103,269 2,69816512,532
Y./Y. Sales Comparison

DATA SOLUTIONSAltusAnalytics
Last 12 Month's Sales & Remaining Inventory by Submarket
SubMarket Municipality Apartment Loft Stacked Total
Bloor - Yorkville Old Toronto
Central Waterfront Old TorontoDon Mills - York Mills East York
North YorkOld Toronto
Downtown Core Old TorontoDowntown East Old Toronto
Downtown West Old TorontoEtobicoke Waterfront Etobicoke
Highway7 - Yonge MarkhamRichmond Hill
Mississauga City Centre MississaugaNorth Toronto North York
Old TorontoNorth Yonge Corridor North York
Old TorontoNorth York East North York
North York West North YorkOld Toronto
YorkNot Applicable Ajax
AuroraBrampton
BurlingtonCaledon
ClaringtonEast York
EtobicokeGeorgina
Halton HillsKing
MarkhamMilton
MississaugaNewmarket
North YorkOakville
Old TorontoOshawa
PickeringRichmond Hill
ScarboroughUxbridge
VaughanWhitby
Whitchurch-StouffvilleYork
Scarborough City Centre ScarboroughSheppard Corridor North York
Thornhill MarkhamVaughan
Toronto East East YorkOld Toronto
Toronto West Old TorontoYonge - St. Clair Old Toronto
Grand Total
605605476476
71913706
774774
8568561,9031,903
112112
281
0
66215
0
2,4312,431
1,0161,016
7373734
111101,1961271,069
239
13152
3,070
1,258
471206
3021,208
104
1,020233
1,082
100
1,53243
30
380650
161
154
84
112
46339
16
75
4
427
2
10
239
13152
2,909
1,104
387206
3021,096
102
557194
1,056
100
1,45743
26
380223
53110521
703703
35724123211,0574811,008
7107125,8571,8372523,995
Last 12 Months - Sales
Apartment Loft Stacked Total
3453451,4021,402
41922397
717717
9419411,3921,392
8282
352
0
175177
0
461461
455455
1529143
19190279107172
122
12187
543
1,225
87174
92377
120
485130
749
170
52744
67
265191
13
89
20
36
126
23
15
50
3
92
122
12187
530
1,136
67174
92341
117
359130
634
170
51244
67
265141
70814694
182182
22313420672274648
122279514,3968329913,465
Remaining Inventory
Sales & Remaining Inventory

Copyright © Altus Group Limited
Altus Group Limited, makes no representation about the accuracy, completeness, or the suitability of the material represented herein for the particular purposes of
any reader and such material may not be copied, duplicated or re-distributed in any form or by any means without the prior written permission of Altus Group Limited.
Altus Group Limited assumes no responsibility or liability without limitation for any errors or omissions in the information contained in the material represented. E&O.E.
DATA SOLUTIONS
AltusGroup.com/DataSolutions