green infrastructure to combat climate change · 5 the latest scientific evidence has reinforced...
TRANSCRIPT

Green Infrastructure to Combat Climate ChangeA Framework for Action in Cheshire, Cumbria, Greater Manchester, Lancashire, and Merseyside
March 2011Prepared by Community Forests Northwest for the Northwest Climate Change Partnership
European UnionEuropean Regional Development Fund
European UnionEuropean Regional Development Fund


Executive Summary 5
The Vision 7
The Case for Combating Climate Change 9
The Case for Green Infrastructure 11
Developing the Framework for Action 12
The North West Climate Change Action Plan 12
The GRaBS Project 13
Delivering the Framework for Action 14
How to Deliver? 14
Who to Deliver? 14
District and Neighbourhood Level Delivery 14
Pan-Authority (or Sub/City Region) Level Delivery 15
The Actions 16
1. Overarching Actions 18
2. Managing Surface Water 23
3. Managing High Temperatures 26
4. Carbon Storage and Sequestration 29
5. Managing Riverine Flooding 32
6. Food Production 35
7. Material Substitution 38
8. Providing Low Carbon Fuels 40
9. Reducing the Need to Travel by Car 43
10. Helping Other Species Adapt 45
11. Managing Visitor Pressure 48
12. Reducing Soil Erosion 51
13. Managing Water Resources 54
14. Managing Coastal Flooding 56
Legislative and Policy Context 60
EU Legislation and Policy 60
UK Legislation, Policy and Guidance 60
Abbreviations 62
Organisations Shaping the Framework 63
Contents

4 Photo: McCoy Wynne

5
The latest scientific evidence has reinforced the fact that climate change is the greatest threat to our social well being and economic future. It is imperative that we all take what action we can now in order to both reduce greenhouse gas emissions and ensure that our communities are adapting to anticipated climate change.
Green infrastructure provides a range of services that make both a substantial contribution towards climate change adaptation and a limited yet important contribution towards climate change mitigation. Such natural interventions are increasingly being recognised as a desirable ‘win-win’ approach to combating climate change, as they also help to deliver multiple other social, economic and environmental benefits.
This Framework for Action has been developed under the auspices of the North West Climate Change Action Plan, with Community Forests Northwest commissioned by the Northwest Regional Development Agency on behalf of the Northwest Climate Change Partnership. The work was supported through the EU Interreg IVC GRaBS (Green and Blue Space Adaptation for Urban Areas and Eco Towns) project. 114 people from 75 organisations helped to shape the Framework by taking part in the consultation.
This Framework is a guidance document to be used by stakeholders across Cheshire, Cumbria, Greater Manchester, Lancashire, and Merseyside to influence and provide evidence for policy and delivery on this crucial and long term agenda. Its success depends upon all stakeholders taking ownership of and working in partnership to champion, tailor for their needs, embed into policy, and deliver the actions that are relevant to them. Indeed, climate change and green infrastructure are both cross-cutting, so this Framework adds value to the delivery of a broad range of agendas, including development and
regeneration, low carbon economy, transport, health, recreation, tourism, agriculture, and biodiversity.
The Framework should be delivered by a broad range of organisations and professions. Organisations include public agencies and service providers, local authorities, environmental, community and voluntary-sector organisations and non-governmental organisations, and those with remits for the agendas set out above. Professions include planners and investment decision makers, transport planners, developers, urban designers, landscape architects, engineers, foresters, conservationists, farmers, and tourism managers. Many of the actions will be delivered cumulatively by land owners and managers. This includes both larger, public sector, and easier to reach owners such as local authorities, as well as smaller, private sector, businesses, individuals and harder to reach land owners; organisations that engage with and provide grants to the latter group will be increasingly important.
Delivery will largely be at three levels: pan-authority (or sub/city region), district, and neighbourhood. The pan-authority level is critical, but the best results will be achieved when delivery takes place across all three levels. In addition, existing green infrastructure networks in the North West of England, such as the Green Infrastructure Unit and Green Infrastructure Forum, should provide an ongoing support and coordination role, helping to promote the implementation of this and associated green infrastructure frameworks, including the exchange of best practice.
The Framework sets out a number of actions to achieve the vision described overleaf.
Executive Summary

6 Photo: McCoy Wynne

7
• Managing surface water – green infrastructure can help to manage surface water and sewer flooding by reducing the rate and volume of water runoff; it intercepts water, allows it to infiltrate into the ground, and provides permanent or temporary storage areas.
• Managing high temperatures – particularly in urban areas, where evaporative cooling and shading provided by green infrastructure can ensure that towns and cities continue to be attractive and comfortable places to live, work, visit and invest.
• Carbon storage and sequestration – storing carbon in soils and vegetation.
• Managing riverine flooding – green infrastructure can provide water storage and retention areas, reducing and slowing down peak flows, and thereby helping to alleviate river flooding.
• Food production – providing environmentally sustainable food production that delivers food security.
• Material substitution – replacing materials such as concrete and steel (which involve high fossil fuel consumption in their production) with sustainably managed wood and other natural materials.
• Providing low carbon fuels – replacing fossil fuels with lower carbon alternatives, including bioenergy, wind and hydro.
• Reducing the need to travel by car – providing local recreation areas and green travel routes to encourage walking and cycling.
• Helping other species adapt – providing a more vegetated and permeable landscape through which species can move northwards to new ‘climate spaces’.
• Managing visitor pressure – providing a recreation and visitor resource for a more outdoors lifestyle, and helping to divert pressure from landscapes which are sensitive to climate change.
• Reducing soil erosion – using vegetation to stabilise soils that many be vulnerable to increasing erosion.
• Managing water resources – green infrastructure can provide places to store water for re-use, allows water to infiltrate into the ground sustaining aquifers and river flows, and can catch sediment and remove pollutants from the water, thereby ensuring that water quantity and quality is maintained.
• Managing coastal flooding – green infrastructure can provide water storage and retention areas, reducing and slowing tidal surges, and thereby helping to alleviate coastal flooding.
The Vision
Green infrastructure across Cheshire, Cumbria, Greater Manchester, Lancashire, and Merseyside is planned, designed, and managed by all relevant stakeholders, involving and engaging local communities, in order to combat climate change and deliver other economic, social and environmental benefits. All opportunities are taken to safeguard, create, enhance, maintain and promote green infrastructure in ways that optimise the climate change adaptation and mitigation services it provides. These include:

8 Photo: ©iStockphoto.com/Jpique

9
The latest scientific evidence has reinforced the fact that climate change is the greatest threat to our social well being and economic future1. It is imperative that we all take what action we can now in order to both reduce greenhouse gas emissions and ensure that our communities are adapting to anticipated climate change.
The Stern Review on the Economics of Climate Change2 stressed that “the benefits of strong, early action on climate change outweigh the costs”. ‘Mini-Stern’ assessments have been undertaken for Cheshire, Cumbria, Greater Manchester, Lancashire and Merseyside3. Taking river and coastal flooding alone, the current cost of damages to businesses across the North West of England is on average £43m per year; with climate change, costs increase by 223% to £138m per year4. The UK Climate Change Commission suggests that timely adaptation action could halve the costs and damages associated with moderate amounts of climate change5.
We need to reduce greenhouse gas emissions (known as climate change mitigation) in order to limit the severity of climate change. The UK Climate Change Act sets target cuts of at least 34% by 2020 and 80% by 2050, compared to 1990 levels6. An assessment of UK carbon emissions found that 2008 emissions were 22% below 1990 levels7.
We also need to adapt to climate change impacts that are already being felt, and will intensify. In the UK, it is anticipated that climate change will lead to warmer and wetter winters, hotter and drier summers, sea level rises, and more extreme events such as heatwaves, heavy rainfall, and droughts. In the North West of England, some headline changes by the 2080s are8:
• 28% decrease in average summer precipitation – leading to reduced stream flows and water quality, increased drought, subsidence, changes to crops, serious water stress.
• 26% increase in average winter precipitation – leading to increased flooding including from overwhelmed drains, subsidence, severe transport disruption, risks to critical infrastructure.
• 4.7ºC increase in average summer temperatures – leading to increased heat stress, infrastructure risks, risks to biodiversity, heat related deaths, risks to food security.
Across the UK, by 2095, relative sea levels could rise by 39-53cm9.
Using natural, or green infrastructure interventions, is increasingly being recognised as a desirable ‘win-win’ approach to combating climate change10.
The Case for Combating Climate Change
1. Intergovernmental Panel on Climate Change (2007). Climate Change 2007: Synthesis Report. www.ipcc.ch/pdf/assessment-report/ar4/syr/ar4_syr.pdf 2. Stern (2006). Stern Review on the Economics of Climate Change. www.hm-treasury.gov.uk/sternreview_index.htm 3. www.climatechangenorthwest.co.uk/?page_id=9004. URS (2009). Economic impacts of increased flood risk associated with climate change in the North West. www.climatechangenorthwest.co.uk/assets/_files/documents/oct_09/cli__1256311710_URS_Ecoimpact_report_finalOct2.pdf; assuming flood defences are maintained at current levels, and that there is a 20% increase in river flows by 2100.5. Adaptation Sub-Committee (2010). How well prepared is the UK for climate change? www.theccc.org.uk/reports/adaptation6. www.decc.gov.uk/en/content/cms/what_we_do/lc_uk/carbon_budgets/carbon_budgets.aspx7. Department of Energy and Climate Change (2010). Annual statement of emissions for 2008. www.decc.gov.uk/assets/decc/What%20we%20do/A%20low%20carbon%20UK/Carbon%20budgets/1_20100331145647_e_@@_StatementEmissions2008.pdf8. The figures use the central estimate of the high emissions scenario and compare to the 1961-1990 baseline period http://ukclimateprojections.defra.gov.uk/content/view/2221/499. We are currently on an emissions path which is above that of the high emissions scenario used in the UK Climate Projections 2009 http://ukclimateprojections.defra.gov.uk/content/view/2094/5009. Using the central estimate of the high emissions scenario, and compared to the 1961-1990 baseline period http://ukclimateprojections.defra.gov.uk/content/view/2145/499 10. Planning and Climate Change Coalition (2010). Planning for Climate Change – Guidance and model policies for local authorities. www.tcpa.org.uk/pages/planning-for-climate-change-guide.html; this won a Royal Town Planning Institute Planning Award 2010.

10 Photo: McCoy Wynne

11
Green infrastructure is our “life support system – the network of natural environmental components and green and blue spaces that lie within and between our cities, towns and villages and provide multiple social, economic and environmental benefits”11. It should be planned and managed as a critical infrastructure12.
Green infrastructure includes urban and rural components, ranging from the designed to the more natural. Types of green infrastructure include: agricultural land, allotments, community gardens and urban farms, cemeteries, churchyards and burial grounds, coastal habitats, derelict land, general amenity spaces, grasslands, heathlands, moorlands and scrublands, green roofs, institutional grounds, orchards, outdoor sports facilities, parks and public gardens, private domestic gardens, street trees, water bodies and courses, wetlands, and woodlands.
Green infrastructure provides us with a range of social, environmental and economic benefits13. These are sometimes referred to as ecosystem services14. The natural environment of the North West of England generates an estimated £2.6bn in Gross Value Added, and supports 109,000 jobs. The Natural Economy Northwest programme categorised eleven groups of economic benefits provided by green infrastructure15 and has produced a series of case studies for each16:
• Economic growth and investment – businesses attract and retain more motivated staff
• Land and property values – natural views can add up to 18% to property values
• Labour productivity – green spaces near workplaces reduce sickness absence
• Tourism – rural tourism supports 37,500 jobs in the North West of England
• Products from the land – 40,000 people work in agriculture in the North West of England
• Health and wellbeing – reduces pollution which leads to asthma and heart disease
• Recreation and leisure – footpaths, cycle paths and bridleways enable healthy recreation
• Quality of place – community owned green spaces can create jobs and local pride
• Land and biodiversity – provides vital habitats and jobs managing the land
• Flood alleviation and management – reduces pressure on drains and flood defences
• Climate change adaptation and mitigation – counters soaring summer temperatures in cities.
A Green Infrastructure Valuation Toolkit builds upon this framework to make the case for the potential economic benefits resulting from investment in green infrastructure17. An earlier version of the Toolkit was trialled in Liverpool Knowledge Quarter, where it was demonstrated that a £10m investment in green infrastructure could realise £30m in economic benefits18.
Green infrastructure provides a range of services that make a substantial contribution towards climate change adaptation and a limited yet important contribution towards climate change mitigation19. Green infrastructure actions, which include safeguarding, creating, enhancing, maintaining and promoting it, are an attractive approach to combating climate change, precisely because they can deliver results to so many other agendas as well as that of climate change.
The Case for Green Infrastructure
11. North West Green Infrastructure Think Tank (2008). North West Green Infrastructure Guide. www.ginw.co.uk/resources/GIguide.pdf; this won a Royal Town Planning Institute Planning Award 2008.12. Natural Economy Northwest. Green Infrastructure Prospectus. www.ginw.co.uk/resources/Prospectus_V6.pdf 13. Forest Research (2010). Benefits of Green Infrastructure. www.forestresearch.gov.uk/fr/INFD-8A9A2W; Commission for Architecture and the Built Environment (2009). Sustainable Places. www.cabe.org.uk/sustainable-places/green-infrastructure 14. www.ecosystemservices.org.uk/ecoserv.htm15. Natural Economy Northwest. The economic value of green infrastructure. www.nwda.co.uk/PDF/EconomicValueofGreenInfrastructure.pdf16. www.naturaleconomynorthwest.co.uk/resources+case+studies.php17. Available at www.bit.ly/givaluationtoolkit18. www.merseyforest.org.uk/files/LKQ VFM test - GENECON.doc 19. Community Forests Northwest et al (2010.) Green Infrastructure: How and where can it help the Northwest mitigate and adapt to climate change? www.ginw.co.uk/climatechange/report

12
This Framework for Action has been developed under the auspices of the North West Climate Change Action Plan, with Community Forests Northwest commissioned to develop it by the Northwest Regional Development Agency on behalf of the Northwest Climate Change Partnership. The work was supported through the EU Interreg IVC GRaBS (Green and Blue Space Adaptation for Urban Areas and Eco Towns) project.
The Framework is underpinned by two key pieces of work: an online evidence base and a report (see Key output from the GRaBS project in the North West of England on page 13).
The Framework was consulted on in 2010, with 114 people from 75 organisations20 helping to shape it by sending written comments or attending one of seven workshops held in Cheshire, Cumbria, Greater Manchester, Lancashire, and Merseyside, and at the North West Green Infrastructure and Forestry Framework Forums.
The North West Climate Change Action Plan
The 2007-2009 and 2010-2012 versions of the North West Climate Change Action Plan21 both contained a green infrastructure action for which Community Forests Northwest was the lead partner:
No. Action Lead
10 Develop a regional adaptation framework which sets out the regional response to projected climate change impacts and capitalises on opportunities for implementation and demonstration, taking into account;
10.1 The assessment of climate change impacts and responses for key business sectors and public services in the region.
NWDA
10.2 Flood and coastal risk management through catchment and shoreline management plans.
EA
10.3 The regional assessment of the risks, opportunities and priorities for green infrastructure in adapting and mitigating for climate change.
CFNW
10.4 The impacts on infrastructure and services identified through a regional dimension to the national Climate Change Risk Assessment and Economic Impact Analysis.
NWDA
10.5 Adaptation response strategies for the region’s distinctive landscapes, habitats and species, and the assessment of the contribution of natural systems to carbon sequestration and reduced flood risk.
NE
10.6 The implications of climate change projections on the delivery of regional health services.
NHS NW
10.7 The assessment of the implications of climate change on existing and future built environment.
NWDA
10.8 The development and delivery of plans for water efficiency, reliability and resilience; sustainable drainage; and associated carbon reduction.
UU
Developing the Framework for Action
20. See page 63 of this Framework for the list of organisations contributing to the consultation.21. Northwest Regional Development Agency et al (2010). Rising to the challenge: A climate change action plan for England’s North West 2010-2012. www.climatechangenorthwest.co.uk/assets/_files/documents/feb_10/cli__1265921054_NW_Climate_Change_Action_Plan.pdf; www.climatechangenorthwest.co.uk/1611/adaptation.html has updates and findings from these actions.

13
The GRaBS Project
The EU Interreg IVC GRaBS project22 has four main objectives:
1 To raise awareness and increase the expertise of key bodies responsible for spatial planning and development on how green and blue infrastructure can help new and existing mixed-use urban development adapt to projected climate scenarios.
2 To assess the delivery mechanisms that exist for new urban mixed-use development and urban regeneration in each partner country and to develop good practice Adaptation Action Plans to co-ordinate the delivery of urban greening and adaptation strategies, as well as cooperation among planners, policy-makers, stakeholders, and local communities.
3 To develop an innovative, cost effective and user-friendly Risk and Vulnerability Assessment Tool, to aid the strategic planning of climate change adaptation responses.
4 To improve stakeholder and community understanding and involvement in planning, delivering and managing green and blue infrastructure in new and existing urban mixed-use development, based on positive community involvement techniques.
The project partners are: Provincial Government of Styria (Austria), Municipality of
Kalamaria (Greece), Etnambiente SRL (Italy), Province of Genoa
(Italy), University of Catania (Italy), Klaipeda University Coastal
Research and Planning Institute (Lithuania), Amsterdam City
District of Nieuw-West (Netherlands), Regional Environmental
Centre for Central and Eastern Europe (Slovakia), City of
Malmö (Sweden), London Borough of Sutton (UK), Northwest
Regional Development Agency (UK), Southampton City
Council (UK), Town and Country Planning Association (UK),
University of Manchester (UK).
Output for the GRaBS project as a whole can be seen at www.grabs-eu.org.
Key output from the GRaBS project in the North West of England
The key output is held at www.ginw.co.uk/climatechange and includes:
• This Framework for Action www.ginw.co.uk/climatechange/framework
• Evidence base – online and searchable, it holds a review of key research, policy and delivery relevant to the climate change services provided by green infrastructure. www.ginw.co.uk/climatechange/evidencebase
• Report – entitled ‘Green Infrastructure: How and where can it help the Northwest mitigate and adapt to climate change?’, it summarises the evidence for the climate change services provided by green infrastructure and maps where each could be the most important. www.ginw.co.uk/climatechange/report
• An online ‘Adaptation Action Planning Tool’ to help users to assess potential risks and vulnerabilities to climate change (see Case Study 1 in this Framework). www.ginw.co.uk/climatechange/assessmenttool
• Training material for engaging communities on climate change adaptation and the role of green infrastructure, developed with Liverpool City Council with support from CLASP23 (see Case Study 2 in this Framework). www.ginw.co.uk/climatechange/training
• A ‘Green Infrastructure Toolkit’ to help developers determine their ‘Green Infrastructure Score’ and potential interventions to maximise benefits (see Case Study 3 in this Framework); the toolkit was developed for Northwest Regional Development Agency’s Sustainability Policy for the Built Environment. www.ginw.co.uk/climatechange/gi_toolkit
22. www.grabs-eu.org23. Climate Change Local Area Support Programme www.clasp-nw.info

14
How to Deliver?This Framework is a guidance document to be used by stakeholders across Cheshire, Cumbria, Greater Manchester, Lancashire, and Merseyside to influence and provide evidence for policy and delivery on this crucial and long term agenda. The Framework is not directly resourced; however each action includes suggested delivery mechanisms. Some actions are straightforward and are already being delivered through existing mechanisms; others are more challenging, and their inclusion is intended to kick-start debate in order to lead to delivery.
The mechanisms are a mixture of existing and potential future strategies, policies, plans, and guidance, as well as programmes and projects. There is a need to be mindful, especially given current structural changes, that some mechanisms may disappear whilst new ones emerge. Emerging, novel and innovative mechanisms should be explored (e.g. tax reforms, council tax precepts, use of byelaws for flooding issues, conservation credits, etc). More generic ways of funding green infrastructure delivery are not listed here (e.g. Landfill Communities Fund, Aggregates Levy, Heritage and Big Lottery Funds), yet these could help to deliver a lot of the actions.
Who to Deliver?The success of the Framework depends on all stakeholders taking ownership of and working in partnership to champion, tailor for their needs, embed into policy, and deliver the actions. Climate change and green infrastructure are both cross-cutting, so delivery of this Framework adds value to a broad range of agendas, including development and regeneration, low carbon economy, transport, health, recreation, tourism, agriculture, and biodiversity.
The Framework should be delivered by a range of organisations (and their contractors) and professions. Organisations include public agencies and service providers, local authorities, environmental,
community and voluntary-sector organisations, and those with remits for the agendas set out above. Professions include planners and investment decision makers, transport planners, developers, urban designers, landscape architects, engineers, foresters, farmers, conservationists, tourism managers. Many actions will be delivered cumulatively by individual land owners and managers, ranging from larger, public sector, and easier to reach owners (e.g. local authorities), to smaller, private sector, businesses, individuals and harder to reach owners. Organisations that engage with the latter group will be increasingly important.
This Framework was developed for the North West of England, yet delivery will be at three levels: pan-authority, district, and neighbourhood, with best results achieved when it takes place across all levels. Existing green infrastructure networks in the North West of England (e.g. Green Infrastructure Unit and Forum) should provide an ongoing support and coordination role, helping to promote the implementation of this and associated frameworks, and the exchange of best practice.
District and Neighbourhood Level Delivery
The Localism Bill makes delivery at these levels increasingly important. This Framework can be embedded into Local Development Frameworks including Core Strategies and Development Plan Documents, Supplementary Planning Documents and Area Action Plans, as well as proposals for Community Infrastructure Levies. It also needs to be embedded into Sustainable Community Strategies and the work of Local Strategic Partnerships and Local Area Partnerships. This can then help to influence the development of Town and Parish Plans, and emerging Neighbourhood Plans, as well as masterplans for new developments and restructuring.
Delivering the Framework for Action

15
Pan-Authority (or Sub/City Region) Level DeliveryAction at this level is critical. Cheshire, Cumbria, Greater Manchester, Lancashire, and Merseyside all have green infrastructure frameworks; this Framework adds strength to their climate change sections. Similarly, all have climate change plans, and this Framework adds strength to their green infrastructure aspects. Green infrastructure partnerships could coordinate the delivery of cross-boundary actions, act as advocates for this agenda in existing and emerging structures (e.g. Local Enterprise Partnerships, climate change and landscape partnerships, local authorities, Joint Infrastructure Plans). The following are starting points for taking this agenda forward24:
CH
ESH
IRE Documents North East Wales and Cheshire Green Infrastructure Framework
Partners Cheshire and Warrington Economic Commission (and in particular it’s Climate Change and Sustainability Commission), low carbon communities (e.g. Blacon), The Mersey Forest
Services Managing riverine flooding
Areas Crewe, Ellesmere Port, Atlantic Gateway
CU
MB
RIA
Documents Cumbria Climate Change Action Plan, The Scope for Renewable Energy in Cumbria (Cumbria Vision, 2009), Green Infrastructure in Cumbria (Rebanks, 2010)
Partners Cumbria Green Infrastructure Task Group (this group having support from Cumbria Strategic Partnership was identified as key), Lake District National Park Authority, Joint Planning Officers Group, Cumbria Woodlands, Cumbria Vision, Cumbria Tourism, Chamber of Commerce, Cumbria Rural Enterprises Agency, National Farmers Union, Cumbria Farmers Network, Countryside Landowners Association, commoners , Storey Homes and the private sector, community groups (e.g. Sustainable Brampton, Action for Communities, South Lakes Against Climate Change)
Services Carbon storage and sequestration, managing riverine flooding, reducing the need to travel by car, managing visitor pressure
Areas Carlisle, Bassenthwaite Catchment, Derwent Forest, Sellafield (new nuclear build), West Coast, Barrow, Kendal Canal Head Area Action Plan, south of Workington (Corus Steel Works re-development), Wigton, Sustainable Catchment Management Programme project areas, Peatscapes
GR
EA
TER
M
AN
CH
EST
ER Documents Greater Manchester Green Infrastructure Framework, Climate Change Strategy, Spatial Framework,
Strategic Flood Risk Assessment, Surface Water Management Plan
Partners Greater Manchester Green Infrastructure Partnership, Association of Greater Manchester Authorities/Greater Manchester Combined Authority (Planning and Housing, Environment, New Economy and Health Commissions), Greater Manchester Resilience Forum, Red Rose Forest, Greater Manchester Passenger Transport Executive, Moors for the Future
Services Managing high temperatures, managing surface water
Areas Pennine Prospects, Irwell City Park, Roach Valley, Lower Irwell, Atlantic Gateway
LA
NC
ASH
IRE
Documents Lancashire Green Infrastructure Framework
Partners Lancashire Green Infrastructure Steering Group, Area of Outstanding Natural Beauty Partnership, Lancashire Biodiversity Partnership, landscape partnerships (e.g. Pennine Prospects, West Pennine Moorlands)
Services Carbon storage and sequestration, managing water resources, managing riverine flooding, helping other species adapt
Areas West Pennine Moors (new Sustainable Catchment Management Programme programme here), Ribble Coast and Estuary, Pennine Prospects, Morecambe Bay Regional Park, Brockholes
ME
RSE
YSID
E Documents Liverpool City Region Green Infrastructure Framework, Building the Low Carbon Economy on Merseyside: Future proofing the city for future climate and fuel price uncertainty
Partners Liverpool City Region Environment and Waste Board, The Mersey Partnership, Merseyside Environmental Advisory Service, Liverpool World Centre, The Mersey Forest, Merseytravel
Services Managing high temperatures, reducing need to travel by car (linking to health agendas)
Areas Wirral Waters, Liverpool Waters, Mersey Heartlands, Bold Forest Park, Liverpool Knowledge Quarter, Atlantic Gateway
24. These were suggested through the consultation process and should not be read as definitive or comprehensive. Initial sub/city region mapping and analysis is in Appendix B of the report www.ginw.co.uk/climatechange/report.

16
The following sub-sections of this Framework for Action set out green infrastructure actions to help achieve the vision. These actions broadly relate to land management and change.
The first sub-section covers overarching actions which relate to all climate change services. This is followed by sub-sections relating to each climate change service in turn. The order the services are presented in corresponds to the prioritisation in the recent report25 which supports this Framework. This prioritisation assigned scores for the ‘need for mitigation or adaptation’ (considering probability and magnitude) and for the ‘potential for green infrastructure as a solution’ (considering effectiveness and practicality). The consultation process revealed that each sub or city-region would need to undertake a similar prioritisation, and local authorities, neighbourhoods, and organisations would, in turn, have their own priorities. We have included the prioritisation here as a starting point to aid these discussions.
Each sub-section includes an introduction to the service, case studies, and suggestions for other good practice. The green infrastructure actions to deliver each service are then set out in tables with the following headings:
25. See Section 5.3 and Appendix D of the report Green Infrastructure: How and where can it help the Northwest mitigate and adapt to climate change? www.ginw.co.uk/climatechange/report.
A coloured cell indicates that the action is relevant at a pan-authority
(or sub/city region) level. These actions will generally require cross-boundary working and coordination. They may be most relevant to organisations, partnerships, plans, and strategies at this level.
A coloured cell indicates that the action is relevant at a district level.
These actions can generally be delivered at a local authority level. They may be most relevant to organisations, partnerships, plans, and strategies at this level.
A coloured cell indicates that the action is relevant at a
neighbourhood level. These actions will generally be delivered more locally. They may be most relevant to communities, organisations, partnerships, plans, and strategies at this level.
Actions P D N Partner Mechanism Service
Each action is numbered and described, with some issues that may need to be addressed (although as the actions are fairly high level, delivery will require further considerations). An action highlighted in grey indicates that it was considered a priority by the authors of the Framework and through the consultation process; however, local conditions may override this.
Potential delivery partner organisations and, in some cases, professions, are listed. Some of these partners have taken part in the consultation and expressed an interest in delivering this Framework; others have not, but we have named them here as an indication of who it may be desirable to engage. There will be other partners, especially at local levels, who we have not named here. There is currently considerable restructuring of organisations, so there is a need to be mindful that remits and capacity to deliver actions may change.
Potential delivery mechanisms for each action are listed. These are a mixture of existing and potential future strategies, policies, plans, and guidance, as well as programmes and projects. Delivery frameworks are currently changing, so there is a need to be mindful that some mechanisms will cease to be, whereas new mechanisms may emerge.
For presentation purposes each action appears in only one table, relating to one climate change service. However, many of the actions can deliver more than one service and hence they could have been included in other tables, relating to other services. This column lists the main other climate change services that the action can deliver. The last line of each table lists the other actions relating to the service that happen to appear in other tables. In addition, for all actions, it may be possible to deliver a wider range of services than those listed through careful design and management; Figure 1 below sets out an initial assessment of the compatibility of the climate change services with each other.
Related actions are shown in this panel.
P D N
The Actions

17
Figure 1. Initial assessment of the compatibility of the climate change services with each other26
Carb
on s
tora
ge a
nd s
eque
stra
tion
Prov
idin
g lo
w c
arbo
n fu
els
Mat
eria
l sub
stitu
tion
Food
pro
duct
ion
Redu
cing
the
need
to tr
avel
by
car
Man
agin
g hi
gh te
mpe
ratu
res
Man
agin
g w
ater
reso
urce
s
Man
agin
g riv
erin
e fl
oodi
ng
Man
agin
g co
asta
l floo
ding
Man
agin
g su
rfac
e w
ater
Redu
cing
soi
l ero
sion
Hel
ping
oth
er s
peci
es a
dapt
Man
agin
g vi
sito
r pre
ssur
e
+ ++ o ++ ++ + ++ ++ + ++ ++ o Carbon storage and sequestration
o -- o o - o o o o o o Providing low carbon fuels
-- o o - o o o o o o Material substitution
+ + - - - - - o o Food production
++ + ++ + + - + ++ Reducing the need to travel by car
++ ++ + ++ ++ + ++ Managing high temperatures
++ + + + o + Managing water resources
++ ++ + + ++ Managing riverine flooding
++ Generally compatible ++ + + ++ Managing coastal flooding
+ ++ ++ ++ Managing surface water
o ++ - Reducing soil erosion
- - Helping other species adapt
-- Generally incompatible Managing visitor pressure
26. This should only be used as a starting point for deciding how compatible the services are on a given piece of land. Refer to Appendix C on page 105 of the report for the considerations behind these scores www.ginw.co.uk/climatechange/report.

18
Functional green infrastructure in a new housing development in Rieselfeld, Freiburg; incorporating walking and cycling routes, and a swale to collect and convey surface water and provide benefits for wildlife as part of the Sustainable Drainage System
1 OverarchingActions
Green infrastructure provides a number of services which help to combat climate change. Whilst we can take actions to provide a particular service, it is essential to exploit the multifunctionality of green infrastructure wherever possible, and to work in partnership and with local communities in order to achieve this. Green infrastructure should be seen as a critical infrastructure, like roads or waste disposal, and, as such should be well planned and maintained, and viewed as integral to new development27. Existing green infrastructure should be better managed for the range of services it provides.
For other good practice see:
GRaBS case study database, showcasing adaptation approaches, with a particular emphasis on green infrastructure www.grabs-eu.org/casestudies.php
The Vauban and Rieselfeld districts in Freiburg, Germany have incorporated functional green infrastructure into development www.fwtm.freiburg.de/servlet/PB/show/1199617_l2/GreenCity.pdf
Case studies are included as part of a briefing guide for the North West of England on adapting to climate change impacts on buildings, neighbourhoods and cities www.climatechangenorthwest.co.uk/assets/_files/documents/jun_10/cli__1276873159_Adaptation_Built_Env.pdf
27. Natural Economy Northwest. Green Infrastructure Prospectus. www.ginw.co.uk/resources/Prospectus_V6.pdf; Commission for Architecture and the Built Environment (2010). Grey to Green: How we shift funding and skills to green our cities. www.cabe.org.uk/publications/grey-to-green
Case Study 1 (North West of England)
Adaptation Action Planning Tool
This online tool was developed through the GRaBS project. It allows users to assess potential risks and vulnerabilities to climate change by overlaying different map layers and reading the information notes provided. It is intended for use by both professionals to increase awareness and aid decision making, and to increase community awareness of climate change impacts.
www.ginw.co.uk/climatechange/assessmenttool Case Study 2 (North West of England)
Community Climate Change Adaptation Training
This training is intended for use by professionals with community groups to engage them on the need for climate change adaptation and/or how their local green infrastructure helps to adapt their neighbourhood to climate change. There are a range of activities (including the use of the tool in Case Study 1) that can be used depending on the groups’ prior knowledge and interests.
www.ginw.co.uk/climatechange/training Case Study 3 (North West of England)
Green Infrastructure Toolkit
This toolkit helps developers to determine their ‘Green Infrastructure Score’ and interventions to maximise benefits, as part of the Northwest Regional Development Agency’s Sustainability Policy for the Built Environment. The ‘Green Infrastructure Score’ assigns factors to different surface types; these are multiplied by the area of each and summed; the total is divided by the site area to give the score, which must reach a target level. The approach is adapted from Malmö’s ‘Green Space Factor’, Berlin’s ‘Biotope Area Factor’ (also used in other German cities), and Seattle’s ‘Green Factor’. Through the GRaBS project, the London Borough of Sutton and Southampton City Council have been exploring incorporating such an approach into their planning policies.
www.ginw.co.uk/climatechange/gi_toolkit

19
1. Overarching actions P D N Partner Mechanism
a. To champion this Framework and seek to embed it in the broadest range of relevant policies, strategies, plans, programmes and initiatives within Cheshire, Cumbria, Greater Manchester, Lancashire, and Merseyside. This includes in organisations own work and advocating its inclusion in the work of others. All organisations to undertake a gap analysis to see which actions they are already working on and which are currently being missed (this should feed into monitoring; see action 1j).
All
Sub-Regional GI Partnerships
Local Enterprise Partnerships
Local Authorities
Environment Agency
Forestry Commission
Natural England
United Utilities
GI Unit
All Strategies, Policies, Plans, Programmes and Initiatives
Sub-Regional GI Frameworks
Local Enterprise Partnership Policies
Local Development Frameworks
Neighbourhood, Parish and Town Plans
Corporate Plans
b. Professional stakeholder training on the role of green infrastructure in combating climate change and engagement on their role in delivering this Framework. This includes stakeholders who are working to deliver actions, and others who may be less engaged with the agenda. Training should be tailored to be appropriate to different stakeholders, with generic training (e.g. green infrastructure and climate change adaptation training developed by Community Forests Northwest and Groundwork; and making use of the ‘Adaptation Action Planning Tool’ developed through the GRaBS project (Case Study 1)) as well as training on specific themes (e.g. Sustainable Drainage Systems training by the Construction Industry Research and Information Association, low carbon fuels and materials).
Sub-Regional GI Partnerships
GI Unit
Groundwork
Wildlife Trusts
Environment Agency
Natural England
Local Authorities
Improvement Network
CPRE
RTPI
CIRIA
Sub-Regional GI Frameworks
Professional Networks
NW Forestry Framework
NW Forum for the Built Environment
c. Wider community training and awareness raising on the role of green infrastructure in combating climate change and their role in delivering this Framework (Case Study 2). This includes individual businesses, schools, land owners, managers and farmers, hard to reach and deprived communities, young people, and faith communities. Training should be tailored to be appropriate to the audience and cover as wide a range of services as appropriate. Opportunities should be taken to raise awareness in conjunction with the delivery of the other actions (see action 1d).
GI Unit
Groundwork
Local Authorities
Schools
Environment Agency
Faiths4Change
BTCV
Community Service Volunteers
CPRE
Garden Trusts
Keep Britain Tidy
Community and 'Friends of' Groups
Community Adaptation Training
Forest Schools
Eco Schools
Town, Parish and Neighbourhood Plans
Green Flag Awards

20
1. Overarching actions P D N Partner Mechanism
d. All green infrastructure interventions should seek to: optimise other green infrastructure services by involving appropriate partners; be carefully designed and managed to ensure that services are compatible with each other (e.g. Figure 1) and take into account other considerations (e.g. landscape character, ecological sensitivities); make provisions for long term management; engage and involve local communities (see action 1c) to gain support and ownership (e.g. through consultation, volunteering and practical delivery, information at visitors centres, interpretation boards and events). Refer to UK and international best practice.
All
Local Authorities
Developers
Community and 'Friends of' Groups
Wildlife Trusts
BTCV
CPRE
Community Service Volunteers
Sub-Regional GI Frameworks
Local Development Frameworks
CIL, S106, Planning Conditions
GI, Open Space and Tree Strategies/Plans
Sustainable Community Strategies
Neighbourhood, Parish and Town Plans
Management Plans
e. Sub or city-regions to select an area of strategic importance to act as an exemplar, showcasing partnership working and community engagement to deliver multi-functional green infrastructure, with optimised climate change services. The ‘Delivering the Framework for Action’ section lists suggested areas to use as a starting point. Criteria for refining this could include that it: is important for a number of climate change services (Map 1 or local data), is subject to development or significant investment (Map 1 or local data), has potential to address other issues that green infrastructure can help resolve (e.g. see ‘pinch point study’28), ties in with public agency priorities for investment and capital spend, has existing partnerships.
All
Sub-Regional GI Partnerships
Local Enterprise Partnerships
Local Authorities
Environment Agency
Forestry Commission
Natural England
United Utilities
GI Unit
Developers
Sub-Regional GI Frameworks
Natural Economy Investment Forum
Regional Growth Fund
Capital Spend
f. Target interventions to areas where the highest number of services are considered important (Map 1 or local data) in order to maximise climate change multi-functionality. Or, if a particular service is to be prioritised higher than the others, target interventions to areas where this is considered the most important (e.g. see other maps presented in this Framework and the ‘Adaptation Action Planning Tool’ (Case Study 1)).
All
Sub-Regional GI Partnerships
Local Enterprise Partnerships
Local Authorities
Environment Agency
Forestry Commission
Natural England
United Utilities
GI Unit
Sub-Regional GI Frameworks
Natural Economy Investment Forum
Regional Growth Fund
Capital Spend
28. North West Green Infrastructure Unit (2010). Green Infrastructure Solutions to Pinch Point Issues in North West England: How can green infrastructure enable sustainable development? www.ginw.co.uk/resources/GI_solutions_to_pinch_point_issues_in_NW_England_-_Exec_Summary.pdf

21
1. Overarching actions P D N Partner Mechanism
g. Double woodland cover in the North West of England by 2050, including native woodlands. New woodland should be located, designed and sustainably managed to provide the range of services presented in this Framework (see actions 1d and 1f ), as well as providing other benefits. Landscape character areas and land use types should help determine the appropriate amounts of woodland cover. The Ecological Site Classification software developed by Forest Research could guide tree species selection and appropriate woodland communities for sites.
NWFF Partnership
Forestry Commission
Woodland Trust
Woodland Initiatives
Land Owners and Managers
BTCV
Local Authorities
Businesses
NW Forestry Framework
Environmental Stewardship and EWGS
MOREwoods
Local Development Frameworks
CIL, S106, Planning Conditions
Neighbourhood, Parish and Town Plans
Big Tree Plant
Ecological Networks and Restoration Zones
Integrated Biodiversity Delivery Areas
h. Strengthen planning policies to ensure development and restructuring includes functional green infrastructure. In Local Development Frameworks, include a green infrastructure policy in the Core Strategy supported by a green infrastructure Supplementary Planning Document; work towards ensuring green infrastructure is identified as an infrastructure and funding recipient through the CIL. Green infrastructure policies should: aim for no net loss; safeguard green infrastructure where it is most needed; seek to increase it where it is most needed (e.g. creating new green spaces, street tree planting, and green roofs and walls); seek to improve its functionality where most needed; engage local communities; make provisions for its long term management (Map 1 and local data can help identify what is needed). One approach is to develop the ‘Green Infrastructure Score’ method (Case Study 3) and promote its incorporation into planning policy. Also refer to other actions for which Local Development Frameworks have been listed as a mechanism.
Local Authorities
GI Unit
Natural England
Woodland Trust
TCPA
RTPI
Local Development Frameworks
CIL, S106, Planning Conditions
Neighbourhood, Parish and Town Plans
GI, Open Space and Tree Strategies/Plans
ANGSt and Woodland Access Standard
i. Collect and regularly update GIS data on urban and rural green infrastructure, including quantity, types, functions, and where it is needed for different socio-economic and environmental reasons (N.B. there is potential for this to be automated as it has been for Liverpool City Region). This can support a range of actions including 1e, f, g, h and j.
Sub-Regional GI Partnerships
Local Authorities
GI Unit
Sub-Regional GI Frameworks
GI, Open Space and Tree Strategies/Plans
j. Monitor and review delivery of actions, their effectiveness and the economic case for them (e.g. making use of the Green Infrastructure Valuation Toolkit www.bit.ly/givaluationtoolkit); setting targets for delivery as appropriate. This could include using existing and setting up new monitoring networks (e.g. establishing long term temperature monitoring stations in urban areas, monitoring visitor numbers and perceptions, Sustainable Catchment Management Programme monitoring). The gap analysis (see action 1a) undertaken by all partners could feed into this. Development of an online version of the Framework which includes a review of delivery could be useful, as well as ongoing support at a pan-authority level.
Sub-Regional GI Partnerships
GI Unit
Environment Agency
Natural England
United Utilities
Green Space NW
Biodiversity Partnerships
CPRE
Academic Institutions
Local Authorities
Sub-Regional GI Frameworks
Local Development Frameworks
Biodiversity Action Reporting System
i-trees
Adaptation Reporting Power
SCaMP
GI Forum

22
dummy_footnote_28_to_correct_numbering
Map 1. Number of services considered important; the map on the right hand side shows areas that may be subject to development and restructuring29
28.29. This map indicates where green infrastructure may be most important for its climate change services. It does not weight the importance of these services in relation to each other. It also does not map the actual occurrence of green infrastructure within these areas. The services included in the mapping are: managing surface water, managing high temperatures, carbon storage and sequestration, managing riverine flooding, food production, providing low carbon fuels, reducing the need to travel by car, helping other species adapt, managing visitor pressure, reducing soil erosion, managing coastal flooding (material substitution and managing water supply were not mapped). The map is amended from Figures 22 and 26 in Section 5 of the report www.ginw.co.uk/climatechange/report.
Reproduction from the Ordnance Survey mapping with permission of Her Majesty’s Stationery Office
© Crown Copyright. Unauthorised reproduction infringes the Crown
Copyright and may lead to prosecution or civil proceedings.
TMF license No. 100031461 (2010).
Number of services considered important

23
2 Managing Surface Water
Surface water and flooding from overwhelmed sewers is becoming more common as a result of urbanisation and more extreme rainfall events with climate change. It has significant economic, social and environmental costs. Green infrastructure, as part of a Sustainable Drainage System (SuDS), has a substantial role to play in reducing this flood risk30. It reduces the rate and volume of water entering the drains by intercepting it, providing temporary and permanent storage areas, and allowing water to infiltrate into the ground rather than being directed to drains. Managing surface water is closely linked to managing riverine flooding (Section 5). For other good practice see:
The Stamford Brook development in Altrincham incorporated Sustainable Drainage Systems http://showcase.homesandcommunities.co.uk/case-study/stamford-and-sinderland-brook.html#the-project
Anglian Water have produced guidance on the use of Sustainable Drainage Systems and an overview of their adoption policy www.anglianwater.co.uk/_assets/media/SUDS_LEAFLET_-_AW162.pdf
London’s Housing Design Guide includes a policy on the inclusion of Sustainable Drainage Systems in new development www.lda.gov.uk/Documents/London_Housing_Design_Guide_interim_August_2010_9460.pdf
30. Construction Industry Research and Information Association (2007). The Sustainable Drainage Systems Manual. www.ciria.org.uk/suds/publications.htm
Case Study 4 (Cambridge)
Sustainable Drainage: Design and Adoption Guide
This guide is for use by developers where they are seeking adoption of Sustainable Drainage Systems by Cambridge City Council within the public open space of new developments. It sets out the design and adoption requirements, in order to ensure a smooth and satisfactory process. It is also useful to all involved in the design, construction and future maintenance of any adoptable Sustainable Drainage Systems, including developers, engineers, landscape designers, architects, urban designers, development control and other officers and maintenance teams. The introductory sections cover the broader issues involved in designing a Sustainable Drainage System, whilst the latter sections focus on Sustainable Drainage Systems features, describing them, highlighting issues and solutions, maintenance requirements and costs.
www.cambridge.gov.uk/public/docs/SUDS-Design-and-Adoption-Guide.pdf
Pond in communal green space as part of the Sustainable Drainage Systems features in Rieselfeld, Freiburg

24
2. Actions for managing surface water P D N Partner Mechanism Service
a. Provide stronger planning policy requiring new developments and restructuring to use Sustainable Drainage Systems where appropriate and feasible, putting in place a suitable train of Sustainable Drainage Systems techniques to manage surface water effectively so that flood risk is not passed on to other areas. Preference should be given to above ground Sustainable Drainage Systems techniques, which have wider green infrastructure benefits. Follow emerging best practice for the design, adoption and long term management of Sustainable Drainage Systems (e.g. Case Study 4, forthcoming guidance from United Utilities, and National Standards).
Local Authorities
Environment Agency
United Utilities
TCPA
RTPI
Developers
Local Development Frameworks
Strategic Flood Risk Assessments
Surface Water Management Plans
CIL, S106, Planning Conditions
Local Biodiversity Action Plans
SuDS Design and Adoption Guide
Temps
River flood
Species
Water resources
b. Target areas (Map 2 or local data) to retrofit Sustainable Drainage Systems into existing green infrastructure and to create new green infrastructure for its role in surface water management. Take all other opportunities that arise to increase this functionality in existing and new green infrastructure.
Local Authorities
Environment Agency
United Utilities
Woodland Initiatives
Faiths4Change
BTCV
Woodland Trust
Surface Water Management Plans
Green Streets
i-trees
Local Development Frameworks
CIL, S106, Planning Conditions
Big Tree Plant
MOREwoods
Temps
River flood
Species
Water resources
c. Safeguard green infrastructure (including private gardens) which occurs in areas where soils have high infiltration rates (e.g. sandier soils), and avoid development here where possible.
Local Authorities
Developers
Local Development Frameworks
GI, Open Space and Tree Strategies/Plans
Masterplans
Neighbourhood, Parish and Town Plans
Temps
River flood
Species
Water resources
d. Strengthen planning policy to require, or encourage, green roofs on all new buildings with flat roofs. Require design to be suitable for biodiversity. Green roofs are compatible with solar panels (Case Study 14).
Local Authorities
Natural England
TCPA
RTPI
Local Development Frameworks
Environmental Stewardship and EWGS
Neighbourhood, Parish and Town Plans
Temps
River flood
Species
Water resources
e. Reduce the amount of surface water entering sewers by diverting it to water courses (prior permission required from the Environment Agency or British Waterways) or using Sustainable Drainage Systems techniques such as soakaways (take advice from Local Authorities as to building regulations and planning permission), or increasing green infrastructure on site. You may be able to claim a reduction in wastewater charges from United Utilities (www.unitedutilities.com/surfacewater).
Land Owners and Managers
Businesses
Schools
Environment Agency
United Utilities
British Waterways
Local Authorities
Wastewater Charges Temps
River flood
Species
Water resources
Also see actions 1a-j, 3a-d, 5b, 6b, 7a-b, 9a-b, 10b, 11f, 12a, and 13a-b which deliver this service.

25
Map 2. Number of properties at risk of surface water flooding31
31. A version of this map can be viewed as part of an Adaptation Action Planning Tool (Case Study 1) developed through the GRaBS project; available from www.ginw.co.uk/climatechange/assessmenttool. (Navigate to GRaBS Partners > NW England > Hazards > Properties at risk from surface water flooding (large settlements) / Properties at risk from surface water flooding (small settlements)). The data used was provided by Defra www.defra.gov.uk/environment/flooding/documents/manage/surfacewater/sw-settlement-order.pdf; ‘properties’ includes all buildings with an address point, so this refers to residential, retail and business units.
Reproduction from the Ordnance Survey mapping with permission of Her Majesty’s Stationery Office
© Crown Copyright. Unauthorised reproduction infringes the Crown
Copyright and may lead to prosecution or civil proceedings.
TMF license No. 100031461
No. of properties at risk per km2
Total no. of properties at risk (in smaller settlements)
Regional centres, towns and cities dataset taken from the Regional Spatial Strategy p16 (Figure 1d) Number of properties at risk of
flooding dataset supplied by Defra

26
Case Study 5 (Greater Manchester and Merseyside)
Green Streets
This community greening project aims to increase urban tree cover for a variety of reasons including urban cooling. It includes street tree planting, creating green alleyways and walls, and installing water butts to collect water for the trees. Much of the work is in high density and deprived urban areas
www.redroseforest.co.uk/web/content/view/43/143/ www.merseyforest.org.uk/greenstreets Case Study 6 (Berlin, Germany)
Digital Environmental Atlas
This online atlas presents maps and information on a range of environmental topics, and aids urban planning and landscape development. A 'climate function' map defines spaces according to the climatic impact they have on other areas and an evaluation of the impact of any structural change on this. It combines a green and open space inventory, settlement areas, traffic related air pollution, and information on air exchanges. This is then translated into a 'planning advice' map, guiding protection and development in order to improve the climate and air quality (e.g. link open spaces, increase vegetation for ventilation, align new development with wind channels).
www.stadtentwicklung.berlin.de/umwelt/umweltatlas/edin_411.htm
3 Managing High Temperatures
Increased temperatures will exacerbate the urban heat island effect, with consequences for health and well-being, and for the economic vitality of town and city centres. For example, the 2006 heatwave resulted in 60 extra deaths (a 15% increase) in the North West of England32. It is estimated that the 2003 heatwave claimed 35,000 lives across Europe, and that such temperatures may be normal by the 2050s and cool by the end of the century33. Among the most vulnerable are the elderly, people with severe illnesses and people who cannot adapt their behaviour to keep cool (e.g. young children).
Green infrastructure helps manage temperatures by providing evaporative cooling, shading, and allowing air to flow into urban areas. A study in Greater Manchester found that increasing green cover by 10% in the most built up areas could help to keep surface temperatures at levels similar to in 1961-1990 until the end of the century34. This also reduces the need for air conditioning, so helps to mitigate climate change. Whilst overheating is less of a concern in rural areas, adequate tree shade is still desirable.
For other good practice see:
The i-trees project in Manchester combines tree planting, green roofs and green walls and the installation scientific monitoring equipment to try to better understand the role of green infrastructure in combating climate changewww.redroseforest.co.uk/web/content/view/228/366
The Trees and Design Action Group’s 2008 publication ‘No Trees, No Future: Trees in the Urban Realm’ looks in particular at guidelines for incorporating large trees into new development www.forestry.gov.uk/pdf/london-tdag-no-trees-no-future-with-cs.pdf/$FILE/london-tdag-no-trees-no-future-with-cs.pdf
32. Department of Health (2010). Heatwave Plan for England.www.dh.gov.uk/prod_consum_dh/groups/dh_digitalassets/@dh/@en/@ps/documents/digitalasset/dh_114423.pdf 33. Stott et al (2004). Human contribution to the European heatwave of 2003. Nature, 432 (7017), 610-614.34. Gill et al (2007). Adapting cities for climate change: the role of the green infrastructure. Built Environment, 33 (1), 115-133. This study was part of the Adaptation Strategies for Climate Change in Urban Environments (ASCCUE) project. www.sed.manchester.ac.uk/research/cure/research/asccue
Green Streets project in Ellesmere Port, Cheshire West (Photo: McCoy Wynne)

27
3. Actions for managing high temperatures P D N Partner Mechanism Service
a. Strengthen planning policy to aim for a 10% increase in green infrastructure in areas at greatest risk for the urban heat island (e.g. built up areas, vulnerable communities). This can be through the creation of new green spaces, street tree planting, and the creation of green roofs and walls. Such an increase helps keep surface temperatures at current levels until the end of the century in the most built up areas (see Gill et al 2007).
Local Authorities
TCPA
RTPI
Local Development Frameworks
CIL, S106, Planning Conditions
GI, Open Space and Tree Strategies/Plans
Neighbourhood, Parish and Town Plans
Surface water
Species
b. Target areas (Map 3 or local data) to protect existing green infrastructure, create new green infrastructure, and increase tree cover (including large trees) in streets (Case Study 5) and open spaces in order to provide shade and cooling. Target areas include neighbourhoods with vulnerable populations to heat stress, areas with low levels of green infrastructure at present, and places where people work and gather (e.g. town and local centres, transport hubs, tourist destinations, etc).
Local Authorities
Health Sector
Woodland Initiatives
Housing Associations
BTCV
Woodland Trust
Green Streets
i-trees
Local Development Frameworks
CIL, S106, Planning Conditions
GI, Open Space and Tree Strategies/Plans
Big Tree Plant
MOREwoods
Local Transport Plans
Neighbourhood, Parish and Town Plans
Surface water
Carbon
Species
Visitor
c. Manage existing large canopied trees for their provision of shade. Also take opportunities, including through new development, to plant trees which will have large canopies when they mature. This is especially important in areas set out in action 3b.
Local Authorities
Woodland Initiatives
BTCV
Woodland Trust
TCPA
RTPI
Local Development Frameworks
CIL, S106, Planning Conditions
GI, Open Space and Tree Strategies/Plans
Neighbourhood, Parish and Town Plans
Tree Preservation Orders
Big Tree Plant
MOREwoods
Surface water
Carbon
Species
d. Gather data on wind direction and air flows into cities and larger towns, especially under temperature inversions. Use this in conjunction with green infrastructure mapping (see action 1i) to determine the most important parts of the green infrastructure network for cool air flows. This could inform planning policy (e.g. action 3a). This approach is novel for the UK, but is widely used in Europe where there has been a greater need to plan for temperature extremes (Case Studies 6 and 13). It could be used to establish best practice guidance. Where appropriate, align networks with other services for which linear green infrastructure corridors are desirable, e.g. managing surface water (in particular, the use of swales), managing riverine flooding (action 5a), reducing the need to travel by car (action 9b), helping other species adapt (action 10b), and managing coastal flooding (action 14a).
GI Unit
Local Authorities
Research Institutions
TCPA
RTPI
Forestry Commission
Resilience Forums
Sub-Regional GI Frameworks
Local Development Frameworks
Surface water
River flood
Travel
Species
Coastal flood
Also see actions 1a-j, 2a-e, 5a, 6b, 7a-b, 9a-c, 10b, 11a and f, and 13a which deliver this service.

28
Map 3. Urban areas and concentrations of vulnerable populations35
35. A version of this map can be viewed as part of an Adaptation Action Planning Tool (Case Study 1) developed through the GRaBS project; available from www.ginw.co.uk/climatechange/assessmenttool. (Navigate to GRaBS Partners > NW England > Social vulnerability > Vulnerability of people to high temperatures). Vulnerable people were identified by consulting census data (to identify the young and the elderly) and the index of multiple deprivation.
Reproduction from the Ordnance Survey mapping with permission of Her Majesty’s Stationery Office
© Crown Copyright. Unauthorised reproduction infringes the Crown
Copyright and may lead to prosecution or civil proceedings.
TMF license No. 100031461
Census 2001 age structure dataset supplied by Office for National Statistics Indices of Multiple Deprivation dataset supplied by the Department for Communities and Local Government
Vulnerable people in urban areas
Urban areas
29
4 Carbon Storage and Sequestration
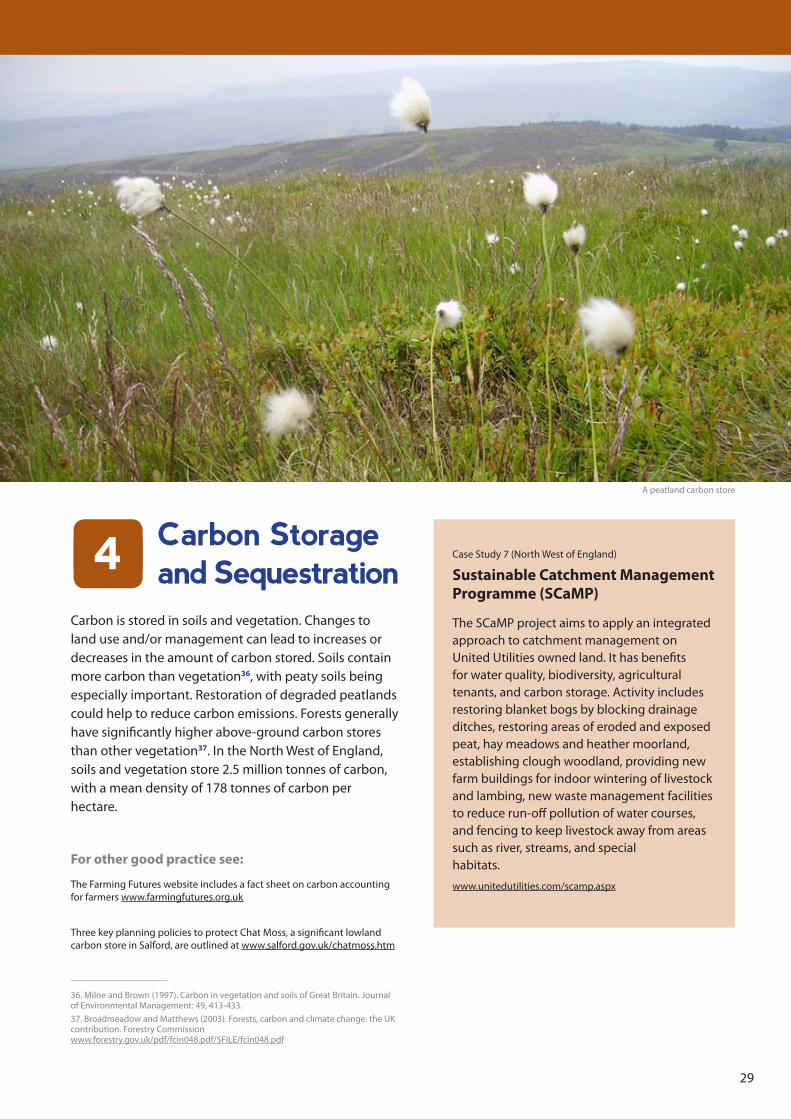
Carbon is stored in soils and vegetation. Changes to land use and/or management can lead to increases or decreases in the amount of carbon stored. Soils contain more carbon than vegetation36, with peaty soils being especially important. Restoration of degraded peatlands could help to reduce carbon emissions. Forests generally have significantly higher above-ground carbon stores than other vegetation37. In the North West of England, soils and vegetation store 2.5 million tonnes of carbon, with a mean density of 178 tonnes of carbon per hectare.
For other good practice see:
The Farming Futures website includes a fact sheet on carbon accounting for farmers www.farmingfutures.org.uk
Three key planning policies to protect Chat Moss, a significant lowland carbon store in Salford, are outlined at www.salford.gov.uk/chatmoss.htm
36. Milne and Brown (1997). Carbon in vegetation and soils of Great Britain. Journal of Environmental Management: 49, 413-433.37. Broadmeadow and Matthews (2003). Forests, carbon and climate change: the UK contribution. Forestry Commission www.forestry.gov.uk/pdf/fcin048.pdf/$FILE/fcin048.pdf
Case Study 7 (North West of England)
Sustainable Catchment Management Programme (SCaMP)
The SCaMP project aims to apply an integrated approach to catchment management on United Utilities owned land. It has benefits for water quality, biodiversity, agricultural tenants, and carbon storage. Activity includes restoring blanket bogs by blocking drainage ditches, restoring areas of eroded and exposed peat, hay meadows and heather moorland, establishing clough woodland, providing new farm buildings for indoor wintering of livestock and lambing, new waste management facilities to reduce run-off pollution of water courses, and fencing to keep livestock away from areas such as river, streams, and special habitats.
www.unitedutilities.com/scamp.aspx
A peatland carbon store

30
4. Actions for carbon storage & sequestration P D N Partner Mechanism Service
a. In areas with the highest carbon densities (Map 4 or local data), which are often on peat soils, avoid new development and land management change that would result in soil carbon losses (e.g. agricultural change such as grassland to tillage or arable). Embed within planning policy and decision making. Offset any carbon lost by increasing or managing carbon stores elsewhere (see actions 4b and 4c).
Local Authorities
Developers
Natural England
Farmers
Local Development Frameworks
CIL, S106, Planning Conditions
Neighbourhood, Parish and Town Plans
Ecological Networks and Restoration Zones
Environmental Stewardship and EWGS
Integrated Biodiversity Delivery Areas
SCaMP
River flood
Food
Species
Water resources
b. Target areas to manage existing significant carbon stores (Map 4 or local data), including stopping peat extraction (e.g. for use in the horticulture industry; finding alternatives such as reusing organic waste), habitat restoration and creation (Case Study 7).
Natural England
Forestry Commission
Land Owners and Managers
Wildlife Trusts
Peatland Projects
NW Forestry Framework
Environmental Stewardship and EWGS
Ecological Networks and Restoration Zones
Integrated Biodiversity Delivery Areas
SCaMP
Local Biodiversity Action Plans
River flood
Food
Material
Species
Erosion
Water resources
c. Manage green infrastructure to increase the amount of carbon stored and reduce greenhouse gas emissions, aiming for net removal of carbon wherever possible. Make use of existing and emerging carbon calculators (e.g. www.forestry.gov.uk/fr/INFD-633DJ4 and www.cla.org.uk/Policy_Work/CALM_Calculator).
Farmers
Natural England
FWAG
Land Owners and Managers
Forestry Commission
Local Authorities
Low Carbon Farming Pilot
Environmental Stewardship and EWGS
SCaMP
Food
Material
Fuel
Species
Also see actions 1a-j, 3b-c, 5b, 6b, 7a-b, and 10a-b which deliver this service.

31
Map 4. Carbon density (blue areas are greater than the mean of 178 tonnes of carbon per hectare)
Reproduction from the Ordnance Survey mapping with permission of Her Majesty’s Stationery Office
© Crown Copyright. Unauthorised reproduction infringes the Crown
Copyright and may lead to prosecution or civil proceedings.
TMF license No. 100031461
National carbon dataset supplied by R. Milne, Centre for Ecology and Hydrology
Carbon Density (tonnes of carbon per hectare)

32
5Managing Riverine Flooding
River flooding can have severe negative impacts: damaging property, affecting health and well-being, and having significant economic costs. With more extreme rainfall events anticipated with climate change we are likely to experience increased flooding. Whilst flooding cannot be wholly prevented, its impacts can be reduced. Green infrastructure helps to manage river flooding by reducing the volume of runoff (e.g. by intercepting rain, and providing storage areas to hold water in the catchment and on floodplains), by promoting water infiltration into the soil and slowing runoff to streams, and by delaying the downstream passage of flood flows (and hence the timing of peak flows)38. Managing riverine flooding is closely linked to managing surface water (Section 2).
For other good practice see:
This guide for developers from the Environment Agency provides a number of good practice examples of managing flooding www.environment-agency.gov.uk/static/documents/Leisure/1_GETH1106BLNE-e-e(1).pdf
This report reviews a number of catchment scale river restoration projects in the UK www.therrc.co.uk/pdf/Publications/Catchment_report_Jan05.pdf
The London Rivers Action Plan is a good example of a plan to take forward river restoration www.therrc.co.uk/lrap/lplan.pdf
Centenary Riverside Wetland Nature Park in Rotherham www.wildscapes.eu/our-projects/all-projects/centenary-riverside-wetland-nature-park.html
38. Thomas and Nisbet (2006). An assessment of the impact of floodplain woodland on flood flows. Forest Research. Water and Environment Journal. 21, 114–126; Handley and Gill (2009). Woodlands helping society to adapt. In Read et al (2009) Combating climate change: a role for UK forests. www.tsoshop.co.uk/gempdf/Climate_Change_Main_Report.pdf; Broadmeadow and Nisbet (2010). Opportunity Mapping for Woodland to Reduce Flooding in the River Derwent, Cumbria. Forest Research. www.forestry.gov.uk/pdf/Derwent_flooding_final_report_2010.pdf/$FILE/Derwent_flooding_final_report_2010.pdf; Woodland Trust (2008). Woodland actions for biodiversity and their role in water management. www.woodlandtrust.org.uk/SiteCollectionDocuments/pdf/woodswater26_03-08.pdf
Case Study 8 (Pickering, North Yorkshire)
Slowing the Flow
This project is exploring flood management which works with nature to store more water in the landscape and slow its passage downstream. It is expected to reduce the frequency of floods, and deliver benefits to the local environment and community. Landscape management measures employed throughout the catchment include constructing low level bunds, planting trees (especially along streams and in the floodplain), and restoring woody debris dams and wetlands.
www.forestry.gov.uk/fr/INFD-7YML5R Case Study 9 (London)
River Quaggy
This river was de-culverted as part of a flood management scheme. This has created a natural, meandering, wildlife-rich feature in Sutcliffe Park, Greenwich which can be temporarily flooded (and closed to the public). This reduces the downstream flood risk to Lewisham town centre. Since restoration visits to the park have increased by 73%. Downstream, in a denser urban area, the river banks have been re-naturalised at Chinbrook Meadows, which helps to protect a new housing development from flooding.
www.environment-agency.gov.uk/static/documents/Business/casestudyrecreation_1514776.pdf
Restoration of the River Quaggy in Sutcliffe Park, Greenwich

33
5. Actions for managing riverine flooding
P D N Partner Mechanism Service
a. Where possible, use land in areas at risk of flooding (see Map 5 or local data) as open space and make provision for temporary water storage within it. Use the sequential test of Planning Policy Statement 25 to decide on the most appropriate land uses in flood risk areas, along with flood sensitive design.
Local Authorities
Environment Agency
Land Owners and Managers
Developers
Local Development Frameworks
Neighbourhood, Parish and Town Plans
Strategic Flood Risk Assessments
Catchment Flood Management Plans
Masterplans
Ecological Networks and Restoration Zones
Integrated Biodiversity Delivery Areas
NW River Basin Management Plan
Temps
Travel
Species
Coastal flood
b. Encourage appropriate land use and management, including agricultural practices, in the upper catchments of rivers to reduce flood risk (Map 5 or local data) and impacts of spate flows, reduce soil erosion (Map 10 or local data) and maintain base flows to rivers. This will include intercepting, holding, and infiltrating water upstream through peatland restoration, wetland creation, tree and woodland creation (targeted to buffers around riverbanks and floodplains, bare and eroding mineral soils, and field margins), and use of techniques such as willow spilling, where appropriate (Case Studies 7, 8 and 17). Continued monitoring of programmes to determine their effectiveness. This will require significant cross-boundary working and consultation with the Environment Agency to ensure that natural river processes are not impacted and activity helps to achieve Good Ecological Status under the Water Framework Directive. Potentially develop mechanisms to financially link downstream development with upstream flood management activities, including land acquisition where desirable.
Environment Agency
Forestry Commission
Woodland Initiatives
Local Authorities
Land Owners and Managers
Woodland Trust
Natural England
United Utilities
National Parks Authorities
Landscape Partnerships
AONBs
Farmers
FWAG
National Farmers’ Union
Woodland Initiatives
BTCV
Catchment Flood Management Plans
Local Biodiversity Action Plans
Local Development Frameworks
CIL, S106, Planning Conditions
Neighbourhood, Parish and Town Plans
Environmental Stewardship and EWGS
Catchment Sensitive Farming
Ecological Networks and Restoration Zones
Integrated Biodiversity Delivery Areas
Sub-Regional GI Frameworks
NW River Basin Management Plan
SCaMP
Management Plans
Peatland Projects
MOREwoods
Single Payment Scheme
Big Tree Plant
Surface water
Carbon
Food
Species
Erosion
Water resources
c. Identify and prioritise river stretches for rehabilitation and restoration (e.g. reconnecting rivers to their floodplains). Take opportunities to de-culvert and re-naturalise rivers to provide space for water as well as wildlife, including floodplain forestry, wet meadows, and saltmarsh (Case Studies 9 and 19).
Environment Agency
Forestry Commission
Developers
Local Authorities
Woodland Initiatives
Local Development Frameworks
Neighbourhood, Parish and Town Plans
Ecological Networks and Restoration Zones
Integrated Biodiversity Delivery Areas
Environmental Stewardship and EWGS
Water Framework Directive
NW River Basin Management Plan
Species
Water resources
Also see actions 1a-j, 2a-e, 3d, 4a-b, 6b, 7a, 9b, 10a-b, 12a, and 13b which deliver this service.

34
Map 5. Flood zones in relation to Catchment Flood Management Plan policy units39
39. A version of this map can be viewed as part of an Adaptation Action Planning Tool (Case Study 1) developed through the GRaBS project; available from www.ginw.co.uk/climatechange/assessmenttool. (Navigate to GRaBS Partners > NW England > Hazards > Flood Zone 3 / Flood Zone 2 / Catchment Flood Management Plan Policy Units / River Catchments). This map includes both fluvial and tidal flood risk.
Reproduction from the Ordnance Survey mapping with permission of Her Majesty’s Stationery Office
© Crown Copyright. Unauthorised reproduction infringes the Crown
Copyright and may lead to prosecution or civil proceedings.
TMF license No. 100031461
Flood zone and Catchment Flood Management Plan policy unit datasets
supplied by the Environment Agency
1
2
3
4
5
6
1: No active intervention (including flood warning and maintenance). Continue to monitor and advise.
2: Reduce existing flood risk management actions (accepting that flood risk will increase over time).
3: Continue with existing or alternative actions to manage flood risk at the current level (accepting that flood risk will increase over time from this baseline).
4: Take further action to sustain current scale of flood risk into the future (responding to the potential increases in flood risk from urban development, land use change, and climate change).
5: Take further action to reduce flood risk (now and/or in the future).
6: Take action to increase the frequency of flooding to deliver benefits locally or elsewhere (which may constitute an overall flood risk reduction, for example for habitat inundation).
Policy unit

35
6Food Production
Food production is essential, yet can, if poorly managed, have significant deleterious effects in terms of greenhouse gas emissions, soil erosion, water pollution, and wildlife. These impacts arise from what is farmed, and how it is farmed, processed, and transported. Using the best quality land for food production and managing this land in a sensitive way will ensure our food security into the future. Altered farming methods can also help to reduce emissions associated with agriculture, including storing more carbon within soils. In addition, increased production within urban areas has a part to play in reducing food miles.
For other good practice see:
The Farming Futures website includes a range of information about farming and climate change www.farmingfutures.org.uk
The Wildlife Trust for Lancashire, Manchester and North Merseyside has a series of community food growing projects www.lancswt.org.uk/index.php/community-projects.php
Faiths4Change support community food growing, for example through the ‘Simply Living’ Eco-Parents Support Network www.faiths4change.org.uk/liverpool.html
Case Study 10 (London)
Capital Growth
The Capital Growth project aims to help Londoners transform the capital by creating 2,012 new food growing spaces by the end of 2012. It gives advice and support to local communities and helps them to access land and create food growing spaces. Projects receive a London wide support network, access to funding and discounts, recognition, and access to expertise in food growing. At Charlton Manor Primary School in Greenwich, disused parts of the grounds have been transformed into vegetable and fruit gardens. These were designed by the children, and include willow tunnels, seating areas, a greenhouse and a beehive. Children are involved on a daily basis, in their lunch time gardening club, and as a part of lessons. Parents and staff help with planting, maintaining and harvesting the crops.
www.capitalgrowth.org/home
Moss Lane allotment in Southport (Photo: McCoy Wynne)

36
6. Actions for food production P D N Partner Mechanism Service
a. Safeguard the ‘best and most versatile’ agricultural land (Map 6 or local data) from development and restructuring, and promote its use for food production. Where possible, direct competing land uses to other land.
Local Authorities
National Farmers’ Union
Local Development Frameworks
Neighbourhood, Parish and Town Plans
Single Payment Scheme
b. Follow emerging advice and best practice (e.g. Farming Futures) on adapting agricultural practices for climate change, including storing water on farms to reduce flooding and for use during droughts, changing crop types, and the provision of field and hedgerow trees and copses to provide shade for livestock. Ensure that agricultural land plays its full role in providing other services.
National Farmers Union
Farmers
FWAG
Natural England
Environment Agency
Forestry Commission
Catchment Sensitive Farming
Environmental Stewardship and EWGS
Energy Crops Scheme
Surface water
Temps
Carbon
River flood
Species
Erosion
Water resources
c. Develop planning policies to support urban food production. Take opportunities, including through new development and restructuring, to encourage and incorporate urban food production, through the creation of allotments, community farms and gardens, inclusion of fruit trees and bushes into urban design, and including ‘meanwhile’ and temporary uses of land.
Local Authorities
Community and 'Friends of' Groups
Developers
Faiths4Change
BTCV
Local Development Frameworks
CIL, S106, Planning Conditions
Neighbourhood, Parish and Town Plans
GI, Open Space and Tree Strategies/Plans
Big Tree Plant
Travel
d. Encourage community and home food growing, through practical work and awareness raising programmes, including in schools, faith-based land, allotments and parks (Case Study 10).
Local Authorities
Schools
Groundwork
BTCV
Community and ‘Friends of’ Groups
Faiths4Change
Wildlife Trusts
Transition Town Initiatives
Keep Britain Tidy
Forest Schools
School Food Growing Programmes
RHS Schools Gardening Scheme
Eco Schools
Neighbourhood, Parish and Town Plans
Also see actions 1a-j, 4a-c, 5b, 7b-c, and 9c which deliver this service.

37
Map 6. Best and most versatile agricultural land40
40. It should be noted that agricultural land classification may alter in a changed climate as climatic and soil conditions change, this map is based on current climate and land use data.
Reproduction from the Ordnance Survey mapping with permission of Her Majesty’s Stationery Office
© Crown Copyright. Unauthorised reproduction infringes the Crown
Copyright and may lead to prosecution or civil proceedings.
TMF license No. 100031461Agricultural land classification dataset supplied by Defra
Grade 1
Grade 2
Other high likelihood best and most versatile land
Agricultural land classification

38
7 Material Substitution
The production and manufacture of materials, particularly those used in construction, is associated with high greenhouse gas emissions. Forests can be managed and harvested for timber and wood products which can replace more energy intensive construction materials including concrete and steel. By using wood products, carbon is also stored in buildings. Other natural and renewable materials include wood fibre, hemp, and sheep’s wool41. Locally grown and sourced products can help to reduce transport emissions and to protect the world’s rainforests42.
For other good practice see:
Blackburn with Darwen Council are working on a project ‘Achieving Sustainable Procurement’ to produce a set of environmental criteria for public sector bodies, to improve the environmental sustainability of services whilst remaining within the bounds of procurement legislation and regulation www.climatechangenorthwest.co.uk/local-partnerships-small-projects-fund.html
41. The UK's National Centre for Biorenewable Energy, Fuels and Materials www.nnfcc.co.uk; www.decc.gov.uk/en/content/cms/what_we_do/uk_supply/energy_mix/renewable/explained/bioenergy/materials/construction/construction.aspx42. For example, see www.rainforest-alliance.org
Case Study 11 (Sefton coast)
Woodland Management
Sefton’s woodlands are managed by the Council’s Coast and Countryside Service. Trees felled as part of management works are used in the ‘Pinewood workshop’ to manufacture wood products (e.g. engraved signs, benches, way-markers, gates, picnic benches, bird feeders, boardwalks, access barriers, and nest boxes) for use in the borough.
The workshop also provides training for adults with learning disabilities. This reduces the amount of tree surgery waste going to landfill, reduces carbon emissions from transportation, and recycles the timber into a product of benefit to residents and visitors.
All wood products are branded with the Forest Stewardship Council logo, certifying that it is from a sustainably managed source. Sefton was the first local authority in the North West of England to achieve this.
http://consult.sefton.gov.uk/portal/planning/green_space/gsstrategy?pointId=1211531871004 www.sefton.gov.uk/pdf/LeisureServicesAR08-09.pdf
www.merseyforest.org.uk/files/inclusion.pdf
Local timber in The Mersey Forest (Photo: McCoy Wynne)

39
7. Actions for material substitution P D N Partner Mechanism Service
a. Take opportunities to bring unmanaged or under-managed trees and woodlands into management for the range of services they can provide (Case Study 11). This includes managing for timber and wood products, as well as for woodfuel, carbon storage, wildlife, and the full range of services presented in this Framework. Similarly, better management and use of the urban forestry biomass resource as a material or fuel source, diverting it from landfill.
Forestry Commission
Woodland Initiatives
Envirolink
Local Authorities
BTCV
Natural England
Environmental Stewardship and EWGS
Woodland Certification
Management Plans
Surface water
Temps
Carbon
River flood
Fuel
Travel
Species
Visitor
Erosion
Water resources
b. Develop public procurement policies that enhance market opportunities for local sustainable materials, including timber, wood products, woodfuel and fibre, and other natural materials such as straw bales, hemp and sheep’s wool. Ensure that public buildings (including visitor centres) have strong low carbon credentials and are well adapted to change.
Woodland Initiatives
Local Authorities
Local Enterprise Partnerships
NWFF Partnership
CCI
NW Forestry Framework
Woodland Certification
Procurement Policies
NW Forum for the Built Environment
Renewable Building Group
Surface water
Temps
Carbon
Food
Fuel
Travel
Species
Water resources
c. Support innovation and entrepreneurship in developing new products and market opportunities, ensuring that any value added processing is carried out locally.
Woodland Initiatives
Local Enterprise Partnerships
EFIP
ConFor
NWFF Partnership
Envirolink
Businesses
Academic Institutions
CCI
NW Forum for the Built Environment
Renewable Heat Incentive
RDPE
Renewable Building Group
Food
Fuel
Travel
d. Develop planning policies that recommend the use of sustainable and renewable building materials, including straw bales, hemp, sheep’s wool, timber, wood burners, etc.
Local Authorities
Local Development Frameworks
Code for Sustainable Homes
Procurement Policies
BREEAM
Fuel
Also see actions 1a-j, 4b-c, and 8a which deliver this service.

40
8Providing Low Carbon Fuels
Replacing fossil fuels with lower carbon alternatives, including bioenergy (e.g. solid biomass, liquid biofuels, and biogas) could help to mitigate climate change. In the North West of England, under managed and unmanaged woodlands offer a significant resource for woodfuel. Within the next five years sustainably-produced woodfuel has the potential to save the equivalent of approximately 7 million tonnes of carbon dioxide emissions per year by replacing fossil fuels in the UK43. There are also opportunities in the North West of England for other energy crops, and wind and hydro energy. This can all make a contribution to meeting the UK’s renewable energy targets and to the development of a low carbon economy.
For other good practice see:
The BIONIC project addressed the issues of biofuel supply and use in transport specifically from the perspective of local authorities www.bionic-project.eu
The Biomass Energy Centre has lots of information and case studies www.biomassenergycentre.org.uk
43. Read et al (2009). Combating climate change: a role for UK forests. The Synthesis Report. The Stationery Office. www.tsoshop.co.uk/gempdf/Climate_Change_Synthesis_Report.pdf
Case Study 12 (Cheshire)
Off Gas Grid Study
This study identified companies in Cheshire and Warrington that are off the gas grid and contacted them to raise awareness of alternative lower carbon heating technologies, the Renewable Heat Incentive, and opportunities around this in terms of saving costs on heating and generating an income. Businesses that are part of the rural fuel or energy supply chain were also contacted. The study found that the Renewable Heat Incentive makes installing biomass boilers more attractive, however, there are no accredited ‘Microgeneration Certification Scheme’ (an internationally recognised quality assurance scheme) biomass installers in the North West of England. The study highlights supply chain issues and provides recommendations to enhance biomass uptake.
www.cwea.org.uk/cheshire-warrington-gas-grid-study

41
8. Actions for providing low carbon fuels P D N Partner Mechanism Service
a. Cultivate conditions under which bioenergy can develop as a viable and self sufficient energy source (Case Study 12). This includes advocating the establishment of ‘Microgeneration Certification Scheme’ accredited installers, creating supply chains to make adoption of biomass boilers more feasible, working with public and private sector partners to develop a sustainable local bioenergy industry (including biofuels for transport), encouraging the utilisation of material in currently under-managed woodlands (see action 7a), new biomass planting (e.g. woodlands, miscanthus, short rotation coppice and other energy crops) where there are no other constraints (Map 7 in conjunction with other information), and energy generation from other renewable sources (e.g. hydro and wind).
Forestry Commission
Natural England
Envirolink
Woodland Initiatives
Local Enterprise Partnerships
EFIP
ConFor
Envirolink
Businesses
NWFF Partnership
Local Authorities
Transport Planning Organisations
Developers
NW Forestry Framework
UK Renewable Energy and Biomass Targets
Renewable Heat Incentive
Management Plans
Environmental Stewardship and EWGS
Energy Crops Scheme
Local Development Frameworks
Material
b. Develop planning policies that promote renewable energy in new developments (i.e. the Merton Rule that new developments should generate at least 10% of their energy needs from on-site renewables). Biofuels should be included as part of this.
Local Authorities
Envirolink
Local Development Frameworks
Renewable Heat Incentive
Building Regulations (Approved Document J)
Also see actions 1a-j, 4c, and 7a-d which deliver this service.
Biomass pellets (Photo: McCoy Wynne)

42
Map 7. Potential miscanthus and short rotation coppice yield44
44. www.defra.gov.uk/foodfarm/growing/crops/industrial/energy/opportunities/nw.htm
Reproduction from the Ordnance Survey mapping with permission of Her Majesty’s Stationery Office
© Crown Copyright. Unauthorised reproduction infringes the Crown
Copyright and may lead to prosecution or civil proceedings.
TMF license No. 100031461
Suitability of land for miscanthus and short rotation coppice
Highly suitable for both
Short rotation coppice and miscanthus yield datasets supplied by Defra
Highly suitable for short rotation coppice
Highly suitable for miscanthus
Low to medium suitability for both

43
9 Reducing the Need to Travel by Car
Road traffic is responsible for a substantial amount of the UK’s carbon emissions. The transport sector is responsible for about a third of total UK carbon dioxide emissions45; of this, private motor transport generates just under half46. The provision of green, attractive and safe travel routes could encourage people to walk and cycle more, helping to reduce carbon emissions from transport. Research in the Netherlands and Japan has suggested that people are more likely to walk or cycle to work if streets are lined with trees47. In addition, the provision of local recreation areas could reduce the desire to travel further distances, potentially by car, for recreation.
For other good practice see:
Northwich Woodlands in Cheshire West provided a new green travel route between the village of Comberbach and Northwich town centre, going through Marbury Park and the other community woodlands www.northwichwoodlands.org.uk
45. Steer Davies Gleave (2006). Driving up carbon dioxide emissions from road transport: an analysis of current government projections. A report for Transport 2000. www.foe.co.uk/resource/briefings/driving_up_co2_emissions.pdf 46. Sustrans (2008). Annual Review. www.sustrans.org.uk/assets/files/Publications/sustrans_annual_review_08.pdf 47. Cited by Woodland Trust (2010). Greening the Concrete Jungle: Policy brief. www.woodlandtrust.org.uk/en/plant-your-own-wood/Documents/MTMG%20-%20urban%20trees%20report.pdf
Case Study 13 (Graz, Austria)
Green Net
The green network of Graz consists of the city’s green spaces and the green routes which connect them. It aims to provide a healthy and safe way to travel around the city. As well as providing travel routes, these green links also offer an opportunity for recreation, improved air circulation, shade, habitats and a better quality of place.
The green routes are categorised as city wide, district level, or local streets; the higher the route is in this hierarchy the more versatile and multifunctional the infrastructure should be.
The green net helps to inform planning policy in the city; it highlights strengths and weaknesses in the green network, allowing planners to identify where to safeguard and where to invest in green space to enhance connectivity.
http://gis.graz.at/cms/ziel/1515118/DE/
Green walking and cycling route (Photo: McCoy Wynne)

44
9. Actions for reducing the need to travel by car P D N Partner Mechanism Service
a. Planning policy should safeguard and enhance high quality accessible green spaces (including woodlands) near to where people live and take opportunities to create new spaces and woodlands during development and restructuring. Make use of existing standards where appropriate, such as Accessible Natural Greenspace Standard (ANGSt) and Woodland Access Standard.
Local Authorities
Woodland Initiatives
Woodland Trust
Green Space NW
Natural England
NWFF Partnership
Local Development Frameworks
CIL, S106, Planning Conditions
GI, Open Space and Tree Strategies/Plans
ANGSt and Woodland Access Standard
Local Transport Plans
NW Forestry Framework
Neighbourhood, Parish and Town Plans
Surface water
Temps
Species
Visitor
b. Link publicly accessible green space wherever possible (including through tree lined streets; Case Study 5) to form walking and cycling routes (Case Study 13) and provide suitable signposts (e.g. Switzerland has very good signposts for walkers). Consider where people want to travel (e.g. home, work, schools, town and local centres, rural to urban areas, between rural areas, new developments to existing areas, to Sustrans networks, etc). Linear green corridors, e.g. by rivers, disused railway lines, canals, etc, should form a key part of this network. Where appropriate, align networks with other services for which linear green infrastructure corridors are desirable, e.g. managing surface water (in particular, the use of swales), managing high temperatures (action 3d), managing riverine flooding (action 5a), helping other species adapt (action 10b), and managing coastal flooding (action 14a).
Local Authorities
Sustrans
Woodland Initiatives
Green Space NW
Natural England
Transport Planning Organisations
Faiths4Change
British Waterways
Environment Agency
Local Access Forums
Schools
Businesses
Tourism Managers
Local Development Frameworks
CIL, S106, Planning Conditions
Local Transport Plans
Rights of Way Networks
Green Streets
Neighbourhood, Parish and Town Plans
Ecological Networks and Restoration Zones
Integrated Biodiversity Delivery Areas
NW River Basin Management Plan
Surface water
Temps
River flood
Species
Coastal flood
c. Take opportunities to increase public access to green spaces for recreation and as green travel routes, by removing physical and other barriers that may stop people from using green spaces. Publicise them and encourage their use for commuting and recreation, to create walkable communities. This could be through the use of leaflets, websites (e.g. Visit Woods, Discover Cheshire) and guided walks or cycle rides.
Local Authorities
Land Owners and Managers
Forestry Commission
Sustrans
Faiths4Change
Transport Planning Organisations
Green Space NW
Schools
Local Access Forums
NWFF Partnership
Tourism Managers
Natural England
Green Space NW
Keep Britain Tidy
Environmental Stewardship and EWGS
Local Transport Plans
NW Forestry Framework
Neighbourhood, Parish and Town Plans
Walking for Health
Eco Schools
Temps
Food
Visitor
Also see actions 1a-j, 3d, 5a, 6c, 7a-c, 10b, 11a-f, and 14b which deliver this service.

45
10 Helping Other Species Adapt
As the climate changes, the range of species may shift northwards and to higher altitudes. A number of factors will limit their ability to move, including their dispersal abilities and the nature of the landscape (i.e. the fragmentation of habitats and the permeability of the landscape in between). The recent Lawton review states “we need a step-change in our approach to wildlife conservation, from trying to hang on to what we have, to one of large-scale habitat restoration and recreation, under-pinned by the re-establishment of ecological processes and ecosystem services, for the benefits of both people and wildlife”48. Establishing a coherent ecological network, including managing linear corridors for movement, will be increasingly important.
For other good practice see:
The Gowy and Mersey Washlands is a Living Landscapes project in Cheshire www.cheshirewildlifetrust.co.uk/proj_Gowy_Mersey_Washlands.htm
The Mosslands Project looks at the long term survival of a lowland peat bog www.lancswt.org.uk/index.php/mosslands.php
The Commission for Architecture and the Built Environment’s Sustainable Places website provides case studies of wildlife corridors www.cabe.org.uk/sustainable-places/advice/wildlife-corridors
Wildflowers for Transport Projects is a best practice guide for local authorities in Merseyside www.letstravelwise.org/files/1975422928_2010%2001%20-%20Wildflower%20Guide.pdf
48. Lawton et al (2010). Making Space for Nature: a review of England’s wildlife sites and ecological network. Report to Defra. www.defra.gov.uk/environment/biodiversity/documents/201009space-for-nature.pdf
Case Study 14 (Basel, Switzerland)
Green Roof Policy
Basel has the highest density of green roofs in the world, covering 23% of its flat roof area. Following subsidies in the 1990s, the Building and Planning Act was amended in 2002 so that all new buildings with flat roofs must have green roofs. On roofs over 500m2, the substrate must be native soils and of varying depth. Basel Exhibition Centre’s green roof shows the value of different substrate depths for biodiversity; it also has solar panels which provide shade for species, and are more efficient as they are kept cooler by the green roof.
www.urbanhabitats.org/v04n01/wildlife_full.htmlwww.greenroofs.org/grtok/policy_browse.php?id=63&what=view Case Study 15 (The Cumbria High Fells)
Responding To The Impacts Of Climate Change On The Natural Environment
Natural England's Character Area Climate Change project aimed to identify local responses required to safeguard our natural environment and our enjoyment of it in a changing climate. Cumbria High Fells was one of four Character Areas in England that were selected to represent contrasting habitats and landscapes. The project identified significant biodiversity, landscape, recreational and historic environment assets; assessed the potential risks climate change poses to these; and suggested practical actions to make them more resilient to climate change.
www.naturalengland.org.uk/regions/north_west/ourwork/climatechangeproject.aspx
Basel Exhibition Centre’s green roof, Switzerland. Increased biodiversity benefits of extra substrate depth (left); and solar panels (right)

46
10. Actions for helping other species adapt P D N Partner Mechanism Service
a. Implement the guiding principles and associated actions set out in ‘Conserving Biodiversity in a Changing Climate’ and recommendations in the Lawton Review.
Local Authorities
Land Owners and Managers
Natural England
Forestry Commission
Environment Agency
Wildlife Trusts
National Trust
Woodland Trust
Local Development Frameworks
Local Biodiversity Action Plans
Management Plans
Environmental Stewardship and EWGS
Ecological Networks and Restoration Zones
Integrated Biodiversity Delivery Areas
NW River Basin Management Plan
Carbon
River flood
Erosion
Water resources
Coastal flood
b. Landscape scale restoration to provide a range of ecosystem services (Case Studies 7, 8, 13 and 19). Target using National Character Area mapping (Map 8), ecological networks and other data. Take opportunities to connect sites to form networks; through corridors (e.g. rivers, canals, railways and road verges) or creating habitats as ‘stepping stones’. Orientate north-south, and from low to high altitudes, to facilitate movement. Where appropriate, align networks with other services for which linear green infrastructure corridors are desirable (e.g. actions 5a, 9b, 10b, 14a). Use the ‘Cumbria High Fells method’ to determine detailed adaptation responses (Case Study 15).
Local Authorities
Land Owners and Managers
Natural England
Forestry Commission
Environment Agency
Wildlife Trusts
National Trust
Woodland Trust
Biodiversity Partnerships
Landscape Partnerships
Environmental Stewardship and EWGS
Peatland Projects
Living Landscapes
SCaMP
Ecological Networks and Restoration Zones
Integrated Biodiversity Delivery Areas
NW River Basin Management Plan
MOREwoods
Local Transport Plans
Surface water
Temps
Carbon
River flood
Travel
Erosion
Water resources
Coastal flood
c. Planning policies should ensure that new development and restructuring does not fragment ecological networks (action 10b) and seeks to better connect them (Map 8 or local data).
Local Authorities Local Development Frameworks
CIL, S106, Planning Conditions
Neighbourhood, Parish and Town Plans
d. Safeguard, improve the quality, increase the size of, and buffer existing wildlife and protected sites, and areas of high quality habitat. This includes opportunities presented by new development and restructuring to include strong green infrastructure components of appropriate vegetation. Management should take into account the potential impacts of climate change.
Local Authorities
Land Owners and Managers
Natural England
Forestry Commission
Environment Agency
Wildlife Trusts
National Trust
Woodland Trust
Developers
Local Biodiversity Action Plans
Local Development Frameworks
CIL, S106, Planning Conditions
Neighbourhood, Parish and Town Plans
Masterplans
Environmental Stewardship and EWGS
Ecological Networks and Restoration Zones
Management Plans
MOREwoods
e. Manage all green infrastructure (including agricultural land, parks, gardens, allotments, road verges, and other natural and semi-natural urban and rural green spaces) to create a more permeable landscape for wildlife (Case Study 14).
Local Authorities
Land Owners and Managers
Natural England
Faiths4Change
Wildlife Trusts
Green Space NW
Management Plans
Biodiversity Benchmark Scheme
Environmental Stewardship and EWGS
Green Flag Awards
Also see actions 1a-j, 2a-e, 3a-d, 4a-c, 5a-c, 6b, 7a-b, 9a-b, 11a-c, 12a, 13a-b, and 14a-b which deliver this service.
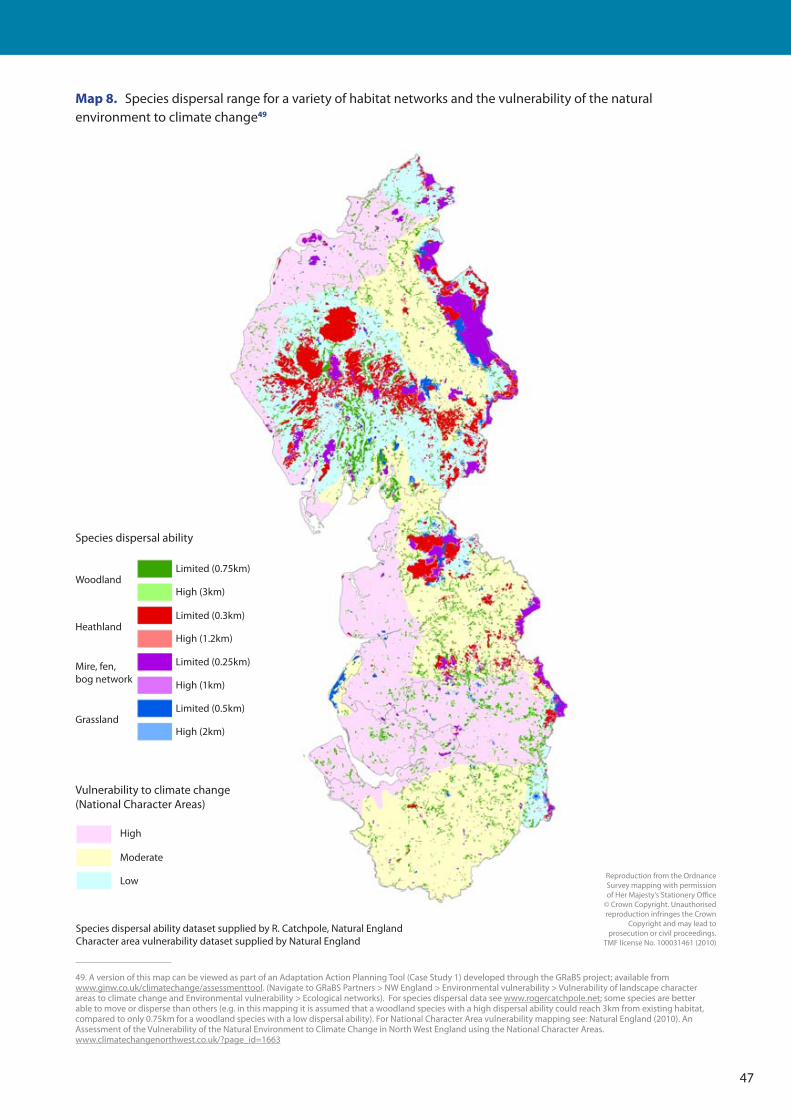
47
Map 8. Species dispersal range for a variety of habitat networks and the vulnerability of the natural environment to climate change49
49. A version of this map can be viewed as part of an Adaptation Action Planning Tool (Case Study 1) developed through the GRaBS project; available from www.ginw.co.uk/climatechange/assessmenttool. (Navigate to GRaBS Partners > NW England > Environmental vulnerability > Vulnerability of landscape character areas to climate change and Environmental vulnerability > Ecological networks). For species dispersal data see www.rogercatchpole.net; some species are better able to move or disperse than others (e.g. in this mapping it is assumed that a woodland species with a high dispersal ability could reach 3km from existing habitat, compared to only 0.75km for a woodland species with a low dispersal ability). For National Character Area vulnerability mapping see: Natural England (2010). An Assessment of the Vulnerability of the Natural Environment to Climate Change in North West England using the National Character Areas. www.climatechangenorthwest.co.uk/?page_id=1663
Reproduction from the Ordnance Survey mapping with permission of Her Majesty’s Stationery Office
© Crown Copyright. Unauthorised reproduction infringes the Crown
Copyright and may lead to prosecution or civil proceedings.
TMF license No. 100031461 (2010)
Species dispersal ability
Vulnerability to climate change (National Character Areas)
Limited (0.75km)
High (3km)
High
Moderate
Low
Species dispersal ability dataset supplied by R. Catchpole, Natural England Character area vulnerability dataset supplied by Natural England
Limited (0.3km)
High (1.2km)
Limited (0.25km)
High (1km)
Limited (0.5km)
High (2km)
Woodland
Heathland
Grassland
Mire, fen, bog network

48
11 Managing Visitor Pressure
The hotter summer temperatures anticipated with climate change may result in a shift towards more outdoor oriented recreation and tourism in the North West of England. This could place increasing pressure on our landscapes, including the rural uplands and the coast, which may also be under direct pressure from climate change. It is crucial to manage the outdoor visitor resource for these increasing pressures. This will include providing alternative outdoor attractions, such as woodlands, which may be more resilient to changes50.
For other good practice see:
The Natural Economy Northwest programme produced some ‘tourism’ case studies www.naturaleconomynorthwest.co.uk/resources+case+studies.php and ‘natural tourism demos’ www.naturaleconomynorthwest.co.uk/natural+tourism+demos.php
Regional Parks in Lancashire www.lancashire-ep.org.uk/index.php?option=com_content&view=article&id=211&Itemid=192 and Green Heart Regional Park www.visitgreenheart.com
The Weaver Valley Climate Change Action Plan included a series of project ideas, including one around water based tourism www.weavervalley.org.uk/NR/rdonlyres/4CE7B1C5-679D-4E40-A6AE-837E76306E5D/0/CCAP_Report_Part1.pdf
50. McEvoy et al (2006). Climate Change and the Visitor Economy: the challenges and opportunities for England’s Northwest. www.sed.manchester.ac.uk/geography/staff/documents/CCVE_Summary_Report.pdf
Case Study 16 (St.Helens)
Bold Forest Park
Over the last fifteen years, the area to the south of St.Helens has been transformed from a landscape dominated by colliery spoil heaps into a budding Forest Park.
A number of sites form an attractive gateway to Merseyside on the M62 and a natural resource for the local population. 298,000 people live within a 15 minute drive, 661,000 within a 20 minute drive, and over 2 million within a 30 minute drive. Significant numbers of new homes are also planned in this area.
As the woodlands mature and the sites are developed it could become an outdoor visitor destination.
One of the sites, Sutton Manor, is home to the award winning ‘Dream’ sculpture.
www.merseyforest.org.uk/files/St%20Helens%20Forest%20Park%20Final%20Draft%20July09.pdf
Dream sculpture at Sutton Manor (Photo: McCoy Wynne)

49
11. Actions for managing visitor pressure P D N Partner Mechanism Service
a. Implement recommendations in the Climate Change and Visitor Economy report.
Tourism Managers
Local Authorities
Tourism Strategies Temps
Travel
Species
Erosion
Coastal flood
b. Sensitively manage areas where the landscape has a lower capacity to cope with increased visitors in a changing climate (Map 9 or local data) (see actions 12b and 14b).
Local Authorities
Tourism Managers
National Parks Authorities
Land Owners and Managers
National Trust
AONBs
Landscape Partnerships
Management Plans
Ecological Networks and Restoration Zones
Integrated Biodiversity Delivery Areas
Travel
Species
Erosion
c. Create outdoor tourism resources in areas with a high capacity to accommodate visitors (Map 9 or local data) (Case Study 16). This is important in and near urban areas, in places with sustainable transport, and in areas of current tourism importance which have sensitive landscapes. Take opportunities to increase economic return through supporting infrastructure such as accommodation, cafes, shops and restaurants.
Local Authorities
Tourism Managers
National Parks Authorities
AONBs
Forestry Commission
Woodland Initiatives
Green Space NW
Forest Parks
Landscape Projects
Tourism Strategies
Travel
Species
Erosion
d. Methods of travel to and around natural tourism resources should be considered and sustainable methods encouraged. This includes public transport, electric bicycles and vehicles, and park and ride schemes.
Local Authorities
Tourism Managers
National Parks Authorities
AONBs
Tourism Strategies
Local Transport Plans
Travel
e. Promote natural visitor resources (e.g. via leaflets, websites such as Visit Woods and Discover Cheshire, and guided walks and cycle rides). In particular those with a high capacity to accommodate visitors and that can be reached by sustainable methods of travel.
Local Authorities
National Parks Authorities
AONBs
Tourism Managers
Green Space NW
Natural England
Woodland Trust
Tourism Strategies
Local Transport Plans
Travel
f. Safeguard and create green infrastructure in urban areas, including parks, street trees (Case Study 5), and water courses and features, in order to ensure that towns and cities are comfortable and attractive visitor destinations.
Local Authorities
Woodland Initiatives
Green Space NW
BTCV
Woodland Trust
Green Streets
Local Development Frameworks
GI, Open Space and Tree Strategies/Plans
Management Plans
Big Tree Plant
MOREwoods
Neighbourhood, Parish and Town Plans
Surface water
Temps
Travel
Also see actions 1a-j, 3b, 7a, 9b-c, 12b, and 14a-b which deliver this service.

50
Map 9. Capacity of the landscape to accommodate use by walkers51
51. A version of this map can be viewed as part of an Adaptation Action Planning Tool (Case Study 1) developed through the GRaBS project; available from www.ginw.co.uk/climatechange/assessmenttool. (Navigate to GRaBS Partners > NW England > Environmental vulnerability > Landscape capacity). This map combines: landscape character sensitivity (using soil erosion vulnerability – see Map 10), visual sensitivity (using tranquillity), and landscape value (using designated sites). It does not take into account rights of way and access. See presentation by Cavan et al on Climate change, tourism and landscape impacts: a regional analysis.
Reproduction from the Ordnance Survey mapping with permission of Her Majesty’s Stationery Office
© Crown Copyright. Unauthorised reproduction infringes the Crown
Copyright and may lead to prosecution or civil proceedings.
TMF license No. 100031461
Landscape capacity dataset supplied by G. Cavan, University of Manchester
Very high
High
Moderate
Low
Very low
Water
Landscape capacity

51
12 Reducing Soil Erosion
More intense rainfall events anticipated with climate change could lead to increased soil erosion. In addition, if the climate is more favourable for outdoor recreation and tourism, trampling as a result of higher visitor numbers could also increase erosion. Careful management of land and changes to land cover can help to stabilise vulnerable soils. For example, woodland planting can help to reduce soil erosion at source and protect river banks from erosion52. This will also help to maintain water quality.
For other good practice see:
Moors for the Future, conserving upland peatlands and reducing erosion www.moorsforthefuture.org.uk
The Environment Agency’s Best Farming Practices website gives case studies on protecting soil and water www.environment-agency.gov.uk/business/sectors/bestfarmingpractices.aspx
The Farming Futures website includes a range of information about farming and climate change, including on adaptation and reducing soil erosion www.farmingfutures.org.uk
52. Nisbet et al (2004). A Guide to Using Woodland for Sediment Control. Forest Research. www.forestresearch.gov.uk/pdf/englandwoodlandforsedimentcon-troljune04.pdf/$FILE/englandwoodlandforsedimentcontroljune04.pdf
Case Study 17 (Lake District)
Opportunity Mapping for Woodland Creation to Reduce Diffuse Sediment and Phosphate Pollution
This study assesses opportunities for woodland creation to help manage sediment and diffuse phosphate pollution within the Lake District by identifying the main sources and pathways of delivery to watercourses. It builds on a previous study of Bassenthwaite Lake. It identifies opportunities for woodland creation on land with a high risk of soil erosion, river lengths with high and moderate risks of bank erosion, and in floodplains. It recommends that stakeholders use the maps to help target future woodland creation to aid diffuse pollution management.
www.forestry.gov.uk/pdf/Lake_District_sediment_final_report_2010.pdf/$FILE/Lake_District_sediment_final_report_2010.pdf
Formby Woods (Photo: McCoy Wynne)

52
12. Actions for reducing soil erosion P D N Partner Mechanism Service
a. Planning policies to create buffer zones around water courses, ponds and wetlands.
This zone should be without structures, hard standing, footpaths, fences or overhanging development such as balconies and should not include domestic gardens or formal landscaping.
Local Authorities
Natural England
Environment Agency
Local Development Frameworks
NW River Basin Management Plan
Surface water
River flood
Species
Water resources
Coastal flood
b. In areas where there is high visitor pressure, ensure that footpaths are maintained to reduce erosion (see actions 11b and 14b). Tourism policy should recognise the reliance that the visitor economy has and puts on key landscapes and work to ensure that their use as a visitor resource is sustainable.
National Parks Authorities
Tourism Managers
BTCV
Tourism Strategies
Management Plans
Visitor
Also see actions 1a-j, 4b, 5b, 6b, 7a, 10a-b, 11a-c, and 14a-b which deliver this service.

53
Map 10. Soil erosion risk53
53. A version of this map can be viewed as part of an Adaptation Action Planning Tool (Case Study 1) developed through the GRaBS project; available from www.ginw.co.uk/climatechange/assessmenttool. (Navigate to GRaBS Partners > NW England > Environmental vulnerability > Soil erosion risk). Soil erosion risk here combines soil erodability (taking into account soil texture and slope), soil erosivity (taking into account precipitation and temperature) and land cover vulnerability. See presentation by Cavan et al on Climate change, tourism and landscape impacts: a regional analysis.
Soil erosion risk dataset supplied by G. Cavan, University of Manchester
Reproduction from the Ordnance Survey mapping with permission of Her Majesty’s Stationery Office
© Crown Copyright. Unauthorised reproduction infringes the Crown
Copyright and may lead to prosecution or civil proceedings.
TMF license No. 100031461
Very high
High
Moderate
Low
Very low
Water
Soil erosion risk

54
13 Managing Water Resources
Climate change projections show a shift in the seasonality of rainfall, with an increase in winter and a decrease in summer. Low summer rainfall will impact on the quantity and quality of water, with important consequences for both human consumption and wildlife that relies on aquatic ecosystems.
Safeguarding green infrastructure resources can help to maintain base flows and filter water to remove pollutants54. In addition, green infrastructure can be designed to capture and store rainwater.
During droughts, this stored water could then also be used to irrigate the green infrastructure, allowing it to continue to provide evaporative cooling, and thereby manage high temperatures and keep towns and cities cool.
For other good practice see:
The Green Streets project in Northwood, Knowsley is providing free water butts to accompany new street trees planted in the area http://northwoodgreenstreets.blogspot.com
54. Woodland Trust (2008). Woodland actions for biodiversity and their role in water management. www.woodlandtrust.org.uk/SiteCollectionDocuments/pdf/woodswater26_03-08.pdf
Case Study 18 (Liverpool)
Chavasse Park
Chavasse Park is a 2.2 hectare green space which is part of the Liverpool One development. The park is on top of a retail and car parking area.
In order to reduce flood risk, the park has been designed to attenuate rainwater onsite through a large water containment tank, and a series of ponds and fountains. In addition to reducing flooding, the captured rainwater is also used to irrigate the green space, providing a sustainable source of water.
This will ensure that, even in times of drought, the green space will continue to evapotranspire and provide cooling when it is most needed.
Chavasse Park was highly commended as an urban green space by the Landscape Institute at the 2009 Landscape Awards.
www.hortweek.com/news/search/863002/Waterfront-reinvention---Liverpool-ONE/
Chavasse Park, Liverpool, where the green space is irrigated from collected rainwaterWater butts supplied in Knowsley to accompany street tree planting

55
13. Actions for managing water resources
P D N Partner Mechanism Service
a. Ensure a sustainable water supply for vegetation in times of water stress in order to maintain its evaporative cooling function.
This could be through the use of appropriate Sustainable Drainage Systems techniques, to collect, store and re-use rainwater (Case Study 18). At a local level this includes the use of water butts.
Local Authorities
Land Owners and Managers
United Utilities
Management Plans
CIL, S106, Planning Conditions
Neighbourhood, Parish and Town Plans
Green Streets
Surface water
Temps
Species
b. Use Sustainable Drainage Systems techniques to treat and improve water quality.
This is important in areas where pollution is likely to occur (e.g. alongside roads, etc). Following best practice for design, adoption and long term management (see action 2a).
Local Authorities
Highways Agency
United Utilities
Environment Agency
Transport Planning Organisations
Local Development Frameworks
CIL, S106, Planning Conditions
Local Transport Plans
NW River Basin Management Plan
Surface water
River flood
Species
c. New development should be sensitively located with regards to existing and future water resources.
Local Authorities
United Utilities
Environment Agency
Local Development Frameworks
Also see actions 1a-j, 2a-e, 4a-b, 5b-c, 6b, 7a-b, 10a-b, and 12a which deliver this service.

56
14 Managing Coastal Flooding
Coastal flooding occurs when storm surges reach the shore. Under current climate projections sea levels are likely to rise, potentially causing an increase in coastal flooding. Just as natural floodplains, which allow rivers to over-bank and flood their land temporarily, help to manage riverine flooding, naturally occurring green infrastructure along the coast provides a service that helps to manage coastal flooding. Dune systems, wetlands and salt marshes are important natural habitats providing this service.
For other good practice see:
The Lancashire Sand Dunes Project, managing the dunes to increase biodiversity and to promote how special they are www.lancswt.org.uk/index.php/fylde-sand-dunes.php
Case Study 19 (Lancashire)
Hesketh Out Marsh
This is a new saltmarsh reserve on the Ribble Estuary where the Royal Society for the Protection of Birds and the Environment Agency have created stronger sea defences and new habitat through the process of managed realignment. It is one of the largest examples of this in the UK. In 1980, a sea wall was built which effectively took this land out of the estuary and allowed it to be used to grow crops. Now, the seawater has been let back in to flood some of the land, creating an important habitat for wildlife which also absorbs some of the sea’s energy before it reaches the new sea defences. The Environment Agency has previously estimated that an 80m strip of saltmarsh can reduce maintenance costs of sea defences behind it by about £3000/km.
www.rspb.org.uk/reserves/guide/h/heskethoutmarsh/index.aspx www.rspb.org.uk/Images/seasofchange_tcm9-132925.pdf
Dune system

57
14. Actions for managing coastal flooding
P D N Partner Mechanism Services
a. Implement measures that allow the natural development of coasts; allowing natural processes of erosion and deposition to take place.
Manage existing coastal habitat appropriately to ensure their continued functionality as a flood defence mechanism (important coastal habitats include wetlands, saltmarsh, and dune systems).
Implement realignment of coastal flood defences to restore inter-tidal coastal habitats and natural transition zones between coastal and terrestrial habitats (Case Study 19). Such measures are beneficial for biodiversity and can reduce the long-term costs of maintaining coastal defences.
Local Authorities
Natural England
Environment Agency
National Trust
NW Coastal Forum
Wildlife Trusts
Land Owners and Managers
Shoreline Management Plans
Local Biodiversity Action Plans
Integrated Coastal Zone Management
Management Plans
Ecological Networks and Restoration Zones
Integrated Biodiversity Delivery Areas
Species
Visitor
Erosion
b. Plan and manage for a potential increase in visitors to coastal areas with climate change, so that increased visitor pressure does not result in damage to coastal habitats important for managing coastal flooding and for biodiversity (see actions 11b and 12b).
Local Authorities
Tourism Managers
NW Coastal Forum
Land Owners and Managers
Green Space NW
Integrated Coastal Zone Management
Shoreline Management Plans
Local Biodiversity Action Plans
Management Plans
Green Flag Awards
Blue Flag Award
Ecological Networks and Restoration Zones
Integrated Biodiversity Delivery Areas
Species
Travel
Visitor
Erosion
Also see actions 1a-j, 3d, 9b, 10a-b, 11a, and 12a which deliver this service.

58
Map 11. Flood zone 2 and habitats that can help manage coastal flooding55
55. The flood zone data presented here can be viewed as part of an Adaptation Action Planning Tool (Case Study 1) developed through the GRaBS project; available from www.ginw.co.uk/climatechange/assessmenttool. (Navigate to GRaBS Partners > NW England > Hazards > Flood Zone 3 / Flood Zone 2).
Reproduction from the Ordnance Survey mapping with permission of Her Majesty’s Stationery Office
© Crown Copyright. Unauthorised reproduction infringes the Crown
Copyright and may lead to prosecution or civil proceedings.
TMF license No. 100031461
Flood zone dataset supplied by the Environment Agency Extent of habitats dataset supplied by Natural England
Sand Dunes Intersecting Flood zone 2
Sand Dunes
Vegetated Shingle Intersecting Flood zone 2
Flood zone 2 Where No Habitats Intersect
Floodplain and Grazing Marsh Intersecting Flood zone 2
Floodplain and Grazing Marsh
Vegetated Shingle
Habitats

59

60
EU legislation and policy, and UK legislation, policy and guidance relevant to this Framework are set out below. Climate change and green infrastructure are both cross-cutting, so this Framework adds value to the delivery of a broad range of agendas, including development and regeneration, low carbon economy, transport, health, recreation, tourism, agriculture, and biodiversity. The list below is by no means exhaustive; for further context please refer to the online evidence base (www.ginw.co.uk/climatechange/evidencebase) and report (www.ginw.co.uk/climatechange/report) which support this Framework. Useful briefing notes are also available on the GRaBS website (www.grabs-eu.org).
EU Legislation and Policy
White Paper on Adapting to Climate Change (2009): Sets out a framework for adaptation measures and policies to increase resilience.
Renewables Directive (2009): In response the UK has committed to sourcing 15% of its energy from renewable sources by 2020.
Water Framework Directive (2000): Requires targets to be set to improve water bodies, and River Basin Management Plans to be created and implemented, taking into account water quality, resources, physical habitat, and flooding.
Floods Directive (2007): Flood risk reduction should be coordinated for river basins.
Blueprint to Safeguard European Waters (to be published 2012): Review of EU Strategy for Water Scarcity and Droughts; it will assess water resource vulnerability, and include recommendations to ensure that climate change is taken into account.
UK Legislation, Policy and Guidance
Climate Change Act (2008): Sets statutory targets for emission reductions and creates a framework for adaptation; a national risk assessment is due to be completed in 2012.
Adaptation Sub-Committee (2010) How Well Prepared is the UK for Climate Change?: Identifies five adaptation priorities – land use planning, providing national infrastructure, designing and renovating buildings, managing natural resources, and emergency planning.
Energy Act (2008): Sets powers to introduce feed-in tariffs and a Renewable Heat Incentive scheme aimed at driving an increase in renewable energy generating capacity.
Defra’s Climate Change Plan (2010): Sets out the actions Defra is taking, in the policy areas where it has influence, to meet the challenges posed by climate change.
Low Carbon Transition Plan and Renewable Energy Strategy (2009): Set out how the UK will achieve emission reductions and meet renewable targets.
Biomass Strategy (2007): Provides a framework for the sustainable development of biomass for: heat and power, transport fuels, and industrial products.
Localism Bill (2011): Focuses on restructuring the relationship between central government and the community including reform of the planning system.
National Planning Policy Framework (to be published): Will consolidate planning policy statements, circulars, and guidance. The most relevant include: Draft PPS (Natural and Healthy Environment), PPS1 Supplement (Climate Change), PPG2 (Green Belts), PPS9 (Biodiversity and Geological Conservation), PPG17 (Open Space, Sport and Recreation), PPS23 (Pollution Control), PPS25 (Flood Risk) and PPS25 Supplement (Coastal Change).
Planning and Climate Change Coalition (2010) Planning for Climate Change – Guidance and Model Policies for Local Authorities: This won a Royal Town Planning Institute Planning Award 2010 for contribution to planning.
Legislative and Policy Context

61
Code for Sustainable Homes (2010): This is the national standard for the sustainable design and construction of new homes. It aims to reduce carbon emissions and create more sustainable homes.
Climate Change Adaptation by Design (2007), Sustainable Energy by Design (2006), Biodiversity by Design (2004): These guidance documents, published by the Town and Country Planning Association, demonstrate how to integrate the various issues into the planning, design and development of new and existing communities.
Royal Commission on Environmental Pollution’s report on The Urban Environment (2007): Considers expanding the concept of the urban natural environment beyond green spaces, to urban ecosystems. Looks at how the use of green infrastructure can be promoted in new and existing developments.
The Commission for Architecture and the Built Environment’s Sustainable Places website www.cabe.org.uk/sustainable-places covers energy, waste, water, transport, green infrastructure and public space.
The Commission for Architecture and the Built Environment’s Grey to Green: How We Shift Funding and Skills to Green Our Cities (2009): Calls for a shift in funding and skills from grey to green infrastructure.
Flood and Water Management Act (2010): Includes measures to support Sustainable Drainage Systems uptake. Developers must now seek local authority approval, rather than having a right, to connect to sewers. Drainage systems will have to meet national standards.
Water White Paper (to be published 2011): Focuses on future challenges facing the water industry including resilience to climate change.
Future Water, the Water Strategy for England (2008): Sets out the long-term vision for water policy and management; covers demand, supply, quality, drainage, flooding.
Natural Environment White Paper (to be published 2011): Will address the challenge climate change represents to the natural environment and the natural environment’s role in managing its impacts and helping with mitigation.
England Biodiversity Strategy (2002): Brings together key contributions to halting biodiversity loss, seeks to make biodiversity part of the mainstream of our thinking and emphasises that healthy, thriving and diverse ecosystems are essential to everybody’s quality of life and well-being.
England Biodiversity Strategy Climate Change Adaptation Principles: Conserving biodiversity in a
changing climate (2008): Sets out principles to guide adaptation to climate change. It is aimed at people responsible for planning and delivering actions across all sectors identified in the England Biodiversity Strategy. It builds upon guidance for conservation practitioners in Conserving biodiversity in a changing climate: guidance on building capacity to adapt (2007).
Lawton et al (2010) Making Space for Nature: a review of England’s wildlife sites and ecological network: An independent review which looks at what needs to be done to ensure that England’s wildlife sites comprise a coherent and resilient ecological network, especially in the face of climate change.
A Strategy for England’s Trees, Woods and Forests (2007): Sets out the vision and priorities for England’s tree and woodland resource, in both rural and urban areas, over the next fifty years.
Read et al (2009) Combating climate change: a role for UK forests: This is an independent assessment, commissioned by the Forestry Commission, examines the potential of the UK’s trees and woodlands to mitigate and adapt to our changing climate.
The Forestry Commission has set up a Woodland Carbon Task Force as part of their work to increase tree planting and woodland management in England.
The Big Tree Plant, launched by Defra in 2010, is a government tree planting campaign aiming to plant one million extra trees in urban areas across England in the next four years. Localism Bill (2011): Focuses on restructuring the relationship between central government and the community including reform of the planning system.
Safeguarding our Soils: A Strategy for England (2009): Sets out the vision that by 2030, all England’s soils will be managed sustainably and degradation threats tackled successfully. This will improve the quality of England’s soils and safeguard their ability to provide essential services for future generations.
Protecting our Water, Soil and Air: A Code of Good Agricultural Practice for farmers, growers and land managers (2009): This practical guide sets out actions to protect and enhance water, soil and air quality.
Heatwave Plan for England (2010): Sets out what needs to be done to raise awareness of the risks relating to severe hot weather and the preparations individuals and organisations should make to reduce these. It covers long term planning issues, including the use of trees and green space for cooling.

62
ANGSt Accessible Natural Greenspace Standards
AONB Area of Outstanding Natural Beauty
BREEAM Building Research Establishment
Environmental Assessment Method
BTCV British Trust for Conservation Volunteers
CABE Commission for Architecture and the Built
Environment
CCI Centre for Construction Innovation
CFNW Community Forests Northwest
CIL Community Infrastructure Levy
CIRIA Construction Industry Research and
Information Association
ConFor Confederation of Forest Industries
CPRE Campaign to Protect Rural England
D District level
DEFRA Department for Environment, Food and
Rural Affairs
EA Environment Agency
EFIP England Forest Industries Partnership
EU European Union
EWGS English Woodland Grant Scheme
FWAG Farming and Wildlife Advisory Group
GI Green Infrastructure
GIS Geographic Information System
GRaBS Green and Blue Space Adaptation for
Urban Areas and Eco Towns
N Neighbourhood level
NE Natural England
NHS National Health Service
NW North West
NWDA Northwest Regional Development Agency
NWFF North West Forestry Framework
P Pan-authority (or sub/city region level)
RDPE Rural Development Programme for
England
RTPI Royal Town Planning Institute
S106 Section 106 Agreement
SCaMP Sustainable Catchment Management
Programme
SuDS Sustainable Drainage Systems
TCPA Town and Country Planning Association
UU United Utilities
Abbreviations
The following abbreviations appear in the Framework for Action:

63
Allerdale Borough CouncilAssociation of Greater Manchester AuthoritiesBlackburn with Darwen Borough CouncilBritish Trust for Conservation VolunteersCampaign to Protect Rural England – Lancashire, North West, Sefton, West Lancashire groupsCheshire and Warrington Economic CommissionCheshire West and Chester CouncilCheshire Wildlife TrustConfederation of Forest IndustriesCopeland Borough CouncilCumbria Biodiversity PartnershipCumbria Business Environment NetworkCumbria County CouncilCumbria TourismCumbria VisionCumbria Wildlife TrustEngland Forest Industries PartnershipEnvironment AgencyFaiths4ChangeForestry CommissionFylde Borough CouncilGlobal RenewablesGroundwork CheshireGroundwork LancashireGroundwork MerseysideGroundwork North WestGreen Space North WestIn-PlaceInstitute for Sustainable Urban Development – Malmö, SwedenKnowsley Metropolitan Borough CouncilLake District National Park AuthorityLancashire Biodiversity PartnershipLancashire County CouncilLancashire Economic PartnershipLancaster City Council
Liverpool City CouncilMalmö Council, SwedenManchester City CouncilMersey WaterfrontMerseyside Environmental Advisory ServiceMerseytravelMid Mersey Growth PointNational TrustNatural EnglandNorth Pennines Area of Outstanding Natural BeautyNorthwest Regional Development AgencyOldham CouncilPeel Holdings North LtdRed Rose ForestRochdale Metropolitan Borough Council Royal Town Planning InstituteSefton CouncilShirley Muir AssociatesSouth Lakeland District CouncilSt.Helens CouncilSustainable BramptonSustransTADEAThe Land TrustThe Mersey ForestThe Wildlife Trust for Lancashire, Manchester and North MerseysideTown and Country Planning AssociationTrafford Borough CouncilUnited UtilitiesUniversity of Central LancashireUniversity of LiverpoolWarrington Borough CouncilWirral CouncilWoodland TrustWoodstations UK Ltd
Organisations Shaping the Framework
Officers from the organisations listed below helped to shape this Framework for Action by either sending written comments or attending a workshop as part of the consultation between September and November 2010.

European UnionEuropean Regional Development Fund
European UnionEuropean Regional Development Fund
This Framework is available online at: www.ginw.co.uk/climatechange/framework
Cover photos: McCoy Wynne, Mike Roberts and Helen Lacy.