greenply industries ltd · pdf filegreenply industries ltd ... 2009 training for new joinee...
TRANSCRIPT

GREENPLY INDUSTRIES LTD Corporate Presentation – FY2016
DISCLAIMERCertain statements in this communication may be ‘forward looking statements’within the meaning of applicable laws and regulations. These forward-lookingstatements involve a number of risks, uncertainties and other factors that could causeactual results to differ materially from those suggested by the forward-lookingstatements. Important developments that could affect the Company’s operationsinclude changes in the industry structure, significant changes in political andeconomic environment in India and overseas, tax laws, import duties, litigation andlabour relations.
All industry data has been collated from various industry sources and market reports.The said data is believed to have a reasonable level of accuracy.
Greenply Industries Limited (GIL) will not be in any way responsible for any actiontaken based on such statements and undertakes no obligation to publicly updatethese forward-looking statements to reflect subsequent events or circumstances.
2
TABLE OF CONTENTS
• Industry Overview
• Company Overview
• Plywood Segment
• MDF Segment
• Annexure
3

Industry Overview
4
PLYWOOD & MDF BRIEF
5
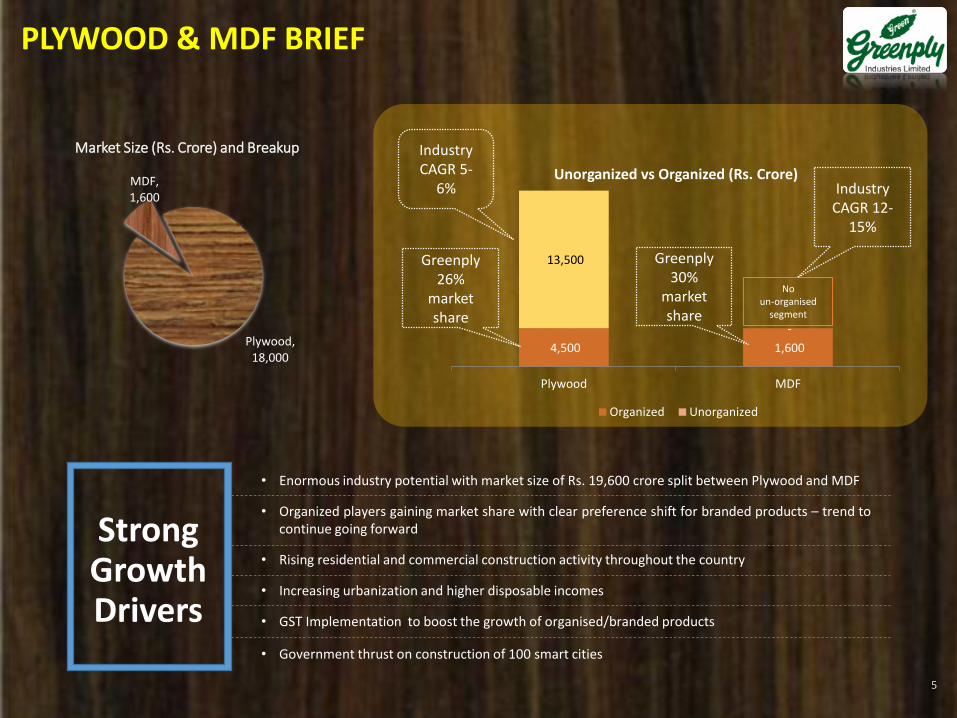
4,500 1,600
13,500
-
Plywood MDF
Unorganized vs Organized (Rs. Crore)
Organized Unorganized
Market Size (Rs. Crore) and Breakup
Greenply 26%
market share
No un-organised
segment
Greenply 30%
market share
Industry CAGR 5-
6% Industry CAGR 12-
15%
Plywood, 18,000
MDF, 1,600
• Enormous industry potential with market size of Rs. 19,600 crore split between Plywood and MDF
• Organized players gaining market share with clear preference shift for branded products – trend tocontinue going forward
• Rising residential and commercial construction activity throughout the country
• Increasing urbanization and higher disposable incomes
• GST Implementation to boost the growth of organised/branded products
• Government thrust on construction of 100 smart cities
Strong Growth Drivers
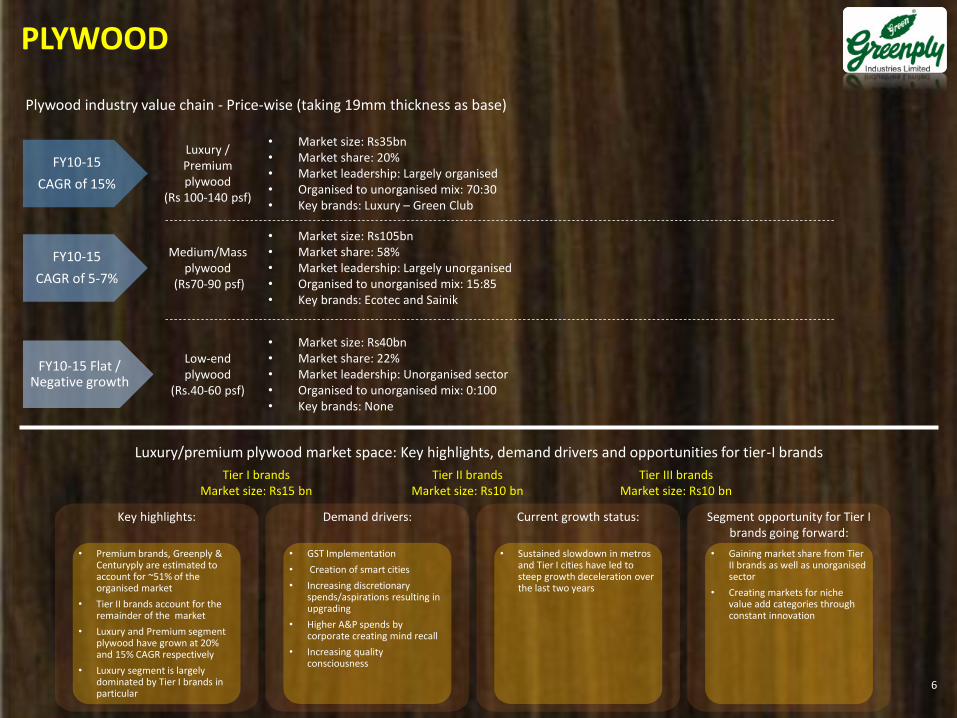
Plywood industry value chain - Price-wise (taking 19mm thickness as base)
Luxury/premium plywood market space: Key highlights, demand drivers and opportunities for tier-I brands
FY10-15
CAGR of 15%
FY10-15
CAGR of 5-7%
FY10-15 Flat / Negative growth
Low-end plywood
(Rs.40-60 psf)
Medium/Mass plywood
(Rs70-90 psf)
Luxury / Premium plywood
(Rs 100-140 psf)
• Market size: Rs35bn• Market share: 20%• Market leadership: Largely organised• Organised to unorganised mix: 70:30• Key brands: Luxury – Green Club
• Market size: Rs105bn• Market share: 58%• Market leadership: Largely unorganised• Organised to unorganised mix: 15:85• Key brands: Ecotec and Sainik
• Market size: Rs40bn• Market share: 22%• Market leadership: Unorganised sector• Organised to unorganised mix: 0:100• Key brands: None
Key highlights: Demand drivers: Current growth status:
• Sustained slowdown in metros and Tier I cities have led to steep growth deceleration over the last two years
Segment opportunity for Tier I brands going forward:
• Gaining market share from Tier II brands as well as unorganisedsector
• Creating markets for niche value add categories through constant innovation
• GST Implementation
• Creation of smart cities
• Increasing discretionary spends/aspirations resulting in upgrading
• Higher A&P spends by corporate creating mind recall
• Increasing quality consciousness
• Premium brands, Greenply & Centuryply are estimated to account for ~51% of the organised market
• Tier II brands account for the remainder of the market
• Luxury and Premium segment plywood have grown at 20% and 15% CAGR respectively
• Luxury segment is largely dominated by Tier I brands in particular
Tier I brandsMarket size: Rs15 bn
Tier II brandsMarket size: Rs10 bn
Tier III brandsMarket size: Rs10 bn
PLYWOOD
6
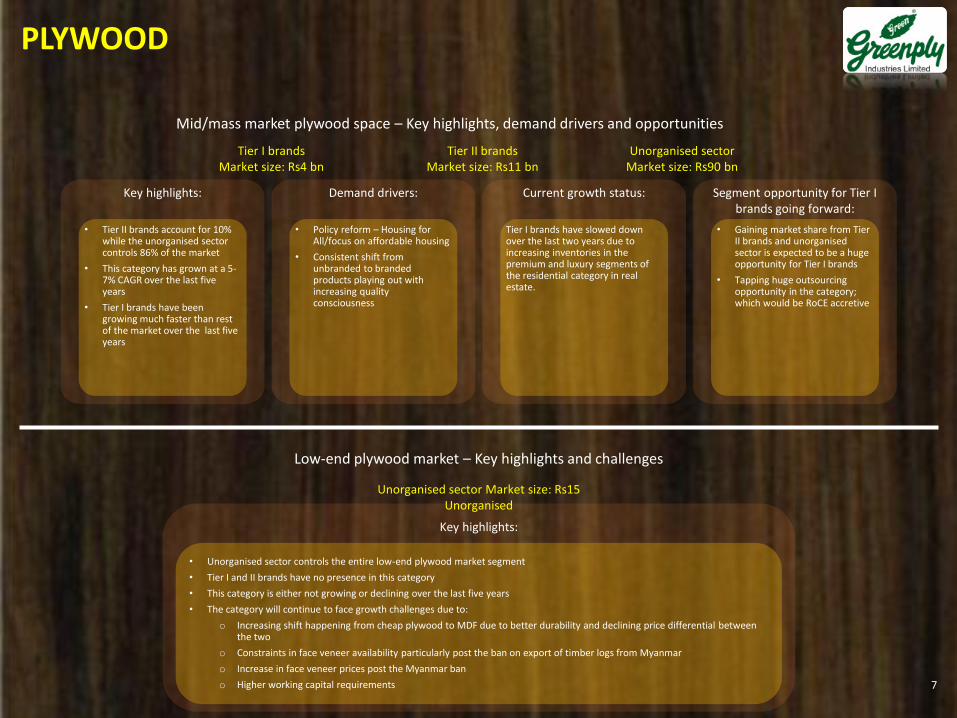
Mid/mass market plywood space – Key highlights, demand drivers and opportunities
Low-end plywood market – Key highlights and challenges
Key highlights:
Unorganised sector Market size: Rs15 Unorganised
Key highlights: Demand drivers: Current growth status:
Tier I brands have slowed down over the last two years due to increasing inventories in the premium and luxury segments of the residential category in real estate.
Segment opportunity for Tier I brands going forward:
• Gaining market share from Tier II brands and unorganised sector is expected to be a huge opportunity for Tier I brands
• Tapping huge outsourcing opportunity in the category; which would be RoCE accretive
• Policy reform – Housing for All/focus on affordable housing
• Consistent shift from unbranded to branded products playing out with increasing quality consciousness
• Tier II brands account for 10% while the unorganised sector controls 86% of the market
• This category has grown at a 5-7% CAGR over the last five years
• Tier I brands have been growing much faster than rest of the market over the last five years
Tier I brandsMarket size: Rs4 bn
Tier II brandsMarket size: Rs11 bn
Unorganised sectorMarket size: Rs90 bn
• Unorganised sector controls the entire low-end plywood market segment
• Tier I and II brands have no presence in this category
• This category is either not growing or declining over the last five years
• The category will continue to face growth challenges due to:
o Increasing shift happening from cheap plywood to MDF due to better durability and declining price differential between the two
o Constraints in face veneer availability particularly post the ban on export of timber logs from Myanmar
o Increase in face veneer prices post the Myanmar ban
o Higher working capital requirements
PLYWOOD
7
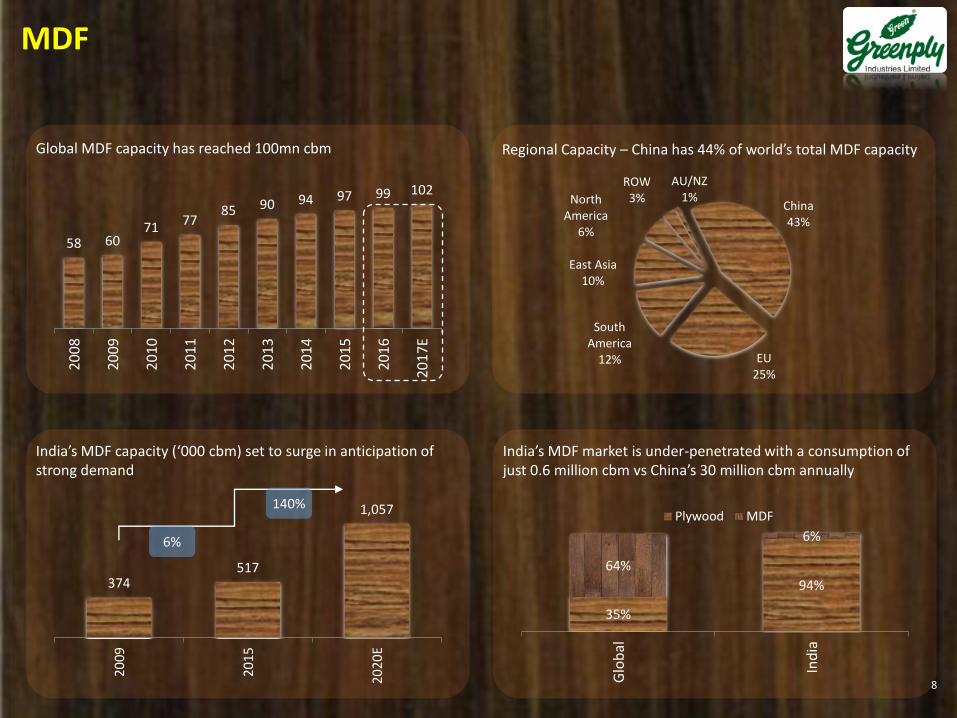
China43%
EU25%
South America
12%
East Asia10%
North America
6%
ROW3%
AU/NZ1%
58 6071 77
85 90 94 97 99 102
20
08
20
09
20
10
20
11
20
12
20
13
20
14
20
15
20
16
20
17
E
374517
1,057
20
09
20
15
202
0E
6%
140%
35%
94%
64%
6%
Glo
bal
Ind
ia
Plywood MDF
Global MDF capacity has reached 100mn cbm Regional Capacity – China has 44% of world’s total MDF capacity
India’s MDF market is under-penetrated with a consumption of just 0.6 million cbm vs China’s 30 million cbm annually
India’s MDF capacity (‘000 cbm) set to surge in anticipation of strong demand
MDF
8
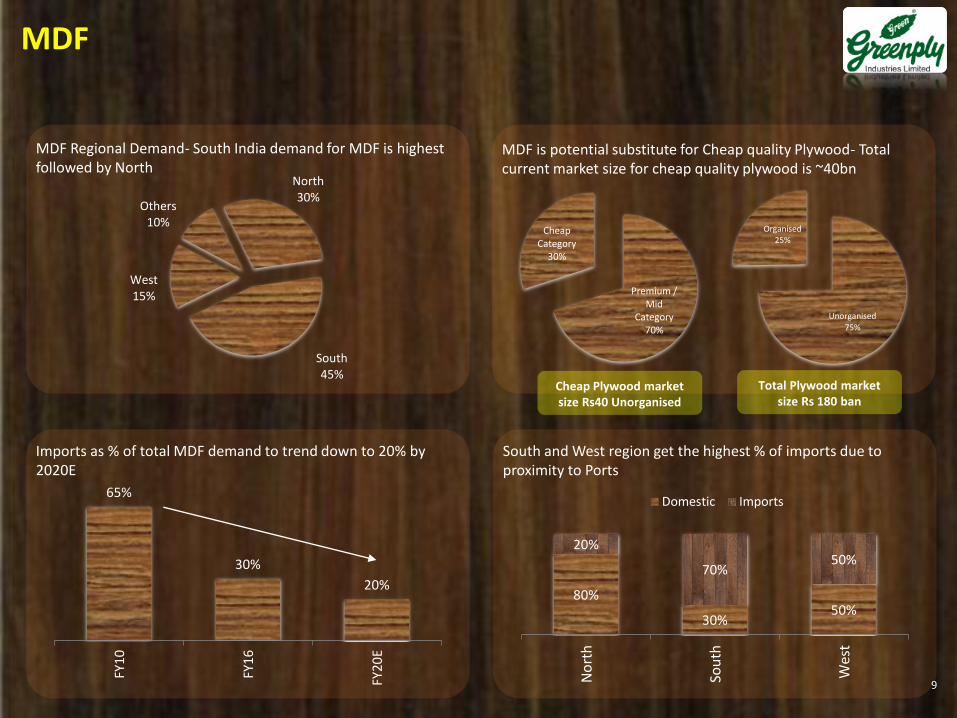
North30%
South45%
West15%
Others10%
65%
30%
20%
FY1
0
FY1
6
FY2
0E
MDF Regional Demand- South India demand for MDF is highest followed by North
MDF is potential substitute for Cheap quality Plywood- Total current market size for cheap quality plywood is ~40bn
South and West region get the highest % of imports due to proximity to Ports
Imports as % of total MDF demand to trend down to 20% by 2020E
Premium / Mid
Category70%
Cheap Category
30%
Unorganised75%
Organised25%
Cheap Plywood market size Rs40 Unorganised
Total Plywood market size Rs 180 ban
80%
30%50%
20%
70%50%
No
rth
Sou
th
Wes
t
Domestic Imports
MDF
9

20212016
Current MDF Market Size:
Rs. 15bn
Expected MDF Market Size
Rs. 30bn
MDF demand is expected to grow by 15% CAGR to Rs 30bn from Rs 15bn currently
DEMAND DRIVERS FOR MDF IN INDIA
10
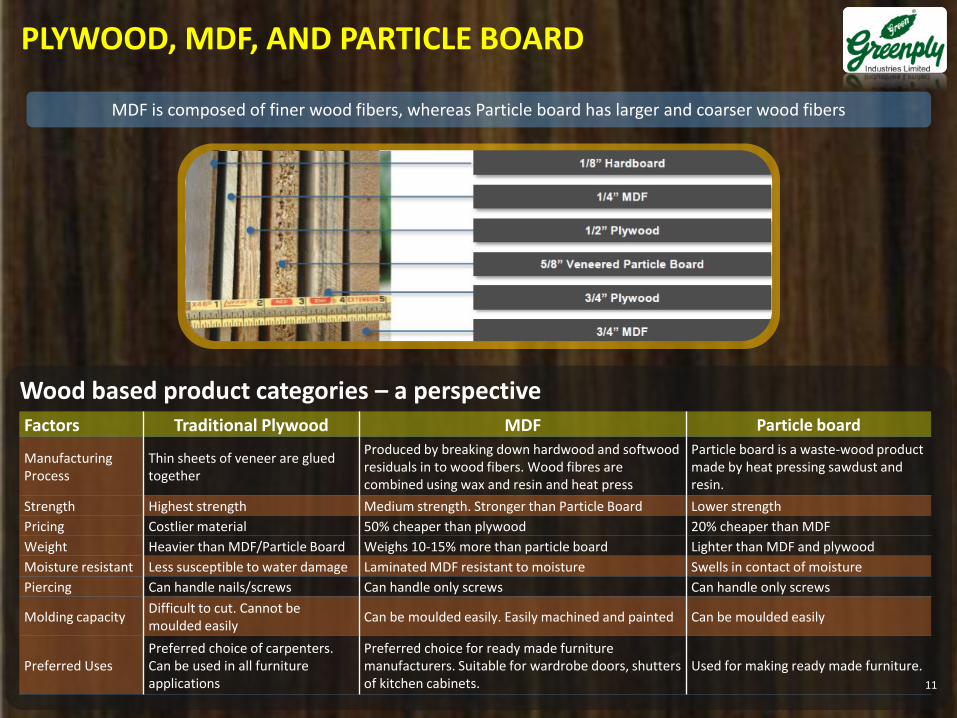
MDF is composed of finer wood fibers, whereas Particle board has larger and coarser wood fibers
Factors Traditional Plywood MDF Particle board
Manufacturing Process
Thin sheets of veneer are glued together
Produced by breaking down hardwood and softwood residuals in to wood fibers. Wood fibres are combined using wax and resin and heat press
Particle board is a waste-wood product made by heat pressing sawdust and resin.
Strength Highest strength Medium strength. Stronger than Particle Board Lower strength
Pricing Costlier material 50% cheaper than plywood 20% cheaper than MDF
Weight Heavier than MDF/Particle Board Weighs 10-15% more than particle board Lighter than MDF and plywood
Moisture resistant Less susceptible to water damage Laminated MDF resistant to moisture Swells in contact of moisture
Piercing Can handle nails/screws Can handle only screws Can handle only screws
Molding capacityDifficult to cut. Cannot be moulded easily
Can be moulded easily. Easily machined and painted Can be moulded easily
Preferred UsesPreferred choice of carpenters. Can be used in all furniture applications
Preferred choice for ready made furniture manufacturers. Suitable for wardrobe doors, shutters of kitchen cabinets.
Used for making ready made furniture.
Wood based product categories – a perspective
PLYWOOD, MDF, AND PARTICLE BOARD
11

Company Overview
COMPANY OVERVIEW
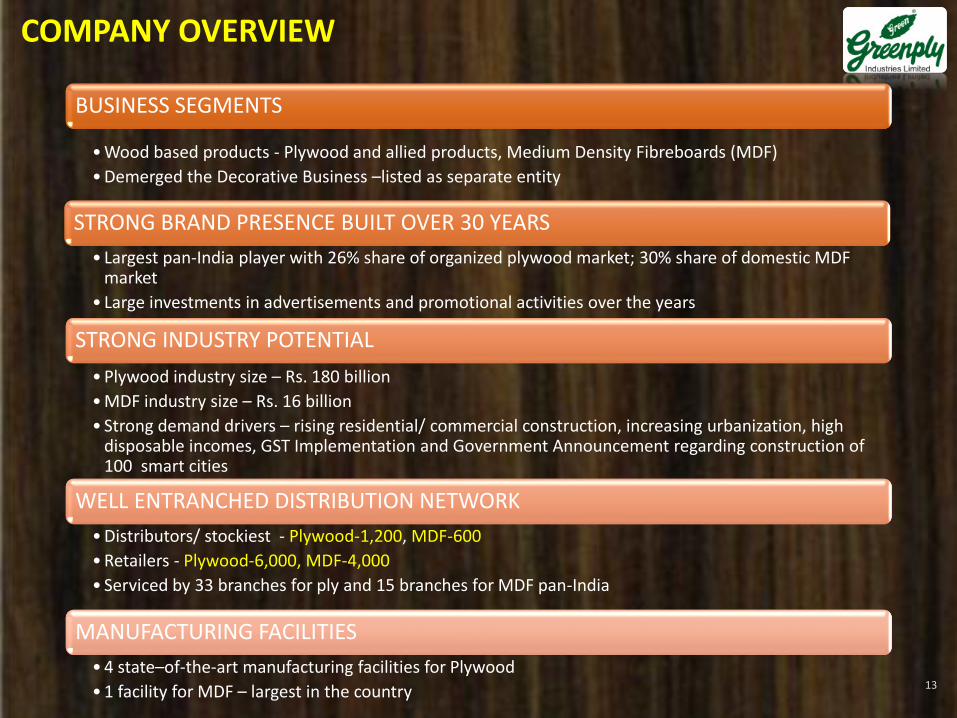
BUSINESS SEGMENTS
• Wood based products - Plywood and allied products, Medium Density Fibreboards (MDF)
• Demerged the Decorative Business –listed as separate entity
STRONG BRAND PRESENCE BUILT OVER 30 YEARS
• Largest pan-India player with 26% share of organized plywood market; 30% share of domestic MDF market
• Large investments in advertisements and promotional activities over the years
STRONG INDUSTRY POTENTIAL
• Plywood industry size – Rs. 180 billion
• MDF industry size – Rs. 16 billion
• Strong demand drivers – rising residential/ commercial construction, increasing urbanization, high disposable incomes, GST Implementation and Government Announcement regarding construction of 100 smart cities
WELL ENTRANCHED DISTRIBUTION NETWORK
• Distributors/ stockiest - Plywood-1,200, MDF-600
• Retailers - Plywood-6,000, MDF-4,000
• Serviced by 33 branches for ply and 15 branches for MDF pan-India
MANUFACTURING FACILITIES
• 4 state–of-the-art manufacturing facilities for Plywood
• 1 facility for MDF – largest in the country 13
COMPANY OVERVIEW
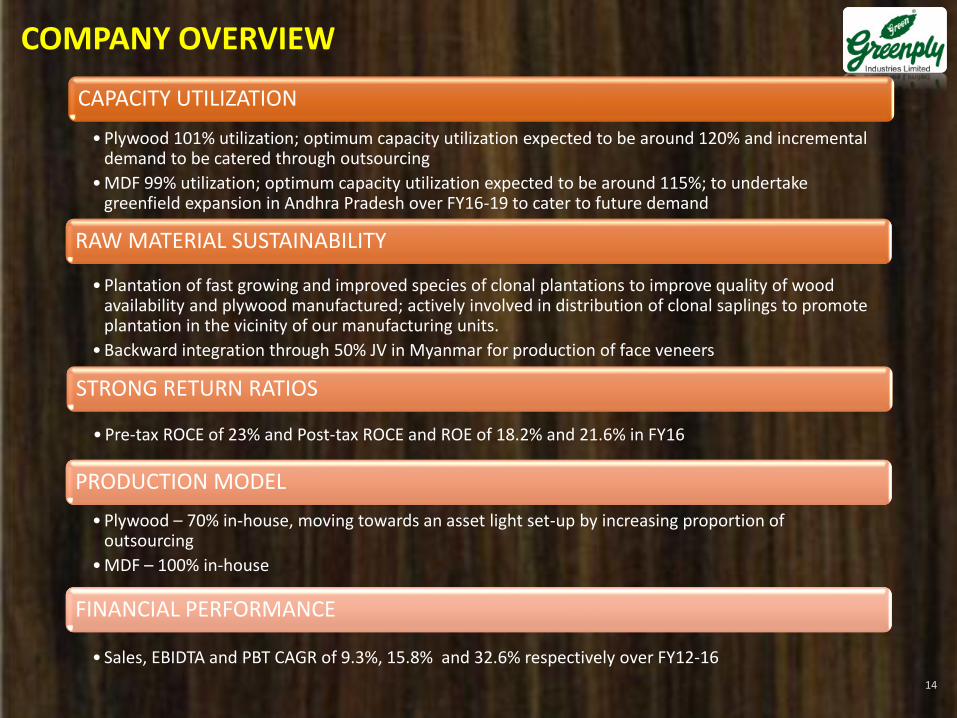
CAPACITY UTILIZATION
• Plywood 101% utilization; optimum capacity utilization expected to be around 120% and incremental demand to be catered through outsourcing
• MDF 99% utilization; optimum capacity utilization expected to be around 115%; to undertake greenfield expansion in Andhra Pradesh over FY16-19 to cater to future demand
RAW MATERIAL SUSTAINABILITY
• Plantation of fast growing and improved species of clonal plantations to improve quality of wood availability and plywood manufactured; actively involved in distribution of clonal saplings to promote plantation in the vicinity of our manufacturing units.
• Backward integration through 50% JV in Myanmar for production of face veneers
STRONG RETURN RATIOS
• Pre-tax ROCE of 23% and Post-tax ROCE and ROE of 18.2% and 21.6% in FY16
PRODUCTION MODEL
• Plywood – 70% in-house, moving towards an asset light set-up by increasing proportion of outsourcing
• MDF – 100% in-house
FINANCIAL PERFORMANCE
• Sales, EBIDTA and PBT CAGR of 9.3%, 15.8% and 32.6% respectively over FY12-16
14

Shiv Prakash Mittal sets up a saw mill1984Setting up new unit at Pantnagar, Uttarakhandand Launch of Ecotec brand2006
Setting up of 1st plywood factory in Tizit,Nagaland1988
Acquisition of two plywood units in Gujarat,Now Bamanbore factory2007
Incorporated as company under the name MittalLaminates Pvt Ltd1990
Induction of Professionalism into the system andimplementation of SAP and Launch of OptimaRed brand & flush doors2008
Transformed into Public limited company –Mittal Laminated Limited1994
Focus on green Mantra – Extensive on fieldtraining for new joinee managers2009
Name changed to Greenply Industries Limited1996Introduced Channel financing, Launch of GreenClub Plus brand (Low Emission Plywood),Introduced APD systems with trade2010
Launch of Greenply brand (flagship premiumbrand)1997
Outsourcing of Ecotec Brand for MR gradeplywood from China, Technical grade plywoodlaunched – Compreg & Compressed plywood2011
Launch of Green Club – Super Premium gradeplywood2001
Demerged the decorative business comprising oflaminates and allied products with all its assetsand liabilities into Greenlam Industries
2015Amalgamation of Worthy Plywood, NowKriparampur factory2005
MILESTONES
15
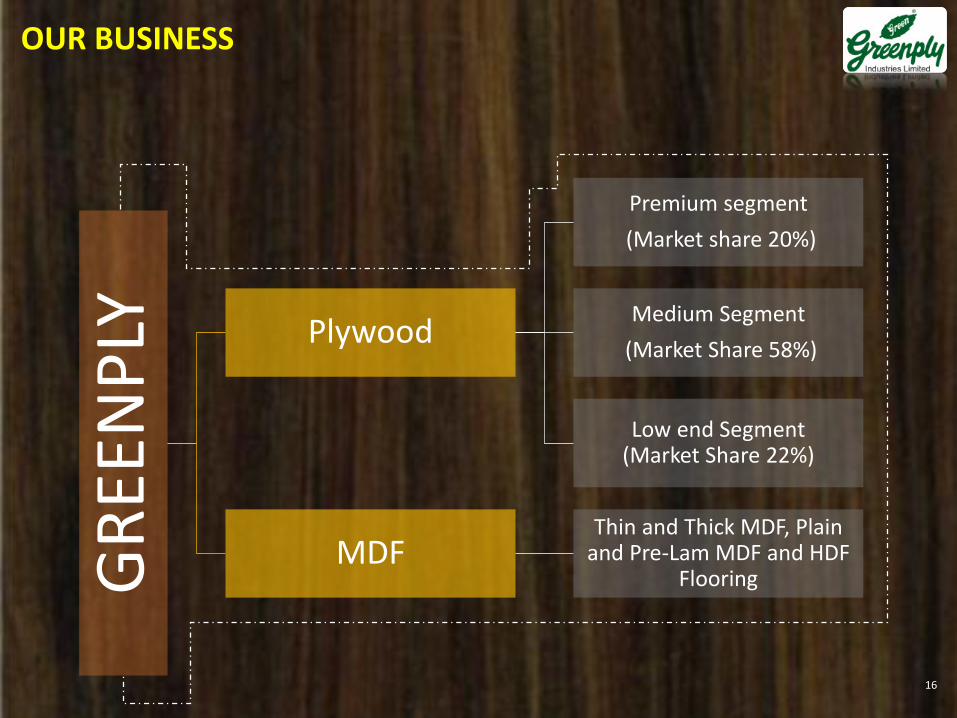
OUR BUSINESS
GR
EEN
PLY Plywood
Premium segment
(Market share 20%)
Medium Segment
(Market Share 58%)
Low end Segment (Market Share 22%)
MDFThin and Thick MDF, Plain
and Pre-Lam MDF and HDF Flooring
16
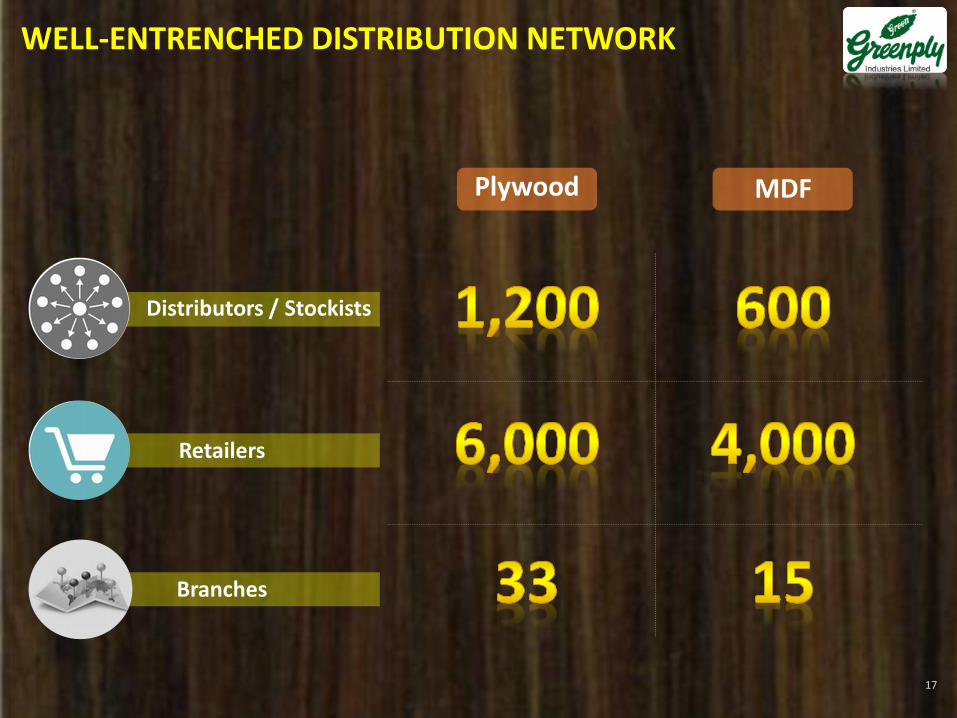
WELL-ENTRENCHED DISTRIBUTION NETWORK
17
Distributors / Stockists
Plywood MDF
Retailers
Branches
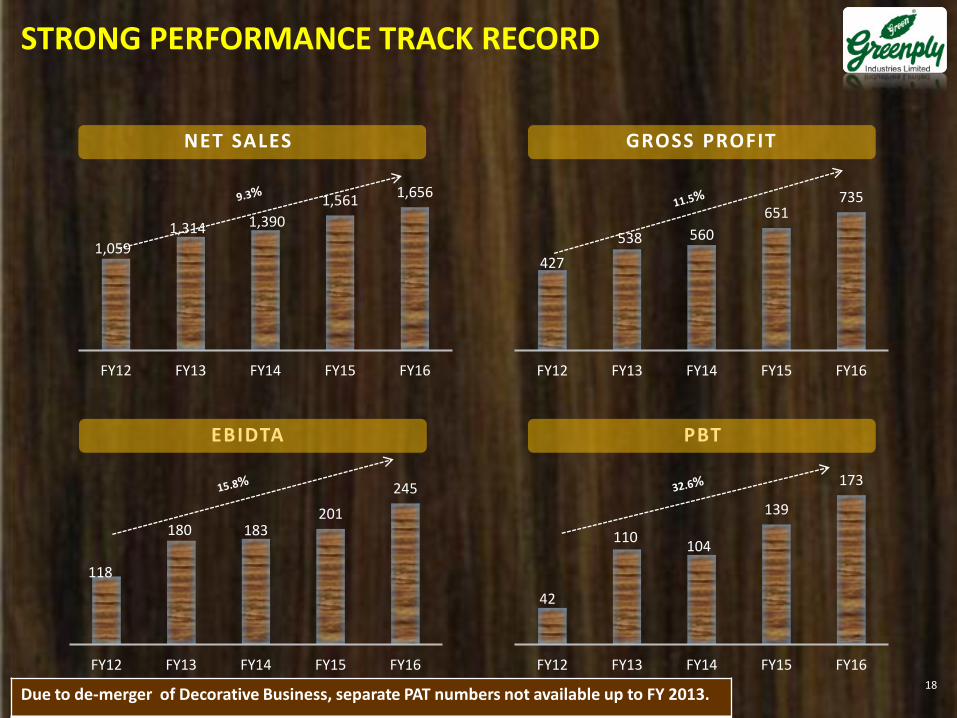
1,059
1,314 1,390
1,5611,656
FY12 FY13 FY14 FY15 FY16
NET SALES
427
538 560
651735
FY12 FY13 FY14 FY15 FY16
GROSS PROFIT
118
180 183201
245
FY12 FY13 FY14 FY15 FY16
EBIDTA
42
110104
139
173
FY12 FY13 FY14 FY15 FY16
PBT
STRONG PERFORMANCE TRACK RECORD
18Due to de-merger of Decorative Business, separate PAT numbers not available up to FY 2013.
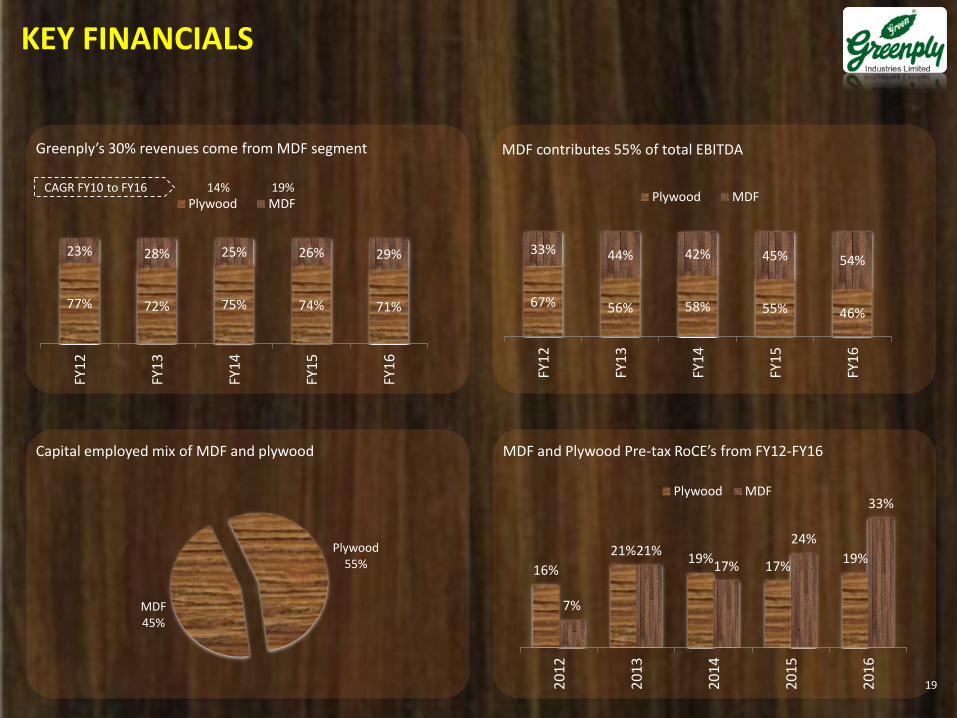
Plywood55%
MDF45%
Greenply’s 30% revenues come from MDF segment MDF contributes 55% of total EBITDA
MDF and Plywood Pre-tax RoCE’s from FY12-FY16Capital employed mix of MDF and plywood
77% 72% 75% 74% 71%
23% 28% 25% 26% 29%
FY1
2
FY1
3
FY1
4
FY1
5
FY1
6
Plywood MDF14% 19%CAGR FY10 to FY16
16%
21%19%
17%19%
7%
21%17%
24%
33%
20
12
20
13
20
14
20
15
20
16
Plywood MDF
67% 56% 58% 55% 46%
33% 44% 42% 45% 54%
FY1
2
FY1
3
FY1
4
FY1
5
FY1
6
Plywood MDF
KEY FINANCIALS
19
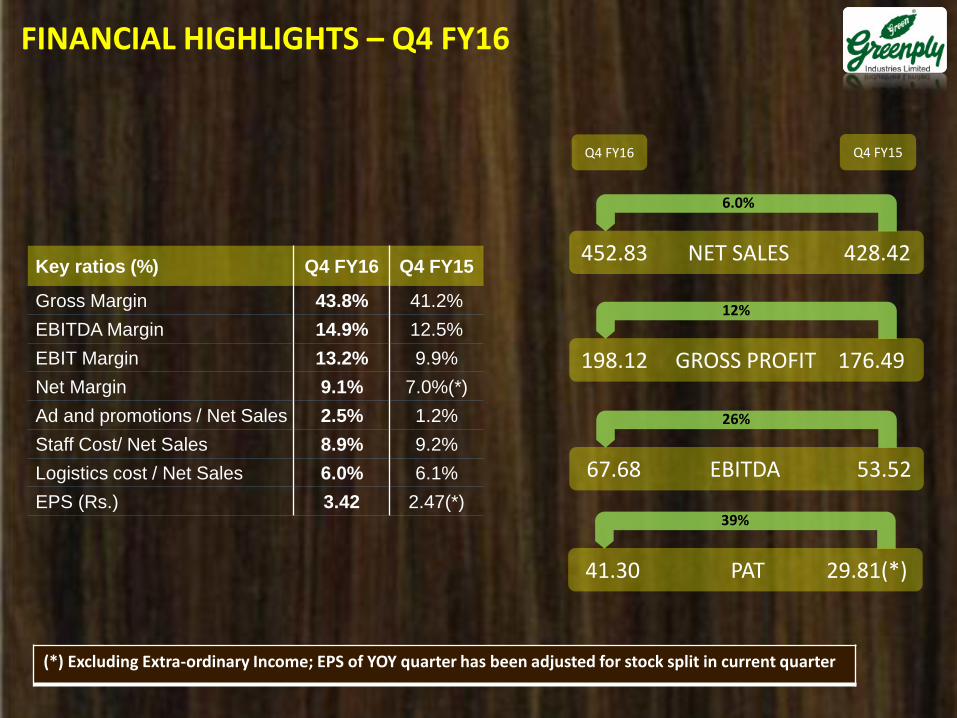
Key ratios (%) Q4 FY16 Q4 FY15
Gross Margin 43.8% 41.2%
EBITDA Margin 14.9% 12.5%
EBIT Margin 13.2% 9.9%
Net Margin 9.1% 7.0%(*)
Ad and promotions / Net Sales 2.5% 1.2%
Staff Cost/ Net Sales 8.9% 9.2%
Logistics cost / Net Sales 6.0% 6.1%
EPS (Rs.) 3.42 2.47(*)
Q4 FY16 Q4 FY15
452.83 NET SALES 428.42
6.0%
198.12 GROSS PROFIT 176.49
12%
67.68 EBITDA 53.52
26%
41.30 PAT 29.81(*)
39%
FINANCIAL HIGHLIGHTS – Q4 FY16
(*) Excluding Extra-ordinary Income; EPS of YOY quarter has been adjusted for stock split in current quarter
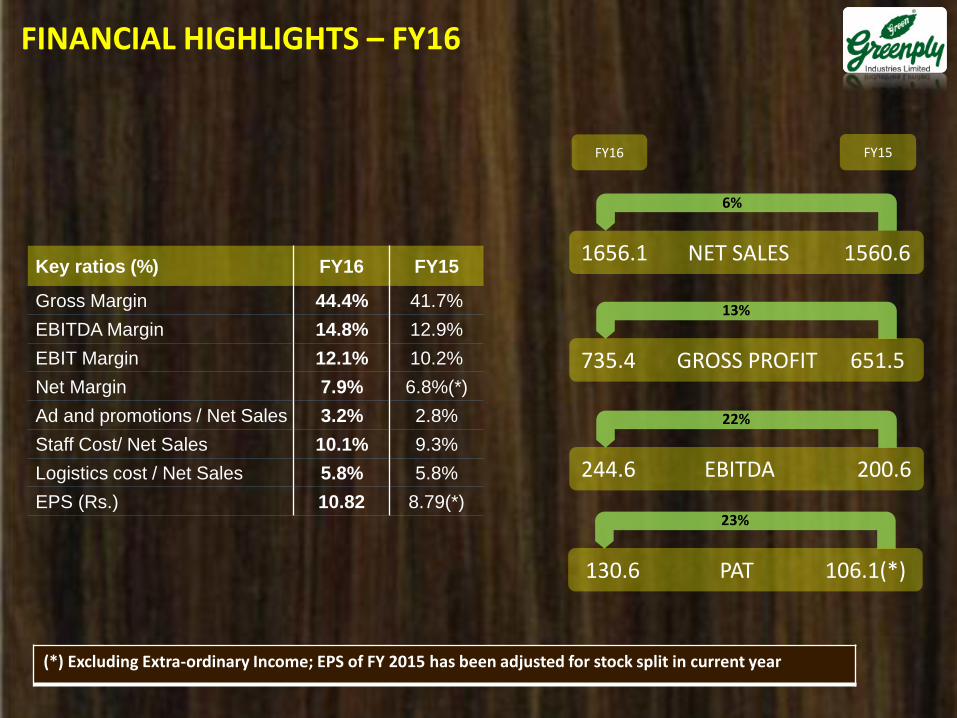
1656.1 NET SALES 1560.6
6%
735.4 GROSS PROFIT 651.5
13%
244.6 EBITDA 200.6
22%
130.6 PAT 106.1(*)
23%
FY16 FY15
Key ratios (%) FY16 FY15
Gross Margin 44.4% 41.7%
EBITDA Margin 14.8% 12.9%
EBIT Margin 12.1% 10.2%
Net Margin 7.9% 6.8%(*)
Ad and promotions / Net Sales 3.2% 2.8%
Staff Cost/ Net Sales 10.1% 9.3%
Logistics cost / Net Sales 5.8% 5.8%
EPS (Rs.) 10.82 8.79(*)
FINANCIAL HIGHLIGHTS – FY16
(*) Excluding Extra-ordinary Income; EPS of FY 2015 has been adjusted for stock split in current year
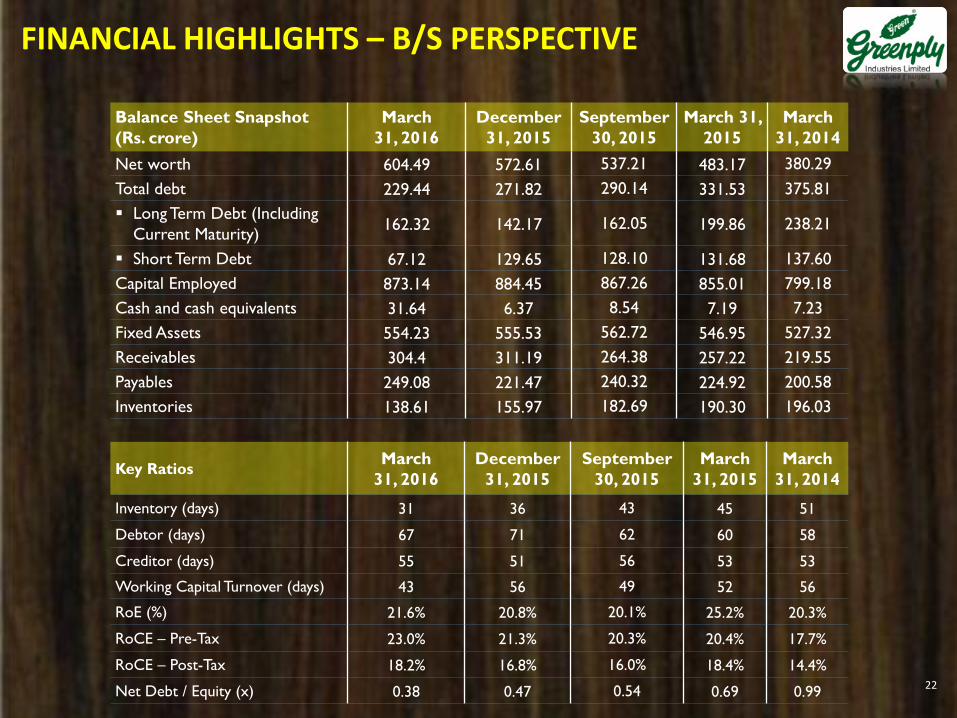
Balance Sheet Snapshot
(Rs. crore)
March
31, 2016
December
31, 2015
September
30, 2015
March 31,
2015
March
31, 2014
Net worth 604.49 572.61 537.21 483.17 380.29
Total debt 229.44 271.82 290.14 331.53 375.81
Long Term Debt (Including
Current Maturity)162.32 142.17 162.05 199.86 238.21
Short Term Debt 67.12 129.65 128.10 131.68 137.60
Capital Employed 873.14 884.45 867.26 855.01 799.18
Cash and cash equivalents 31.64 6.37 8.54 7.19 7.23
Fixed Assets 554.23 555.53 562.72 546.95 527.32
Receivables 304.4 311.19 264.38 257.22 219.55
Payables 249.08 221.47 240.32 224.92 200.58
Inventories 138.61 155.97 182.69 190.30 196.03
Key RatiosMarch
31, 2016
December
31, 2015
September
30, 2015
March
31, 2015
March
31, 2014
Inventory (days) 31 36 43 45 51
Debtor (days) 67 71 62 60 58
Creditor (days) 55 51 56 53 53
Working Capital Turnover (days) 43 56 49 52 56
RoE (%) 21.6% 20.8% 20.1% 25.2% 20.3%
RoCE – Pre-Tax 23.0% 21.3% 20.3% 20.4% 17.7%
RoCE – Post-Tax 18.2% 16.8% 16.0% 18.4% 14.4%
Net Debt / Equity (x) 0.38 0.47 0.54 0.69 0.99
FINANCIAL HIGHLIGHTS – B/S PERSPECTIVE
22
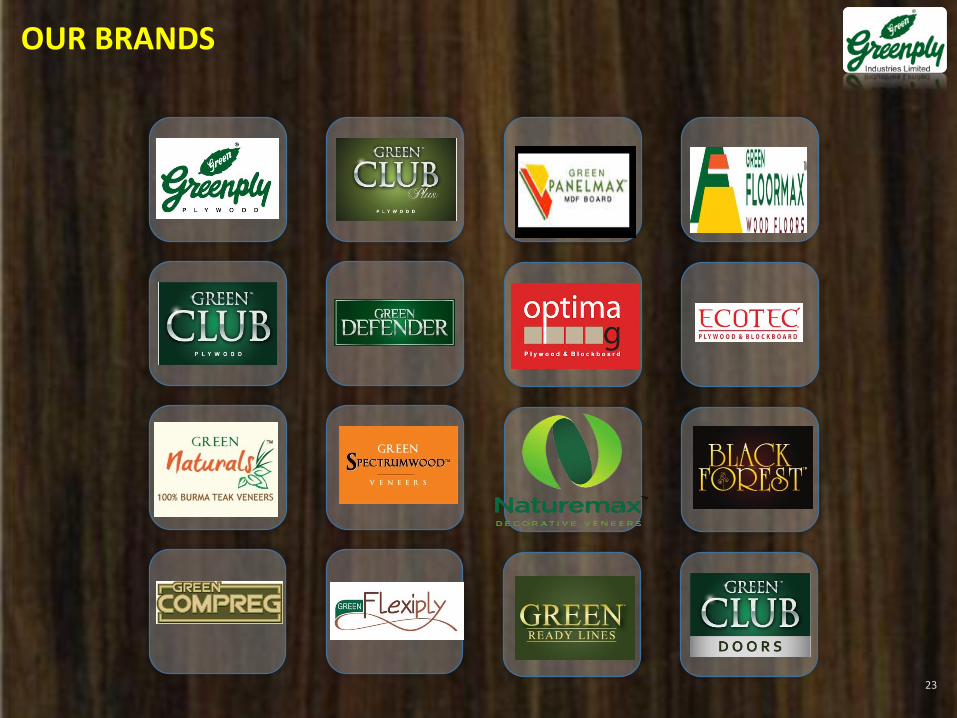
OUR BRANDS
23
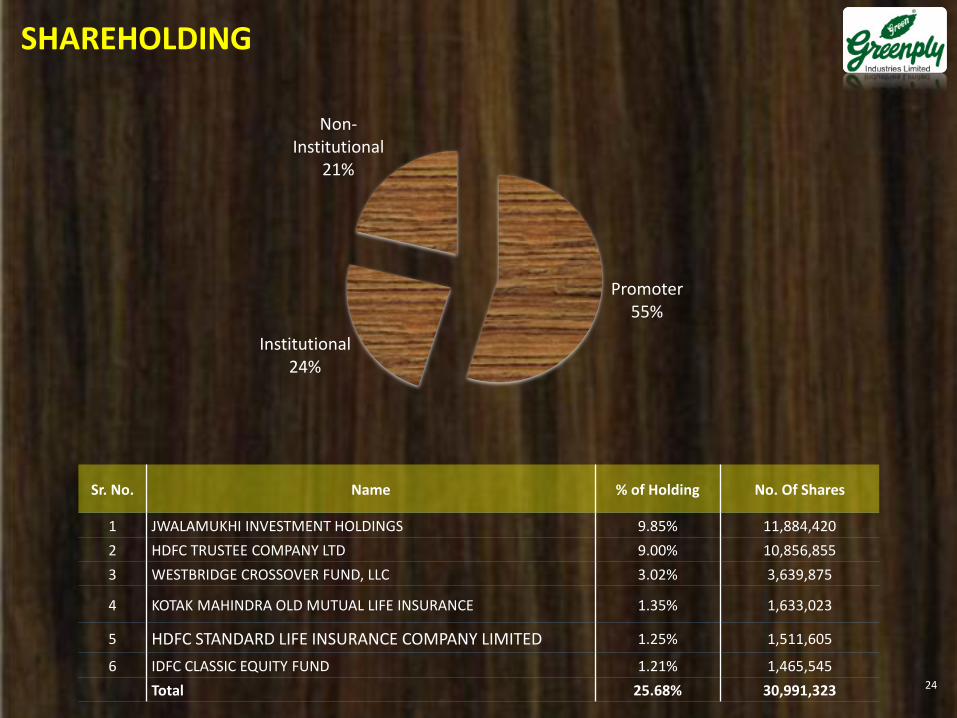
SHAREHOLDING
24
Sr. No. Name % of Holding No. Of Shares
1 JWALAMUKHI INVESTMENT HOLDINGS 9.85% 11,884,420
2 HDFC TRUSTEE COMPANY LTD 9.00% 10,856,855
3 WESTBRIDGE CROSSOVER FUND, LLC 3.02% 3,639,875
4 KOTAK MAHINDRA OLD MUTUAL LIFE INSURANCE 1.35% 1,633,023
5 HDFC STANDARD LIFE INSURANCE COMPANY LIMITED 1.25% 1,511,605
6 IDFC CLASSIC EQUITY FUND 1.21% 1,465,545
Total 25.68% 30,991,323
Promoter55%
Institutional24%
Non-Institutional
21%

BOARD OF DIRECTORS
25
• Shiv Prakash Mittal – Executive Chairman, Promoter Director -
o Veteran in the Plywood industry with over 40 years experience
o Rajesh Mittal– Managing Director
o BCom, Over 31 years experience
• Shobhan Mittal – Executive Director
o BBA with over 10 years of experience
• Moina Yometh Konyak – Non-Executive
o Has been managing Family Timber business for over 20 years
• Susil Kumar Pal – Non-Executive – Independent
o Erstwhile GM, Allahabad Bank
o Anupam Kumar Mukerji – Non Executive –Independent
o Retired as the Director General of Forests
• Sonali Bhagwati Dalal– Non Executive –Independent
o Architect with over 20 years experience
• Upendra Nath Challu - Non Executive -Independent
o Erstwhile CGM, Financial Reporting, Compliance and Taxation, SBI
• Vinod Kumar Kothari - Non Executive -Independent
o Qualified Chartered Accountant and Company Secretary. Author, trainer and a consultant on specialised financial subjects

KEY MANAGEMENT PERSONNEL
26
• Vishwanathan Venkatramani – CFO
o B Com (Hons.); CA; Over 28 years experience
• Yogesh Arora – Country Head – Sales & Marketing (MDF)
o BSc; Over 29 years experience
• Subhash Kumar Agarwal – Andhra Plant Head
o AMIE in Chemical Engineering; Over 36 years experience
• Raman Kumar Poddar – Rudrapur Plant Head
o BE; Over 23 years experience
• Dr. Sushil Kumar Nath – President (Research)
o PH. D; Over 31 years experience in the Indian Plywood Industries Research and Training Institute

Plywood Segment
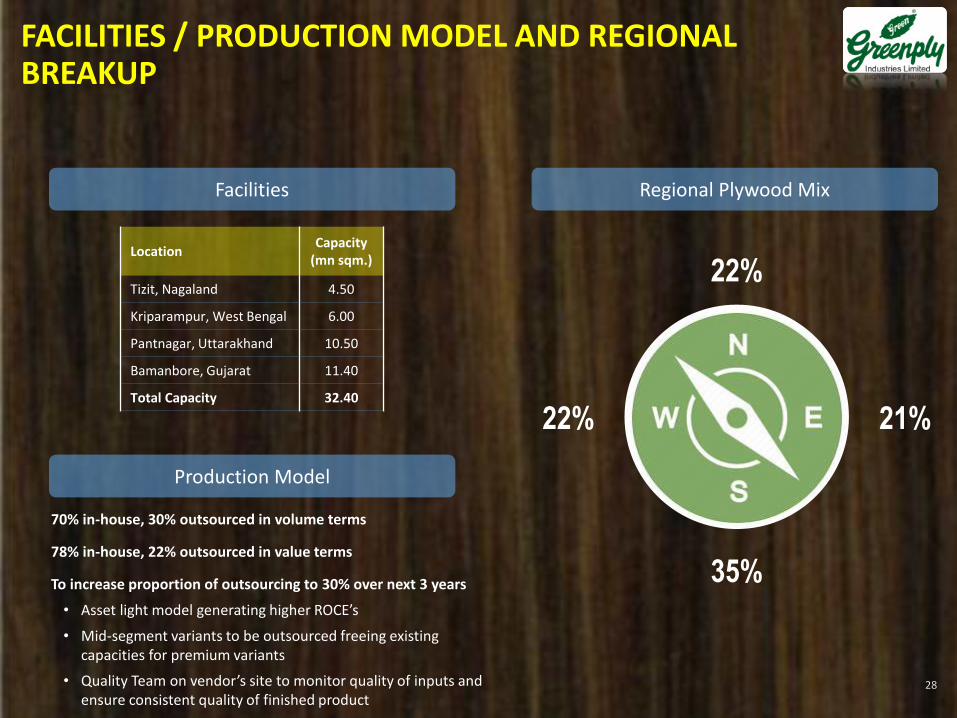
FACILITIES / PRODUCTION MODEL AND REGIONAL BREAKUP
28
70% in-house, 30% outsourced in volume terms
78% in-house, 22% outsourced in value terms
To increase proportion of outsourcing to 30% over next 3 years
• Asset light model generating higher ROCE’s
• Mid-segment variants to be outsourced freeing existing capacities for premium variants
• Quality Team on vendor’s site to monitor quality of inputs and ensure consistent quality of finished product
LocationCapacity
(mn sqm.)
Tizit, Nagaland 4.50
Kriparampur, West Bengal 6.00
Pantnagar, Uttarakhand 10.50
Bamanbore, Gujarat 11.40
Total Capacity 32.40
35%
Production Model
Facilities
22%
Regional Plywood Mix
21%22%
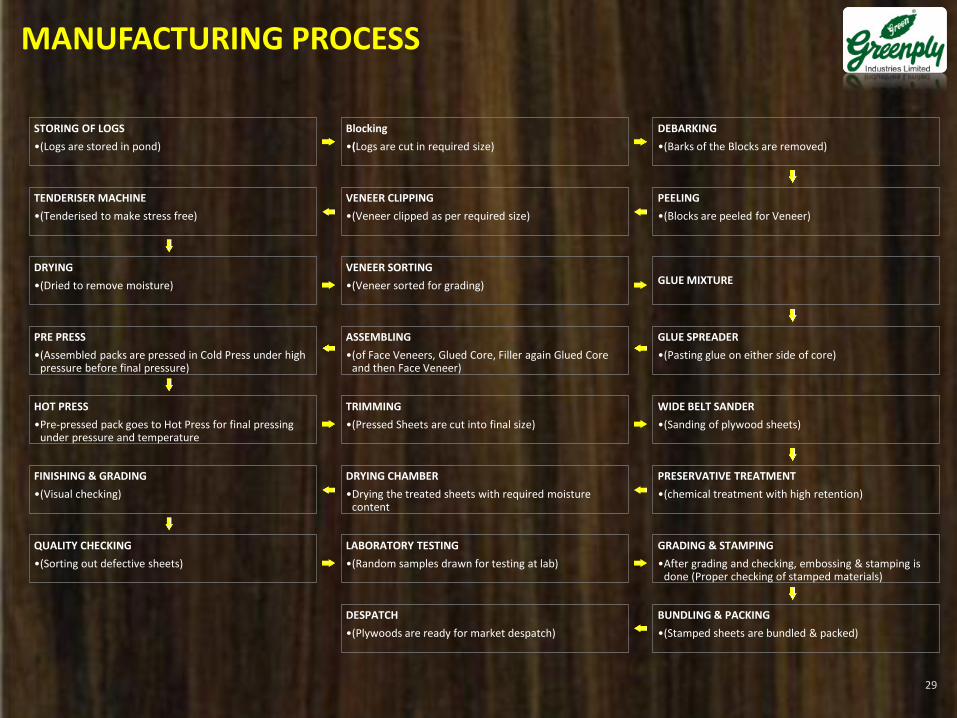
MANUFACTURING PROCESS
29
STORING OF LOGS
•(Logs are stored in pond)
Blocking
•(Logs are cut in required size)
DEBARKING
•(Barks of the Blocks are removed)
PEELING
•(Blocks are peeled for Veneer)
VENEER CLIPPING
•(Veneer clipped as per required size)
TENDERISER MACHINE
•(Tenderised to make stress free)
DRYING
•(Dried to remove moisture)
VENEER SORTING
•(Veneer sorted for grading) GLUE MIXTURE
GLUE SPREADER
•(Pasting glue on either side of core)
ASSEMBLING
•(of Face Veneers, Glued Core, Filler again Glued Core and then Face Veneer)
PRE PRESS
•(Assembled packs are pressed in Cold Press under high pressure before final pressure)
HOT PRESS
•Pre-pressed pack goes to Hot Press for final pressing under pressure and temperature
TRIMMING
•(Pressed Sheets are cut into final size)
WIDE BELT SANDER
•(Sanding of plywood sheets)
PRESERVATIVE TREATMENT
•(chemical treatment with high retention)
DRYING CHAMBER
•Drying the treated sheets with required moisture content
FINISHING & GRADING
•(Visual checking)
QUALITY CHECKING
•(Sorting out defective sheets)
LABORATORY TESTING
•(Random samples drawn for testing at lab)
GRADING & STAMPING
•After grading and checking, embossing & stamping is done (Proper checking of stamped materials)
BUNDLING & PACKING
•(Stamped sheets are bundled & packed)
DESPATCH
•(Plywoods are ready for market despatch)

• To leverage strong brand presence built over 31 years
o India’s leading plywood manufacturing company
o To continue investing ~3% of net sales going
forward towards ad expenditure with the aim of
increasing brand visibility and recall
Mapping Key Influencers
MARKETING STRATEGY & INITIATIVES
30
Key Initiatives
• 360 degree marketing initiatives targeted at trade and end-consumers through various ATL / BTL activities
• Green Teak World Stores offering customers a feel of value-added products
Successful brand campaigns
• ‘Sardar Kid’ - won the gold at Abby Awards 2006
• ‘Forever New” - features Arjun Rampalunconventional take on the brand’s core proposition of durability
• 'Always Hoyenga‘ - relives Greenply Plywood's promise to last for generations
• Aag Ko Kare Bye Bye’
• Ask Greenply
Relationship building through
• Loyalty points
• Award nights
• Family bonding events
• Domestic / foreign trips
Architects/Interior Designers
Carpenters/Contractors
Dealers/sub-dealers
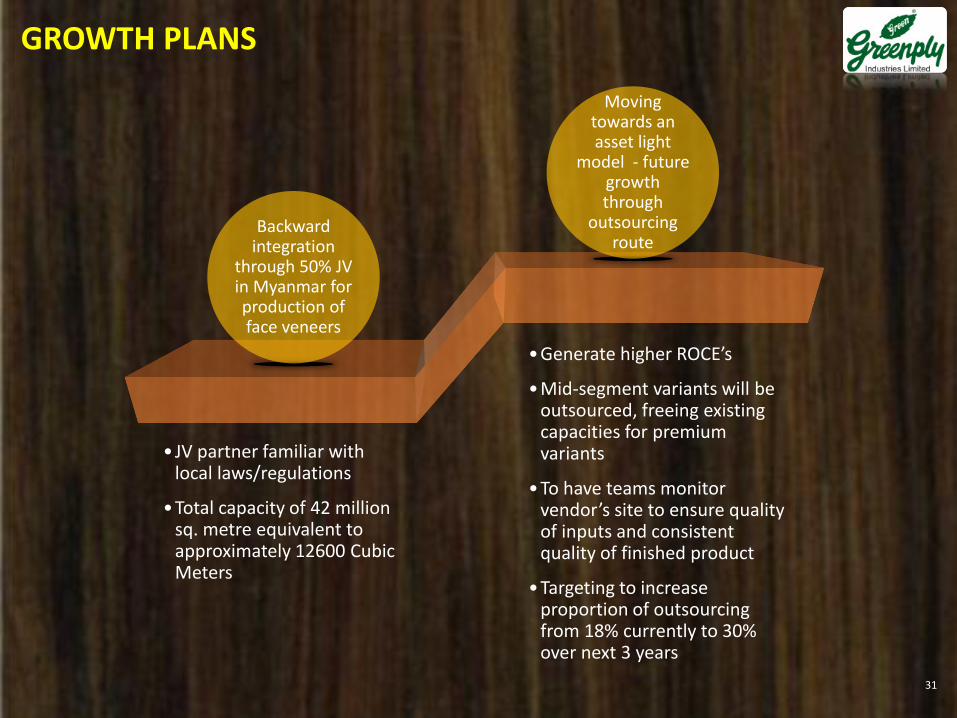
• JV partner familiar with local laws/regulations
•Total capacity of 42 million sq. metre equivalent to approximately 12600 Cubic Meters
•Generate higher ROCE’s
•Mid-segment variants will be outsourced, freeing existing capacities for premium variants
•To have teams monitor vendor’s site to ensure quality of inputs and consistent quality of finished product
•Targeting to increase proportion of outsourcing from 18% currently to 30% over next 3 years
GROWTH PLANS
31
Backward integration
through 50% JV in Myanmar for production of face veneers
Moving towards an asset light
model - future growth through
outsourcing route
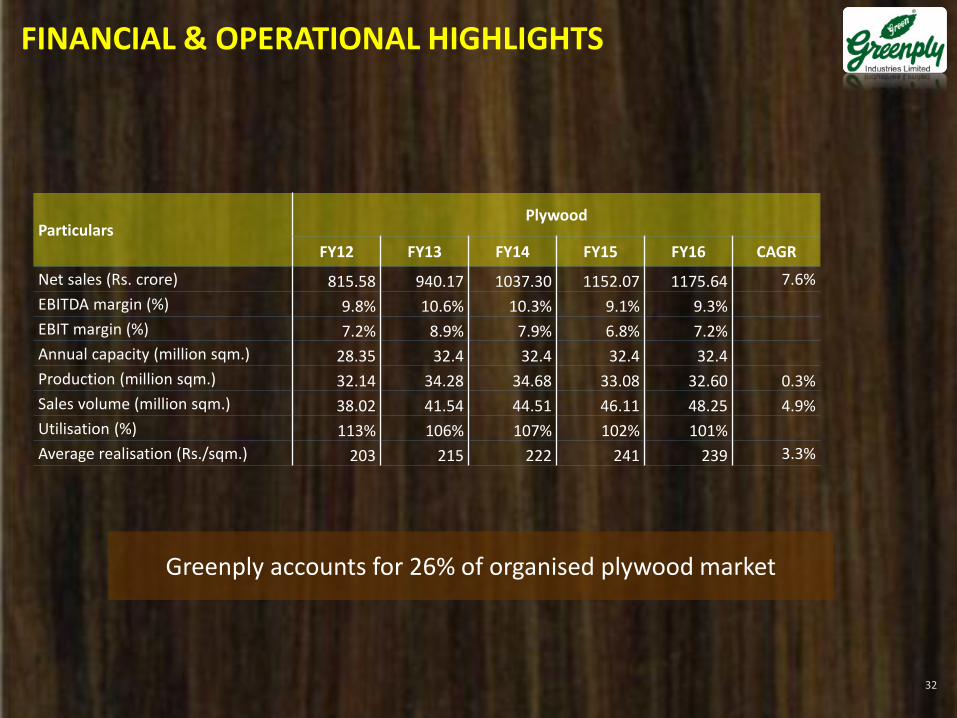
FINANCIAL & OPERATIONAL HIGHLIGHTS
32
Greenply accounts for 26% of organised plywood market
ParticularsPlywood
FY12 FY13 FY14 FY15 FY16 CAGR
Net sales (Rs. crore) 815.58 940.17 1037.30 1152.07 1175.64 7.6%
EBITDA margin (%) 9.8% 10.6% 10.3% 9.1% 9.3%
EBIT margin (%) 7.2% 8.9% 7.9% 6.8% 7.2%
Annual capacity (million sqm.) 28.35 32.4 32.4 32.4 32.4
Production (million sqm.) 32.14 34.28 34.68 33.08 32.60 0.3%
Sales volume (million sqm.) 38.02 41.54 44.51 46.11 48.25 4.9%
Utilisation (%) 113% 106% 107% 102% 101%
Average realisation (Rs./sqm.) 203 215 222 241 239 3.3%
MDF Segment
FACILITIES / PRODUCTION MODEL AND REGIONAL BREAKUP
34
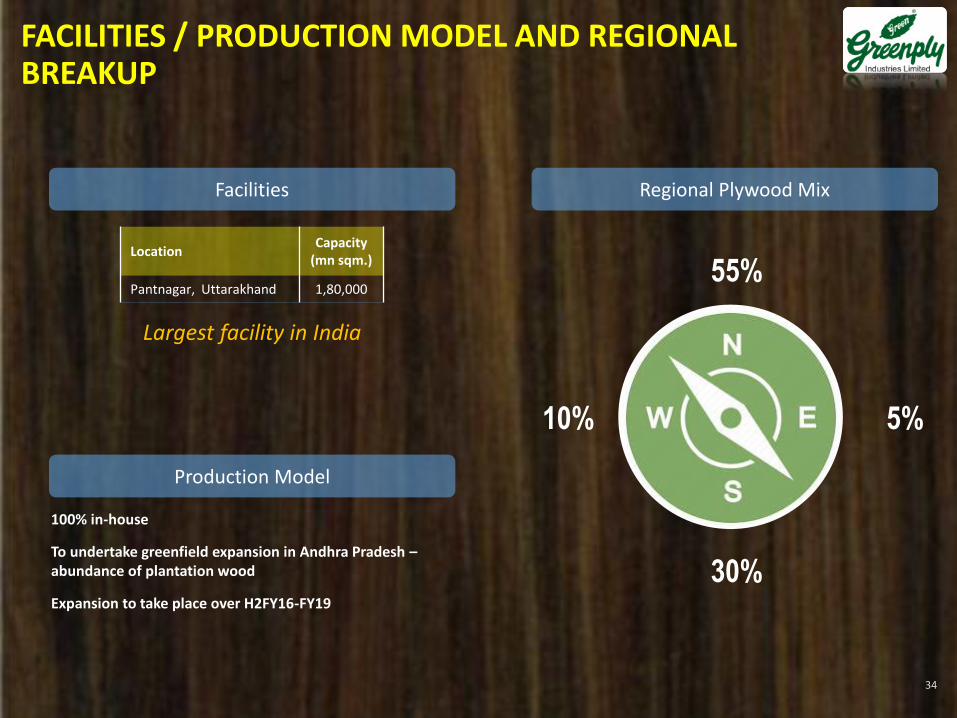
100% in-house
To undertake greenfield expansion in Andhra Pradesh –abundance of plantation wood
Expansion to take place over H2FY16-FY19
LocationCapacity
(mn sqm.)
Pantnagar, Uttarakhand 1,80,000
30%
Production Model
Facilities
55%
Regional Plywood Mix
5%10%
Largest facility in India
MANUFACTURING PROCESS
35
MDF - THE WAY FORWARD
Key Drivers
36
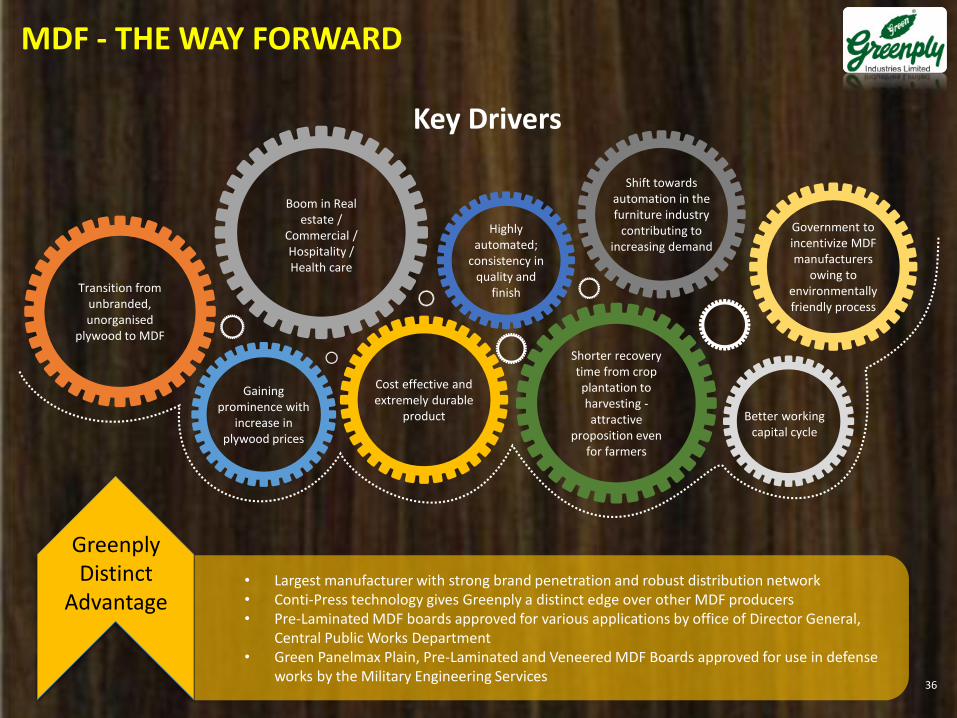
• Largest manufacturer with strong brand penetration and robust distribution network• Conti-Press technology gives Greenply a distinct edge over other MDF producers• Pre-Laminated MDF boards approved for various applications by office of Director General,
Central Public Works Department• Green Panelmax Plain, Pre-Laminated and Veneered MDF Boards approved for use in defense
works by the Military Engineering Services
Greenply Distinct
Advantage
Transition from unbranded, unorganised
plywood to MDF
Gaining prominence with
increase in plywood prices
Boom in Real estate /
Commercial / Hospitality / Health care
Cost effective and extremely durable
product
Highly automated;
consistency in quality and
finish
Shorter recovery time from crop plantation to harvesting -attractive
proposition even for farmers
Shift towards automation in the furniture industry
contributing to increasing demand
Government to incentivize MDF manufacturers
owing to environmentally friendly process
Better working capital cycle
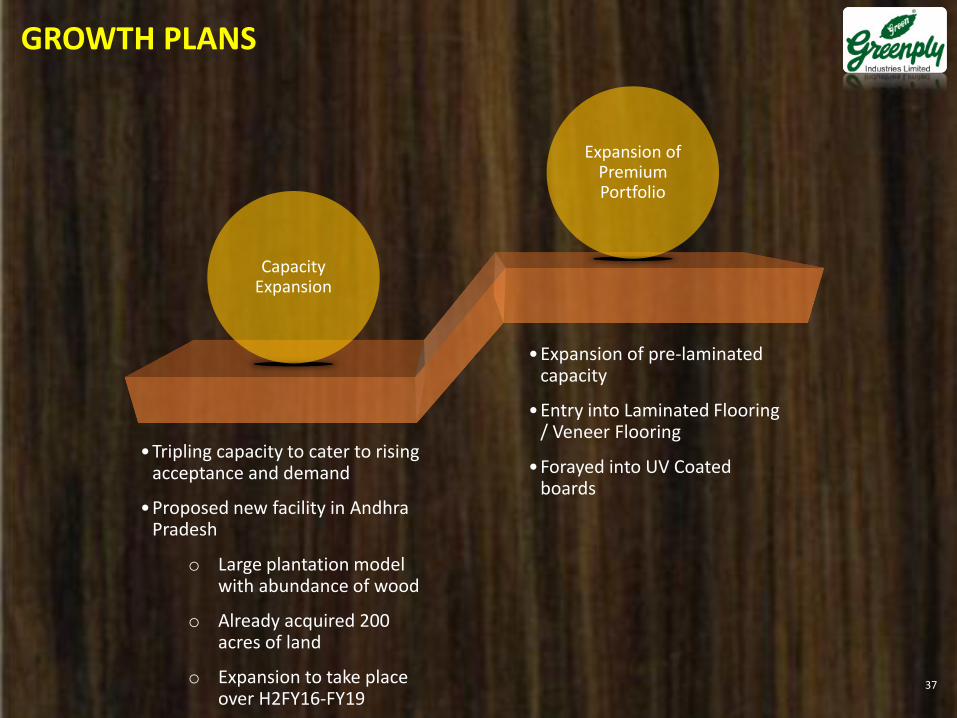
•Tripling capacity to cater to rising acceptance and demand
•Proposed new facility in Andhra Pradesh
o Large plantation model with abundance of wood
o Already acquired 200 acres of land
o Expansion to take place over H2FY16-FY19
•Expansion of pre-laminated capacity
•Entry into Laminated Flooring / Veneer Flooring
•Forayed into UV Coated boards
GROWTH PLANS
37
Capacity Expansion
Expansion of Premium Portfolio
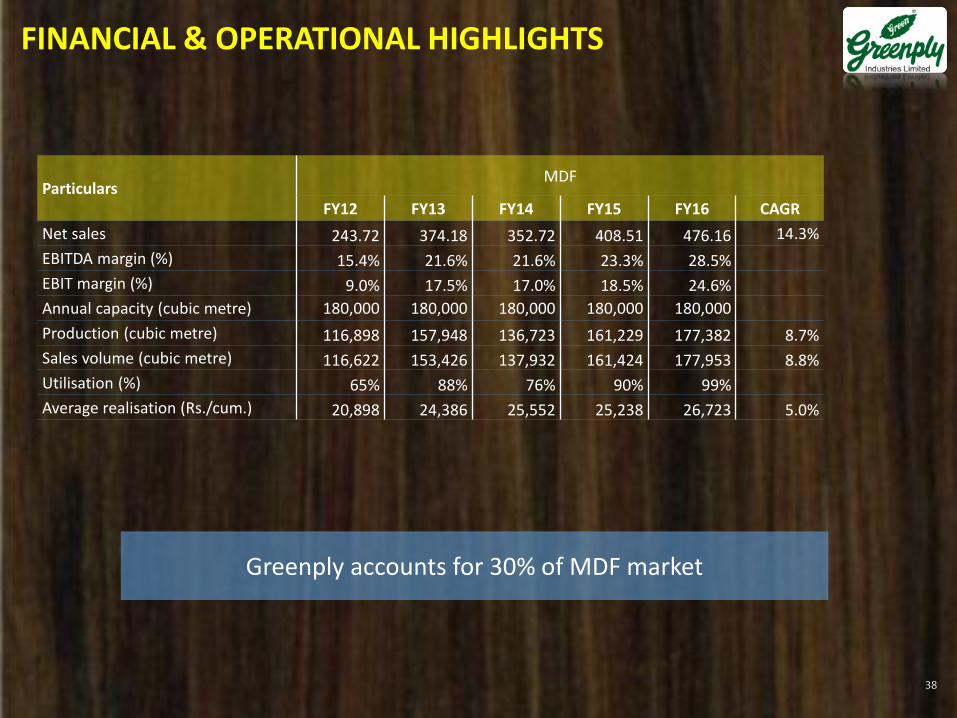
FINANCIAL & OPERATIONAL HIGHLIGHTS
38
Greenply accounts for 30% of MDF market
ParticularsMDF
FY12 FY13 FY14 FY15 FY16 CAGR
Net sales 243.72 374.18 352.72 408.51 476.16 14.3%
EBITDA margin (%) 15.4% 21.6% 21.6% 23.3% 28.5%
EBIT margin (%) 9.0% 17.5% 17.0% 18.5% 24.6%
Annual capacity (cubic metre) 180,000 180,000 180,000 180,000 180,000
Production (cubic metre) 116,898 157,948 136,723 161,229 177,382 8.7%
Sales volume (cubic metre) 116,622 153,426 137,932 161,424 177,953 8.8%
Utilisation (%) 65% 88% 76% 90% 99%
Average realisation (Rs./cum.) 20,898 24,386 25,552 25,238 26,723 5.0%
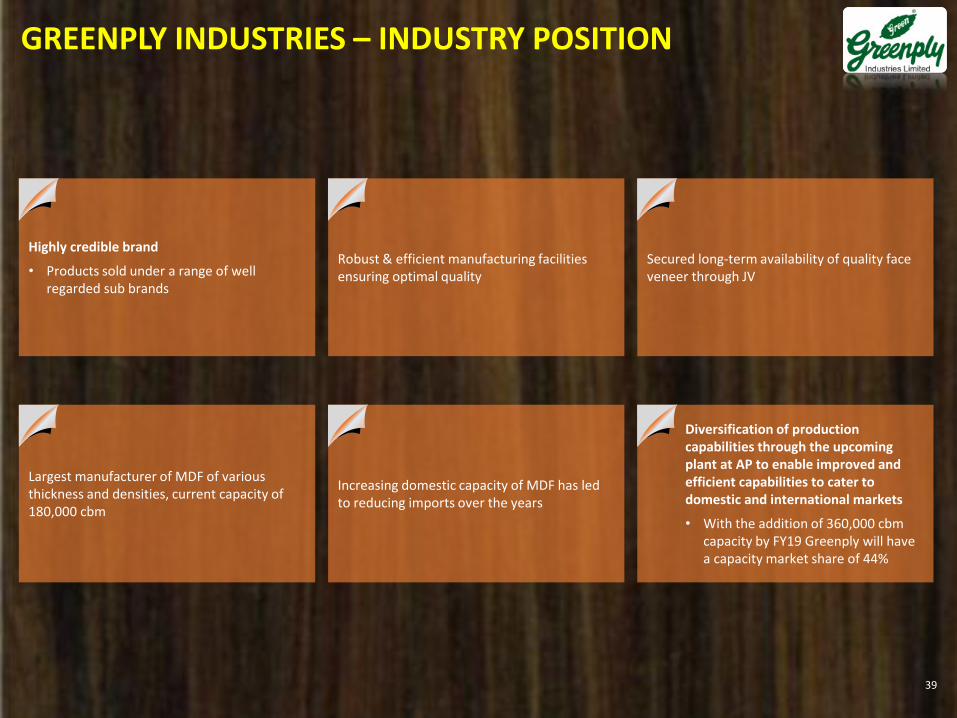
GREENPLY INDUSTRIES – INDUSTRY POSITION
39
Highly credible brand
• Products sold under a range of well regarded sub brands
Largest manufacturer of MDF of various thickness and densities, current capacity of 180,000 cbm
Robust & efficient manufacturing facilities ensuring optimal quality
Increasing domestic capacity of MDF has led to reducing imports over the years
Secured long-term availability of quality face veneer through JV
Diversification of production capabilities through the upcoming plant at AP to enable improved and efficient capabilities to cater to domestic and international markets
• With the addition of 360,000 cbm capacity by FY19 Greenply will have a capacity market share of 44%

INDUSTRY DRIVERS
• Rising demand from the real estate sector
• Increasing urbanisation, higher disposable incomes and a growing middle class
• Rollout of GST to facilitate faster shift from unorganised to organised players
EXPANSION PLANS
• Plywood
• MDF - Setting up of a new plant in Andhra Pradesh over FY16-19
PRODUCT PROFILE
• To improve mix of plywood through increase in mix of value-added products like Green Defender, Green Gold Prima and Natural Veneers
• To increase ratio of value-added products in MDF like Exterior grade MDF, Pre-Laminated MDF and Laminated Flooring / Veneer flooring
ADVERTISING & PROMOTIONAL SPENDS
• Continued investments in increasing brand visibility pan-India
• Maintaining Ad spends at around 3% of Net Sales
FINANCIAL PERFORMANCE
• Expect a 6-8% growth in FY17
• Margins expected to improve by 50-70 bps in FY17 driven by improved capacity utilisations and better product mix
DISTRIBUTION NETWORK
• To increase the number of distributors and retailers going forward
IT INITIATIVES
• Upgrading IT infrastructure – implemented SAP Hana to strengthen overall supply chain
• Implemented Microsoft CRM Module
Optimise utilisation in existing facilities
Increase outsourcing proportion to 30% from 22% presently over the next 3 years
GROWTH OUTLOOK
40

ANNEXURE
• Demerged the decorative business (comprising of laminates and allied productsand accounting for 37.2% of FY14 consolidated sales) of the company with all itsassets and liabilities into Greenlam Industries
• Record date for the demerger was 27 November 2014; Greenply Industriesstock traded as a demerged entity from 26 November 2014
• Greenlam Industries has issued and allotted to the shareholders of GreenplyIndustries one equity share of Rs. 5 each in Greenlam Industries for every oneequity share of Rs. 5 each held by them in Greenply Industries
• Mr. Saurabh Mittal, Joint Managing Director & CEO resigned from the Companywith effect from the close of the working hours of November 10, 2014, to takeup assignment in Greenlam Industries Limited
DEMERGER OF DECORATIVE BUSINESS
42

Different product characteristics
• The wood based products (plywood and mdf) form the backbone materials for furniture
• The decorative products (laminates and decorative veneers) are surfacing materials
Separate marketing reach
• Both businesses require different sets of dealers, distributors and intermediaries
• Plywood and MDF are sold primarily in the domestic market
• Laminates are sold both in domestic as well as international markets
Dedicated management focus
• Dedicated management focus and resource allocation in line with respective market trends to enable diversification and expansion into newer product portfolios for faster growth
Better cash management /
utilization
• Two separate companies will have independent cash flows and strengthen the prospects of each of the businesses towards mobilising funds to service their respective growth plans
RATIONALE FOR DEMERGER
43
ABOUT GREENPLY INDUSTRIES LTD.
Gavin Desa / Rabindra BasuCDR, IndiaTel: +91 22 6645 1237 / 1248 Email: [email protected] / [email protected]
V.Venkatramani – Chief Financial OfficerGreenply Industries Limited - ‘Madgul Lounge’, 23, Chetla Central Road,6th Floor, Kolkata – 700 027Tel: +91 33 3051 5000Email : [email protected]
For further information, please contact:
Greenply Industries Limited (GIL) enjoys leadership position in plywood and medium density fibreboards(MDF) accounting for almost 26 percent of the organized plywood and 30 percent of the MDF market inIndia.
GIL has four state–of-the-art manufacturing facilities for Plywood and one facility for MDF spread across thecountry producing world class interior products for the domestic and global markets. The company has apresence in over 300 cities across 21 states serviced through a well-entrenched distribution network of1,800 distributors and 10,000 retailers and 48 branches pan-India.
GIL is the preferred partner of choice for a large number of office and home builders having acomprehensive product portfolio servicing clients at every point of the price spectrum under brand namesof Greenply Plywood, Green Club Premium Ply, Optima Red, Ecotec, Green Panelmax and Green Floormax,to name a few.
44