grid analytics around the clock - osisoft
TRANSCRIPT

© 2020 OSIsoft, LLC 1Virtual Industry Summits
Grid Analytics around the clock
Anne van der Molen, Stedin2020-10-19

© 2020 OSIsoft, LLC 2Virtual Industry Summits
About StedinTransmission & Distribution
Serving ~2.2 million customers
To transport electricity and gas
And manage connection- and metering data
For whom we plan, build, operate and maintain grids
Regulated Electricity and Gas network operator (DSO)
In the South-Western part of the NetherlandsRotterdam/the Hague/Utrecht/ Zeeland / Kennemerland / North Friesland
© 2020 OSIsoft, LLC 3Virtual Industry Summits
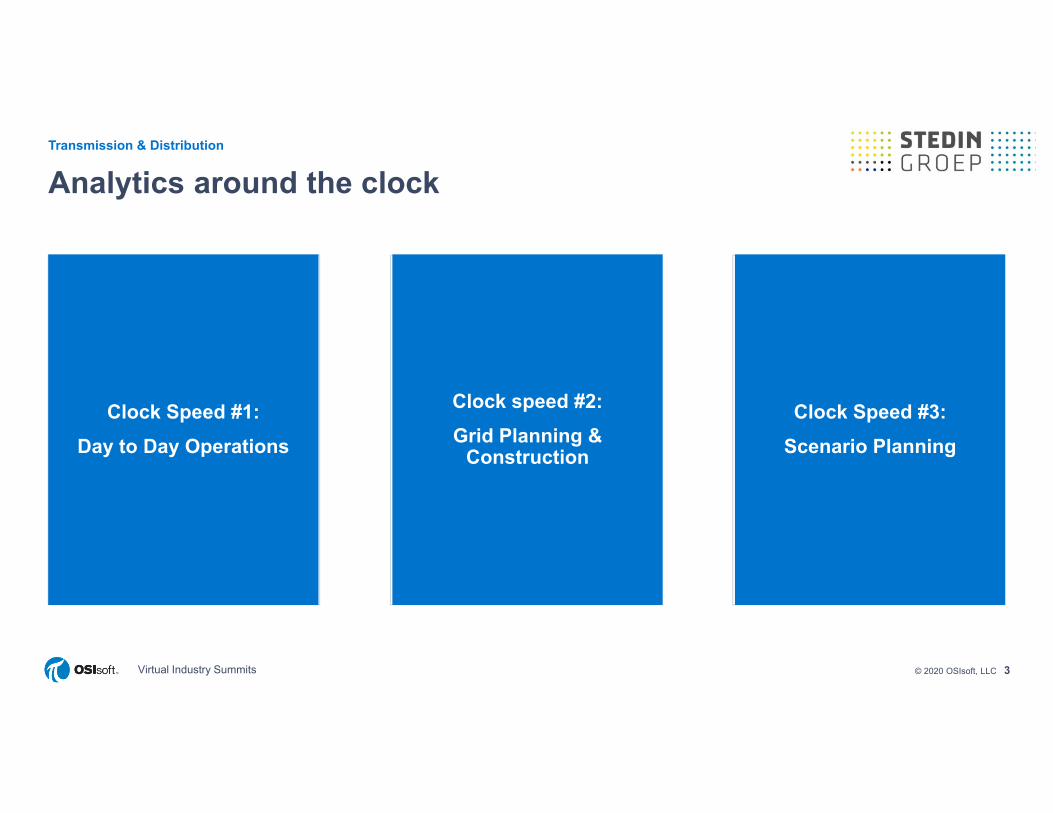
Analytics around the clock
Clock Speed #1:Day to Day Operations
Clock speed #2:Grid Planning &
Construction
Clock Speed #3:Scenario Planning
Transmission & Distribution

4
0
100
200
300
400
500
600
700
800
900
1000
1 2 3 4 5 6 7 8 9 10 11 12 13 14 15 16 17 18 19 20 21 22 23 24 25 26
load
(MW
)
Maart
Stedin HS Stations prov. Utrecht - mrt 2019 en mrt 2020
2019 2020
-30.00%
-20.00%
-10.00%
0.00%
10.00%
1 2 3 4 5 6 7 8 9 10 11 12 13 14 15 16 17 18 19 20 21 22 23 24 25 26
Clock Speed #1: Day to Day Operations

5
Clock Speed #1: Day to Day Operations
• (Load forecasting to TSO)• Check/ redo calculations
for work & switch planning• Check Grid Contingency
Planning• Increased voltage
violations & volt/var control
• Measurement infrastructure on substation level and prediction engine proved its value and importance, need to increase resolution
• Increased awareness of importance of accurate load modelling. AI and Machine Learning ?
• Process improvement • Grid analytics & decision
support

6
Increase situational awareness
Clock Speed #1: Day to Day Operations

7
Clock Speed #2: Grid Planning & construction

8
Clock Speed #2: Grid Planning and – Construction
• Forecast demand funnel• Forecast and
communicate available grid capacity (transport indication)
• Check and update approach grid (connection) planning
• Congestion management.
• Measurement infrastructure on substation level proved its value and importance, need to increase resolution
• Increased awareness of importance of accurate load modelling (i.e. demand funnel).
• Process improvement• Grid Analytics & decision
support

9
Clock speed #3: scenario planning

10
Clock Speed #3: Scenario Planning
• Jointly define Energy Scenario’s
• Calculate and discuss impact of energy scenario’s on grids.
• Check and update approach on investment planning
• Measurement infrastructure on substation level proved its value and importance, need to increase resolution
• Increased awareness of importance of accurate load modelling
• Process Improvement• Grid Analytics & decision
support

11
Approach
Clock Speed #1:Day to Day Operations
Clock speed #2:Grid Planning &
Construction
Clock Speed #3:Scenario Planning
Enterprise Digital TwinOperational Digital Twin
Contextual awareness Analysis & Impact assessmentProcess & skill development

12
Approach
Clock Speed #1:Day to Day Operations
Operational Digital Twin
Contextual awareness Analysis & Impact assessmentProcess & skill development
Epics portfolio:• Sensor data feeds • Forecasting• Congestion management, • Real-time grid & DER
control • Redispatch, curtailment,
ANM• Operational Grid Analytics

© 2020 OSIsoft, LLC 13Virtual Industry Summits
Analytics around the clock
Challenge• Major and fast uptake of solar,
electrification of heating andtransportation (EV), but alsouptake in demand puts pressureon the electricity grids.
• Stedin, authorities and grid users need instruments to monitor andpredict energy use , system andgrid usage and grid development
Solution• Providing monitoring and
consistent analytics capabilities for our core business processes
• Processes running at different clock speeds
Benefits• Developing a vision and a
transition path - technology, processes and skills. Use practical use cases as execution strategy.
• Resulting in: Increased operational, tactical and strategic awareness, significantly accelerated ‘Time to Value’
Transmission & Distribution

© 2020 OSIsoft, LLC 14Virtual Industry Summits
Thank you