gridsmart® at aep pso presentation...agenda and discussion goals i-2 • opening comments and...
TRANSCRIPT

2015 SWEDE Conference
Grapevine, Texas
May 2015
Brandon Fugate Michael Campbell
AEP Telecommunications AEP Grid Management Deployment
gridSMART® at AEP
PNNL-SA-105365

Agenda and Discussion Goals
I-2
• Opening Comments and Introductions
• Review of the IVVC System in Owasso, OK
• AEP VVO Technology Plan
• Alternate Evaluation Method – Bump Test
• Other gridSMART Activities
– Communications and Network Architecture
– AMI
– Rural Applications
– Sensors
– Distribution Automation
• Questions
• Adjourn

•3
AEP System Overview
• 5.3 Million customers
• 11 States
• 39,000 MW Generation
• 39,000 miles Transmission
• 220,000 miles Distribution
• 6,000 Distribution Circuits
• 3,200 D Transformer Windings

gridSMART® Growing
4
gridSMART® Modernization Activity Summary
Projects Smart
Meters
DACR
Circuits
VVO
Circuits
AEP Ohio - Phase I 132,020 70 17
AEP Ohio - Phase II 900,000 250 50-80
AEP Texas 1,029,000 19 N/A
PSO- Phase I 31,500 13 13
PSO Phase II 520,000 0 0
I&M
9,850
9 complete
+ 25
proposed
9
KPCO N/A
21
complete
+ 4
proposed
N/A
APCO N/A 3 complete
+ 3 planned N/A
SWEPCO N/A
16
complete
+3
proposed
N/A
Data is approximate/estimated
Distribution Automation Circuit Reconfiguration(DACR)
Volt VAR Optimization(VVO)

5
PSO gridSMART – System Overview

6
Goals of IVVC Operation: • Flatten and lower voltage
profile • Better control VARs • Reduce demand and
energy consumption • Maintain ANSI Voltages • Interoperable with DACR
Local Voltage Regulation
IVVC Voltage Regulation
Integrated Volt VAR Control (IVVC)

7
• ANSI Standard C 84.1 – 1995 “Electrical Power Systems and Equipment – Voltage Ratings”
• [similar to CAN3-C235-83 (R2000)]
–Nominal 120 VAC – Range A (Normal Operation)
•Service Voltage 114 V – 126 V
– Voltage at which utility delivers power to home
•Utilization Voltage 110 V – 126 V – Voltage at which equipment uses power
– Optimum voltage for most motors rated at 115 v
– Incandescent Lamps rated at 120 v
120
124
128
116
112
108
104
“A
” S
erv
ice
“A
” U
tiliza
tion
“B
” U
tiliza
tion
Volts at
Residential
Meter:
Historical
Voltage
Range
VVO Range
“B
” S
erv
ice
(Courtesy UtiliData)
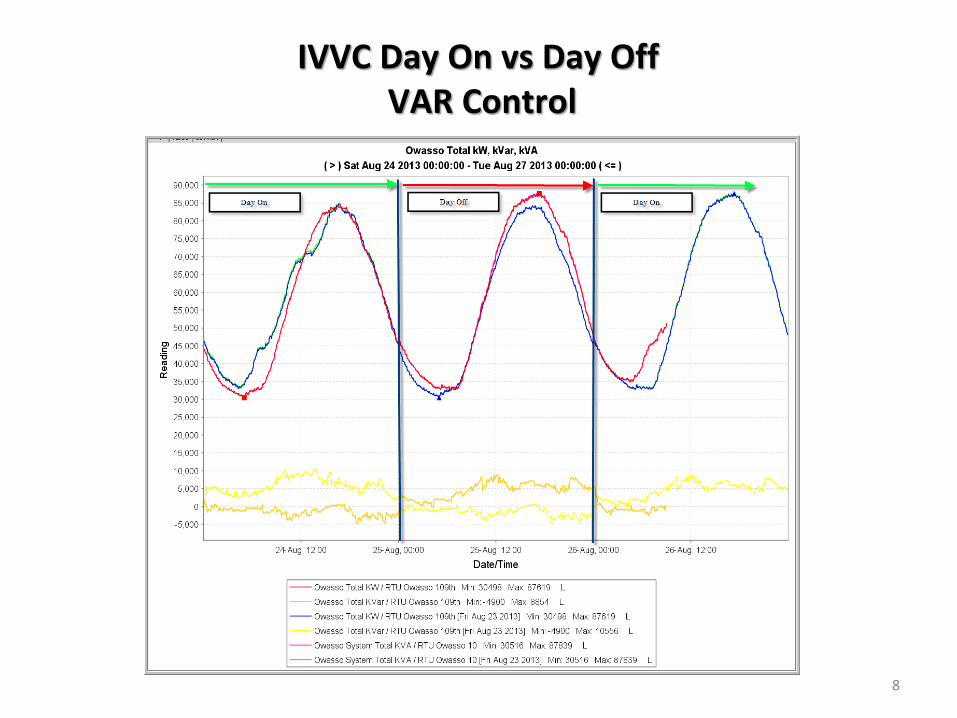
IVVC Day On vs Day Off VAR Control
8

9
Distribution Automation Circuit Reconfiguration(DACR)
and Integrated Volt VAR Control (IVVC)
Major System Components Include
• 3 distribution substations with 3-LTC’s and two (2) non-LTC transformer with bus regulators
•LTCs using Beckwith control and bus regulators using Cooper Power CLB6 Control
•Breakers using SEL351S Relays
•Breakers using S&C Intellinode modules
• 13 distribution feeders on a 13.2 kV base system (2 external ties)
• 43 S&C IntelliRupter DACR Switches and 21 Intellinodes on breakers and transformers
• 47 S&C IntelliCap Plus Series Capacitor Controls
• 50+ End of Line (EOL) voltage sensors 9 field distribution voltage regulator banks using Cooper Power CLB6 Control
• L&G Series IV IWR Radio (serial not IP)
•Separate Radio network from the metering portion of the project.
• SCADA Integration
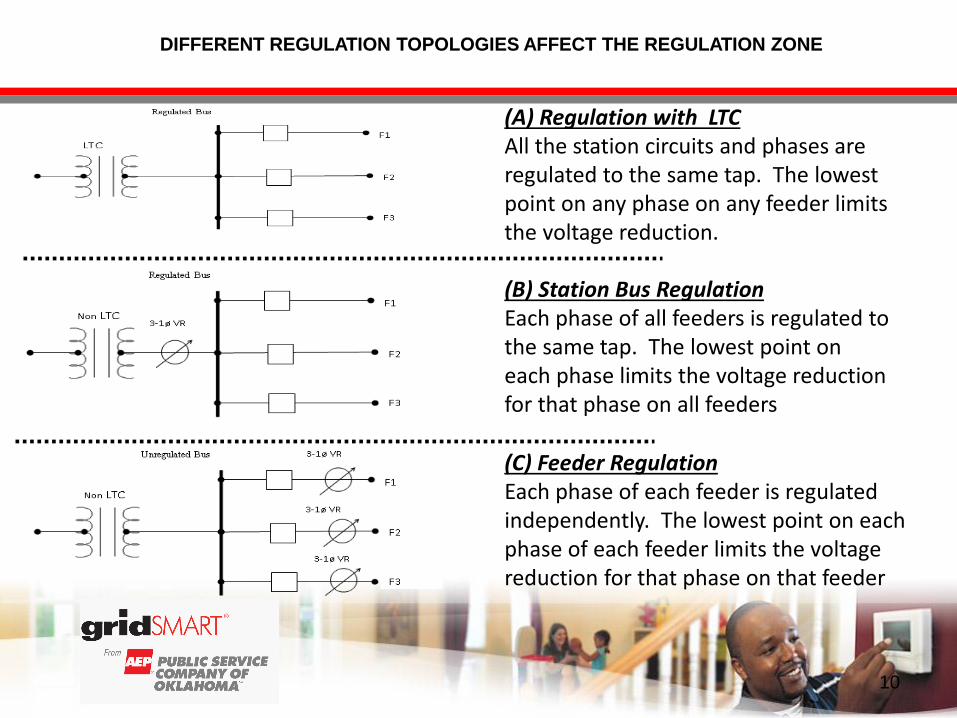
(A) Regulation with LTC All the station circuits and phases are regulated to the same tap. The lowest point on any phase on any feeder limits the voltage reduction.
(B) Station Bus Regulation Each phase of all feeders is regulated to the same tap. The lowest point on each phase limits the voltage reduction for that phase on all feeders
(C) Feeder Regulation Each phase of each feeder is regulated independently. The lowest point on each phase of each feeder limits the voltage reduction for that phase on that feeder
10
DIFFERENT REGULATION TOPOLOGIES AFFECT THE REGULATION ZONE

11
AEP’s Volt VAR Optimization Technology Strategy
Experience with three vendors: (alphabetical order)
• Cooper Yukon VVO
• GE VVO
• Utilidata AdaptiVolt™ VVO

IVVC Performance In Multiple States

Integrated Volt VAR Control (IVVC)
AEP’s gridSMART Projects
Performance Evaluations
• AEP has installed and evaluated different IVVC systems, in different areas,
on different feeders with different load dynamics and electrical topologies.
• We have seen varying results from these system studies, as is expected.
• It is not correct to directly compare the operation of the various systems due to many factors including:
• Load composition
• Electrical System topologies including regulators, capacitors, conductors, stations
• Class of customers and the overall load mix
• Data resolution used in the study
• What is the take away then?
• IVVC works and does achieve savings to the end use customer.
• All systems have room for improvements.
• Example: do they achieve operation within limits, pf control, increase or decrease the operation of devices versus no IVVC?

Evaluation of VVO Performance
AEP asked PNNL to evaluate the effectiveness of the Yukon IVVC
system as an independent third party
2013: Day-on / day-off evaluation of effectiveness of IVVC system
Formal kick-off meeting to confirm operating methodologies, setpoints, data
collection
Highly favorable results – significant energy savings
Power factor controlled on average more closely to unity compared to default
settings
2014: Follow-up Study
New method of evaluation – “bump test” – compared to day-on / day-off method
Savings evaluated based on energy consumption recorded at the customer meter
Behind-the-meter savings verified
Results broken out by customer class
•14

Binned data plotted vs time of day
Raw real power demand of a single feeder vs time of day
Each small dot is an individual MW measurement
Thick solid lines are the average of the two bins
To remove confounding effect of correlation of power demand
with ambient temperature, apply temperature correction process
Fit polynomial to real power demand vs ambient temperature
Apply correction factor to shift demand to median temperature
Perform independently at each time of day
•15

Binned, temperature-corrected power demand
•16
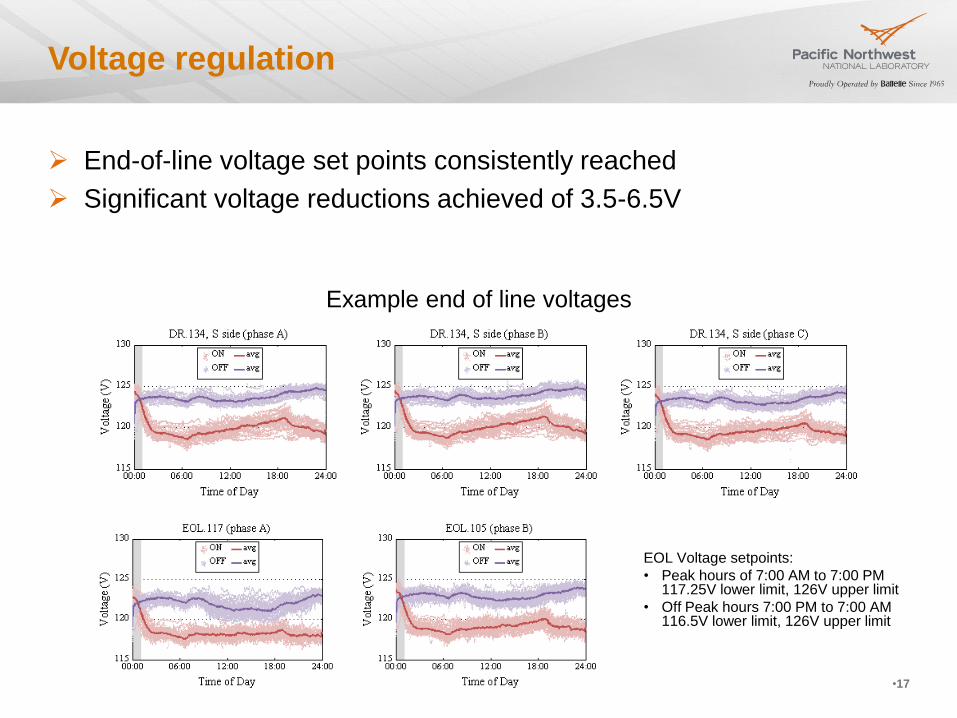
Voltage regulation
End-of-line voltage set points consistently reached
Significant voltage reductions achieved of 3.5-6.5V
•17
Example end of line voltages
EOL Voltage setpoints:
• Peak hours of 7:00 AM to 7:00 PM 117.25V lower limit, 126V upper limit
• Off Peak hours 7:00 PM to 7:00 AM 116.5V lower limit, 126V upper limit

Reduction in energy consumption
Plots show per-
phase energy
reduction for each of
the 13 feeders
Left: total MWh/day
Right: %
System-wide totals
(weekday):
4.5±0.3% per day
56.0±3.0MWh per
day
•18
0 0.5 1 1.5 2 2.5 3
ZN6
ZN5
ZN4
ZN3
ZN2
ZN1
XG4
XG3
XG2
XG1
OW5
OW3
OW1
(MWh)
Feed
er
Nam
es
Energy Reduction (M-F)
A
B
C
0 2 4 6 8
ZN6
ZN5
ZN4
ZN3
ZN2
ZN1
XG4
XG3
XG2
XG1
OW5
OW3
OW1
(%)
Feed
er
Nam
es
Energy Reduction (M-F)
A
B
C

Day-on / day-off VVC analysis protocol requires 90 days of day-on day-
off data collection, large amounts of data (150 million data points), and
complex temperature correction
Goal: develop a simpler method of benchmarking a VVC system
that could be done in a shorter period of time
•19
Bump test motivation

When the IVVC system is turned off, the voltage rises abruptly
As the voltage rises, the power demand also rises abruptly
The size of the response at that single point may be indicative of the
instantaneous power demand reduction of the VVC system
•20
16:40 16:45 16:50 16:55 17:00 17:05 17:10 17:15 17:202.2
2.4
2.6
2.8
3OW3
Time of Day
MW
dem
an
d o
n f
eed
er
118
120
122
124
126
Vo
ltag
e a
t fe
ed
er
head
Bump test motivation

•21
Energy reduction behind the customer meters
Warrants more study
Large percentage of total energy reduction is behind the customer meter
Residential customers showed the strongest CVR response, commercial intermediate, and
industrial customers showed a weaker CVR response
Data from customer meters
-10 0 10 20 30 40
P
I
C
R
Energy Reduction (M-F)
(MWh)
Feed
er
Nam
es
-2 0 2 4 6 8
P
I
C
R
Energy Reduction (M-F)
(%)
Feed
er
Nam
es

Conclusions
Overall reductions in energy consumption were significant
Power factors at the feeder level were improved by the Yukon IVVC system.
Bump test percentage energy reductions match day-on/day-off study well
Day-on/day-off study requires 150 million data points and 90 days of data
Bump test calculation requires 2,500-30,000 data points and 7-14 days of data
Promising enough to warrant further study
Energy savings verified to be substantially behind the customer meter
Residential customers showed the strongest CVR response, with commercial
intermediate and industrial the weakest CVR response
•22
Other gridSMART Activities
I-23
– AMI/AMR
– TOU Rates
– Demand Respond
– Batteries, CES
– Rural Applications
– Distribution Automation
• Using many different technologies around the system
• Integrating to SCADA systems
• Developing standards for installations
• Ensuring integration with manual, UF and UV load shedding
– Communications and Network Architecture – Mr. Brandon Fugate
24
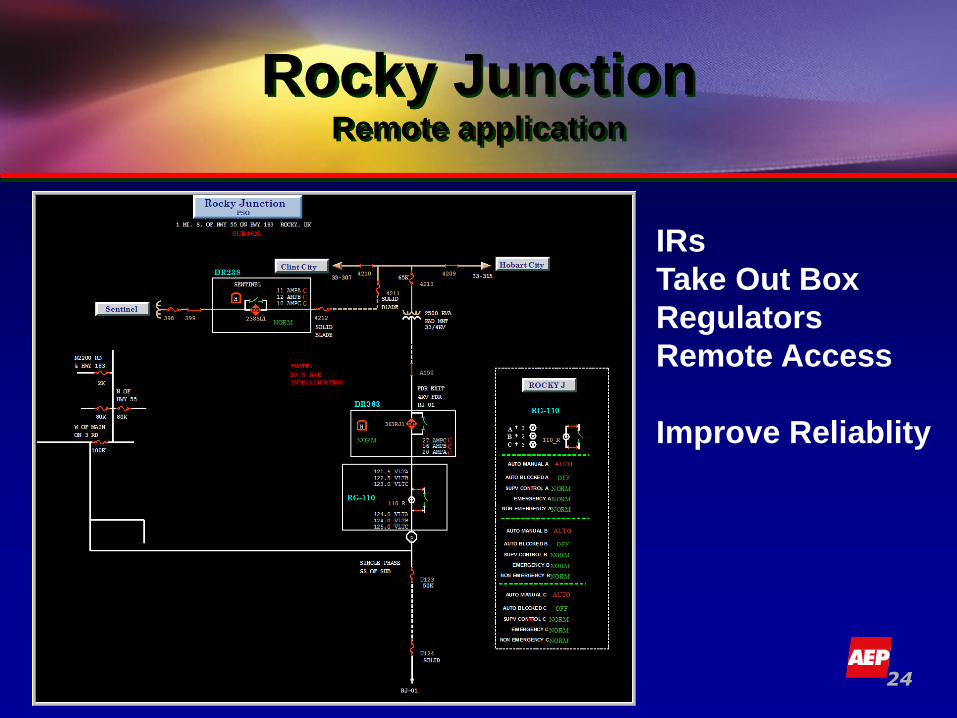
Rocky Junction Remote application
•
IRs
Take Out Box
Regulators
Remote Access
Improve Reliablity

25
Government Wells Remote application
Safety and Resources
•
•Remote Location
•Improvement in Reliablity needed
•Safety for Employees
•Funding Levels

Communicating Fault Sensor

27
Capacitor Bank Monitoring
•

Communications
• Wide Area Networks (Backhaul)
• Routers connected via transport system
• Fiber, Microwave, Lease-line(MPLS), Cellular
• Local Area Networks (Local)
• Ethernet Switches, Relays, Converters, HMI
• Neighborhood Area Network (Field Communicating Devices)
• Distribution Switches, Capacitor Banks, Voltage Regulators, Sensors
•28

Network Architecture
•29
DSCADA Distribution
RTU - Intellinodes
- LTC’s
- Bus Regulators
VVO
Back Office Station
Field
Transmission
RTU - Distribution Breakers
- Distribution Cap
Banks
- Bus Tie Breakers
- Transformer LS
Breaker
TSCADA
DACR
Line Devices - Reclosers
- Line Regulators
- Capacitors
- Line Metering
Devices
T SCADA
Network
Firewall
Corp
D SCADA
Network
Firewall
Station
Router
Trans.
NonCIP
Station
Router
D
Network
Station
Router
Field
Network
T SCADA Network
D SCADA Station Network
D Server Network
D SCADA Field Network D SCADA Field Serial T RTU – D RTU Serial Link
Corp Network
Optional 1
Optional 2

NAN RF Propagation of Owasso Area DA\VVO
•30

Typical Remote Installation
•31
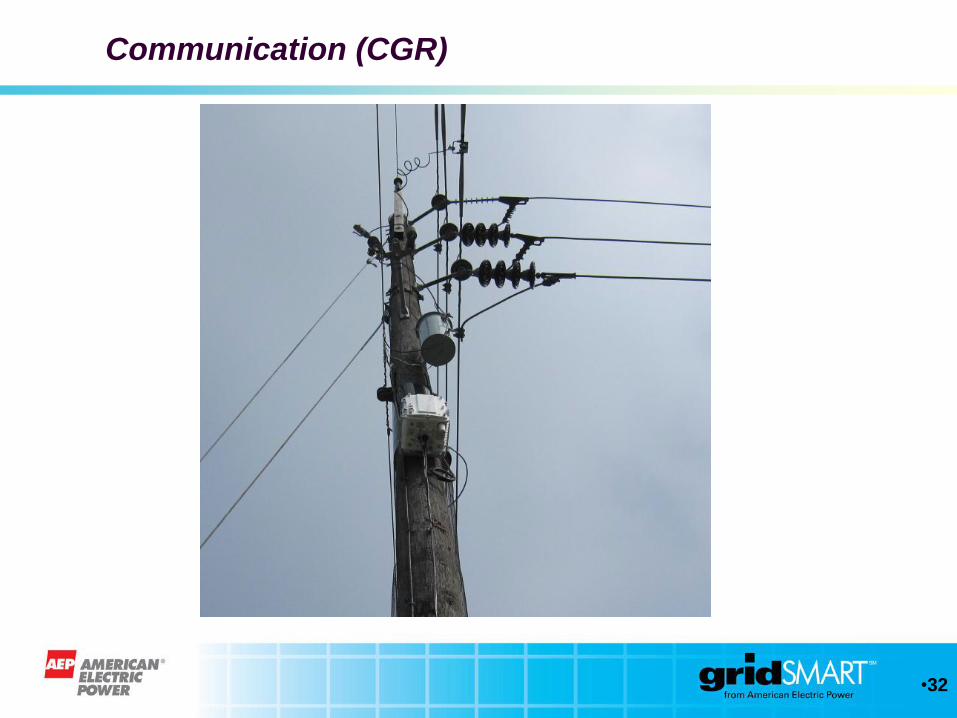
Communication (CGR)
•32

Communication (Antennas)
•33

Communication (Take-Out Box)
•34

Regulator Station Install
•35

Communications Regulator Control
•36

Brandon Fugate
AEP Telecommunications
918.599.2312
Michael Campbell
Grid Management Deployment
American Electric Power Company
479.973.2346
Thank you.
PNNL-SA-105365