ground water potential evaluation based on integrated gis
TRANSCRIPT

American Scientific Research Journal for Engineering, Technology, and Sciences (ASRJETS) ISSN (Print) 2313-4410, ISSN (Online) 2313-4402
© Global Society of Scientific Research and Researchers
http://asrjetsjournal.org/
Ground Water Potential Evaluation Based on Integrated
GIS and Remote Sensing Techniques, in Bilate River
Catchment: South Rift Valley of Ethiopia
Tesfaye Tessema Gintamo*
Ethiopian Kale Heywet Church Development Commission, Integrated Water and Sanitation Program
P.O.Box: 5829, Addis Ababa, Ethiopia,
Email: [email protected]
Abstract
A systematic evaluation of groundwater is essential for the proper utilization and management of this precious
natural resource. Integrated GIS and remote sensing are efficient techniques in groundwater studies; in facilitate
better data analysis and their interpretations of groundwater potential controlling parameters. In the present
study, an attempt had been made to delineate and classify possible groundwater potential zones in the Bilate
River catchment using integrated remote sensing and GIS techniques. The thematic layers considered in this
study are lithology, geomorphology, drainage density, lineament density, rainfall, soil, slope and land use/ land
cover were prepared using the Landsat ETM+ imagery and ArcGIS software. All the thematic layers were then
assigned weights according to their relative importance in groundwater occurrence and the corresponding
normalized weights were obtained based on the Saaty's analytical hierarchy process. These weights were applied
in linear summation equation to obtain a unified weight map containing due weights of all input variables. The
thematic layers were finally integrated using ArcGIS and IDRIS software to produce a groundwater potential
zone map. Thus, four different groundwater potential zones were identified, namely 'high, 'moderate’,' low’ and
'poor'. The high potential zones correspond to alluvial plains, lacustrine sediments, the fracture valleys, and
valley fills, which coincide with the low slope and high lineaments density areas .The eastern portion and valley
escarpment of the study area fall under moderate groundwater potential zone. The low zones mainly comprise
structural hills and an escarpment which contributes high run-off .On the other hand; Poor groundwater potential
zones are present in the mountain peaks, plateaus and escarpments with steep cliff.
------------------------------------------------------------------------
* Corresponding author.
E-mail address: [email protected].
85

American Scientific Research Journal for Engineering, Technology, and Sciences (ASRJETS) (2015) Volume 10, No 1, pp 85-120
The resulted groundwater potential zoning map validated based on existing water sources point data of the study
area. Finally, it is concluded that the integrated GIS and remote sensing techniques are very efficient and useful
for the identification of groundwater potential zones.
Keywords: Bilate River; Groundwater potential; GIS and remote sensing; western escarpment; thematic maps
1. Introduction
Ground water is the safest and most reliable water source, use in domestic, irrigation, industries, and
municipality purposes. Ground water development for water supply purpose is preferable to low discharge
springs and dug wells because they are found to be inadequate yield and no longer resistant drought while most
of them might be completely dried out and never easily recovered after the prolonged drought time. The
occurrence, origin, movement and chemical constituents of groundwater are dependent on geology/ lithology,
Geomorphology /Landforms, drainage density, rain fall, Geological structures/lineaments, slope, Land use/Land
cover and soil of groundwater regime.
It is common to have problem in exploitation of groundwater in that unsuccessful rate of well production
encounter and requires huge amount of investment cost to utilize this precious resources. Improper evaluation
of groundwater and site selections is mostly expected to pose the problems. Since the groundwater occurs out of
our sight, deep in the subsurface, there is no direct method to facilitate observation of water below the surface.
Its presence or absence can only be inferred indirectly by studying the groundwater occurrence and distribution
controlling parameters. Thus, in order to ensure wise use of groundwater, a systematic evaluation of
groundwater is required.
There are several methodologies to locate and map the occurrence and distribution of groundwater. Nowadays,
both Geographical Information System (GIS) and Remote Sensing (RS) are regarded as essential tools for
groundwater studies especially for extended and complex systems [1].The information on the input parameters
in the above can be acquired and integrated through remote sensing and geographical information system (GIS)
techniques. The concept of integrated remote sensing and GIS has proved to be an efficient tool in groundwater
studies, in facilitate better data analysis and their interpretations [2]. In addition, the greatest advantages of using
remote sensing data for hydrogeological investigations and monitoring is its ability to generate information in
spatial and temporal domain, which is very crucial for successful analysis, prediction and validation [3].
The present study focused on the evaluation of groundwater potential zone in south Ethiopian rift escarpment,
the Bilate River catchment in SNNPR, based on integrated Geographical information system (GIS) and remote
sensing techniques.
The catchment covers the area between Gurage high lands to Lake Abaya shore, which includes the portion of
SNNPRS regional zones; Hadiya, KT, Gurage, Silte, Wolyita, Sidama, and Alaba special woreda and small
parts of the South-central Oromiya Regional states and the total area coverage is around 5625 square kilometer.
For the study area is part of the main Ethiopian rift, it is highly affected by the uplift and subsequent rifting
86

American Scientific Research Journal for Engineering, Technology, and Sciences (ASRJETS) (2015) Volume 10, No 1, pp 85-120
phenomena that created localized and regional fractures and faults,( the rift floor and escarpments are highly
faulted ); the complex spatial and temporal distribution of the volcanic rocks, their different intricate
stratigraphic and structural relationships, wide compositional variability, different degree of weathering and
topographic position complicate the hydrogeological behavior of the volcanic aquifers and the hydrochemical
signature requires systematic and scientific approach of investigation to determine the groundwater potential in
the area [4].
Moreover, most of the area is known in high scarcity of surface water and due to recurrent drought, substantial
part of the area water supply comes from groundwater has taken great attention.
Lack of adequate potable and agricultural water supplies inhibits the progress of developing countries and is the
cause of considerable hardship to humans world-wide, but a thorough hydrogeologic understanding is often
critical for cost effective water development designed to alleviate these hardships [5].
Despite water requirement is increasing very rapidly with the growth of human and animal population, and
irrigation in the area, analysis of water resources has been fragmentary.
Thus, as a part of filling the gap, the present study, GIS and remote sensing techniques was used to
systematically assess the importance of each input parameters in the evaluation of groundwater occurrence and
potential zone in the area.
2. Objectives
The main objective of this research is to evaluate and delineate ground water potential zones in the Bilate River
catchment using integrated geographic Information system (GIS) and Remote sensing techniques.
The Specific Objectives are as follows:
• To evaluate the ability of currently used GIS and remote sensing techniques to distinguish or delineate
target features controlling groundwater occurrence.
• To produce hydrogeological map of the area based on the available data interpretation and analysis that will
be a good basis for detailed groundwater exploitation work
• To adopt different GIS and remote sensing software as a tools in developing spatial data that help in
decision making and planning
• To identify the degree of role of groundwater occurrence and distribution controlling parameters in the
study area and their relationship to each other.
3. Methodology and Approaches used
The study was carried out in several stages to delineate potential groundwater zones that reveal the capability of
using remote sensing and GIS in groundwater exploration study as presented schematically and described in the
following steps.
87

American Scientific Research Journal for Engineering, Technology, and Sciences (ASRJETS) (2015) Volume 10, No 1, pp 85-120
3.1 Dataset Identification
The occurrence and movement of ground water controlling factors, such as (geology (lithology and lineaments),
rainfall, geomorphology/landform, slope, drainage, and land use/land cover, and soil) generated primarily from
satellite imageries through digital image processing techniques and existing data.
The collected relevant data, in the initial stage of GIS spatial database development various analogue maps,
which were in different scales obtained from different organizations, converted into digital format by using
manual digitization method using ARCGIS 9.2 software.
3.2. Building the Research Geodatabase
The generated, collected and digitized data was organized into logical groups of entities concerning geological
factors (Lithology and lineament density), drainage density, and physiographic factors (geomorphology, slope,
Land use/Land cover).Then, individual entities assigned and converted to characteristic spatial representation
format in order to make them suitable for analysis. After making decision on the research geodatabase, the data
sets prepared so that it help to develop the following maps in the target area.
In order to demarcated the groundwater potential zones of study area different thematic maps on 1:700,000
scales and 30m pixel size prepared from remote sensing and topographic maps. Drainage density map prepared
from SRTM data 3DEM Hydro processing. Elevation map prepared from SRTM and topo sheets. Slope map
prepared using Digital Elevation Model (DEM). Land use/land cover map prepared using supervised
classification in EDRIS 9.1 software for Landsat ETM+ image 2001. Groundwater potential zone map prepared
using overlay analysis using IDRIS and ArcGIS software’s.
3.3 Data Analysis
In this stage, digital image processing of the satellite data carried out for extraction of pertinent information. The
groundwater exploration in the study area involved thematic map generation and their integration through GIS.
Prior to integration of different information, individual class weights and map scores was assessed based on
Satty’s Analytic Hierarchy process where a pair – wise comparison matrix prepared for each map using a nine
point important scale.
Table 1: Satty’s Analytic Hierarchy process a nine point important scale.
Rating 1/9 1/7 1/5 1/3 1 3 5 7 9
Qualitative
description
Extrem
ely
Very
Strong
Strong
ly
Moder
ately
Equally Moderat
ely
Strongl
y
Very
Strongly
Extrem
ely
Less Important More Important
The result unified weight map containing due weights of all input variables. The weight values this final map
further logically was classified to arrive at groundwater potential zone map. This provides a broad idea about the
88

American Scientific Research Journal for Engineering, Technology, and Sciences (ASRJETS) (2015) Volume 10, No 1, pp 85-120
groundwater prospect of the area.
To achieve the final target of the study, delineation of groundwater potential zones, different thematic layers;
lithology, lineament density, drainage density, geomorphology, slope, soil, and land use/land cover and rainfall
integrated.
3.5. Data Interpretation
The different polygons in the thematic layers labeled separately and then they were converted to raster and
registered. In the final thematic layer initially each one of the raster qualitatively the final potential groundwater
map.
Figure 1: Conceptual Flow chart of groundwater potential evaluation using GIS and RS mapping methodology
applied on the Bilate River Catchment.
89

American Scientific Research Journal for Engineering, Technology, and Sciences (ASRJETS) (2015) Volume 10, No 1, pp 85-120
4. General overview of the study area
4.1 Location and Accessibility
The study area Bilate River catchment is situated in South Western Escarpment of the Main Ethiopian Rift at
about 130 Km North West of the regional town Awassa and 340km from Addis Ababa through the asphalt road
from Addis Ababa to the Arbaminch town that passes via towns of Shashemane, Alaba Kulito,Wolayta Sodo of
SNNPR. It can be also accessible through 230Km asphalt road from Addis Ababa –Hossana in Northern part
and Inter site accessibility is possible by currently made dry weather roads in the and other feeder dry-weather
access roads that connect different parts of the study area. But during rainy seasons especially starting from June
through October most part of the catchment area is inaccessible.
The River catchment includes the portion of SNNPRS regional zones; Hadiya, KT, Gurage, Silte, Wolyita,
Sidama, and Alaba special woreda and small parts of the South-central Oromiya Regional states. It covers an
area of about 5625 kilometer square. It is bounded in geographic coordinates of 365483W to 426838E at Abaya
Lake in southern part Woliya Zone to 726037S to 896469N at Gurage and Silte zones border in the Northern
part Figure 2
Figure 2: Location map and Digital Elevation Model (DEM) of the study area
90

American Scientific Research Journal for Engineering, Technology, and Sciences (ASRJETS) (2015) Volume 10, No 1, pp 85-120
4.2 Physiography and Drainage
Physiographically the Bilate River basin is a tectonic valley along its length much of the valley is bounded by
fault scarps or steep slopes on either side. The floor of the valley is mostly flat plain and appears to be in part a
remnant of the depositions floor of ancient large water basin.
For the study area is part of the western rift margin which is characterized by chain ridge, hills, deep and wide
valleys of small and large streams, and narrow flat lands between the valleys having gentle slopes. It is due to
the uplift and subsequent rifting phenomena that created localized and regional fractures and faults, (the rift
floor and escarpments are highly faulted [6]. The setup is also caused by erosion, deposition processes, and land
use practices. .
The altitude of the catchment ranges from 1177 meter at Lake Abaya to 3328meter at Mt. Ambaricho and at
Alicho Wiriro Woreda above sea level. This indicates that the topography of the area ranges from lowland plain
areas to highly rugged and mountainous elevated terrains. Due to the effects of these elevated and other
mountains around the area such as Duguno Fango ridge, Mt. Dato, and Mugo ridge that made the morphology of
the study area is quite complex, starting from the edge of the North West and South-west part of the area
characterized by steep slopes .Towards the centre and the South, the morphology changes to quite gentle slopes
though there are some steep slopes along the river courses and hilly features. The catchment is bounded by Omo
– Gibe basin to the south west, Ziway – Abijata – Shala, Lakes basin to the east and Lake Abaya to the south.
The Bilate River flows from the Gurage Mountain in the north towards the south in to the Lake Abaya. It is one
of the three main perennial rivers such as Bilate, Gidabo and Gelana that flow into the Lake Abaya. Generally
many small streams drain towards Abaya Lake along with Bilate River. Most of its tributaries as well as large
volume of water comes from Gurage, Silte, Hadiya, kambata and Wolyita zone high lands of the catchment. The
increase downstream could be influenced by the corresponding low rainfall, high evapotranspiration, relatively
slow drainage and thermal springs that join the river downstream.
The drainage density is high in the plateau and escarpment area and very low in the rift floor. It is due to
intensive faulting and volcanic activities in the area. In many places small stream disappear in the floor, before
reaching the major drainage system [7]. In general the area is characterized by dendritic and rectangular
drainage pattern, see figure 16.
4.3 Climate
Precipitation Variability, Climatically, rainfall variability and intensity in the catchment follows a humid to
semi- arid tropical bimodal distributed precipitation pattern. Variability is caused by alternating dry and rainy
seasons, as well as long-term influences, which is overlapping with regional orographic effects [9].
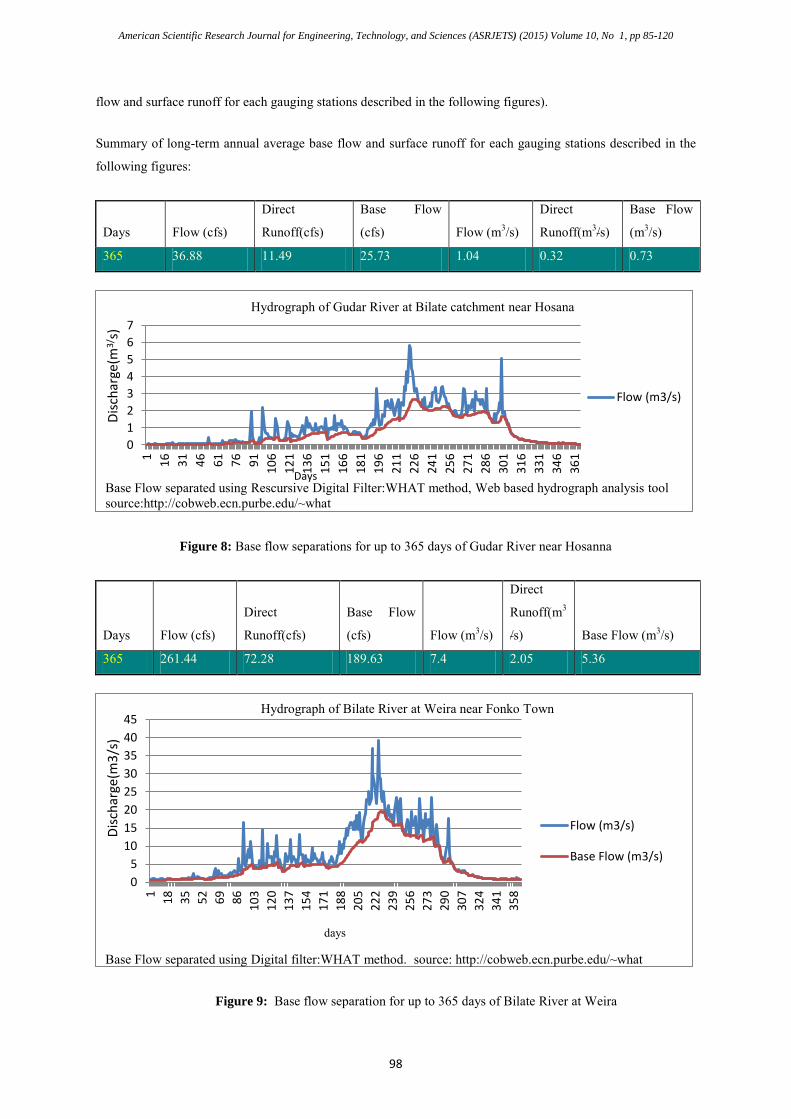
The analysis of data of 21 meteorological stations in the area and nearby stations shows the area receives an
average rain fall of 1145.82mm per year. From the analysis result observed that two rainfall pattern exist in the
area, unimodal in the northern and north western part which receives relatively higher precipitation amount
91
American Scientific Research Journal for Engineering, Technology, and Sciences (ASRJETS) (2015) Volume 10, No 1, pp 85-120
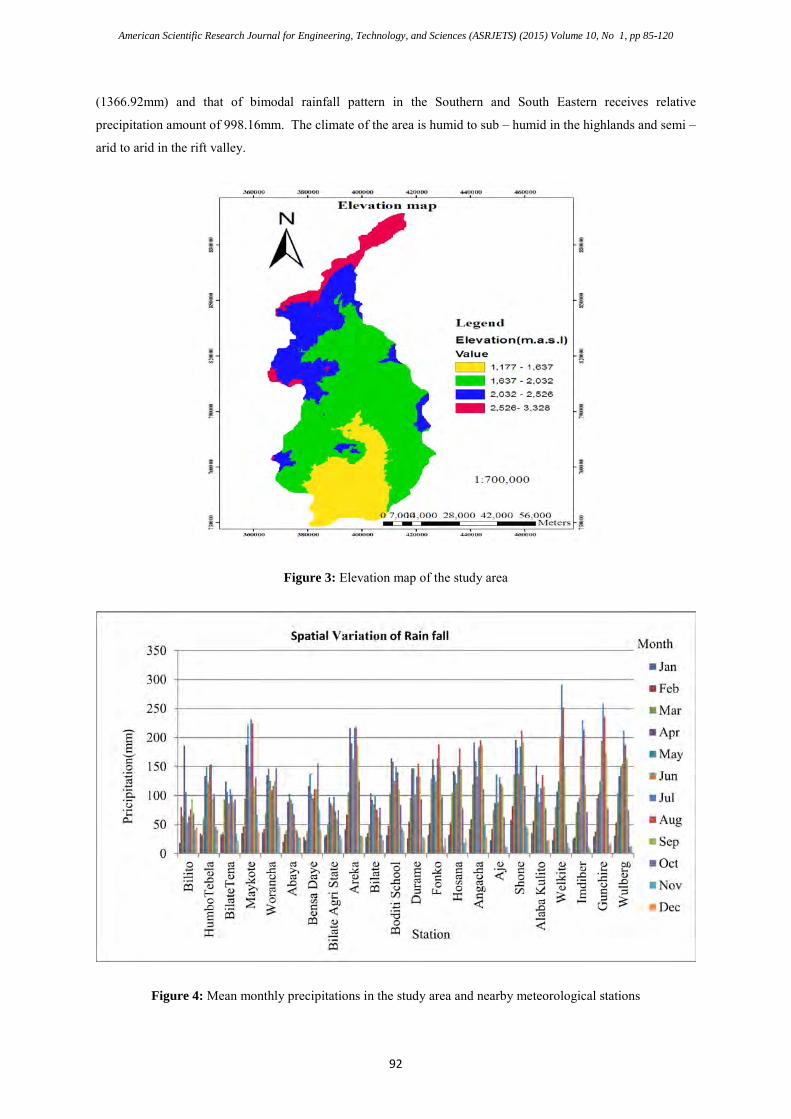
(1366.92mm) and that of bimodal rainfall pattern in the Southern and South Eastern receives relative
precipitation amount of 998.16mm. The climate of the area is humid to sub – humid in the highlands and semi –
arid to arid in the rift valley.
Figure 3: Elevation map of the study area
Figure 4: Mean monthly precipitations in the study area and nearby meteorological stations
92

American Scientific Research Journal for Engineering, Technology, and Sciences (ASRJETS) (2015) Volume 10, No 1, pp 85-120
The long term mean annual temperature vary widely, it ranges from 16.650C in the highlands and around
22.100C in the lowlands. The maximum and minimum relative humiddity of the area is estimated as 81.17 %
during the month July and 56.10 % during the month February respectively. The long term mean annual wind
speed at 2m above the ground leve is 1.55 m/s(table 2.1).The potential and actual evaptranspiration of the area
are 1162.48 mm and 966.318mm respectively(figure 6).
Table 2: Long term mean monthly values of Tempretture (°c), Relative humidity(%) , wind speed(m/s)and
sunshine (hrs/ day)
5. Preparation of Thematic maps using GIS and Remote sensing techniques
The groundwater evaluation in the study area involved thematic map generation and their integration through
GIS.
Thematic maps were prepared in the scale 1:700,000 with a spatial resolution of 30 meter pixel size from
satellite imagery, topographical, and geological mapping and other hydrogeological field data.
The maps were developed in a GIS environment using eight input parameters that indicate groundwater
potential as shown in the next section.
93

American Scientific Research Journal for Engineering, Technology, and Sciences (ASRJETS) (2015) Volume 10, No 1, pp 85-120
Groundwater potential zonation means identifying and mapping the prospective ground water zones in an area
by qualitative assessment of the controlling and indicative parameters.
The main factors responsible for groundwater resource development are rain fall/precipitation,
geology/Lithology, geomorphology/land form, land use/land cover, drainage, slope, soil, lineaments etc.
Thematic maps for each parameter prepared as follows:
5.1 Precipitation
Precipitation and evaporation are the two fundamental phases in the hydrological cycle which involves
processes in the atmosphere and at the earth’s surface/atmosphere interface.
Precipitation is the primary input of the hydrologic cycle [8]. It plays an important role in the hydrologic cycle
which controls groundwater potential. Knowing the nature and characteristics of precipitation, we can
conceptualize and predict its effects in runoff, infiltration, evapotranspiration, and water yield. Therefore, for
hydrologic analyses it is important to know the areal distribution of precipitation. Several areal precipitation
estimation techniques are currently used for averaging precipitation depths collected at ground stations. The
isohyetal and Thiessen polygon techniques are conventional techniques that are usually applied to estimate the
areal precipitation .Since rainfall is not evenly distributed over the area of study due to the topographic
variability of the catchment areas, and alternating dry and rainy seasons, the isohyetal polygon techniques was
applied to estimate the areal precipitation over the entire basin [9].
Figure 5: Isohytal rainfall map of the study area Figure 6: Reclassified Rainfall map of the study area
94

American Scientific Research Journal for Engineering, Technology, and Sciences (ASRJETS) (2015) Volume 10, No 1, pp 85-120
Precipitation forms the principal source of direct recharge which occurs in areas with a surplus of rain fall over
evapotranspiration [10] and it can be governed by the rainfall distribution, topography, land use /land cover,
soil and geology etc.
5.2 Recharge and Discharge
Ground water recharge can be defined as precipitation that infiltrates into soil to saturated zone to a depth below
the root zoned of surface vegetation where it cannot be removed by evaporation and becomes ground water.
Ground water recharge area is the land area that encompasses this process.
Thus, in groundwater potential evaluation, quantification of groundwater recharge is very important to know the
areal distribution of it. There are different models to estimate recharge in a given area depending on actual areal
conditions. In this case two methods: Base flow records and water balance approach was used.
Recharge map developed based on annual recharge for each gauging stations and the final below Bilate tena
(Dimutu) area recharge amount which was determined on water balance recharge estimation and distributed
according to area coverage above gauging stations
In general, groundwater in the region is recharged by precipitation on the mountains and mostly through bedrock
beneath these mountains may also receive direct recharge, which feeds the valley fill sediments and alluvial deposits
mainly along fault/fracture zones graven.
5.2.1 Recharge Estimation using water balance approach
Water balance can be determined by calculating the input, output, and storage changes of water at the Earth's
surface. The main input of water is from precipitation and output is from evapotranspiration.
In water balance studies , it is usually assumed that the catchment is water tight and that no subsurface
movement of water across the defined water shed is occurring and the evaluation of change in storage depends
on the time period over which the water balance is being made on annual basis , the time at which the balance is
effected is chosen so that the water stored in the ground and in surface storage is approximately the same each
year and thus in the equation change in storage ∆ S = 0.
After substituting relevant values in the below equation variables obtained from table 3 resulted,
(1)
(2)
From Penman formula for open water evaporation, E0 = (Δ/γH +Ea)/Δ/γ + 1 (3)
Substituting 2.32mm/yr for Δ/γ, 3.19 mm/yr for H and 3.33mm/yr for Ea gives the E0 value equal to 2.93 mm/yr.
Also runoff Ro was averaged from River flow data which is 60.07mm/yr.
( )da eeuEa −
+=
1005.035.0 2
yrmmEa /33.3=
95

American Scientific Research Journal for Engineering, Technology, and Sciences (ASRJETS) (2015) Volume 10, No 1, pp 85-120
Based on the assumptions recharge was estimated using water balance equation representing the catchment:
Inflow = Out flow ± ∆ S where, ∆ S is change in storage.
P = AET + Eo + RO + G∆ + W (4) , which is the general water balance equation Where, P is Precipitation,
Eo is Open water evaporation, RO is runoff, G∆ is groundwater recharge and W is abstraction by groundwater
pumping.
Table 3: Potential Evapotranspiration calculated using Penman Combination method
The general water balance equation set for the catchment in annual bases is as follows:
P = AET + EO + RO + G∆ (5), where the system is under natural condition
From the annex 2 and figure 3.3, P is 1145.82mm, AET is 966.31mm, Eo is 2.93 mm, RO is 60.07mm and
96

American Scientific Research Journal for Engineering, Technology, and Sciences (ASRJETS) (2015) Volume 10, No 1, pp 85-120
substituting all these parameters in the above equation gives G∆ is equal to +116.51mm.
The final result +125.92mm violates the assumption which was given for water balance equation conducted in
annual bases that stated the change in storage should be zero.
This result because, in the rift floor aquifers far from large rivers and escarpments bounded by intermountain
grabens, the highland recharge may preferentially move to the rift within large regional faults. These large open
faults play very important role in the indirect recharge that comes from rivers channel losses and adjacent
Omo_Gibe basin [11] and figure 21 confirms these ideas.
Also, the presence of large springs with high yield such as Moshoshe(47l/s), Sheshera(52l/s), Kereso(40l/s),
Adiyo(12l/s) flow from Gurage high lands followed by Bonga transverse fault system which indicates the inter
aquifer connectivity between adjacent basin [12].
Figure 7: Thornthwaite soil water balance of the area
P – Precipitation PET – Potential Evapotrnspiration, AET – Actual Evaptranspiration
5.2.2 Recharge estimation using Base flow records
Extended periods of river base flow measurements can be used to estimate catchment area groundwater recharge
[13].
In estimating recharge for a given catchment from base flow the assumption is that the base flow of a river is
equal to the total groundwater recharge of the catchment upstream of the discharge measuring site [14], in this
case any loss upstream of the gauging station is considered to be negligible.
In the present case four gauging stations were used to estimate recharge over the entire upstream catchment and
the area to downstream of the last gauging station recharge estimated based on the assumption 10-20% of the
annual rainfall of the region is recharge for volcanic aquifers [15]. Summary of long-term annual average base
97
American Scientific Research Journal for Engineering, Technology, and Sciences (ASRJETS) (2015) Volume 10, No 1, pp 85-120
flow and surface runoff for each gauging stations described in the following figures).
Summary of long-term annual average base flow and surface runoff for each gauging stations described in the
following figures:
Days Flow (cfs)
Direct
Runoff(cfs)
Base Flow
(cfs) Flow (m3/s)
Direct
Runoff(m3/s)
Base Flow
(m3/s)
365 36.88 11.49 25.73 1.04 0.32 0.73
Figure 8: Base flow separations for up to 365 days of Gudar River near Hosanna
Days Flow (cfs)
Direct
Runoff(cfs)
Base Flow
(cfs) Flow (m3/s)
Direct
Runoff(m3
/s) Base Flow (m3/s)
365 261.44 72.28 189.63 7.4 2.05 5.36
Figure 9: Base flow separation for up to 365 days of Bilate River at Weira
01234567
1 16 31 46 61 76 91 106
121
136
151
166
181
196
211
226
241
256
271
286
301
316
331
346
361
Flow (m3/s)
Hydrograph of Gudar River at Bilate catchment near Hosana
Disc
harg
e(m
3/s)
Days Base Flow separated using Rescursive Digital Filter:WHAT method, Web based hydrograph analysis tool source:http://cobweb.ecn.purbe.edu/~what
05
1015202530354045
1 18 35 52 69 86 103
120
137
154
171
188
205
222
239
256
273
290
307
324
341
358
Flow (m3/s)
Base Flow (m3/s)
Hydrograph of Bilate River at Weira near Fonko Town
Disc
harg
e(m
3/s)
Base Flow separated using Digital filter:WHAT method. source: http://cobweb.ecn.purbe.edu/~what
days
98

American Scientific Research Journal for Engineering, Technology, and Sciences (ASRJETS) (2015) Volume 10, No 1, pp 85-120
Days
Flow
(cfs)
Direct
Runoff(c
fs)
Base
Flow
(cfs)
Flow
(m3/s)
Direct
Runoff(m3/s) Base Flow (m3/s)
365 378.11 85.17 292.94 10.71 2.41 8.29
Figure 10: Base flow separation for up to 365 days of Bilate River at Alaba near Kulito town
Days Flow (cfs)
Direct
Runoff(cfs)
Base Flow
(cfs) Flow (m3/s)
Direct
Runoff(m3/s
)
Base Flow
(m3/s)
365 586.64 137.89 448.75 16.61 3.9 12.71
Figure 11: Base flow separations for up to 365 days of Bilate River at BilateTena River
05
10152025303540
1 21 41 61 81 101
121
141
161
181
201
221
241
261
281
301
321
341
361
Flow (m3/s)
Base Flow (m3/s)
Hydrograph of Bilate River at Alaba kulito
Disc
harg
e(m
3/s)
Days Base Flow separated using Rescursive Digital filter:WHAT method,Web based hydrograph analysis tool source:http://cobweb.ecn.purbe.edu/~what
0
10
20
30
40
50
60
70
1 17 33 49 65 81 97 113
129
145
161
177
193
209
225
241
257
273
289
305
321
337
353
Flow (m3/s)
Base Flow (m3/s)
Days
Disc
harg
e(m
3/s)
Hydrograph of Bilate River at BilateTena
separated using Rescursive Digital Filter;WHAT method, http://cobweb.ecn.purbe.edu/~what
99

American Scientific Research Journal for Engineering, Technology, and Sciences (ASRJETS) (2015) Volume 10, No 1, pp 85-120
Table 4: Summary of Computed recharge in the study area
ID Gauging
Station
Name
Area
enclosed(m2)
Drainage
area(m2)
Runoff Recharge Recharge Recharge
(m3/s)
(m3/s)
(m/y)
(mm/yr)
0 Bilatetena 1813000000 3773960000 3.9 12.71 3.37E-
09
0.11 106.21
1 Abaya 1863000000 5636960000 102.36
2 Gudar 79160000 79160000 0.32 0.73 9.22E-
09
0.29 290.82
3 Weira 455800000 455800000 2.05 5.36 1.18E-
08
0.37 370.85
4 Alaba
kulito
1426000000 1960960000 2.41 8.29 4.23E-
09
0.13 133.32
The above table summarizes the area distribution of recharge in the catchment with runoff in computed both
water balance approach and base flow separation methods.
In the table for Abaya station there is no defined gauging station set so that recharge was estimated based on the
assumption 10-20% of the annual rainfall of the region is recharge for volcanic aquifers [16]. The recharge
value for Weira is 370.85mm/yr, which is comparable with the value estimated for the southwestern highlands
recharge my reach as high as 400 mm [17]. And also the average direct recharge in the rift floor of the study
area is 113.96 mm/yr or 10% of the mean rainfall 1155.23mm. This value is good estimate for a volcanic area
[18].
From the figure 8 peak base flow curve indicates relatively high recharge and low runoff, due to damping effect
of Boyo graven, the flow gets time recharge the area.
5.2.3 Groundwater flow direction
The groundwater level of the area was found by subtracting the static water level from surface ground elevation.
Based on this the ground water level map of the area was developed and the flow direction was indicated.
The ground water level map of the study area below shows that the level of groundwater depth getting vary from
place to place with mostly, deeper towards east of Bilate River.
The flow direction indicator arrows show that the ground water flows towards Bilate River in the northern and
western parts even from the surrounding Basin Omo-Gibe and towards Shalla Lake from the northern part of
Alaba special woreda.
From, the conceptual flow system based on topographic setting, in general three flow system is observed, where
100

American Scientific Research Journal for Engineering, Technology, and Sciences (ASRJETS) (2015) Volume 10, No 1, pp 85-120
topographically undulation of the catchment creats local and intermitted flow system in the area and those part
with shallower and short flow paths known with local flow system [19] and where small permant lakes in the
upland portions of watersheds are usually discharge areas for local and intermediate systems [20].
Figure 12: Recharge map of the study area
So that from this logical point of view, the presence of small permanent Boyo Lake indicates the local and
intermediate flow systems in the northern part of the area. The groundwater flow system around Alaba and
Sankura area is dominated by intermediate flow system [21]. On the other hand, well depth report of south east
of Alaba Kulito, the groundwater comes from deep depth, which in turn indicates deep groundwater flow
system.
5.3 Slope
Topographic setting relates to the local and regional relief situation and gives an idea about the general direction
of groundwater flow and its influence on groundwater recharge and discharge.
Steeper the slope, greater will be the runoff and thus lesser is the groundwater recharge. Digital Elevation model
(DEM) is derived using contour information from the topographical map for estimation of slope in degree.
The identified slope category varies from 0° to 390 degree in the study area and area classified in to four classes
like 0-2° (gentle), 2-7° (moderate), 7-13° (high), and 13-39° (steep).
101

American Scientific Research Journal for Engineering, Technology, and Sciences (ASRJETS) (2015) Volume 10, No 1, pp 85-120
Gentle slope (0–2°) indicates the presence of high groundwater potential zones where as steep slope (>13°)
shows the presence of poor groundwater potential zones as water runs rapidly off the surface and does not have
sufficient time to infiltrate the surface, keeping other parameters constant.
Figure 13: Groundwater flow direction map of the study area
Figure 14: Slope map of the study area
102

American Scientific Research Journal for Engineering, Technology, and Sciences (ASRJETS) (2015) Volume 10, No 1, pp 85-120
5.4 Drainage density map
Drainage density indicates rock permeability and infiltration capacity, and therefore recharges capacity. They
are reflection of the rate that precipitation infiltrated compared to surface runoff. Where rocks are highly
permeable, infiltration to groundwater is high, and less water is transported in rivers as surface water; but where
rocks have low permeability there is little infiltration and more surface water runoff. Low drainage density is
therefore related to higher recharge and higher groundwater potential [22]. The drainage density is high in the
plateau and escarpment and very low in the rift floor [23].
Drainage density delineated using 3DEM hydoprocessing module of SRTM data of the study area after
consecutive processes such as Importing of SRTM data, filled sinks for undefined values ,created Flow
Direction, Created Flow Accumulation, created Stream network, generated Stream Order and finally converted
Stream Order to drainage density.
The stream order values were regrouped to produce a drainage density map that was reclassified into four
categories i.e., 1(high), 1-2 (medium) , 2-4 (low), and 2-6 (very low ) density (figure). But some anomalies
observed in the order due to the effect of Boyo marshy area.
Figure 15: Reclassified drainage density map Figure 16: Stream order map of the area
103

American Scientific Research Journal for Engineering, Technology, and Sciences (ASRJETS) (2015) Volume 10, No 1, pp 85-120
5.5 Land use/ Land Cover
Land use is an important characteristic of the runoff process that affects infiltration, erosion, and
evapotranspiration.
The land use/cover map of the area was readily interpreted from Landsat image of the year 2001 by using visual
interpretation, supervised classification using ERDAS 9.1 software.
Classification of land use/cover for analysis was done based on their character to infiltrate water in to the ground
and to hold water on the ground.
various land use/ land cover classes delineated includes, cultivated land, bare land, grass land, plantation, shrub
land, riparian plantation, wood land, exposed surface, marshy land and water body (figure 17), because of high
population density in the area most part is covered by cultivation land [24].
Figure 17: Land use/ Land cover map of the area
5.6 Soil map
Soil properties influence the relationship between runoff and infiltration rates which in turn control the degree of
permeability, the principal factor in hydrogeology that determines the groundwater potential.
Classification of soil types in relation to groundwater potential controlling was done based on FAO soil texture
classification [25] and the Land use/land cover practice of the area, see figure below.
104

American Scientific Research Journal for Engineering, Technology, and Sciences (ASRJETS) (2015) Volume 10, No 1, pp 85-120
Figure 18: Reclassified FAO, 1997 Soil map of the area
Figure 19: Landscape of the Bilate River Basin with prominent topographical features
5.7 Geomorphology
Geomorphology maps depict landforms relating to groundwater occurrence as well as to groundwater prospects.
Due to rift effect and different land use condition the study area has complex land form features, which is
manifested by hills, and undulating surfaces.
Geomorphology units which have been identified and delineated from the study area include hills, valley, flood
105

American Scientific Research Journal for Engineering, Technology, and Sciences (ASRJETS) (2015) Volume 10, No 1, pp 85-120
plain, lake, and mountain; plateaus, and ridge and undulating surfaces. The distribution and extent of these
geomorphic zones are varying from place to place.
5.8 Lithology
Groundwater inevitably occurs in geological formations that require knowledge of how these earth materials
formed and the changes they have gone to understanding the distribution of geologic materials of varying
hydraulic conductivity and porosity [26].
Higher porosity contributes to higher Groundwater storage and higher permeability contributes to higher
groundwater yields.
In the present study geological map was prepared using previous data from different studies, satellite image
interpretation as well as field verification.
The study area comprises of variety of volcanic and volcano-sedimentary rocks that exhibit different ages and
composition of stratigraphic sequence categorized based on hydrogeological point of view (Figure 21).
The alluvial sediment is strictly bound to the stream courses and flood plains. These river channel deposits are
composed of mainly sand and gravel possessing good permeability.
The basalts is exposed in north of Lake Abaya and river scarp ridges is often weathered and faulted ,following
which hot springs emerges showing the existence recent volcanic actives in the area. The basalt in the escarpment
area is highly broken due to the effect of the rift faulting.
Hard highly jointed grey ignimbrite overlies the basalt (Jima volcanic), near Abaya Lake and on other places exists
in a complex mixture of other pyroclastic such as tuff, ash and interbedded with lacustrine deposits along the river
beds. The quaternary ignimbrite well exposed in the northern peaks of the area especially in mappable unit around
Hosanna town.
Recent acidic volcanic rocks mostly characteristics the eastern part of area around Alaba and Ropi. It is comprises of
an enormous accumulation pyroclastic products consists of pumice and ash and the flows and domes are more
massive pumice or obsidian. Most of mount Duguno Fango and plateau in the northern Alaba woreda, for example,
is made up of a series of superimposed of flows of pumice and obsidians.
The volcano-sedimentary rocks are pyroclasics ejected from a volcanic center or fissure and laid down in the
surrounding lakes and river banks compositionally variable in sizes ranging from reworked rounded and surrounded
poorly sorted and angular shapes which cause the lower permeability and tramsmissivity compared to other
sediments.
The lacustrine sediments are located in topographical low places, where the rainfall amount is low, thus recharge
comes from high runoff in the escarpments.
106

American Scientific Research Journal for Engineering, Technology, and Sciences (ASRJETS) (2015) Volume 10, No 1, pp 85-120
Figure 20: Geological map of the area
5.9 Lineament density
Lineaments are structural lines such as faults, which often represent zones of fracturing and increased secondary
porosity and permeability, and therefore of enhanced groundwater occurrence and movement.
In hard rock terrain the storage and movement of groundwater is controlled by the secondary porosity i.e.
presence of lineaments and fractures. Lineaments study of the area from remotely sensed data provides
important information on subsurface fractures that may control the movement and storage of the groundwater.
The distribution of the lineaments is observed to be high on the escarpment and rift floor (Figure 21). These are
normal faults having a NNE-SSW orientation. Faults may act either as pathways for water movement or as flow
barriers. At the foot of some of the fault scarps which bound the basin there exist springs indicating that these
faults act as conduits.
The faults in the escarpment areas which comprises the older undifferentiated rocks of Nazret Group and Dino
Formation down faulted towards the rift floor resulted in the development of Boyo plain which is graben.
High density of the faults is observed near North West of Lake Abaya and northern escarpment .To the eastern
escarpments the density decreases significantly indicating that the pre-existing fault systems are covered by the
silic volcanic that persisted in Holocene time [27]. Those, faults on the floor may possibly be filled with a
107

American Scientific Research Journal for Engineering, Technology, and Sciences (ASRJETS) (2015) Volume 10, No 1, pp 85-120
weathered glassy volcanic ash. In such cases the faults could act as barriers [28].
Most of the lineaments are identified Classified into lineament density map in to four categories, i.e. 0.062 -
1.33(high), 0.34 -0.62(medium), 0.12 – 0.34(low), and 0- 0.12 (very low) in the study area (Figure 21).
Figure 21: Lineament density map of the area
6. Results and Discussions
6.1 Data Integration Analysis in GIS Environment
To evaluate the different ground water potential zones, essential parameters were considered, and the maps were
prepared for each layer. Theses maps were converted to raster data sets having the same pixel size and different
weightage were assigned as per their groundwater potential controlling capacity within the study area and
reclassification of each map was done based on the weight values produced. Accordingly, the value 1 was given
for highly controlling units, 2 for moderately controlling units, 3 for low controlling units and 4 for poor
controlling reclassified units. Finally the maps integrated using GIS software with the purpose intended to
delineate the groundwater potential areas for the study region.
To account for varying geology, [29] alluvial deposits, volcano –sedimentary rocks, recent basalts and
lacustrine sediments were assigned highest weightage due to their higher porosity and impermeability,
Ignimbrites of rift floor, Dino formations of pyroclastic deposits and Pleistocene basalt were assigned moderate
value for they mostly well jointed and have moderate permeability and based on where dense Wonji fault belt
cuts this rock it increases the degree of jointing of these rocks thereby increasing their permeability(Figure 21)
[30] , low value were assigned for peralkaline Dino formations less affected by faulting and fracturing.
108

American Scientific Research Journal for Engineering, Technology, and Sciences (ASRJETS) (2015) Volume 10, No 1, pp 85-120
Similarly, for hydro-geomorphic units, mountains, ridge and plateaus were assigned lowest values, small valleys
and undulating surfaces moderate value and highest weightage was assigned to the flood plains. The ridge type
structural hills with low lineament density and higher drainage density were assigned low values.
For lineament density weightage was assigned in increasing manner for the 0.062 -1.33(high), 0.34 -
0.62(medium), 0.12 – 0.34(low), and 0- 0.12 (very low) respectively owing to secondary porosity decreasing
accordingly.
The slope degree between 0-2° (high value), 2-7° (moderate value), 7-13° (low value), and 13-39° (least value)
was assigned on account of increasing run off and decreasing infiltration respectively.
In the contrary to lineament density, higher drainage density value were assigned the lowest and the lowest
drainage density values assigned highest values for decreasing runoff in the area.
For clayey Soil least value was assigned because of the presence of clay-horizons in the area considerably
restricts percolation where as highest value was assigned for fine sandy loam for their low water holding
capacity and high permeability allow fast percolation [31].
Similarly owing to influence the ground water infiltration and alters the rate of percolation of precipitation out
of land use cover/ land cover marsh land and riparian vegetation was assigned highest weightage, degraded
forest(exposed surfaces) and shrub land moderate vales and bare land the least weightage.
Finally, high precipitation and recharge values favor groundwater potential and thus, the weightage was
assigned in increasing order of precipitation amount mention in the rain fall map (Figure 5).
All the weighted thematic maps were integrated and defined criteria weight using the IDRIS software and
overlay analysis done using ArcGIS software and potential ground water prospect zones were identified (Figure
23).
6.2 Criteria weights and Map Scores
To determine the relative importance or weights of each thematic map with another paired -comparison matrix
was prepared by pair wise comparison on Satty’s importance scale. These matrices have the property of
consistency known as consistency ratios (CR). Satty indicates that the matrices with CR ratings greater than 0.1
should be re-evaluated. This way it helps to analyses the matrix to determine the inconsistency in defining the
interrelationships. In this case the consistency value was 0.07 which is accepted (Figure19). The weights were
normalized by multiplying with 100 to avoid complexities of computation. These weights were applied in linear
summation equation to obtain a unified weight map containing due weights of all input variables, which was
further reclassified to arrive at groundwater potential map.
The importance matrices and their weights are mentioned as follows:
109

American Scientific Research Journal for Engineering, Technology, and Sciences (ASRJETS) (2015) Volume 10, No 1, pp 85-120
Figure 22: Weights of parameters determined using analytical hierarchy principle (AHP) nine point scales
Table 5: Paired Comparison matrix
Litho Geom
.
Lin Slope Soi
l
Drain Den LUL
C
Rain Fa Weight Weight
(%)
Litho 1 2 2 5 6 6 6 7 0.3329 33
Geom. 1/2 1 2 4 5 5 5 6 0.2458 25
Lin 1/2 1/2 1 1/2 2 2 2 3 0.1037 10
Slope 1/5 1/4 2 1 2 2 2 3 0.1031 10
Soil 1/6 1/5 1/2 1/2 1 2 3 4 0.0810 8
Derain d 1/6 1/5 1/2 1/2 ½ 1 3 4 0.0638 6
LULC 1/6 1/5 1/2 1/2 1/3 1/3 1 4 0.0460 5
Rain Fa 1/7 1/6 1/3 1/3 ¼ 1/4 1/4 1 0.0265 3
Consistency ratio = 0.07
Key
Litho = Lithology Slope = Slope Geom. = Geomorphology/Land form Soil = Soil Lin = Lineament
density Drain d = Drainage density LULC = Land use/ Land cover Rain Fa = Rainfall
From the table above lithology and geomorphology hold highest values relative to the other parameters for the
110

American Scientific Research Journal for Engineering, Technology, and Sciences (ASRJETS) (2015) Volume 10, No 1, pp 85-120
complex spatial and temporal distribution of the volcanic rocks, their different intricate stratigraphic and
structural relationships, wide compositional variability, and different degree of weathering and topographic
position highly control the groundwater potential in the area.
In the opposite, however, it is the main source of recharge; precipitation shows least weightage because of the
extreme variability of daily and monthly precipitation amounts all over the catchment area essentially limits the
exact assessment or even prediction of water resource availability [32] and figures 5 and 6.
After categorization, all the reclassified thematic layers were integrated with one another through GIS using the
weighting overlay analysis as follows.
Figure 23: weighted Overlay analysis table to produce Groundwater potential zone map
The following equation was used for the generation of the groundwater potential zone map (GPZM):
GPZM = 33 * lithology map+25*geomorphology map + 10* lineament density map + 10* slope map + 8* soil
map+6* drainage density map + 5* Land use/ Land cover map + 3*rainfall map
From the composite layer, the delineation of groundwater prospect zones was made by grouping the polygons
into different prospect zones: high, moderate, low and poor.
111

American Scientific Research Journal for Engineering, Technology, and Sciences (ASRJETS) (2015) Volume 10, No 1, pp 85-120
6.3 Output/Groundwater potential zoning map
By integration of all the thematic maps, groundwater potential zones were delineated and classified as: high
potential, moderate potential, low potential and poor potential zones (figure 24). The high potential zones
correspond to alluvial plains, lacustrine sediments, the fracture valleys, and valley fills, which coincide with the
low slope and high lineaments density areas. The low zones mainly comprise structural hills and escarpments
which contributes high run-off. Poor groundwater potential zones are present in the mountain peaks, plateaus
and escarpments with steep cliff, where low fractured rocks undifferentiated Dino formation exists and comprise
an area of 54.31 km2.
The area having high groundwater potential is characterized by mountain foots of graven in Boyo plain in
northern part, Ambricho mountain downstream drainage through Dura me town at Demote Worada and Mirab
Badawacho woredas in the western, at Dendo dame site area near the foot of mountain Duguno Fango and at the
vicinity of Lake Anya in the southern part. It covers an area of 158.04 km2. The eastern portion and some small
patches in the northern and valley escarpment of Bilate River of the study area fall under moderate groundwater
potential zone. Moderate groundwater potential zones cover an area of 3175.35km2 .To the eastern part of the
area, through Alaba woreda low groundwater potential in high depth has been observed due to very thick
pyroclastic acidic rocks especially highly permeable pumice layer that don’t retain water at shallow depths but
simply allow percolation of recharging water to great depth. Low groundwater potential zones cover an area of
2218.82 km2 (see Table 6).
NE-SW falut system highly control the permeability of the rocks in the basin apart from other parameters,in
which most of springs, marsh lands and drainage lines following these weak zones that would favor
groundwater flow. But, in some cases this geological structure serve as a barrier for groundwater flow result for
dry wells in the vicinity of productive wells in the area.
Table 6: Area coverage of each Groundwater potential zone
No Groundwater potential zone Area Coverage(km2)
1 High 158.04
2 Moderate 3175.35
3 Low 2218.82
4 Poor 54.31
6.4 Results Validation
It was found that the zonation of groundwater potential by integrated GIS and remote sensing techniques was in
close agreement with the available point source inventory data (figure 25).
112

American Scientific Research Journal for Engineering, Technology, and Sciences (ASRJETS) (2015) Volume 10, No 1, pp 85-120
On the other hand, special cases were observed in the Alicho wirer (the northern escarpment) where
unexpectedly moderate potential pixels exist. This may be happened when the rift faults in the area have caused
variable degrees of displacement on rock formations coming to lateral contact to different rock types which have
high permeability and as a result the lacustrine sediments and/or pyroclastic deposits on the rift floor extended to
the escarpment [33]. From my fieldwork experience this is also confirmed by the presence of relatively high
discharge wells and springs in the area, even though, the result in the specific escarpment is still exaggerated. It
is because of the fact that alluvial deposits in the project area occurs mainly along the river channels containing clay
and silt to coarse sand and gravel, have high water storing and transmitting capacity. This part of aquifer gets
recharge in addition to precipitation is supposed to be the confluence part of seasonal streams and the main Bilate
River stream, which is originating in the surrounding mountains, and intersections of fracture systems give rise to
have locally moderate to high permeability and productivity. But this violates the previous study, despite the
occurrence of permeable rocks and high recharge rates in some highlands adjacent to steep escarpments; the
groundwater reserve is low due to the fast release of the recharged water to the rift plains through large open
faults [34].
Figure 24: Groundwater potential map with Woredas/districts in the study area
The point water sources data with high density and brownish color in figure 25 indicates the shallow wells fitted
with hand pumps where shallow groundwater exists. From my field work experience in the area they highly
concentrated to high groundwater potential zones especially in the alluvial and lacustrine sediments. On the
113

American Scientific Research Journal for Engineering, Technology, and Sciences (ASRJETS) (2015) Volume 10, No 1, pp 85-120
other hand yellowish color symbols show that deep bore holes with motorized unit. The others are springs and
hand dug wells. From the point water sources distribution, in general the groundwater to the west is in shallow
depth and to the east depth of groundwater level increasing.
In the figure, those points in the legend with red color are dry wells and in the vicinity of the dry wells, there are
productive wells (legend values with discharge) present indicating that geological structure control in the area as
has been identified in lineament map (Figure 21). No wells are exist in the poor potential zone also suggests
good confirmation of the result.
The numbers on the map attributes the discharge amount in liter per second. It can be clearly observed that in
the eastern side bore holes found in low potential zones have less discharge (2 to 4 l/sec.) than boreholes in the
moderate zones (4 to 10 l/sec). These values concide with aquifer classification in the hydrogeological map of
Ethiopia in, which estimated optimum yield (litre/second) classified as 1.8 -68.4 l/sec. high potential, 0.45 – 9.9
l/sec. moderate potential and 0.045 – 4.5l/sec low potential aquifers.
Figure 25: Distribution of boreholes and springs with discharge in groundwater potential zone
114
American Scientific Research Journal for Engineering, Technology, and Sciences (ASRJETS) (2015) Volume 10, No 1, pp 85-120
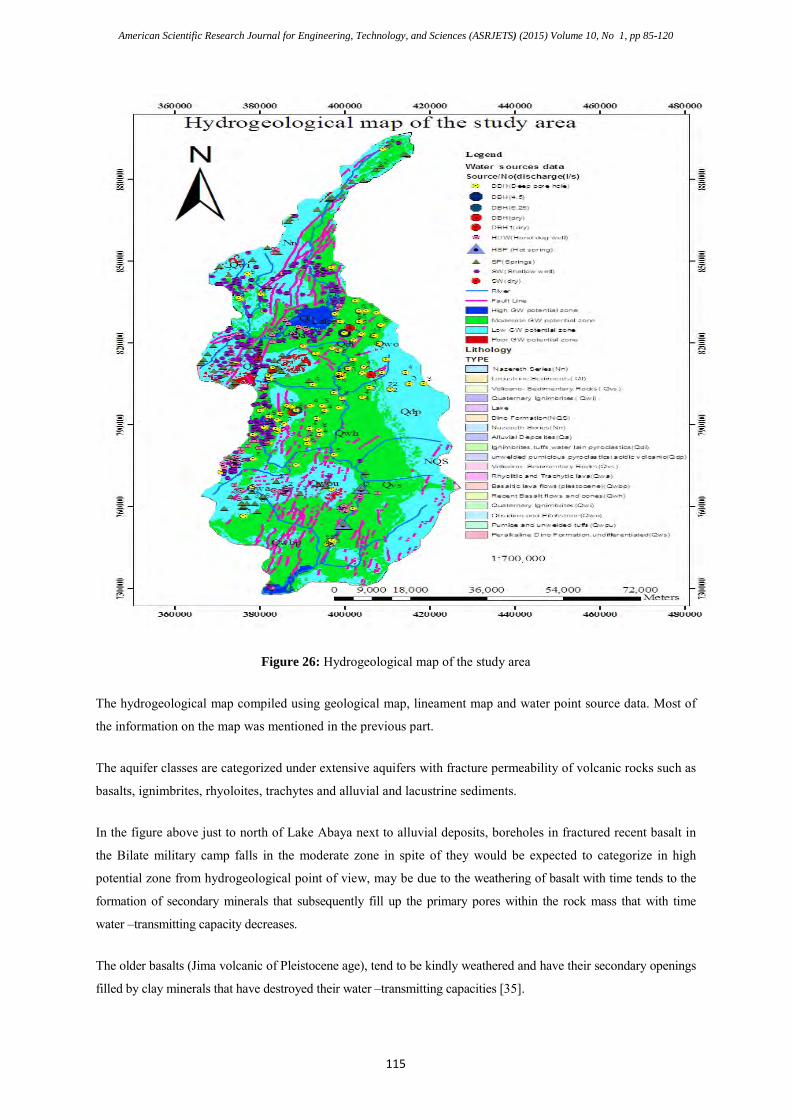
Figure 26: Hydrogeological map of the study area
The hydrogeological map compiled using geological map, lineament map and water point source data. Most of
the information on the map was mentioned in the previous part.
The aquifer classes are categorized under extensive aquifers with fracture permeability of volcanic rocks such as
basalts, ignimbrites, rhyoloites, trachytes and alluvial and lacustrine sediments.
In the figure above just to north of Lake Abaya next to alluvial deposits, boreholes in fractured recent basalt in
the Bilate military camp falls in the moderate zone in spite of they would be expected to categorize in high
potential zone from hydrogeological point of view, may be due to the weathering of basalt with time tends to the
formation of secondary minerals that subsequently fill up the primary pores within the rock mass that with time
water –transmitting capacity decreases.
The older basalts (Jima volcanic of Pleistocene age), tend to be kindly weathered and have their secondary openings
filled by clay minerals that have destroyed their water –transmitting capacities [35].
115

American Scientific Research Journal for Engineering, Technology, and Sciences (ASRJETS) (2015) Volume 10, No 1, pp 85-120
6.5. Limitations
The groundwater potential zone of this study was constructed with available site specific hydrologic data,
hydrogeologic and physiographic data of the study area and satellite imagery. The point discharge data would
not actually determine the exact potential yield of wells may be due to improper pumping test analysis and
under capacity pumps used.
Single step in the process of integrating input parameters may come with uncertainties ranging from data
acquisition to model calibration to result visualization, as far as I am concerned, currently lack effective
methods to handle and communicate these uncertainties step by step until final results.
The majority of the GIS data sets are currently represented in vector format, which is convenient due to strong
efficiency but can be difficult to manipulate analytically. The processes involved in vectorization as well
rasterization manifests error in a given GIS system.
6. Conclusion and Recommendation
7.1 Conclusions
• The study has resulted the groundwater potential zone map for the Bilate River catchment which identified
and delineated in four categories namely high, moderate, low and poor
• Most of the high potential areas represented by alluvial plains, lacustrine sediments, the fracture valleys,
and valley fills, which coincide with the low slope and high lineaments density areas and in contrary zones
with poor groundwater potential lie in the mountain ranges where undifferentiated peralkaline Dino
formation, obsidian and pitch stone exist.
• It can be concluded that Integrated GIS and remote sensing techniques are very efficient and useful, time
and cost effective tool for the identification/delineation of groundwater potential zones.
• Paired Comparison matrix analysis indicates that all parameters are significant but the most effective
parameters in the area are: litho logy, geomorphology, lineament density, drainage density and slope.
• Most of area, around 57% zoned under moderate potential and the next high coverage of the area is low
potential zone where as only 1% covers the poor potential zone .
7.2 Recommendations
In the light of the findings obtained and conclusions reached the following recommendations are forwarded.
• The present study was based on logical conditions and reasoning, the same method can be used with
appropriate modifications where occurrence and distribution of groundwater is more complex.
• The groundwater potential map along with other thematic maps forms serve as resource information
database which can be updated from time to time by adding new information.
• For further validation field geophysical investigations on the potential well drilling sites are recommended.
116

American Scientific Research Journal for Engineering, Technology, and Sciences (ASRJETS) (2015) Volume 10, No 1, pp 85-120
• Detail hydrochemistry analysis study in the area requires due attention to determine hydrodynamic
conditions of a basin.
• Filed data indicates that water supply in the study area highly dependent on groundwater sources thus
groundwater modeling study is recommended to determine the sustainable exploitations of this resource
Acknowledgements
Before anything, glory and thanks be to God who gives me full health, peace, knowledge and wisdom to
accomplish this thesis work and He is still in my side throughout my life.
My deepest feeling of gratitude goes to my advisor prof. Tenalem Ayenew, for his worthless advice, and
constant encouragement helped me to complete this research work successfully. I never ever forget his
admirable patience, work quality, and attractive spirit of friendship as unique personal possessions.
I would like to express my special and sincere appreciation to my instructor Dr. Seifu Kebede and all Addis
Ababa University Earth Science Department instructors who support in the knowledge of Hydrogeology. I
extend my thanks for secretary office members Roman Kefyalew, Worku, and librarian Eden Wube all of them
helped me in providing valuable information and reading materials.
I am thankful to Hadiya Zone Water, Mines and Energy Development Coordination Department, for allowing
me to pursue my postgraduate studies. I extend my gratitude to SNNP Region Water resources development
Bureau for their assistance in providing me relevant data, per diem and Vehicle during my field work.
I am also grateful to Ethipian Water Resources Ministry, National Meteorological Service, Geological survey,
Mapping Agency and Water Works Design Enterprise (WWDE) for providing me flow data, meterology data,
and relevant documents, which helped me to carry out my research work.
Last but not least I owe my deepest gratitude to my family, who has humble heart, understanding, and courage,
each other and my friends.
References
[1] Fares M. Howari, Mohsen M., Sherif1, Vijay P.Singn2 and Mohamed S. Al Asam3, 20017, Geology Dept.,
College of Science, UAE University, Al Ain, UAE
[2] Amaresh Kr. Singh, S. Ravi Prakash, Map India, 2003, an integrated approach of Remote Sensing,
geophysics and GIS to evaluation of Groundwater Potentiality of Ojhala Subwatershed, Mirzapur district, U.P.,
India
[3] Arun K. Saraf, P. Kundu, B. Sarma,1999, Integrated Remote sensing and GIS in Groundwater Recharge
Investigation And Selection of Artificial Recharge sites in Hard Rock Terrain, Indian Institute of Technology,
ROORKEE-247667,India
117
American Scientific Research Journal for Engineering, Technology, and Sciences (ASRJETS) (2015) Volume 10, No 1, pp 85-120
[4] Ayenew et.al, 2008, The hydrogeological system of the lake district basin, central main Ethiopian rift
[5] Timothy B., Jerome A., Matthew M. and Robert B., 1994, An integrated approach to groundwater
exploration in developing countries using GIS and remote sensing, Desert Research Institute,7010 ,Dandini
Blvd.Reno, NV 89512*U.S. Army Corp of Engineers - Topographic Engineering Center Alexandria, VA 22310.
[6] Ayenew, Demlie and Stefan, 2008, Hydrogeological framework and occurrence of groundwater in the
Ethiopian aquifers, Journal of African Earth Sciences, Addis Ababa University, Department of Earth Sciences,
P.O. Box 1176, Addis Ababa, Ethiopia; University of Kwazulu-Natal, School of Geological Sciences, Private
Bag X54001, Durban 4000; South Africa Ruhr University of Bochum, Department of Applied Hydrogeology,
D-44801 Bochum, Germany
[7] Ayenew T., 1998. The hydrogeological system of the Lake District basin, Central Main Ethiopian Rift
Published PhD thesis (ISBN.9061641586), Free University of Amsterdam, The Netherlands, 259pp
[8] Warren V, Jr. and Gary L. 20003, Introduction to Hydrology Fifth Edition University of Florida
[9] Stefan, T. and Gerd, F. , 2004, Water resources assessment in the Bilate River catchment – precipitation
Variability, Lake Abaya Research Symposium, Research Institute for Water and Environment, University of
Siegen,Paul-Bonatz-Str.9-11.57076 Siegen, Germany.
[10] Ayenew T., 1998. The hydrogeological system of the Lake District basin, Central Main Ethiopian Rift
Published PhD thesis (ISBN.9061641586), Free University of Amsterdam, The Netherlands, 259pp
[11] Ayenew, Demlie and Stefan, 2008, Hydrogeological framework and occurrence of groundwater in the
Ethiopian aquifers, Journal of African Earth Sciences, Addis Ababa University, Department of Earth Sciences,
[12] Legesse S., 2009, Integrated hydrogeological investigation of upper Bilate river catchment: Southern rift
valley of Ethiopia, unpublished MSC thesis submitted to Addis Ababa University, Addis Ababa
[13] Ayenew T., 1998. The hydrogeological system of the Lake District basin, Central Main Ethiopian Rift
Published PhD thesis (ISBN.9061641586), Free University of Amsterdam, The Netherlands, 259pp
[14] , [15] , Ayenew T., 1998. The hydrogeological system of the Lake District basin, Central Main Ethiopian
Rift Published PhD thesis (ISBN.9061641586), Free University of Amsterdam, The Netherlands, 259pp
[16] Demile, M., Wohnlich, S., Ayenew, T., 2008. Major ion hydrochemistry and environmental isotope
signatures as a tool in assessing groundwater occurrence and its dynamics in a fractured volcanic aquifer system
located within a heavily urbanized catchment, Central Ethiopia, Journal of hydrology, 353, 175 – 188.
17] Demile, M., Wohnlich, S., Ayenew, T., 2008. Major ion hydrochemistry and environmental isotope
signatures as a tool in assessing groundwater occurrence and its dynamics in a fractured volcanic aquifer system
located within a heavily urbanized catchment, Central Ethiopia, Journal of hydrology, 353, 175 – 188
118

American Scientific Research Journal for Engineering, Technology, and Sciences (ASRJETS) (2015) Volume 10, No 1, pp 85-120
[18] Dr. Yuji Maruo, Abebe G.Hiwot, Shiferaw Lulu, AbrahamGorfu , Application of Geographic Information
System(GIS) for Groundwater ResourceManagement: Practical Experience from Groundwater Development &
Water Supply AG Consult, Consulting Hydrogeologists& Engineers, JICA Training Center, Addis Ababa,
Ethiopia
[19] Fetter, C.W., 2001, Applied Hydrogeology 4th edition, Prentice – Hall, Inc. 289pp
[20] Ayenew T., 1998. The hydrogeological system of the Lake District basin, Central Main Ethiopian Rift
Published PhD thesis (ISBN.9061641586), Free University of Amsterdam, The Netherlands, 259pp
[21] Legesse S., 2009, Integrated hydrogeological investigation of upper Bilate river catchment: Southern
[22] M. Thangarajan, 2007, Groundwater Resource Evaluation, Augmentation, Contamination, Restoration,
Modeling and Management
[23] Ayenew T., 1998. The hydrogeological system of the Lake District basin, Central Main Ethiopian Rift
Published PhD thesis (ISBN.9061641586), Free University of Amsterdam, The Netherlands, 259pp
[24] Sendabo D. 2007, Analysis of Biomass degradation as an indicator of environmental challenge of Bilate
Watershade using GIS technquies, unpublished MSC thesis submitted to Addis Ababa University, Addis Ababa
[25] Food and Agriculture Organization (FAO), 1997, The Digital Soil and Terrain Database of East Africa
(SEA). Via delle Terme di Caracalla 00153, Rome, Italy
[26] Fetter, C.W., 2001, Applied Hydrogeology 4th edition, Prentice – Hall, Inc. 289pp
[27] Shiferaw L. and Abebe G/H, 2004, Hydrogeology of Yergalem and Kilisa Sheets, AG Consult, Consulting
Hydrogeologists and Engineers, Addis Ababa
[28] Nedaw D., 1997, Hydrogeology of Awassa area MSC thesis submitted to Addis Ababa University, Addis
Ababa
[29], [30] Cherenet T., 1993, Hydrogeology of Ethiopia and Water Resources Development EIGS.
[31] Ayenew T., 1998. The hydrogeological system of the Lake District basin, Central Main Ethiopian Rift
Published PhD thesis (ISBN.9061641586), Free University of Amsterdam, The Netherlands, 259pp
[32] Stefan, T. and Gerd, F. , 2004, Water resources assessment in the Bilate River catchment – precipitation
Variability, Lake Abaya Research Symposium, Research Institute for Water and Environment, University of
Siegen,Paul-Bonatz-Str.9-11.57076 Siegen, Germany.
[33] Cherenet T., 1993, Hydrogeology of Ethiopia and Water Resources Development. EIGS.
119

American Scientific Research Journal for Engineering, Technology, and Sciences (ASRJETS) (2015) Volume 10, No 1, pp 85-120
[34] Nedaw D., 1997, Hydrogeology of Awassa area MSC thesis submitted to Addis Ababa University, Addis
Ababa
[35] Zeka^i, 1995, Applied Hydrogeology for scientists and Engineers, Boca Raton, Florida 33431
120