groundwater status and trend assessment - chj.es publica/phc-2015... · ronald kozel foen...
TRANSCRIPT

Working Group C – Groundwater, Activity WGC-2, “Status Compliance & Trends” Guidance on Groundwater Status and Trend Assessment – Final Draft 2.0, 15 October 2008
1
Status box
Title: Guidance on Groundwater Status and Trend Assessment
Version no.: 2.0 (final draft for approval by SCG) Date: 15 October 2008
Leader(s): Drafting Group WGC-2 Status Compliance and Trends; Lead J. Grath, R. Ward, Co-lead: A. Blum, H. Legrand, A. Martin, H.P. Broers
Circulation and received comments:
This document provides the final draft for approval by the SCG.
Timetable:
5–6 November: SCG meeting
24–25 November Water Directors meeting
Contacts:
Johannes Grath ([email protected]), Rob Ward ([email protected]) and Philippe Quevauviller ([email protected])

Working Group C – Groundwater, Activity WGC-2, “Status Compliance & Trends” Guidance on Groundwater Status and Trend Assessment – Final Draft 2.0, 15 October 2008
2
AUTHORS OF THE GUIDANCE (in alphabetic order)
Ariane Blum BRGM (France)
Hans-Peter Broers EuroGeoSurveys
Johannes Grath Umweltbundesamt (Austria)
Helene Legrand MEDD (France)
Aude Martin MEDD (France)
Andreas Scheidleder Umweltbundesamt (Austria)
Cath Tomlin Environment Agency (United Kingdom)
Rob Ward Environment Agency (United Kingdom)
MEMBERS OF THE DRAFTING GROUP (in alphabetic order)
Magnus Asman Swedish Geological Survey (Sweden)
László Balashazy Ministry of the Environment and Water (Hungary)
Leo Boumans RIVM (Netherlands)
Mario Carere Min. Ambiente (Italy)
John Chilton British Geological Survey, UN-ECE, IAH
Jan Cramer NGU (Norway)
Johannes Drielsma Euromines
Ralf Eppinger Flemish Environment Agency (Belgium)
Dico Fraters RIVM (Netherlands)
Christian Grøn DHI
Klaus Hinsby GEUS (Denmark)
Kestutis Kadunas Geological Survey (Lithuania)
Ronald Kozel FOEN (Switzerland)
Christine Marlet Eurogypsum
Carlos Martinez Navarrete Spanish Geological Survey (Spain)
Dietmar Müller Umweltbundesamt (Austria), BRIDGE
Hana Prchalova Masaryk Water Research Institute (Czech Republic)
Murk de Roos MinVROM (Netherlands)
Isaac Sanchez Navarro Ministry of the Environment, and Rural and Marine Affairs (Spain)
Philippe Quevauviller EC, DG Environment
Manuel Sapiano Malta Resources Authority (Malta
Martin Skriver Danish Ministry of the Environment (Denmark)
Benno Strehler Bayer. Staatsministerium für Umwelt (Germany)
Paolo Traversa Tevere Basin Authority (Italy)
Manuel Varela Ministry of the Environment, and Rural and Marine Affairs (Spain)
Rüdiger Wolter Federal Environmental Agency (Germany)
Wennemar Cramer Ministry of Housing and Environment (Netherlands)
Loek Knijff Rijkswaterstaat – Centre for Water Management (Netherlands)
Wilko Verweij RIVM (Netherlands)
Ana Rita Lopes Instituto Nacional da Agua (Portugal)
Ruxandra Balaet Ministry of Environment and Sustainable Development (Romania)
Tony Marsland Environment Agency (United Kingdom)

Working Group C – Groundwater, Activity WGC-2, “Status Compliance & Trends” Guidance on Groundwater Status and Trend Assessment – Final Draft 2.0, 15 October 2008
3
LIST OF USED ABBREVIATIONS
CV – Compliance Value
DWD – Drinking Water Directive
DWPA – Drinking Water Protected Area
DWS – Drinking Water Standard
EQS – Environmental Quality Standard
GW-QS – Groundwater Quality Standard
GWB – Groundwater Body or group of bodies of groundwater
GWD – Groundwater Directive (2006/118/EC)
GWDTE – Groundwater Dependent Terrestrial Ecosystems
LOQ – Limit of Quantification
MS – Member State
POC – Point of Compliance
RBMP – River Basin Management Plan
TV – Threshold Value
WFD – Water Framework Directive (2000/60/EC)

Working Group C – Groundwater, Activity WGC-2, “Status Compliance & Trends” Guidance on Groundwater Status and Trend Assessment – Final Draft 2.0, 15 October 2008
4
TABLE OF CONTENTS
1 PURPOSE AND SCOPE 7
2 GENERAL PRINCIPLES 9
2.1 Conceptual models 9
2.1.1 Conceptual models and establishment of threshold values 9
2.1.2 Conceptual models and status assessment 10
2.1.3 Conceptual models and trend assessment 10
2.2 Dependent terrestrial ecosystems relevant for the status and trend assessment 10
2.3 Naturally-occurring concentrations of substances - Background levels 10
2.4 Concentrations below the limit of quantification 11
2.4.1 Chemical status assessment 11
2.4.2 Trend assessment 11
2.5 Reporting 12
2.5.1 Groundwater threshold values 12
2.5.2 Groundwater body status 12
2.5.3 Trend assessment 13
3 STATUS ASSESSMENT 14
3.1 Classification tests 14
3.2 Risk Assessment versus Status Assessment 16
3.3 Confidence in the assessment 16
4 CHEMICAL STATUS ASSESSMENT 17
4.1 Definition of Good Chemical Status and Legal background 17
4.2 Elements of chemical status assessment 18
4.2.1 Data aggregation 18
4.2.2 Extent of exceedance 18
4.2.3 Location of exceedance 19
4.3 Groundwater Quality Standards and Threshold Values 19
4.3.1 Specific Background and Requirements 19
4.3.2 Links between threshold values and the “prevent or limit” objective (Article 6) 21
4.3.3 General methodology for establishing threshold values 23
4.4 Procedure for assessing groundwater chemical status 26
4.4.1 Practical procedure 26
4.4.2 Test: General assessment of the chemical status of the groundwater body as a whole 28
4.4.3 Test: Saline or other intrusion 30
4.4.4 Test: Significant diminution of associated surface water chemistry and ecology due to transfer of pollutants from the groundwater body 33
4.4.5 Test: Significant damage to groundwater dependent terrestrial ecosystems (GWDTE) due to transfer of pollutants from the groundwater body 35
4.4.6 Test: Meet the requirements of WFD Article 7(3) - Drinking Water Protected Areas 37
5 QUANTITATIVE STATUS ASSESSMENT 40
5.1 Definition of Good Quantitative Status 40
5.2 Elements of quantitative status assessment 40

Working Group C – Groundwater, Activity WGC-2, “Status Compliance & Trends” Guidance on Groundwater Status and Trend Assessment – Final Draft 2.0, 15 October 2008
5
5.3 Procedure for assessing groundwater quantitative status 41
5.3.1 Test: Water Balance (GWB scale) 41
5.3.2 Test: Surface Water Flow 44
5.3.3 Test: Groundwater Dependent Terrestrial Ecosystems (GWDTE) 45
5.3.4 Test: Saline (or other) Intrusion 45
6 TREND AND TREND REVERSAL ASSESSMENT 47
6.1 Definition of significant and sustained upward trends and trend reversal 47
6.2 Elements of trend and trend reversal assessment 47
6.2.1 Parameters subject to trend assessment 48
6.2.2 Network design and monitoring 48
6.2.3 Monitoring data subject to trend assessment 49
6.2.4 Consideration of baseline level of concentrations 49
6.2.5 Length of time series considered 49
6.2.6 Methodology for trend assessment 50
6.2.7 Confidence in the assessment 50
6.2.8 Starting point for trend reversal 50
6.2.9 Methodology for trend reversal assessment 51
6.2.10 Schedule of trend and trend reversal assessment 51
6.3 Tests for assessing trend and trend reversal 51
6.3.1 Identifying environmentally significant trends and scale of assessment (Article 5(1) GWD) 52
6.3.2 Test: ‘Harm to actual or potential legitimate uses of the water environment’ (GWD Article 5(1) and 5(2)) 53
6.3.3 Test: ‘Harm to aquatic ecosystems’ and ‘Harm to terrestrial ecosystems’ (GWD Article 5(1) and 5(2)) 54
6.3.4 Trend assessment to support status assessment 55
6.3.5 Trend assessment to support plume characterisation 55
7 REFERENCES 56
8 ANNEX 1: PRINCIPLES OF APPLYING DILUTION AND ATTENUATION FACTORS 57
8.1 Dilution 57
8.2 Attenuation 57
9 ANNEX 2: THE USE OF GROUNDWATER LEVEL MONITORING IN STATUS ASSESSMENT 59
10 ANNEX 3: CASE STUDIES 60
10.1 Case Study 1: Implementation of the WFD and the GWD in Germany 60
10.2 Case Study 2: Establishment of threshold values in the Netherlands 62
10.3 Case Study 3: Derivation of background levels and TVs in a Romanian GWB 65
10.4 Case Study 4: Quantitative status assessment of two GWBs in the Netherlands 68
10.5 Case Study 5: CIS WG 2.8 proposal for trend and trend reversal assessment 70
10.6 Case Study 6: Trends in relation to pressures and vulnerability 73
10.7 Case Study 7: Aggregating trends for groundwater bodies 76

Working Group C – Groundwater, Activity WGC-2, “Status Compliance & Trends” Guidance on Groundwater Status and Trend Assessment – Final Draft 2.0, 15 October 2008
6
THE COMMON IMPLEMENTATION STRATEGY (CIS) OF THE WFD
The Water Framework Directive (2000/60/EC)1 is a comprehensive piece of legislation that sets out,
inter alia, environmental objectives for all waters in Europe. The Directive requires sustainable and integrated management of river basins. This includes binding objectives, clear deadlines and comprehensive programme of measures based on scientific, technical and economic analysis including public information and consultation. Soon after its adoption, it became clear that the successful implementation of the Directive would be challenging for all the countries, institutions and stakeholders involved.
In order to address the challenges in a co-operative and coordinated way, the Member States, Norway and the Commission agreed on a Common Implementation Strategy (CIS) for the Water Framework Directive. Furthermore, the Water Directors stressed the necessity to involve stakeholders, NGOs and the research community in this joint process as well as participation of Candidate Countries.
In the first phase of the CIS, a number of guidance documents were prepared and these documents were tested in Pilot River Basins across Europe in 2003 and 2004. In the Work Programme 2005/2006, the four Working Groups (Ecological Status, Integrated River Basin Management, Groundwater and Reporting) have continued addressing the key issues for implementation. In addition, new groups on ‘WFD and Agriculture’, ‘GIS’ and ‘Chemical Monitoring’ are sharing experiences in this area and a new Pilot River Basin network is supporting the technical activities in all working groups.
The WFD CIS Working Group on Groundwater (WG C) is now in its third phase (2007–2009)2. The
aim is to focus on implementing the new Groundwater Directive and the groundwater elements of the WFD along the CIS principles. In particular one main objective of WG C in view of the preparation of the First River Basin Management Plan is the development of a common methodology for the establishment of groundwater threshold values and of a guidance document on status compliance and trend assessment. Future attention will be on best practices related to groundwater programmes of measures and recommendations for integrated risk assessment and management, including conceptual modelling.
In parallel to this work, the Chemical Monitoring Activity (CMA) has focussed on developing guidance on chemical monitoring. This has resulted in a draft Commission Directive on technical specifications for chemical analysis and monitoring of water status
3. It covers both surface waters and groundwaters.
These new specifications have been considered in the preparation of this guidance.
1 European Parliament and Council Directive 2000/60/EC of 23 October 2000 establishing a framework for Community action in the field of water policy (OJ L 327, 22/12/2000, p. 1) as amended by European Parliament and Council Decision 2455/2001/EC (OJ L 331, 15/12/2001, p.1)
2 Mandate of the Working Group on Groundwater. Common Implementation Strategy for the Water Framework Directive. “Work Programme 2007/2009” (2006)
3 Draft Commission Directive of [Day Month 2008] laying down, pursuant to Directive 2000/60/EC of the European Parliament and of the Council, technical specifications for chemical analysis and monitoring of water status. 10575/08 ENV 365.

Working Group C – Groundwater, Activity WGC-2, “Status Compliance & Trends” Guidance on Groundwater Status and Trend Assessment – Final Draft 2.0, 15 October 2008
7
1 PURPOSE AND SCOPE
This guidance has been drafted in response to a mandate from the CIS Working Group on Groundwater (WG C). This mandate required the development of practical guidance and technical specifications for the derivation of threshold values, the assessment of status compliance (both quantitative and chemical) and the assessment of groundwater trends and trend reversal. This guidance builds on, and complements existing WFD guidance
4. Its primary focus is on delivering a
number of the groundwater requirements of the Water Framework Directive (WFD) and the new Groundwater Directive
5 (GWD). These include the obligations set out in Annex V of the WFD and
Articles 3, 4 and 5 and Annex II, III and IV of the GWD.
The GWD establishes a requirement for Member States to derive threshold values for pollutants (or groups of pollutants) that are related to the pressures identified as putting groundwater bodies at risk. These threshold values and standards are then to be used to assess groundwater chemical status, as defined in the WFD. In addition to assessing the impacts of pollutants the WFD also requires consideration of the impacts of groundwater abstraction on groundwater bodies, dependent surface water bodies and ecosystems, and an assessment of quantitative status.
The WFD and GWD also require that trends in pollutant concentrations are identified and that these trends are assessed to determine whether they are environmentally significant. Where significant upward trends exist they must be reversed through the application of programmes of measures to ensure that there are no future failures of environmental objectives. The GWD starting point for trend reversal must be defined as a proportion of the threshold value or quality standard (75% by default).
This document provides practical guidance on meeting each of the requirements described above. It:
• sets out a methodology for deriving threshold values;
• establishes frameworks for assessing both chemical and quantitative status;
• identifies a method for identifying environmentally significant trends;
• outlines the reporting requirements;
• provides case study examples to illustrate the application of the guidance in different Member States
In developing the guidance the outputs of R&D projects and other guidance documents have been used. For groundwater threshold values the method presented in this document is based on the outputs of the BRIDGE project
6. For chemical status assessment the technical specification for
chemical analysis and monitoring of water status developed by the EU Chemical Monitoring Activity (CMA) and the resulting Commission Directive
7 has been consulted. For trend and trend reversal
4 Guidance Document No. 17 Preventing or Limiting Direct and Indirect Inputs (2007); Guidance Document No. 16 Groundwater in Drinking Water Protected Areas (2007); Guidance Document No. 15 Groundwater Monitoring (2007); Guidance Document No. 12 The Role of Wetlands in the Water Framework Directive (2003); Guidance Document No. 7: Monitoring under the Water Framework Directive – WG 2.7 Monitoring (2003); Guidance Document No. 3: Analysis of Impacts and Pressures – WG 2.1 IMPRESS (2003); Guidance Document No. 2 Identification of Water Bodies (2003); Technical Report No. 1: Statistical aspects of the identification of groundwater pollution trends and aggregation of monitoring results – WG 2.8 Statistics (2001); Chemical Monitoring Activity; Technical Report No. 3: Groundwater Monitoring (workshop report 25
th June 2004);
EC Monitoring Guidance for the Nitrates Directive; EUROWATERNET Guidelines (Technical Report Nr. 7, EEA 1999); Guidelines on monitoring and assessment of transboundary groundwaters (UN-ECE ).
5 European Parliament and Council Directive 2006/118/EC of 12 December 2006 on the protection of groundwater against pollution and deterioration (adopted in December 2006).
6 Müller et al. (2006).
7 Draft Commission Directive of [Day Month 2008] laying down, pursuant to Directive 2000/60/EC of the European Parliament and of the Council, technical specifications for chemical analysis and monitoring of water status. 10575/08 ENV 365.

Working Group C – Groundwater, Activity WGC-2, “Status Compliance & Trends” Guidance on Groundwater Status and Trend Assessment – Final Draft 2.0, 15 October 2008
8
assessment, special attention has been paid to Technical Report No. 18 (produced by EU WFD CIS
Working Group 2.8).
The purpose of this report is to provide a practical approach that will support Member States in implementing and delivering the groundwater requirements of the WFD and GWD. It has been produced following widespread consultation with groundwater experts across Europe and represents an approach based on current good practice. The guidance is not legally binding and Member States are free to adapt the guidelines presented in this document in view of the characteristics of groundwater bodies and/or national or regional groundwater management strategies and regulations. It is also recognised that with further experience improved methodologies may emerge.
8 Technical Report No. 1: Statistical aspects of the identification of groundwater pollution trends and aggregation of monitoring results – WG 2.8 Statistics (2001).

Working Group C – Groundwater, Activity WGC-2, “Status Compliance & Trends” Guidance on Groundwater Status and Trend Assessment – Final Draft 2.0, 15 October 2008
9
2 GENERAL PRINCIPLES
2.1 Conceptual models
To implement the WFD and the GWD and for effective management of groundwater, a clear understanding of the environmental conditions required for the achievement of the environmental objectives, and how these could be affected by human activities is needed. This understanding is supported by the development of a conceptual model or conceptual understanding of the groundwater system in which the general scheme of flow and transport conditions and of the hydrogeochemical properties are defined. Conceptual models are not necessarily numerical models but are a working understanding of the geological and hydrogeological system being studied. Numerical modelling may be used, however, to contribute or confirm certain elements of the conceptual model where appropriate.
Both the risk assessment and the monitoring should already be based on a conceptual model of the groundwater system. The monitoring data obtained from the WFD monitoring programmes should be used to test, validate and refine the conceptual model(s). Information about travel times, flow and transport rates and/or groundwater age distribution may also be useful input to the conceptual model/understanding as well as for validating the models.
As a groundwater body is three dimensional the concentration of pollutants as well as the background levels of naturally occurring substances may vary significantly in vertical and lateral direction. This should be considered when establishing threshold values as well as in the status and trend assessment procedure.
The importance of conceptual models is already described in other CIS guidance9. Chapter 3.1 of CIS
guidance ‘Groundwater Monitoring’10
outlines the principles and relationship of the conceptual model to the monitoring programme. Development of additional guidance on CM is included in the mandate of WGC. Conceptual models are now considered as a vital tool to support the implementation of all aspects of groundwater requirements of the WFD and GWD.
2.1.1 Conceptual models and establishment of threshold values
The GWD (Annex II.A) gives the following guidelines for establishing threshold values (TVs). In summary:
- TVs should be based on the extent of interactions between groundwater and associated aquatic and dependent terrestrial ecosystems,
- TVs should be based on actual or potential legitimate use (e.g. drinking water supply, irrigation etc.) or functions of groundwater,
- TVs derivation should include all pollutants which characterise bodies of groundwater as being at risk of not meeting the WFD Article 4 objectives,
- TVs should be based on hydrogeological characteristics of the groundwater body, including information on background concentrations derived from natural hydrogeological and hydogeochemcial processes,
- TVs derivation should take into account the origins of the pollutants, their possible natural occurrence, their toxicology and dispersion tendency, their persistence and bioaccumulation potential,
- Determination of TVs should take into account data quality and analytical precision.
Given the different aspects which should be taken into account when establishing threshold values, there is a clear need for the use of conceptual models of groundwater flow and hydrochemical properties in the groundwater body.
9 Guidance Document No. 3: Analysis of Impacts and Pressures – WG 2.1 IMPRESS (2003) Guidance Document No. 7: Monitoring under the Water Framework Directive – WG 2.7 Monitoring (2003);
10 Guidance Document No. 15 Groundwater Monitoring (2007)

Working Group C – Groundwater, Activity WGC-2, “Status Compliance & Trends” Guidance on Groundwater Status and Trend Assessment – Final Draft 2.0, 15 October 2008
10
2.1.2 Conceptual models and status assessment
At each stage of the status assessment procedure it is important to consider the results of the risk assessment, the analysis of pressures (e.g. land use), the vulnerability of groundwater and the results of monitoring.
For the assessment of groundwater chemical status the GWD considers the conceptual model of a groundwater body as an integral component and refers to it at specific points:
- Annex III 3 proposes to support, where necessary, the status assessment by concentration estimations based on a conceptual model.
- Annex III 4 says that together with monitored data, a suitable conceptual model should enable Member States to assess good chemical status.
For quantitative status assessment the conceptual model also plays an important role in supporting the assessment of the impacts of changes in groundwater level on the groundwater body, on surface water levels and flows, and on groundwater dependent ecosystems.
2.1.3 Conceptual models and trend assessment
For the assessment of trends and trend reversal the conceptual model plays a key role as follows:
- when considering the physical and chemical temporal characteristics, including groundwater flow conditions, recharge rates and percolation time through soil or subsoil.
- when selecting monitoring location and frequencies to provide the information necessary to ensure that significant upward trends can be distinguished from natural variations with an adequate level of confidence and precision.
- when establishing starting points for trend reversal that are different to 75% of the groundwater quality standard (GW-QS) or TV which will depend on the characteristics, the aquifer and the ability to prevent most cost-efficiently any environmentally significant detrimental change in groundwater quality.
2.2 Dependent terrestrial ecosystems relevant for the status and trend assessment
According to the definition laid down in the ‘Wetland Guidance’ p2211
, relevant terrestrial ecosystems to be considered in the assessment of groundwater status and the establishment of TVs are Natura 2000 sites directly dependent on groundwater and other groundwater dependent terrestrial ecosystems (GWDTE) which are of sufficient ecological and socio-economic value that if damage to them were caused by groundwater alterations this could be regarded as significant (depending on its severity).
2.3 Naturally-occurring concentrations of substances - Background levels
Recital 10 of the GWD states that “groundwater chemical status provisions do not apply to high naturally-occurring levels of substances or ions or their indicators, contained either in a body of groundwater or in associated bodies of surface water, due to specific hydro-geological conditions, which are not covered by the definition of pollution.”
According to the GWD (Article 2.5), “’background level’ means the concentration of a substance or the value of an indicator in a body of groundwater corresponding to no, or only very minor, anthropogenic alterations to undisturbed conditions”.
Because background levels can, for some parameters and some type of groundwater body, be very high
12 it is of major importance to identify these background levels as a first step in the status and
trend assessments. Furthermore as underlined by the GWD (Annex II.A.1.d), “when establishing threshold values, Member States will consider […] hydro-geological characteristics including information on background levels”.
11
Guidance Document No. 12 The Role of Wetlands in the Water Framework Directive (2003) 12
Pauwels et al. (2006)
Working Group C – Groundwater, Activity WGC-2, “Status Compliance & Trends” Guidance on Groundwater Status and Trend Assessment – Final Draft 2.0, 15 October 2008
11
As concluded by the Baseline and BRIDGE projects13
a large range of hydrogeological and hydrochemical conditions is present within Europe. Background levels are the result of various factors such as water–rock interactions, chemical and biological processes in the vadose zone, residence time, rainfall, relationships with other aquifers (leakage). For this reason, each groundwater body is different and has a unique natural chemical composition. Furthermore, within each groundwater body, spatial variations of the background level will frequently be observed. However, it is possible to define the range of values for each parameter and for each type of aquifer.
For the identification of background levels Member States are free to apply their own approach depending on existing studies and conceptual models of the groundwater bodies. The BRIDGE project offers a methodology for calculating background levels which might be applied to all substances ranging from purely anthropogenic origin and occurring both, naturally and as a result of human activities. A simple approach using aquifer typologies as a starting point for the derivation of background levels is proposed in case knowledge is too low.
14
2.4 Concentrations below the limit of quantification
The treatment of values below the limit of quantification (LOQ) needs special attention when comparing data within an area or within time. Specific procedures are laid down in the GWD when assessing chemical status and when assessing trends and trend reversal.
Provisions in the QA/QC Commission Directive should be considered and applied accordingly, in particular Article 5.
15
2.4.1 Chemical status assessment
For chemical status assessment it is recommended that all measurements reported as below LOQ are replaced by values equal to half of the LOQ except for total pesticides (according to Article 5 of the Draft QA/QC Commission Decision). For total pesticides footnote (2) in Annex I GWD specifies that “’Total’ means the sum of all individual pesticides detected and quantified […]” meaning that only quantified concentrations should be considered when calculating the sum, and not values below the limit of quantification.
2.4.2 Trend assessment
Within trend assessment individual parameter concentrations (or values) below LOQ should be replaced by half of the value of the highest LOQ occurring in the time series being analysed (Annex IV A(2)(d) GWD). This requirement recognises that quantification limits might vary over time and could introduce bias in the trend assessment.
The exception is ‘total pesticides’ where only quantified concentrations should be considered in the assessment because the use of the replacement rule would potentially introduce bias. ‘Total pesticides’ should therefore be the sum of all individual pesticides (including relevant metabolites, degradation and reaction products) that are detected and quantified (GWD Annex I 1 (footnote)).
In addition to the above requirement, in order not to induce artificial trends, all measured data which are lower than the highest LOQ should be replaced by this LOQ/2. If the time series is of sufficient length, Member States should decide whether to remove old data (old consecutive data and not single measurements within the time series) with high LOQs. This would ensure that fewer measured data were replaced by the high LOQ/2, thereby losing valuable information.
A high proportion of measurements below the LOQ within a time series can pose a major bias in the assessment. In this situation, the trend test should not be performed if the influence of values below LOQ is considered to be too high
16.
13
Edmunds et Shand, (2003); Pauwels et al. (2006) 14
Müller et al. (2006) 15
Draft Commission Directive of [Day Month 2008] laying down, pursuant to Directive 2000/60/EC of the European Parliament and of the Council, technical specifications for chemical analysis and monitoring of water status. 10575/08 ENV 365.
16 Technical Report No. 1: Statistical aspects of the identification of groundwater pollution trends and aggregation of monitoring results – WG 2.8 Statistics (2001).

Working Group C – Groundwater, Activity WGC-2, “Status Compliance & Trends” Guidance on Groundwater Status and Trend Assessment – Final Draft 2.0, 15 October 2008
12
Note: In the future it may be possible to use concentrations below the limit of quantification (uncensored data) in the assessment of trends. However, currently these data are not available in many cases and are regarded as difficult to use routinely. In the light of scientific and technical progress in the future the GWD might be amended (in accordance with Article 8).
2.5 Reporting
Annex V of the WFD and the GWD specify how Member States have to report chemical and quantitative status and trends in the RBMPs. The information that has to be reported includes:
- Threshold values and a summary of the methodology used for deriving them. This must take into account the requirements in GWD Article 3.5 and Annex II Part C. The establishment of groundwater threshold values should at least consider the list of substances contained in GWD Annex II Part B.
- The results of chemical status and the methodology used to classify groundwater bodies in accordance with GWD Article 4.4 and Annex III point 5 and in Annex V 2.5 WFD.
- The results of quantitative status and the methodology used to classify groundwater bodies in accordance with Annex V 2.5 of the WFD.
- The results of trend and trend reversal assessment and the methodology used in accordance with GWD Article 5.4, 5.5 and Annex IV, Part A point 3. Annex V 2.4.5 requires the colour-coded indication of trends and trend reversal on the maps showing groundwater body chemical status.
All reporting requirements are considered within the set of Reporting Sheets which were developed by Working Group D (Reporting). Reporting for the first river basin cycle is required in 2010.
For transboundary water bodies the relevant Reporting Sheet requires information about the steps put in place to co-ordinate the establishment of threshold values, status assessment and trend assessment for transboundary groundwaters.
2.5.1 Groundwater threshold values
For each GWB and/or each parameter, Member States may derive several relevant threshold values depending on the receptors at risk (surface waters, GWDTE, usage…).
As required by Article 3.5 of the GWD, threshold values need to be established for the first time by 22 December 2008 and shall be published in the RBMP. According to Annex II Part C GWD Member States need to summarise the way the procedure set out in Part A of Annex II GWD has been followed and, where feasible:
- Information on the number of groundwater bodies at risk, the size of the bodies and the pollutants and indicators of pollution contributing to this classification;
- The relationship between the groundwater bodies and the associated surface waters and directly dependent terrestrial ecosystems (GWDTE);
- The threshold values (TVs) for each parameter and indicator of pollutants contributing to the risk classification and at which level the TVs apply (groundwater body, River Basin District, part of the international River Basin District, territory of the Member State);
- Relationship between TVs and background levels for naturally occurring parameters; and
- Relationship between TVs and environmental quality objectives and other standards.
Member States should report the respective information and values (environmental threshold values and/or usage threshold values, depending on the relevant receptors) in line with the respective WFD Reporting Sheet(s).
2.5.2 Groundwater body status
According to Annex V WFD Member States have to provide colour-coded maps in the RBMP showing quantitative and chemical status for each GWB. Good status is indicated by green colour and poor status is indicated by red colour.
Annex III 5 GWD requires Member States not only to produce maps in accordance with section 2.4.5 and 2.5. of Annex V of the WFD but … in addition to indicate on these maps all monitoring points where GW-QS and/or TVs are exceeded, where relevant and feasible.
Working Group C – Groundwater, Activity WGC-2, “Status Compliance & Trends” Guidance on Groundwater Status and Trend Assessment – Final Draft 2.0, 15 October 2008
13
It should be considered that not all TVs are relevant at all points depending on the receptors and their location within a GWB. It is proposed therefore to indicate on the map only monitoring points where there has been an exceedance of the most stringent relevant TVi and not display monitoring points where there is no relevant TVi or the TVi has not been exceeded.
This would be fully in line with the GWD which states "indicate exceedances...where relevant and feasible" and it would focus attention on the problems within a groundwater body.
In line with Article 4.4 GWD a description of the methodology for assessing groundwater chemical status needs to be summarised in the RBMP. This summary shall also include an explanation as to the manner in which exceedances of groundwater quality standards or threshold values at individual monitoring points have been taken into account in the final assessment.
2.5.3 Trend assessment
According to Annex V 2.5 and 2.4.5 the results of the trend and trend reversal assessment need to be shown in a map. Groundwater bodies which are subject to a significant and sustained upward trend in the concentrations of any pollutant resulting from the impact of human activity must be indicated by a black dot on the map. Where reversal of an upward trend has been achieved this must be indicated by a blue dot.
As required by GWD Article 5(4) and in accordance with Article 13 WFD and Article 5(5) GWD Member States must also summarise in the RBMP:
- the way in which the trend assessment at individual monitoring points within a body or a group of bodies of groundwater has contributed to identifying that those bodies are subject to a significant and sustained upward trend or a reversal of that trend; and
- the reasons for the defined starting points for implementing measures to reverse trends and;
- where relevant, the results of the assessments of the impacts of existing plumes, in particular, verification by additional trend assessments that existing plumes from contaminated sites do not expand, do not deteriorate the chemical status of groundwater bodies and do not present a risk for human health and the environment.

Working Group C – Groundwater, Activity WGC-2, “Status Compliance & Trends” Guidance on Groundwater Status and Trend Assessment – Final Draft 2.0, 15 October 2008
14
3 STATUS ASSESSMENT
In accordance with the GWD, status assessment only needs to be carried out for groundwater bodies identified as being at risk and in relation to the receptor and each of the pollutants which contribute to the GWB being so characterised (Annex III 1 GWD). Groundwater bodies not at risk are automatically classified as being of good status.
Status assessment is carried out using available surveillance and operational monitoring data collected during the period of the RBMP. It has to be performed at the end of a RBMP in order to reflect on the effectiveness of the programmes of measures previously established.
The map showing the results of groundwater status assessment is an integral part of the RBMP. As a draft of the RBMP is subject to public participation one year before being operational, it is recommended that status is assessed prior to the release of the draft RBMP so that the results/maps can be included.
3.1 Classification tests
The achievement of good status in groundwater involves meeting a series of conditions which are defined in the WFD/GWD. In order to assess whether those conditions have been met, a series of classification tests (for both quantitative and chemical status) has been developed (illustrated in Figure 1). There are five chemical and four quantitative tests with some elements of the tests common to both assessment of chemical and quantitative status. Each relevant test (considering classification elements which are at risk) should be carried out independently and the results combined to give an overall assessment of groundwater body chemical and quantitative status (see chapter 4.4 and Figure 4). The worst case classification from the relevant chemical tests is reported as the overall chemical status of the groundwater body, and the worst case classification from the relevant quantitative tests is reported as the overall quantitative status. If any of the tests results in poor status (chemical or quantitative), then the overall classification of the body will be poor. All relevant tests must be completed for each groundwater body and the process should not stop after the first poor result is achieved.

Working Group C – Groundwater, Activity WGC-2, “Status Compliance & Trends” Guidance on Groundwater Status and Trend Assessment – Final Draft 2.0, 15 October 2008
15
Figure 1: Overall procedure of classification tests for assessing groundwater status
All relevant tests must be completed. (Considering classification elements which are at risk)
The worst result is reported for the groundwater body.
GOOD GOOD POOR POOR
TEST Saline or other intrusions
TEST Surface Water
TEST Groundwater Dependent Terrestrial Ecosystems
TEST Drinking Water Protected Areas
TEST General Quality Assessment
TEST Water Balance
Groundwater Chemical Status
Groundwater Quantitative Status
G
G
G
G
G
P
P
P
P
P
G
G
G
G
P
P
P
P

Working Group C – Groundwater, Activity WGC-2, “Status Compliance & Trends” Guidance on Groundwater Status and Trend Assessment – Final Draft 2.0, 15 October 2008
16
3.2 Risk Assessment versus Status Assessment
The validation of the WFD Article 5 pressure and impact analysis (risk assessment) at the beginning of a River Basin Management Plan (RBMP) cycle should be clearly differentiated from the assessment of groundwater body status at the end of a RBMP cycle (status assessment).
At the beginning of each cycle the risk assessment considers pressures and impacts and provides an estimate of what the groundwater body status will be at the end of the cycle. This estimate is validated by recent data from surveillance monitoring and any trend assessment considered appropriate. If it is not clear that a groundwater body will be of good status at the end of a RBMP cycle, further characterisation will be needed as well as operational monitoring, the derivation of threshold values and a programme of measures.
The threshold values and the programmes of measures should be reported in the RBMPs. At the end of each RBMP, status classification should be undertaken to assess whether the groundwater body is of good status and the programme of measures has been effective.
The two assessments (risk assessment and status assessment) are likely to be performed at approximately the same time but are separate parallel processes. The risk assessment looks forward to the end of the next RBMP cycle, and status assessment looks back at performance during the last RBMP cycle (see Figure 2).
Article 5 Risk assessment
"Good status at end of RBMP X+1" ?
Status assessment
RBMP X
RBMP X+1
Year
Figure 2: Risk assessment looks into the future whereas status assessment looks back on the performance.
3.3 Confidence in the assessment
According to Annex V 2.4.1 of WFD “[…] Estimates of the level of confidence and precision of the results provided by the monitoring programmes shall be given in the plan.”

Working Group C – Groundwater, Activity WGC-2, “Status Compliance & Trends” Guidance on Groundwater Status and Trend Assessment – Final Draft 2.0, 15 October 2008
17
4 CHEMICAL STATUS ASSESSMENT
4.1 Definition of Good Chemical Status and Legal background
The definition of chemical status is set out in WFD Annex V 2.3.2. It states that good groundwater chemical status is achieved when:
“The chemical composition of the groundwater body is such that the concentrations of pollutants:
– as specified below, do not exhibit the effects of saline or other intrusions,
– do not exceed the quality standards applicable under other relevant Community legislation in accordance with Article 17 WFD
17
– are not such as would result in failure to achieve the environmental objectives specified under Article 4 for associated surface waters nor any significant diminution of the ecological or chemical quality of such bodies nor in any significant damage to terrestrial ecosystems which depend directly on the groundwater body.
Changes in conductivity are not indicative of saline or other intrusion into the groundwater body.”
The GWD goes on to state that the chemical status assessment shall be carried out for all groundwater bodies at risk of not meeting WFD Article 4 objectives in relation to each of the pollutants which contribute to the groundwater body being so characterised (Annex III 1 GWD). This applies to those groundwater bodies identified as at risk in 2004 to meet WFD Article 5 requirements and also any subsequently identified following work to update the risk assessment using new monitoring data. According to Article 4(2) of the GWD a groundwater body is considered to be of good status when:
- Annex V 2.3.2 (WFD) conditions have been met,
- no relevant TV (Article 3 and Annex II GWD) or GW-QS (Annex I GWD) has been exceeded at any monitoring point, or
- a TV or GW-QS has been exceeded at one or more monitoring points but appropriate investigations (Annex 3 GWD) confirm:
i. pollutant concentrations do not present a significant environmental risk (taking account, where appropriate, the extent of the groundwater body which is affected;
ii. other conditions for good status of Annex V 2.3.2 (WFD) are being met in accordance with paragraph 4 of Annex III GWD;
iii. no deterioration in quality of waters for human consumption (DWPA) in accordance with paragraph 4 of Annex III GWD; and
iv. no significant impairment of human uses.
Annex V 2.4.5 WFD provides the following specifications for the procedure of assessing groundwater chemical status:
“In assessing status, the results of individual monitoring points within a groundwater body shall be aggregated for the body as a whole. Without prejudice to the Directives concerned, for good status to be achieved for a groundwater body, for those chemical parameters for which environmental quality standards have been set in Community legislation:
– the mean value of the results of monitoring at each point in the groundwater body or group of bodies shall be calculated; and
– in accordance with Article 17 these mean values shall be used to demonstrate compliance with good groundwater chemical status. […]”
The GWD goes on to state that according to Annex III 2(c). “Member States will take into account […] (c) any other relevant information including a comparison of the annual arithmetic mean concentration
17
This corresponds to the WFD requirement leading to the GWD adoption

Working Group C – Groundwater, Activity WGC-2, “Status Compliance & Trends” Guidance on Groundwater Status and Trend Assessment – Final Draft 2.0, 15 October 2008
18
of the relevant pollutants at a monitoring point with the groundwater quality standards […] and the threshold values […].”
According to Annex III 3 (GWD), for (i) and (iv) MS will estimate the extent of the groundwater body having an annual arithmetic mean concentration of a pollutant higher than GW-QS or TV;
For (ii) and (iii) MS will assess:
- the impact of pollutants in the groundwater body
- the amount and concentrations of pollutants being, or likely to be, transferred from the groundwater body to the associated surface waters or directly dependent terrestrial ecosystems, and the resulting likely impacts
- the extent of any saline or other intrusions into the groundwater body
- the risks from pollutants in the groundwater body to the quality of water abstracted or intended to be abstracted for human consumption
The chemical classification tests specified in this guidance derive from the above requirements.
4.2 Elements of chemical status assessment
In the assessment of groundwater chemical status the following elements should be considered:
- criteria for assessing groundwater chemical status (groundwater quality standards and threshold values) - described in detail in chapter 4.3,
- the need for data aggregation,
- the extent of an exceedance,
- the location of an exceedance,
- the confidence in the assessment.
4.2.1 Data aggregation
As already described above, data aggregation is referred to by several Articles and Annexes in the WFD and the GWD. It concerns the assessment of:
- significant environmental risk from pollutants across a groundwater body,
- no significant impairment of human uses,
- diminution of ecological and chemical quality of associated surface water bodies,
- damage to GWDTE,
- no deterioration of waters for human consumption.
As a rule it is proposed to consider monitoring data collected in the 2 most recent years, which makes it possible to calculate an average value even if only 1 measurement per year is taken. A longer averaging period (up to 6 years) may be chosen where the conceptual model and monitoring data indicate a need to avoid the influence of short-term variations in quality that do not indicate the real impacts of pressures.
4.2.2 Extent of exceedance
According to Article 4 GWD a groundwater body is of good status when GW-QSs or TVs are not exceeded at any monitoring point. Where a GW-QS or TV has been exceeded at one or more monitoring points appropriate investigation, with appropriate aggregation of monitoring results, is needed to estimate the extent of the groundwater body (in terms of volume or spatial area) having an annual arithmetic mean concentration of a pollutant higher than a GW-QS or TV. This concerns the assessment of:
- significant environmental risk from pollutants across a groundwater body,
- no significant impairment of human uses,
- saline and other intrusion.

Working Group C – Groundwater, Activity WGC-2, “Status Compliance & Trends” Guidance on Groundwater Status and Trend Assessment – Final Draft 2.0, 15 October 2008
19
To satisfactorily carry out the appropriate investigation(s) additional data may also be used to refine the conceptual model and/or confirm the extent of exceedance.
4.2.3 Location of exceedance
Some of the criteria for assessing status also rely on assessing impacts at a local scale, which may not be representative of conditions across the whole groundwater body. In these cases, the location of the exceedance will be relevant in determining whether the conditions of good status have been met. This concerns the assessment of:
- diminution of ecological and chemical quality of associated surface water bodies,
- damage to GWDTE,
- saline and other intrusion,
- no deterioration of waters for human consumption.
Regarding the protection of dependent terrestrial and aquatic ecosystems Member States will assess where relevant and necessary, the amounts and the concentrations of the pollutants being, or likely to be, transferred from the groundwater body to the associated surface waters or GWDTEs [Annex III 4 (b)] and the likely impact of the pollutants transferred [Annex III 4 (c)].
The assessment of any saline or other intrusions into the groundwater body is linked to the identification of areas where there is a pressure due to water abstraction and the effects appearing at relevant monitoring points in relation to rising trends in relevant pollutant concentrations and significant impacts on points of abstraction.
4.3 Groundwater Quality Standards and Threshold Values
4.3.1 Specific Background and Requirements
Article 3 of the GWD lays down criteria for assessing groundwater chemical status:
“1. For the purposes of the assessment of the chemical status of a GWB [….] Member States shall use the following criteria:
(a) groundwater quality standards as referred to in Annex I,
(b) threshold values to be established by Member States in accordance with the procedure set out in Part A of Annex II […]”.
Furthermore, appropriate investigation where a groundwater quality standard (GW-QS) or a threshold value (TV) has been exceeded forms part of the status assessment criteria, as set out in Annex III of the GWD.
The GWD defines groundwater quality standards for two pollutants types, see Table 1.
Table 1: Groundwater quality standards (GWD Annex I)
Pollutant Quality standards
Nitrates 50 mg/l
Active substances in pesticides, including their relevant metabolites, degradation and reaction products
0.1µg/l
0.5 µg/l (total)
However, if these groundwater quality standards are not adequate for achieving the environmental objectives set out in Article 4 of the WFD e.g. if concentrations in groundwater that are lower than quality standards are leading to (or are likely to lead to) chemical and/or the ecological status failures in associated surface waters and/or significant damage to associated terrestrial ecosystems, then more stringent values have to be applied
18. These new values become ‘threshold values’ and the
procedure to define them follows Article 3 and Annex II of the GWD and the specifications described in this document.
18
Typically, an example is when nitrates values lower than 50 mg/l in groundwater are demonstrated to be the cause of eutrophication in an associated surface water body, thus justifying a lower threshold value for nitrates to be established.

Working Group C – Groundwater, Activity WGC-2, “Status Compliance & Trends” Guidance on Groundwater Status and Trend Assessment – Final Draft 2.0, 15 October 2008
20
Article 3.1(b) of the GWD requires Member States to derive ‘threshold values’ for other relevant parameters that are causing a GWB to be at risk of not meeting the WFD Article 4 objectives. As defined in Article 2.2, these threshold values will become Member State defined quality standards. They should be set at the most appropriate scale (national, river basin district, or groundwater body level) and be used in the assessment of good chemical status. Member States need to take into account at least the list of substances in Annex II.B which are:
o “Substances or ions or indicators which may occur both naturally and/or as a result of human activities”: As, Cd, Pb, Hg, NH4
+, Cl
-, SO4
2-
o “Man-made synthetic substances”: Trichloroethylene, Tetrachloroethylene
o “Parameters indicative of saline or other intrusion”: Conductivity or Cl- and SO4
2- depending
on Member States
Note: “Taking into account…” does not mean that deriving threshold values for all of the parameters in Annex II.B is obligatory. Deriving threshold values for other substances/parameters which are not on the list but which cause the groundwater body to be at risk is an obligation.
Criteria for the establishment of threshold values
As mentioned in the GWD Annex II.A, “the determination of threshold values should be based on:
a) the extent of interactions between groundwater and associated aquatic and dependent terrestrial ecosystems;
b) the interference with actual or potential legitimate uses or functions of groundwater;
[…]
c) hydro-geological characteristics including information on background levels”.
Moreover, it is also written in Annex II.A of the GWD that “threshold values will be established in such a way that […] this will indicate a risk that one or more of the conditions for good groundwater chemical status referred to in Article 4.2.c.(ii), (iii) and (iv) are not being met”. The latter Article refers to:
- the definition of good groundwater chemical status (WFD Annex V 2.3.2). See section chapter 4.1 of this document.
- protected areas used for the abstraction of drinking water (WFD Article 7),
- the ability of the groundwater body to support human uses.
Based on these elements, two criteria can be considered when deriving threshold values:
- environmental criteria
o TVs that aim to protect associated aquatic ecosystems and groundwater dependent terrestrial ecosystems,
- usage criteria
o TVs that aim to protect drinking water in Drinking Water Protected Areas (DWPA) and,
o other legitimate uses of groundwater: crops irrigation, industry, etc…[Only uses involving a significant surface (or volume) of the groundwater body compared to the whole surface (or volume) of the groundwater body should be considered.]
Note: These criteria consider the minimum level of receptor protection according to the requirements of the GWD. Member States may additionally choose to consider ‘groundwater’ as a legitimate function to be protected in its own right and establish TVs for this purpose. However, it is clear that there is no obligation to do so.
Scale for setting threshold values
Depending on the type of pollutant, the risks to groundwater and on the observed concentrations, Member States can derive threshold values at different scales: groundwater body (or group of groundwater bodies), river basin district, national part of an international river basin district or national level (Article 3.2 GWD). The groundwater body is the smallest scale allowed for threshold values derivation.
For example, when a purely anthropogenic pollutant (e.g. trichloroethylene) is frequently observed at very low levels, Member States may set a threshold value at the national level as long as the achievement of environmental objectives in any individual groundwater body is not compromised.

Working Group C – Groundwater, Activity WGC-2, “Status Compliance & Trends” Guidance on Groundwater Status and Trend Assessment – Final Draft 2.0, 15 October 2008
21
Alternatively, for parameters that have natural concentrations which vary from one groundwater body to another (e.g. As, Cl
-, SO4
2-, NH4
+ and metals
19), it is highly recommended to establish threshold
values at groundwater body scale.
Transboundary aspects
Member States sharing transboundary groundwater bodies shall ensure that the establishment of threshold values is subject to coordination between the Member States concerned (Article 3.3 GWD).
For groundwater bodies shared between one or more Member States and one or more non-Member State, the concerned Member State(s) shall endeavour to establish threshold values in coordination with the non-Member State(s) concerned (Article 3.4 GWD).
Timetable and revision
Threshold values must be established by Member States for the first time by 22 December 2008 (Article 3.5 of the GWD) and published in the first RBMP i.e. by 22 December 2009 (Article 13 WFD).
However, the threshold value derivation process is an on-going process and Member States can add, remove or re-insert threshold values for any substance whenever it is necessary (Article 3.6 of the GWD). Any changes will depend upon “new information” on the parameters derived from new scientific knowledge and understanding. These changes must be reported in subsequent river basin management plans.
Member States may also remove a threshold value from the list when the body of groundwater concerned is no longer at risk from the corresponding parameter.
4.3.2 Links between threshold values and the “prevent or limit” objective (Article 6)
The ‘prevent or limit’ objective in the WFD/GWD aims to protect all groundwater from unacceptable inputs of pollutants. Preventing or limiting pollutants in groundwater protects a wide range of receptors and protects groundwater from pollution at a local scale.
This is different to the requirements for good chemical status. The assessment of good chemical status is carried out over the whole of a groundwater body, which in most cases will be a large area. The assessment is carried out once every RBMP period, i.e. every six years, and supplies information on the current condition of groundwater bodies. This assessment reflects whether the groundwater body meets good chemical status specified in the WFD/GWD or not. The definition of good chemical status is limited to only a few receptors and specific circumstances. Achieving good status does not necessarily protect groundwater quality at a local scale.
To affect a receptor, a pollutant must physically move through the groundwater system. This movement varies according to the physical and chemical characteristics of the geological strata. Most importantly, the pollutant may be subject to dilution and attenuation along the flow path to a receptor. For this reason, many inputs only have local effects. These inputs may still result in localised pollution of groundwater, but do not affect the status of the groundwater body if they have little or no impact on the receptors noted in the definition of good chemical status of groundwater. Under the WFD/GWD it is quite possible to have localised pollution within a groundwater body that is of good chemical status. However, the more widespread the pollution, the more likely the groundwater body will not be of good chemical status. In case of such localised pollution, Member States should carry out investigations and take measures to limit the pollution despite the whole groundwater body being of good status. These measures should be appropriate measures under Article 6 of the GWD (preventing and limiting inputs).
Look out! In principle, prevent or limit measures are our first line of defence in preventing unacceptable inputs of pollutants to all groundwater (and thereby avoiding pollution). The effective implementation of the ‘prevent or limit’ objective via routine regulation should ensure that groundwater quality is protected. This day to day regulation can consist of permits, general binding rules or codes of practice to control specific activities on the land surface. Permit conditions and/or “Limit Values” may be used to ensure that no unacceptable input of pollutants into
19
Pauwels et al. (2006)

Working Group C – Groundwater, Activity WGC-2, “Status Compliance & Trends” Guidance on Groundwater Status and Trend Assessment – Final Draft 2.0, 15 October 2008
22
groundwater occurs. Notwithstanding the time that is required to enable the historical legacy of prior releases to be degraded or dispersed, if all prevent or limit requirements were met everywhere within a groundwater body, the body would be of good chemical status. The ‘prevent or limit’ and the status requirements are therefore complementary, and used together provide an effective framework for groundwater protection across the EU (see CIS Guidance N°17
20).
The threshold values described in this guidance are needed for assessing good chemical status, but these values (and the associated compliance regime) are not meant to meet the requirements of the ‘prevent or limit’ objective. This is because they will not protect groundwater from pollution at the local scale.
Further information about the way to implement the ‘prevent or limit’ objective is available in the respective guidance document on “Direct and Indirect Inputs”
20. Nevertheless, it seems helpful
summarising the different purposes and roles of Limit Values and Threshold Values in the protection of groundwater:
1. Definitions
Threshold Value – as already defined, is established for ensuring compliance (protecting receptors) with the definition of good chemical status.
Criteria Value – is the concentration of a pollutant, not taking into account any natural background concentrations, that if exceeded may lead to a failure of the good status criterion concerned.
Limit Value – is the concentration and associated compliance regime that, when not exceeded at the source, will prevent an unacceptable release to groundwater. Examples of limit values are concentrations or acceptable loads included in a permit as a condition, or a remedial target for contaminated land sites. This is measured at the source, i.e. the point of release.
Compliance Value – is the concentration and associated compliance regime that, when not exceeded at the Point of Compliance (POC), will prevent pollution. This is measured at the prevent/limit monitoring point.
Both limit values and compliance values are set to protect groundwater quality at the local scale in the context of the ‘prevent or limit’ objective.
2. Scale of application
Threshold values established for meeting the requirements of Articles 3 and 4 of the GWD do not necessarily apply at the same POCs as compliance values (described in the respective guidance document
20). Assessment of status is carried out at monitoring points of the operational and
surveillance monitoring network, which are distributed across the groundwater body. Inputs are assessed locally to the source of the input at prevent/limit monitoring points, which may be real or virtual. This gives more immediate and comprehensive protection for “groundwater itself” as a receptor. It should be noted that in some cases, the prevent/limit monitoring point used to assess the acceptability of the input may also be an operational monitoring point where status is assessed, in which case the threshold value is an appropriate compliance value;
3. Location of application
Threshold values apply to a groundwater body as a whole, whereas compliance values supporting the ‘prevent or limit’ objectives apply to all groundwater. Several different compliance values can be applied at different POCs. For example, water within discontinuous river terrace gravel deposits or perched water in a peat deposit above a boulder clay are both groundwater, and inputs of pollutants have to be prevented or limited to ensure that no pollution of any receptor occurs. However, neither of these geological deposits are groundwater bodies (management units) and do neither need a status classification nor threshold values.
20
Guidance Document No. 17 Preventing or Limiting Direct and Indirect Inputs (2007)

Working Group C – Groundwater, Activity WGC-2, “Status Compliance & Trends” Guidance on Groundwater Status and Trend Assessment – Final Draft 2.0, 15 October 2008
23
4.3.3 General methodology for establishing threshold values
The general methodology for defining threshold values in a GWB is summarised in Figure 3.
As highlighted in chapter 4.3.1, two types of criteria should be considered when establishing threshold values: Environmental criteria and Usage criteria
Threshold values will be set by Member States by comparing the background level (BL) to the criteria value (CV). The criteria value is the concentration of a pollutant, not taking into account any natural background concentrations, that if exceeded would lead to a failure of one or more of the good status criteria. CVs should take into account risk assessment and groundwater functions.
When BLs and CVs are compared, two situations may arise:
- Case 1: BL is below CVi. In this case, Member States will define the TV according to national strategies and a risk assessment (enabling a TV to be established above the BL providing it can be clearly justified).
- Case 2: BL is higher than CVi. In this case, the TV should be equal to the BL.
However, in order to integrate the concept of sustainable development and allow for the growth of economic activities (especially existing activities). Member States may consider a small addition to the BL which represents an acceptable amount of human influence as long as this is considered not to be harmful in protecting the relevant receptors. Such an admissible additional concentration would consider the requirement to “limit inputs” of non-hazardous pollutants according to Article 6 GWD and also aim to avoid unwanted problems in compliance checking caused by a large number of wells with small trivial exceedances of the threshold values. Given the fact that the 90 percentile will often be chosen as a criterion for the selection of BL at least 10% of the observation wells are expected to show exceedances if the threshold value is set exactly at the BL concentration. This would inevitably lead to an ‘appropriate investigation’ for all groundwater bodies under case 2, which is considered unworkable.
Member States should define the admissible additional concentration using a risk assessment procedure. In particular it is recommended to take the vulnerability or susceptibility of the groundwater body into account (including soil biogeochemical properties and pollutant properties). Such an assessment will depend on the level of knowledge and confidence in the conceptual model. It should be noted that Member States can update threshold values in accordance with the rules explained in chapter 4.3.1. Therefore it may also be necessary to adjust the “admissible additional concentration” as a consequence of threshold value changes taking into account new information, e.g. resulting from research projects.
In addition to socio-economic reasons, a TV which includes a certain amount of concentration in addition to the BL may also be acceptable for practical reasons including harmonisation with other directives such as the Nitrates Directive, the Drinking Water Directive or the future EQS Directive. However, in all cases the final TV must protect all receptors (human uses as well as surface waters and GWDTE ecological status). Furthermore, groundwater protection is also guaranteed by achieving Article 5 and 6 objectives of the GWD. These require Member States to reverse any significant upward trend of pollutants and limit or prevent inputs of pollutants into groundwater
21.
21
Guidance Document No. 17 Preventing or Limiting Direct and Indirect Inputs (2007)

Working Group C – Groundwater, Activity WGC-2, “Status Compliance & Trends” Guidance on Groundwater Status and Trend Assessment – Final Draft 2.0, 15 October 2008
24
Figure 3: General methodology to derive groundwater threshold values.
Usage criteria *
Selection of legitimate uses which are significant compared to the whole use of the GWB
Select the relevant criteria
Environmental criteria
Surface waters
Drinking water
Industry Crops Others…
Derive a criteria value (CV) for each of the relevant receptors
CV4=DWS CV5 CV6 CVi… CV2=
EQS*AF2/DF
Saline Intrusion
Compare CVi to background level (BL)
If CVi ≤≤≤≤ BL then TVi = BL If CVi > BL then BL < TVi ≤≤≤≤ CVi
TV4 TV5 TV6 TVi… TV2 TV1
EQS = Environmental Quality Standard or any other relevant ecotoxicological value AF= Attenuation Factor, DF=Dilution Factor (AF and DF to be defined by Member State if possible. In case data are not sufficient to assess AF and DF, then AF=DF=1)
* Usage criteria are relevant use based standards, such as drinking water standards, irrigation standards etc. If the monitoring point where compliance against the TV is to be assessed is not the abstraction point, it may be appropriate to take into account dilution and attenuation when deriving the TV.
Use appropriate TVi for each relevant test
Reporting Identify the most stringent environmental TV (most stringent of TV1 – TV3)
Identify the most stringent usage TV (most stringent of TV4 – TVi
TV subject to reporting = environmental TV and/or usage TV
GWDTE
CV3
TV3
CV1=BL
TV to be defined by MS taking the risks and the functions into account
BL
CV TV
BL CV
Case 2 Case 1

Working Group C – Groundwater, Activity WGC-2, “Status Compliance & Trends” Guidance on Groundwater Status and Trend Assessment – Final Draft 2.0, 15 October 2008
25
Determining threshold values for “associated aquatic ecosystems and GWDTE”
When groundwater and surface waters are linked and especially when surface waters or dependent terrestrial ecosystems are fed by groundwater, the criteria value(s) relevant to protection of the associated surface water or GWDTE will be derived using environmental quality standards (EQS) for surface water (or any other relevant ecotoxicological value). For priority substances and other pollutants listed in the proposal of the Commission for a Directive on “Environmental quality standards in the field of water policy and amending Directive 2000/60/EC”, EQS values set in this text may be used. Any other EQS derived locally or nationally by a Member State using for example ecotox-test-results of aquatic organisms might also be applied.
Because the concentration of a parameter varies between the aquifer and the river, a dilution factor (DF) or an attenuation factor (AF) may be applied to derive an appropriate criteria value.
The calculation of attenuation and dilution factors will depend on the level of knowledge of groundwater-surface water interaction, the conceptual model and the position of monitoring points in the groundwater system relative to the receptor (see Annex 1 for general principles of applying DF and AF factors). Each Member State will be free to set the value(s) of a dilution factor (DF) and an attenuation factor (AF) for each groundwater body according to its own approach and knowledge. The BRIDGE project proposals for calculating DF and AF might also be used
22.
The relevant criteria value is hence equal to:
CV = EQS*AF/DF.
Dilution and attenuation should not be included when monitoring takes place in the receptor.
In this case:
DF = AF = 1 * EQSsurface water.
Note: The use of AF and DF require that there is a good understanding of the groundwater system and its relationship to surface water. Where this understanding is lacking then use of AF and/or DF may not be possible. In this case a precautionary approach may be taken in the first instance; i.e. CV = EQS
In the previous recommendations, based on BRIDGE outcomes, AF is considered as being <1. If a Member State has already defined some AF for some groundwater bodies, and if these AF have a slightly different definition (e.g. AF>1), then the above equation could be adapted. The determination of the threshold value should indeed always be based on existing knowledge at the national level.
Determining threshold values for “legitimate uses”
Where groundwater has uses in addition to supporting surface water chemistry and ecology, e.g. drinking water supply, crop irrigation or supporting the food production industry, then these ‘legitimate uses’ need to be protected under the WFD and GWD. To support this, criteria values will need to be defined as appropriate. For example values will only need to be derived and considered if the total surface or volume of the polluted area putting these “legitimate uses” at risk is ‘significant’ compared to the whole surface or volume of the groundwater body. In the case of drinking water supply, drinking water standards (DWS) should be considered when deriving criteria values. For other uses such like crop irrigation and industry a case by case approach is recommended.
If the monitoring point where compliance with the threshold value is to be assessed is not the abstraction point, it may be appropriate to also take into account dilution and attenuation when deriving the threshold values and criteria values (see Annex 1). This has to be decided by individual Member States.
It should be noted, however, that the compliance regime for Drinking Water Protected Areas (DWPA) does not only account for a check on the exceedance of threshold values, but also relies on testing whether there will be no need for a (further) increase of water treatment measures as required by Article 7.3 of the WFD (see chapter 4.4.6).
22
Müller et al. (2006)

Working Group C – Groundwater, Activity WGC-2, “Status Compliance & Trends” Guidance on Groundwater Status and Trend Assessment – Final Draft 2.0, 15 October 2008
26
Determining threshold values for “saline or other intrusions”
The relevant threshold value for saline or other intrusions will be the BL for key parameters (i.e. those indicative of intrusion) as this is the most appropriate environmental value to use when examining if there has been any intrusion caused by anthropogenic activities.
4.4 Procedure for assessing groundwater chemical status
Depending on the results of the risk assessment several tests have to be performed to assess groundwater chemical status. According to WFD and GWD objectives, the main criteria to be considered in these tests are:
- Environmental criteria. This includes:
- Protection of associated (connected) surface water bodies
- Protection of GWDTE
- Protection of groundwater bodies from saline or other intrusion
- Usage criteria. This includes:
- Protection of drinking water in DWPA
- Protection of other legitimate uses: crop irrigation, industry….
Each classification test considers specific elements of chemical status as already described in chapter 4.2 and summarised in Table 2. Within the following sub-chapters each classification test is described in detail and the single elements of testing are addressed.
Table 2: Summary of classification tests and corresponding status testing elements
Classification Element Classification Test
Elements of testing
Da
ta
ag
gre
ga
ton
Ex
ten
t o
f e
xc
eed
an
ce
Lo
ca
tio
n o
f e
xc
eed
an
ce
Co
nfi
de
nce
No significant impairment of human uses (GWD Article 4(2)(c) (iv)) General assessment of chemical
status of the groundwater body as a whole.
� � � No significant environmental risk from pollutants across a groundwater body. (GWD Article 4(2)(c) (i) and Annex III 3).
No Saline or other Intrusions (WFD Annex V 2.3.2)
Saline or other intrusion � � � �
No significant diminution of surface water ecology. (WFD Annex V 2.3.2) No significant diminution of surface
water chemistry and ecology due to transfer of pollutants from the GWB
� � � No significant diminution of surface water chemistry. (WFD Annex V 2.3.2)
No significant damage to GWDTE. (WFD Annex V 2.3.2)
No significant damage to GWDTE due to transfer of pollutants from the GWB
� � �
No deterioration in quality of waters for human consumption (GWD Article 4(2)(c) (iii)) and Annex III 4)
Meet the requirements of WFD Article 7(3) - Drinking Water Protected Areas � � �
4.4.1 Practical procedure
The chemical status assessment of GWBs may be considered as a two-step procedure:
- Step 1: Check for any exceedance of a threshold value or a quality standard. If there is no exceedance at any monitoring point the groundwater body will be of good status.

Working Group C – Groundwater, Activity WGC-2, “Status Compliance & Trends” Guidance on Groundwater Status and Trend Assessment – Final Draft 2.0, 15 October 2008
27
Note: The threshold value to use in step 1 will be the most stringent value derived using the methodology described in chapter 4.3. This approach is consistent with the precautionary principle.
- Step 2: Where there is one (or more) exceedance(s) of a quality standard or TV, an “appropriate investigation” should be carried out. This will involve carrying out the different steps in the relevant classification test to determine whether the exceedance is causing a failure of good chemical status.
Figure 4: General procedure to assess a GWB chemical status.
Calculate the mean value for each relevant parameter and monitoring site in the GWB
Poor status Good status
If the GWB is of poor status for at least ONE test
If the GWB is of good status for ALL the tests
Is there at least 1 monitoring point with a mean value higher than the most stringent TV
or quality standard?
Yes No
Programme of Measures
Carry out an "appropriate investigation”
Apply the relevant TEST(S) :
- saline or other intrusion
- surface water
- GWDTE
- DWPA
- General quality assessment
Consider Article 4(5) GWD
Step 2
Step 1
Working Group C – Groundwater, Activity WGC-2, “Status Compliance & Trends” Guidance on Groundwater Status and Trend Assessment – Final Draft 2.0, 15 October 2008
28
4.4.2 Test: General assessment of the chemical status of the groundwater body as a whole
This test considers the assessment of:
- a significant environmental risk from pollutants across a groundwater body, and
- a significant impairment of the ability to support human uses.
Based on the legal requirements, the general assessment of the groundwater chemical status focuses on the whole groundwater body and considers the following elements:
- Criteria for assessing groundwater chemical status for this test (GW-QSs and TVs)
- Data aggregation
- Extent of exceedances
- Confidence in the assessment (considering the level of the concentrations).
Within the assessment, groups of groundwater bodies will need special attention and treatment. Groundwater bodies can be grouped for monitoring purposes as long as it is ensured that the monitoring and environmental objectives for each of the component bodies can be reliably achieved
23.
The Guidance Document on Groundwater Monitoring distinguishes between grouping of groundwater bodies that are at risk and not at risk. Where groundwater bodies are at risk of not meeting the WFD Article 4 objectives it is recommended to have at least one monitoring point per body. In groundwater bodies that are not at risk a monitoring point is not required in each individual groundwater body (component body) in the group of groundwater bodies.
Where monitoring results show that there is an exceedance at one or more monitoring sites, the conceptual model for the group should be reviewed to ensure it can still be applied to all bodies in the group. If the rationale for grouping groundwater bodies is confirmed, the status of the individual bodies can be considered to be the same and there will be no need to split the group. If this is not the case, the grouping needs to be reviewed and the tests applied accordingly
Proposed procedure:
- Step 1 (aggregation): Test if the mean concentration of a relevant parameter at any monitoring point exceeds a GW-QS or TV. In the case of no exceedance, the groundwater body is recom-mended to be of good chemical status for the relevant parameter. No further investigation and assessment is needed. If there is an exceedance, step 2 of the procedure should be followed.
- Step 2 (groups of groundwater bodies): In case of a group of groundwater bodies, if necessary, the group could be split and the single component bodies where an exceedance was recorded should be properly delineated based on an improved conceptual model and treated as individual groundwater bodies in the test.
- Step 3 (exceedance): Calculate the extent of exceedance (of mean values) for each substance individually and compare it to an acceptable extent of exceedance for a groundwater body to be of good groundwater chemical status. It is proposed that a simple methodology is applied which considers the proportion of the total area or volume of the groundwater body represented by monitoring points exceeding a GW-QS or TV compared to the total area or volume of the whole groundwater body. An acceptable extent of exceedance for each substance would not exceed 20 %
24 of the total groundwater body.
- Step 4 (confidence): If the extent of exceedance exceeds 20 % (or other relevant criteria)25
, further assessment should distinguish whether a groundwater body is of good status or not. Such an assessment could consider an evaluation of the confidence which could help distinguish whether the identified extent of exceedance is acceptable or not. This assessment of confidence could take into account analytical uncertainty, uncertainty due to the monitoring network and uncertainty due to the variation of concentrations. In case of insufficient data, a deterministic approach could be applied, to assess pressures and impacts in more detail.
23
Guidance Document No. 15 Groundwater Monitoring (2007) 24
The 20% criterion is suggested as default criterion – depending on the particular situation in the GWB and on the monitoring network a different percentage may be selected or an alternative approach for determining the extent of exceedance used. An explanation and description of the applied methodology should be summarized in the RBMP.

Working Group C – Groundwater, Activity WGC-2, “Status Compliance & Trends” Guidance on Groundwater Status and Trend Assessment – Final Draft 2.0, 15 October 2008
29
Some statistical assessment methods claim pretensions to the monitoring network design (e.g. distribution of monitoring points) which need to be considered in advance and some aggregation methods (e.g. Kriging) already take regard of an uneven distribution of sites by weighting.
If preconditions on network design are not fulfilled across the whole groundwater body, the delineation of sub-groundwater bodies and/or weighting of individual monitoring points might help when performing the aggregation procedure.
In the case of delineated sub-groundwater bodies it is proposed to carry out the assessment for each sub-groundwater body accordingly and then aggregate the individual sub-groundwater body results to give a result for the whole groundwater body.
A weighting approach can help to take into account variability within the groundwater body that has been identified by the conceptual model (e.g. pressure, vulnerability, impact) as well as in the monitoring network design. The weighting approach should be in line with the principles of the classification method.
Figure 5: Proposed procedure for general assessment of the chemical status of the GWB as a whole.
What is the (weighted*) extent of exceedance of a GW-QS or TV in a GWB?
Further assessments verify GWB is of good status
GWB is not of good groundwater chemical
status for this test.
GWB is of good chemical status for
this test.**
≤ 20%
No Yes
Does the mean value at any monitoring point in the GWB
exceed a GW-QS or TV?
No
Yes
* A weighting approach can help taking regard of the conceptual model (e.g. pressure, vulnerability, impact situation) within the groundwater body as well as of the monitoring network design.
** Proceed according to Article 4(5) GWD
If necessary, split the group of GWBs, improve delineation
for component bodies concerned and treat as GWB.
> 20%
Yes

Working Group C – Groundwater, Activity WGC-2, “Status Compliance & Trends” Guidance on Groundwater Status and Trend Assessment – Final Draft 2.0, 15 October 2008
30
4.4.3 Test: Saline or other intrusion
This test considers the assessment of saline or other intrusions according to WFD Annex V 2.3.2.
The different types of intrusion that are considered in this assessment are illustrated in Figure 6 (Source: UKTAG). They include:
- Marine saline intrusion that is frequently observed in coastal aquifers particularly in the Mediterranean basin, and
- Saline intrusion from geological sources (resulting from the influence of connate water or from a leakage from salty layers such as evaporates) into the groundwater body.
Figure 6: Different types of intrusion
Based on the legal requirements, the assessment of saline or other intrusions considers the following elements:
- Criteria for assessing groundwater chemical status for this test (GW-QSs and TVs),
- Data aggregation,
- Extent of exceedances,
- Location of exceedance,
- Confidence in the assessment.
The test is further linked to the assessment of the groundwater quantitative status as well as to the assessment of sustained and significant upward trends (see Chapters 5 and 6).
The assessment of groundwater quantitative status should be undertaken before the chemical status test, which will have identified those areas where there is pressure due to pumping and hence a risk of saltwater or other intrusion.
Good groundwater status is not met if:
- a TV is exceeded by a mean value at a relevant monitoring point and
- there is either a significant and sustained upward trend in one or more key parameters at one or more relevant monitoring points or
- there is an existing significant impact on a point of abstraction as a consequence of an intrusion.
Working Group C – Groundwater, Activity WGC-2, “Status Compliance & Trends” Guidance on Groundwater Status and Trend Assessment – Final Draft 2.0, 15 October 2008
31
The relevant threshold values will be the background level for the key parameters e.g. Cl- and SO4
2- or
electrical conductivity.
Some groundwater bodies have naturally elevated levels of salinity due to the geochemistry of the aquifer or adjacent hydro-stratigraphic units acting as a source. For this test, due to the complex fluctuation of groundwater quality adjacent to the freshwater-saline interface, numerical threshold values would not be definitive on their own. A “lines of evidence” approach is proposed to confirm the presence of such an intrusion.
Regarding the intrusion of marine salt water into a groundwater body and the special water supply situation on islands it might be appropriate to differentiate between horizontal intrusion reflecting a regional problem and vertical intrusion which is more of local importance and of limited extent. The main basis for such a differentiation is the conceptual understanding of the groundwater body.
Proposed procedure:
- Step 1 (evidence):
- Identify areas where natural high saline concentrations occur (from marine or geological origin)
- Identify areas where there is pressure due to pumping and risk of saline or other intrusion (see chapter 5.3.4)
- Step 2 (aggregation and location):
- Identify relevant monitoring points which exceed relevant GW-QS and TVs by its mean values
- Consider the location of such exceedances together with the areas of pressures due to pumping and risk of saline or other intrusion (identified in the test for groundwater quantitative status - see chapter 5.3.4).
- Consider the conceptual model of the groundwater body. Horizontal intrusion is mainly causing a regional problem whereas vertical intrusion maybe representative of a localised point problem.
- Step 3 (trend): Calculate trends in key parameters e.g. Cl- and SO4
2- or electrical conductivity and
any other relevant substances indicating an expansion of intrusions (see chapter 6.3.4).
- Step 4 (impacts): Identify any significant impacts on points of abstraction as a consequence of an intrusion.

Working Group C – Groundwater, Activity WGC-2, “Status Compliance & Trends” Guidance on Groundwater Status and Trend Assessment – Final Draft 2.0, 15 October 2008
32
Figure 7: Proposed procedure for test of saline and other intrusion.
Is there evidence of pressure based on a
quantitative assessment?
Does the mean value at any relevant monitoring
point exceed a GW-QS or TV?
Is there a statistically significant upward trend in one or more relevant
monitoring points?
Is there an existing significant impact on a point of abstraction?
GWB is not of good chemical status for
this test.
GWB is of good chemical status for
this test.
AND/OR
Yes
No
No
No Yes
Yes
Consider the conceptual model (e.g. pressure, vulnerability, impact situation) of the groundwater body at each step within the assessment.

Working Group C – Groundwater, Activity WGC-2, “Status Compliance & Trends” Guidance on Groundwater Status and Trend Assessment – Final Draft 2.0, 15 October 2008
33
4.4.4 Test: Significant diminution of associated surface water chemistry and ecology due to transfer of pollutants from the groundwater body
This test considers the assessment of:
- significant diminution of surface water ecology, and
- significant diminution of surface water chemistry.
Based on the legal requirements, the assessment considers following elements:
- Criteria for assessing groundwater chemical status for this test (GW-QSs and TVs),
- Data aggregation,
- Location of exceedance,
- Confidence in the assessment.
The status is determined through a combination of surface water classification results and an assessment of chemical inputs (transfer of pollutants) from groundwater bodies into surface water bodies. The test is designed to determine whether the transfer of pollutants from groundwater to surface water or any consequent impact on surface water ecology is sufficient to threaten the WFD objectives for these associated surface water bodies.
The test should be performed for all groundwater bodies which are connected to surface water bodies at risk considering the conceptual model of each groundwater body.
Proposed procedure:
- Step 1 (surface water at risk): Is the surface water body failing to meet its environmental objectives (is less than good status) and is there contribution from the groundwater body?
- Step 2 (Data aggregation and location):
- Identify any exceedance of a relevant threshold value in the groundwater body by any of the mean concentrations calculated for each relevant monitoring point.
- Consider whether the location of any exceedance of any relevant threshold value is in an area where pollutants might be transferred to the surface water.
- Step 3 (pollutant transfer): Estimate the amount (and concentration) of pollutant being (or likely to be) transferred to the receptor (surface water) and the likely impacts. The overall pollutant loading in the surface water due to groundwater can be estimated from an understanding of groundwater-surface water dilution factors and attenuation rates. Where the pollutant loading from the groundwater is making a significant contribution (e.g. greater than 50% of the loading) to the surface water then the groundwater body is of poor status.

Working Group C – Groundwater, Activity WGC-2, “Status Compliance & Trends” Guidance on Groundwater Status and Trend Assessment – Final Draft 2.0, 15 October 2008
34
Figure 8: Proposed procedure for test of significant diminution of the ecological or chemical quality of an associated surface water body.
Is a surface water body less than good status and there is contribution from
the GWB?
Is the exceedance located in an area where pollutants might be transferred to the surface water
body?
Does the contribution from groundwater to the surface
water body exceed 50% of the pollutant load in the surface
water body?
GWB is not of good chemical status for
this test.
GWB is of good chemical status for
this test. *
Yes
No
No
No
Yes
Yes
Consider the conceptual understanding (e.g. pressure, vulnerability, impact situation) of the groundwater body at each step within the assessment.
* Proceed according to Article 4(5) GWD
Is any relevant monitoring point in the GWB exceeding a relevant TV by its
mean value for a parameter responsible for the risk of the
associated surface water body?
No
Yes
Working Group C – Groundwater, Activity WGC-2, “Status Compliance & Trends” Guidance on Groundwater Status and Trend Assessment – Final Draft 2.0, 15 October 2008
35
4.4.5 Test: Significant damage to groundwater dependent terrestrial ecosystems (GWDTE) due to transfer of pollutants from the groundwater body
This test considers the assessment of any significant damage to GWDTE (WFD Annex V 2.3.2)
Based on the legal requirements, the assessment considers following elements:
- Criteria for assessing groundwater chemical status for this test (GW-QSs and TVs),
- Data aggregation,
- Location of exceedance,
- Confidence in the assessment.
The test should determine whether pollutant concentrations in a groundwater body could lead to an impact on a GWDTE that is sufficient to threaten WFD or other relevant protected area objectives.
The test should be performed for all groundwater bodies which are connected to GWDTE that are significantly damaged (or at risk of damage) considering the conceptual model of each groundwater body during each stage of the assessment.
Proposed procedure:
- Step 1 (GWDTE damaged): Is there a damaged GWDTE (or a GWDTE at risk of damage) being directly dependent on the assessed groundwater body?
- Step 2 (Data aggregation and location):
- Identify any exceedance of any relevant threshold value in the groundwater body using the mean concentrations calculated at each relevant monitoring point.
- Identify the location of any exceedance of any relevant threshold value to determine whether it is in an area where pollutants might be transferred to the GWDTE.
- Step 3 (pollutant transfer): Estimate the amount (and concentration) of pollutant being (or likely to be) transferred to the receptor (GWDTE) and the likely impacts. The overall pollutant loading to the groundwater dependent terrestrial ecosystem from groundwater can be estimated from an understanding of groundwater-GWDTE dilution factors and attenuation rates.

Working Group C – Groundwater, Activity WGC-2, “Status Compliance & Trends” Guidance on Groundwater Status and Trend Assessment – Final Draft 2.0, 15 October 2008
36
Figure 9: Proposed procedure for test of significant damage of terrestrial ecosystems directly dependent on the groundwater body
Is a terrestrial ecosystem significantly damaged and interacting with the GWB?
Is the exceedance located in an area where pollutants might be
transferred to the GWDTE?
Is the pollution load transferred from the GWB and the resulting concentration causing harm to
the GWDTE?
GWB is not of good chemical status for
this test.
GWB is of good chemical status for
this test. *
Yes
No
No
No
Yes
Yes
Consider the conceptual understanding (e.g. pressure, vulnerability, impact situation) of the groundwater body at each step within the assessment.
* Proceed according to Article 4(5) GWD
Is any relevant monitoring point in the GWB exceeding a relevant TV by its
mean value for a parameter responsible for the damage of the
GWDTE?
No
Yes

Working Group C – Groundwater, Activity WGC-2, “Status Compliance & Trends” Guidance on Groundwater Status and Trend Assessment – Final Draft 2.0, 15 October 2008
37
4.4.6 Test: Meet the requirements of WFD Article 7(3) - Drinking Water Protected Areas
This test assesses deterioration in quality of waters for human consumption (GWD Article 4(2)(c) (iii)) and Annex III 4). This chapter should be read in conjunction with existing guidance in particular the Guidance Document on Groundwater Monitoring
25 and the Guidance Document on Groundwater in
Drinking Water Protected Areas (DWPAs)26
. According to the latter guidance, DWPAs are interpreted as whole groundwater bodies and specific protection measures can be focused on safeguard zones.
Under Article 7.3 of the WFD, Member States shall ensure the necessary protection for groundwater bodies identified as DWPAs “with the aim of avoiding deterioration in their quality in order to reduce the level of purification treatment required in the production of drinking water. […]”
The following aspects of the Guidance Document on Groundwater in Drinking Water Protected Areas26
seem most relevant for groundwater status assessment:
- It is recommended that for abstractions that are subject to the Drinking Water Directive (DWD)27
, monitoring of untreated water should be performed under the surveillance and operational monitoring principles (regarding frequency). Member States should ensure beforehand that monitoring is representative and sufficient for detecting significant and sustained changes in groundwater quality due to anthropogenic influences. Recommendations on e.g. the selection of monitoring points and on grouping of such points are expressed in the Guidance Document on Groundwater Monitoring
25.
- The assessment of the risk of deterioration should be conducted for all individual parameters monitored under the DWD. This includes chemical, radiological and microbiological parameters.
- Compliance points should be at, or close to where groundwater is abstracted and before any purification treatment has taken place.
- Benchmark data on existing groundwater quality are needed for those contaminants that could pose a risk of deterioration, against which deterioration (future trends) may be assessed. Where sufficient groundwater monitoring data are already available for defining baseline levels
28, it is
recommended that the starting point should be based on these data, otherwise the assessment should wait until sufficient data are available.
- For future abstractions baseline levels and levels of treatment need to be determined at the time when the proposed drinking water abstraction is being developed and initially tested.
- Closure of a drinking water source due to deterioration is considered as an indicator that the aims of Article 7(3) may not have been met, but only where there is deterioration in quality due to anthropogenic effects.
- A certain amount of blending to even out raw water quality within a well field may be acceptable, or unavoidable given the nature of the infrastructure used for abstraction. However, the mixing of water from different well fields could obscure significant and sustained changes in groundwater quality.
- Status assessment should focus on whether there have been significant and sustained changes (trend) in untreated groundwater quality at the abstraction point, as determined from monitoring programmes. If there are no such changes it is a reasonable assumption that no changes in treatment level are needed. If there are significant and sustained trends and treatment is already installed, in most cases any further deterioration will have implications through time for the level of treatment. Where drinking water standards are not yet exceeded and treatment is not yet installed, the potential future deterioration and its implications for treatment should be assessed.
- Only if there is evidence of significant changes in the untreated water quality that can be attributed to an anthropogenic impact should the impact on the level of treatment at the abstraction need to be assessed. In this way the collection and assessment of additional data can
25
Guidance Document No. 15 Groundwater Monitoring (2007) 26
Guidance Document No. 16 Groundwater in Drinking Water Protected Areas (2007) 27
Community Directive 98/83/EC 28
‘Baseline level’ means the average value measured at least during the reference years 2007 and 2008 on the basis of monitoring programmes implemented under Article 8 WFD or, in case of substances identified after these reference years, during the first period for which a representative period of monitoring data is available. [Article 2(6) GWD]
Working Group C – Groundwater, Activity WGC-2, “Status Compliance & Trends” Guidance on Groundwater Status and Trend Assessment – Final Draft 2.0, 15 October 2008
38
be minimised.
- In assessing changes in the “level” of purification treatment, knowledge of the treatment process would be required (this may include which parameters it was installed to treat, to what extent, and the use of consumable materials such as chemicals).
- It is difficult to give firm guidance on the issue of what constitutes a change in the level of treatment, but Member States are encouraged to take into account the following factors, on a case-by-case basis:
- The timescale over which the potential increased treatment is necessary – is it a temporary or long- term increase?
- What is the overall trend in the use of treatment at the site?
- Is new equipment required?
- Are any changes in equipment or chemicals aimed at increased or simply more efficient treatment? A change in treatment process may reflect changes in technology and not an increased level of treatment as such.
- If blending of different sources takes place, what is the purpose? Is this an indicator that there is a significant and sustained change in raw water quality within the DWPA?
- Information on the disruption to, closure and abandonment of existing drinking water supplies due to anthropogenic contamination should be collected so that such evidence can be used to provide a back up to the monitoring system, which despite best endeavours, may not always detect contamination incidents. These data may also be used to assess whether any necessary protection measures are being effective.
- It should be noted that changes in groundwater quality may be induced not only directly by the release of pollutants but also by the effects of abstraction. These effects should also be taken into account.
Within the assessment of chemical status, safeguard zones have no specific function. Safeguard zones which might be delineated by MS according to Article 7(3) WFD are intended to focus measures to ensure necessary protection with the aim of avoiding deterioration in the quality. Safeguard zones may also be helpful when grouping abstractions for the purpose of monitoring and assessment. In cases where several individual groundwater abstractions are part of a group of sources within a safeguard zone and the monitoring regime is consistent and representative, only a representative selection of abstractions may need to be monitored and assessed.
Proposed procedure:
In addition to the rather straightforward assessment of whether the requirements of the DWD are met, as it is laid down in Article 7(2), Article 7(3) requires closer examination and the elaboration of a test procedure.
The proposed procedure for assessing groundwater chemical status regarding Article 7(3) considers the legal requirements and the recommendations laid down in the relevant Guidance Documents and can be summarised as follows:
- The test refers to the relevant (DWPA) monitoring points recommended by the Guidance Document on Groundwater Monitoring
29:
- Step 1 (change in level of treatment): There should be no evidence of increased treatment due to a change in water quality (water quantity) which should include the consideration of changed blending and closure of sites.
- Step 2 (deterioration of water quality): The assessment of the deterioration of water quality focuses on raw water quality at the point of abstraction and before any treatment.
- Identify baseline level for each relevant contaminant (chemical, radiological and microbiological) posing a risk of deterioration
- Identify significant change (trend assessment considering baseline levels and annual arithmetic mean values - see chapter 6.3.4) which is attributed to an anthropogenic impact
- Assess the impact of such significant change on the level of treatment
29
Guidance Document No. 15 Groundwater Monitoring (2007)

Working Group C – Groundwater, Activity WGC-2, “Status Compliance & Trends” Guidance on Groundwater Status and Trend Assessment – Final Draft 2.0, 15 October 2008
39
Figure 10: Proposed procedure for meeting the requirements of WFD Article 7(3) – DWPAs.
Does the significant change cause an impact on the level of
treatment?
GWB is not of good chemical status for
this test.
GWB is of good chemical status for
this test.
Yes
The test refers to relevant monitoring points recommended by the Groundwater Monitoring Guidance
Yes
No
Is there a significant anthropogenically induced upward trend (considering baseline level
and annual arithmetic mean values) at contaminants posing a risk?
No
Is there evidence of increased treatment (incl. blending and
closure) due to a change in water quality?
Yes
No

Working Group C – Groundwater, Activity WGC-2, “Status Compliance & Trends” Guidance on Groundwater Status and Trend Assessment – Final Draft 2.0, 15 October 2008
40
5 QUANTITATIVE STATUS ASSESSMENT
5.1 Definition of Good Quantitative Status
The definition of good quantitative status is set out in WFD Annex V 2.1.2. As noted in this Annex, good groundwater quantitative status is achieved when:
”The level of groundwater in the groundwater body is such that the available groundwater resource is not exceeded by the long term annual average rate of abstraction.
Accordingly, the level of groundwater is not subject to anthropogenic alterations such as would result in:
– failure to achieve the environmental objectives specified under Article 4 for associated surface waters;
– any significant diminution in the status of such waters; and – any significant damage to terrestrial ecosystems which depend directly on the
groundwater body30
.
and alterations to flow direction resulting from level changes may occur temporarily, or continuously in a spatially limited area, but such reversals do not cause salt water or other intrusion, and do not indicate a sustained and clearly identified anthropogenically induced trend in flow direction likely to result in such intrusions.”
5.2 Elements of quantitative status assessment
For a GWB to be of good quantitative status each of the criteria (objectives) covered by the definition of good status (5.1) must be met. These objectives are:
- available groundwater resource is not exceeded by the long term annual average rate of abstraction;
- no significant diminution of surface water chemistry and/or ecology resulting from anthropogenic water level alteration or change in flow conditions that would lead to failure of relevant Article 4 objectives for any associated surface water bodies;
- no significant damage to groundwater dependent terrestrial ecosystems resulting from an anthropogenic water level alteration;
- no saline or other intrusions resulting from anthropogenically induced sustained changes in flow direction.
In order to test compliance with these objectives, a status classification system can be adopted that breaks down and tests against the different elements of the definition of good quantitative status.
An assessment of quantitative status is required for all groundwater bodies (or groups of bodies) (GWBs). However where there is a high degree of confidence that a GWB is currently not at risk of failing quantitative status objectives then it is reasonable to assume that the body is of good status. This is consistent with adopting a risk-based approach.
An assessment of pressures and impacts will already have been carried out as part of initial and further characterisation to identify bodies at risk of failing to achieve their environmental objectives. In this case, the pressures relating to quantitative status. The characterisation process will have involved collation of the information specified in Annex II (2) as necessary to support status assessment, e.g. locations of abstractions and artificial recharge, abstraction/discharge data, hydraulic properties, recharge rates etc.
The WFD indicates that groundwater level should be the principal parameter for assessing good quantitative status. However whilst the monitoring of water levels is essential to determine impacts and
30
A GWDTE will be significantly damaged when it is assessed that the site is failing to achieve any of its conservation objectives. For example where anthropogenic impacts on groundwater conditions, e.g. flow, level or quality result in the GWDTE not achieving ‘favourable condition’. The conservation objectives may relate to achievement of requirements under community legislation Directive 92/43/EEC or any other relevant Member States initiative.

Working Group C – Groundwater, Activity WGC-2, “Status Compliance & Trends” Guidance on Groundwater Status and Trend Assessment – Final Draft 2.0, 15 October 2008
41
identify long-term trends, it is insufficient on its own and other parameters and information will generally be needed. Further discussion on the use of groundwater level is provided in Annex 1. Other relevant parameters are noted in the Guidance Document on Groundwater Monitoring
31. This
combination of information, known as a weight of evidence approach, is to ensure a reliable assessment of status.
5.3 Procedure for assessing groundwater quantitative status
To determine the overall quantitative status for a GWB, a series of tests should be applied that considers the impacts of anthropogenically induced long-term alterations in groundwater level and/or flow. Each test will assess whether the GWB is meeting the relevant environmental objectives. Not all environmental objectives will apply to every GWB. Therefore only the relevant tests will need to be applied as necessary.
There is an overlap with chemical status assessment for certain elements of quantitative status assessment, in particular the assessment relating to saline intrusion. In this case the assessment for chemical and quantitative status for this element can be combined and a single test carried out. For others there will be a need to share information between the chemical and quantitative assessments.
5.3.1 Test: Water Balance (GWB scale)
For a GWB to be of good status for this test, long-term32
annual average abstraction from the GWB must not exceed long-term average recharge minus the long-term ecological flow needs. This test considers the cumulative effects across the body and is a body-wide test.
Where reliable information on groundwater levels across the GWB are available, these data can be used to identify the presence of a sustained long-term decline in water levels caused by long-term groundwater abstraction. Where such a decline is present it will indicate that the conditions for good status are not being met and the body will be of poor status. However, water levels may not on there own provide a reliable classification and so an alternative is to carry out a water balance assessment.
For the water balance test we must assess annual average abstraction against ‘available groundwater resource’ in the groundwater body. The available groundwater resource means the long-term annual average rate of overall recharge to the body of groundwater minus the long-term annual rate of flow required to achieve the ecological quality for associated surface waters (specified in Article 4), avoid any significant diminution on the ecological status and avoid any significant damage to groundwater dependent terrestrial ecosystems.
The available groundwater resource is an approximate value, based on recharge and the low flow requirements to support the ecology in surface water bodies and terrestrial ecosystems that are dependent on the groundwater body. It should be noted that because this test is a groundwater body-wide test it may not always be possible to clearly define the local flow needs of rivers and wetlands. Additionally the available groundwater resource for the GWB may not all be available for abstraction because hydrogeological conditions (e.g. transmissivity and storage) make it difficult to exploit economically and practically. Distribution of the ‘available resource’ across the GWB may also vary in relation to sensitive receptors. Therefore status assessment will need to take this into account and in many cases the poor status boundary will not simply be where abstraction > 100% available resource but could be much lower. In some hydrogeological situations it could be as low as 20%.
The annual average recharge should be estimated for the whole of the groundwater body including any recharge water deemed to enter the groundwater body from outside (e.g. run off from adjacent impermeable strata). Further information on recharge calculation can be found in guidance produced by the United Nations Food and Agriculture Organisation (FAO) (United Nations. 1998).
The annual average abstraction rate should include all abstractions from the groundwater body, including any connected confined sections of the aquifer. These abstractions may include evaporation
31
Guidance Document No. 15 Groundwater Monitoring (2007) 32
The consideration of ‘long-term’ measurements – abstraction, recharge, water level - is to minimise the influence of short-term natural climatic factors and abstraction impacts. Long-term measurement allows short-term effects to be differentiated from the long-term patterns and trends. For the purposes of the WFD the required length of record will depend on the hydrogeological and environmental conditions associated with the GWB. It is recommended that as a minimum it should be no less than 6 years (one river basin management cycle).

Working Group C – Groundwater, Activity WGC-2, “Status Compliance & Trends” Guidance on Groundwater Status and Trend Assessment – Final Draft 2.0, 15 October 2008
42
from large open bodies of water, e.g. gravel pits and artificial ground drainage systems. The decision on whether to discount abstracted groundwater that has been locally returned to the aquifer or to a river (for example, this may occur during irrigation or at a quarry dewatering operation) should be based on a hydrogeological assessment, which takes account of body-wide impacts.
Both the surface water and GWDTE ecological flow requirements, and the impacts of groundwater abstraction on low flows must be determined. The methods used can depend on the degree to which abstraction pressures affect the groundwater body. This may be by either use of local technical knowledge, simple tools or more sophisticated models.
Where there is flow (lateral or vertical) between adjacent GWBs and other hydrogeological systems this will need to be taken account of when carrying out the water balance test. In some cases these flows may be inflows (recharge) and other cases outflows. Alternatively GWBs can be grouped to simplify the water balance assessment.
The test is outlined in Figure 11. The estimates used in calculating the various elements of this test should be based on the best estimates available. In some hydrogeological environments, accurate figures will be difficult to obtain, e.g. in karst aquifers, and so there will be uncertainty associated with the assessments. It is important that uncertainty is recorded and considered in the assessment of confidence associated with the status reporting. In many cases this uncertainty and confidence in the assessment will not be quantifiable because they may relate to uncertainty in the understanding of the physical system, the conceptual model and other evidence used.
Where GWBs cover geographically large areas or comprise different aquifers then it may be appropriate to sub-divide the GWB into smaller representative parts to carry out this test. Each part should be relevant to the objectives for this test. Where GWBs are sub-divided the test should be applied separately to each individual part. The GWB overall status (for this test) will then be the least favourable of the individual component results, providing these results are significant.

Working Group C – Groundwater, Activity WGC-2, “Status Compliance & Trends” Guidance on Groundwater Status and Trend Assessment – Final Draft 2.0, 15 October 2008
43
Figure 11: Outline of procedure and data requirements for water balance test
GWB is of good quantitative status
for this test.
Do groundwater levels indicate a long-tem decline in water
levels due to abstraction such that available resource is
exceeded by long-term annual average abstraction?
GWB is not of good quantitative status for
this test.
Is AGR > LTAAQ?
Calculate/estimate long term recharge to groundwater (LTAAR)
Calculate/estimate annual abstraction from groundwater (LTAAQ)
Estimate the groundwater contribution (as annual average) to support rivers and ecosystems across GWB (EFN)
Calculate/ Available Groundwater Resource (AGR):
AGR = LTAAR - EFN
Yes No
No
Yes Use information from groundwater level monitoring network(s). Refer to CIS Guidance Document No. 15
Use information from initial and further characterisation and other information from local conceptual models, studies and numerical models and relevant and appropriate
Data preparation Data testing
LTAAQ … long-term annual average groundwater abstraction
LTAAR … long-term annual average groundwater recharge
EFN … long-term ecological flow needs
AGR … available groundwater resource

Working Group C – Groundwater, Activity WGC-2, “Status Compliance & Trends” Guidance on Groundwater Status and Trend Assessment – Final Draft 2.0, 15 October 2008
44
5.3.2 Test: Surface Water Flow
For a GWB to be of good status for this test, there should be no significant diminution of surface water chemistry or ecology that would lead to a failure of Article 4 surface water objectives (n.b. relating to surface water bodies). This test includes both river and open water bodies such as lakes to which WFD surface water objectives apply.
Unlike the previous test this test considers whether, at a local scale, the pressures from groundwater abstraction are having a significant effect on individual surface water bodies once all the different pressures on the surface water body(ies) are taken into account. Depending on the delineation of water bodies a GWB may contain many different surface water bodies each with there own objectives
This test requires that the flow requirement or water level requirement of surface water bodies (associated with GWBs) needed to support achievement (and maintenance) of good chemical and ecological status is determined. Note: for rivers impacts of groundwater abstraction may be seen as a reduction in flow and in open water bodies a reduction in level.
If this flow/level requirement is not being met as a result of a significant impact from groundwater abstraction, then the GWB will be of poor status unless the surface water body remains of good/high ecological status. Under any other circumstances the GWB will be of good status.
It is often not possible to accurately make precise measurements of the reduction in flow/level caused by groundwater pressures as there is often a time lag between the abstraction pressure occurring and the impacts on the surface water body due to the variability and response of hydrogeological systems. A failure to meet the required environmental flow/level requirements in any surface water body may also be due to either groundwater or surface water abstractions. The component of surface water failure due to groundwater will therefore need to be estimated. A suggested threshold for significance is where more than 50% of the allowable abstraction within the total upstream catchment can be attributed to groundwater. However the threshold used will be at Member State discretion and need to take into account uncertainty in the assessment process and the socio-economic importance of groundwater abstraction relative to surface water abstraction.
Figure 12: Outline of procedure for the surface water element of quantitative status assessment
Are GW abstraction impacts a significant
1 cause
of failure of the surface water body
Are any surface water bodies associated with the
GWB failing their WFD environmental flow
objectives?
Data preparation Data testing
GWB is not of good quantitative status
for this test.
GWB is of good quantitative status
for this test.
Associate each surface water body with a GWB and establish whether directly dependent.
Use results of surface water characterisation and classification to determine bodies potentially at less than good status due to groundwater abstraction pressures
1Test of significance: For example, if more than 50% (or other appropriate threshold taking into account the
uncertainty in the assessment process and the socio-economic importance of groundwater abstraction relative to surface water abstraction) of the allowable abstraction from the surface water body can be attributed to groundwater then it will be significant.
No
No Yes

Working Group C – Groundwater, Activity WGC-2, “Status Compliance & Trends” Guidance on Groundwater Status and Trend Assessment – Final Draft 2.0, 15 October 2008
45
5.3.3 Test: Groundwater Dependent Terrestrial Ecosystems (GWDTE)
For a GWB to be of good status there should be no significant damage to a terrestrial ecosystem that depends on groundwater. The GWDTE tests for both chemical status assessment and quantitative assessment are closely linked.
This test requires that the environmental condition required to support and maintain conditions within a GWDTE (e.g. flow or level needed to maintain dependent (plant) communities) are determined.
If the conditions are not being met and groundwater level and flow change due to abstraction is determined to be a significant cause, then the GWB is of poor status. In all other cases the GWB will be of good status but potentially at risk. The procedure for this test is outlined in Figure 13.
As part of initial and further characterisation, a screening exercise should have been carried out to identify all GWDTE that are damaged (or at high risk of damage) as a result of groundwater pressures. This assessment should have been made on the basis of criteria such as ecological indicator communities, likely connection to the GWB, proximity to anthropogenic pressures supported by local knowledge and site condition reports. Only sites identified as being currently ‘at risk’ will need to be considered in the status assessment, the presumption being that GWDTE ‘not at risk’ will not lead to a GWB being of poor status.
For many sites, it will not be possible to quantify supporting conditions required within the GWDTE with a high degree of confidence. This is because sufficiently detailed site-specific information may not be available for all sites. Under these circumstances the groundwater body will be of good status for this test and the results of initial risk screening and any other available evidence should be used to decide if sites are considered ‘at risk’. These ‘at risk’ sites should be prioritised for further investigation.
5.3.4 Test: Saline (or other) Intrusion
For a GWB to be of good status for this test there should be no long-term intrusion of saline (or other poor quality water) resulting from anthropogenically induced sustained water level or head change, reduction in flow or alteration of flow direction due to abstraction. Note: long-term saline intrusion may also occur even without an alteration in flow direction. Due to the density differences between saline water and freshwater, a reduction in water levels (or head) will on its own lead to saline intrusion. A decrease in hydraulic gradient towards the source of saline water and corresponding decline in groundwater flow all permit saline intrusion to occur before the decrease in water levels is sufficient to produce a change in flow direction.
Intrusion is interpreted in this test as intrusion of poor quality water from another water body into a groundwater body (Annex V 2.3.2) rather than movement of a plume of poor quality water within the body. The source of intrusion may be from a water body above, below or alongside the body for which status is being assessed.
This test is combined with the chemical status test for assessing saline intrusion and the test is described in more detail in chapter 4.4.3 and Figure 7.
When making the assessment, consideration should be given to the historical long-term impacts of abstraction particularly in confined aquifers and aquifers with low recharge rates
33. Historical pumping
may have resulted in significantly lowered groundwater levels or piezometric heads (e.g. by hundreds of meters) due to over abstraction but the abstraction has since been reduced to sustainable levels, in terms of a current balance with recharge rates. In these cases, although a water balance may indicate that the available resource is not exceeded continuing intrusion may be taking place and groundwater quality may continue to deteriorate. Where the intrusion is into the body, the saline intrusion test should be applied.
Where anthropogenically altered water levels are leading to geochemical changes within the GWB itself and these lead to deterioration of water quality within the body, then where these changes are significant and could potentially lead to an exceedance of a threshold value (or quality standard) or other relevant WFD objective they should be considered under the chemical status tests, see chapter 4.4.3. An example of this may be oxidation of groundwater or other geochemical change in a previously confined aquifer caused by over abstraction leading to the mobilisation/release of
33
In this context low recharge is used to refer to recharge in semi-arid areas. A definition of what constitutes a semi-arid area is one where the ratio of mean annual rainfall to potential evapotranspiration is <0.5 (UNESCO, 1979).

Working Group C – Groundwater, Activity WGC-2, “Status Compliance & Trends” Guidance on Groundwater Status and Trend Assessment – Final Draft 2.0, 15 October 2008
46
contaminants. The management of groundwater abstractions to maintain conditions that minimise the potential for status failure due to anthropogenically induced geochemical changes will form part of a Programme of Measures for that GWB. The definition of measures is outside the scope of this document but it could be anticipated that measures could include maintaining confined aquifers in a confined condition by establishing minimum water level criteria to avoid future deterioration in status.
Figure 13: Outline of procedure for the GWDTE element of quantitative status assessment
Associate each GWDTE with a GWB and establish whether directly dependant.
Determine the magnitude of the departure from required conditions within the GWDTE
Data preparation Data testing
Note:
If the proportion of failure due to anthropogenically impacted groundwater is significant, and a dependent community is not damaged, the groundwater body is deemed to be of good status for his test, but is at risk of failing the relevant good status requirements in the future.
Are the required environmental
supporting conditions relating to water level and flow being met?
Is the departure from the required environmental conditions the result of
groundwater abstraction?
GWB is not of good quantitative status
for this test.
GWB is of good quantitative status
for this test.
Are GWDTE within the GWB damaged, or at risk
of being damaged?
No Yes
Yes
No

Working Group C – Groundwater, Activity WGC-2, “Status Compliance & Trends” Guidance on Groundwater Status and Trend Assessment – Final Draft 2.0, 15 October 2008
47
6 TREND AND TREND REVERSAL ASSESSMENT
6.1 Definition of significant and sustained upward trends and trend reversal
The WFD and GWD require Member States to identify any significant and sustained upward trend in concentrations of pollutants, groups of pollutants or indicators of pollution found in groundwater bodies or groups of bodies identified as being at risk (WFD Annex V 2.4.4 and GWD Article 5). Member States are also required to reverse these trends: “Member States shall implement the measures necessary to reverse any significant and sustained upward trend in the concentration of any pollutant resulting from the impact of human activity in order progressively to reduce pollution of groundwater. (WFD Article 4(1)(b)(iii)). The measures should aim to progressively reduce pollution and prevent further deterioration of groundwater (Article 5(2) GWD).
A significant and sustained upward trend is: “any statistically and environmentally significant increase of concentration of a pollutant, group of pollutants, or indicator of pollution in groundwater for which trend reversal is identified as being necessary in accordance with Article 5” (GWD Article 2(3));
A statistically significant trend is one that has been identified using a recognised statistical trend assessment technique.
An environmentally significant trend is one that is statistically significant and would lead to the failure of one or more of the WFD’s environmental objectives if not reversed.
6.2 Elements of trend and trend reversal assessment
Trend assessment only needs to be carried out in groundwater bodies at risk of not meeting WFD Article 4 objectives in relation to each of the pollutants which contribute to the groundwater body being so characterised (Annex IV GWD). This includes not only those bodies identified in 2004 to meet Article 5 of the WFD but also any groundwater bodies identified as being at risk as a result of any updated risk assessment and/or new results from surveillance monitoring.
It may also be necessary to undertake trend assessment on groundwater bodies not currently at risk in order to distinguish long term trends both as a result of changes in natural conditions and through anthropogenic activity (Annex V 2.4.2 WFD).
Member States must identify the starting point for trend reversal such that trends can be reversed in time to avoid a (future) failure of relevant environmental objectives (Article 5(3) & Annex IV(B) GWD). This starting point must be defined as a percentage of the level (or concentration) of the relevant groundwater quality standard or threshold value, and reported in the river basin management plan.
Member States must identify in the river basin management plans those GWBs that have significant and sustained upward trends and, as appropriate, those where trends have been reversed. In addition the plan has to include a summary of the way in which the results from individual monitoring points have been used to identify these trends (Art 5(4) GWD).
Member States may also consider undertaking additional trend assessments in order to verify that plumes from contaminated sites do not threaten the achievement of the objectives of Article 4 WFD, in particular, do not expand, do not deteriorate the chemical status of the body or group of bodies of groundwater, and do not present a risk for human health and the environment (Article 5(5) GWD).
Within the assessment of significant and sustained upward trends and the assessment of trend reversal the following elements need to be considered (see also Figure 14):
- What is a correct statistical method for assessing trends at each monitoring point (such as regression analysis);
- How to deal with monitoring values which are below the Limit of Quantification;
- What length of time series is appropriate;
- How to consider baseline levels for substances which occur both naturally and anthropogenically;
- What is an acceptable level of confidence in the trend assessment;
- How to establish a starting point for trend reversal;
- How to statistically demonstrate the trend has been reversed stating the level of confidence in the identification.

Working Group C – Groundwater, Activity WGC-2, “Status Compliance & Trends” Guidance on Groundwater Status and Trend Assessment – Final Draft 2.0, 15 October 2008
48
According to the mandate of the drafting group, the guidance on trend assessment and trend reversal assessment considers the Technical Report N°1 on ‘Groundwater Statistics’
34. Development of new
methodologies and experience gained in Members States should also be considered as well.
2007 2008 2009 2010 2011 2012 2013 2014 2015 Time (years)
Groundwater Quality Standard (GW-QS) or Threshold Value (TV)
Baseline Level
base year
Concentration
Natural Background Level
75 %
100 %
Starting point for ternd reversal as % of GW-QS or TV (depending on trend and associated risk)
Figure 14: Elements of trend and trend reversal assessment
6.2.1 Parameters subject to trend assessment
The WFD (Annex V 2.4.4) and GWD (Article 5(1)) state that significant and sustained upward trends shall be identified in concentrations of pollutants, groups of pollutants or indicators of pollution found in groundwater bodies or groups of groundwater bodies at risk. Unlike for chemical status assessment, neither directive explicitly states which parameters shall be subject to this assessment.
The starting point for trend reversal must be established in relation to GW-QS set out in Annex I GWD and/or the TVs established under Article 3 for parameters which pose a risk to the groundwater body. It is therefore considered that trend assessment and reversal should be undertaken for parameters that are posing a risk to the groundwater body
Trend assessment may also be undertaken for any other parameters (natural) which may occur as a result of human activity across the groundwater body, if Member States consider that there is potential for future environmentally significant trend(s) to develop. This information can be used to support the characterisation/risk assessment process and provide an early warning of potential future problems both in groundwater bodies currently at risk and not at risk.
Trend assessment for assessing whether plumes do not expand is very case specific and should focus on those relevant parameters which are able to contribute most appropriately and efficiently to such an assessment.
Where trend assessment is carried out as part of status assessment this should focus on the pollutants (or pollutant indicators) associated with the respective status tests.
6.2.2 Network design and monitoring
According to Annex IV A 2(a) GWD the monitoring design (selection of monitoring frequencies and monitoring locations) should:
- ensure that upward trends can be distinguished from natural variation with an adequate level of confidence and precision;
34
Technical Report No. 1: Statistical aspects of the identification of groundwater pollution trends and aggregation of monitoring results – WG 2.8 Statistics (2001)

Working Group C – Groundwater, Activity WGC-2, “Status Compliance & Trends” Guidance on Groundwater Status and Trend Assessment – Final Draft 2.0, 15 October 2008
49
� identify upward trends in sufficient time to allow measures to be implemented;
- take into account the physical and chemical temporal characteristics including groundwater flow conditions and recharge rates and percolation time through soil or subsoil.
Annex IV A 2(b) of the GWD also requires that “the methods of monitoring and analysis used will conform to international quality control principles, including, if relevant, CEN or national standardised methods, to ensure equivalent scientific quality and comparability of data provided”.
6.2.3 Monitoring data subject to trend assessment
Trend and trend reversal assessment should be based on surveillance and operational monitoring data from individual monitoring sites. The first identification of trends should be carried out by 2009 where possible, taking into account any data that were collected prior to the current river basin planning cycle in order to enable reliable trend assessment and reporting on trends within the first RBMP (Annex IV A(2)(a)(ii) & Annex IV A(3)).
Where available, Member States are free to include additional representative monitoring data in the assessment where they can contribute to an improved confidence in the assessment. However, the data must be directly comparable to WFD monitoring data (e.g. with regard to analytical methods, sampling and quality assurance).
6.2.4 Consideration of baseline level of concentrations
For substances that occur both naturally and as a result of human activity the identification of trends should also take into account baseline levels (Annex IV A(3), GWD).
“‘Baseline level’ means the average value measured at least during the reference years 2007 and 2008 on the basis of monitoring programmes implemented under Article 8 of Directive 2000/60/EC or, in the case of substances identified after these reference years, during the first period for which a representative period of monitoring data is available” (GWD Article 2(6)).
The baseline provides a reference point against which future changes (trends) in pollutant concentrations can be assessed. Member States may use any other representative data
35 prior to the
implementation of the Article 8 WFD monitoring programmes if data are available. Attention: The baseline level should not to be confused with the (natural) background level.
The base year according to Annex V 2.4.4 WFD corresponds to the year when the baseline levels were measured. Attention: The base year of trend assessment should not to be confused with the starting point for trend reversal!
6.2.5 Length of time series considered
The length of time series that should be considered in trend assessment depends on how the groundwater body reacts to changes in practices at the land surface (conceptual understanding), on the power of the trend test method in detecting trends and on the quality of the data (see treatment of data below LOQ, chapter 2.4). Poor quality data and high LOQs in the past, as well as a time series that is too long might have a strong and long lasting influence (leverage) on the results of trend assessment, even though the recent (mid-term) data might be of good quality.
In order to avoid bias in the overall assessment (e.g. at groundwater body level or at regional level) a consistent length of time series of monitoring data at the monitoring point level is preferable. The minimum length of time series to be used, in terms of the number of regularised measurements and the minimum number of considered years, depends on the monitoring frequency, the statistical method, the starting point for trend reversal and on the power of the method. The maximum length of time series to be used depends on the conceptual model of the groundwater body, the temporal development of concentrations and the changing quality of monitored data. A time series that is too long might produce trend results which are biased by changes in the earlier years of the time series. It could therefore be helpful to test a long time series to see if there are significant breaks in trend. If this is the case, investigate using only the recent data providing it is of sufficient length for testing trends. However, care should always be taken to ensure that the length of the time series used is still consistent with the conceptual model of the groundwater body (e.g. rates, residence times, etc.). As a
35
See relevant guidance on sampling, monitoring QA/QC for a full description of how to ensure that data has been generated using reproducible methods and is representative of the groundwater body.

Working Group C – Groundwater, Activity WGC-2, “Status Compliance & Trends” Guidance on Groundwater Status and Trend Assessment – Final Draft 2.0, 15 October 2008
50
general rule, data should never be disregarded unless proven to be incorrect due to sampling or analytical error.
6.2.6 Methodology for trend assessment
The assessment must be based on a recognised statistical method such as regression analysis (Annex IV A(2)(c)). Since “significant” relates to statistical significance (as well as environmental), the method chosen should also be able to test the statistical significance of a measured trend.
When defining starting points for trend reversal, the length of time between the starting point and the point of exceedance of a GW-QS or TV should be sufficient for the trend assessment methodology to be able to detect a significant trend, i.e. there is time to detect that a trend is environmentally significant and take action to reverse the trend. The ability of a trend method to detect a given increase in concentrations of pollutants with a certain probability is called “power” of a trend test method
36.
In order to distinguish between natural variation and trends with an adequate level of confidence and precision the trend test methodology should also be able to perform a test on seasonality where appropriate, e.g. where significant concentration variations occur within a year.
6.2.7 Confidence in the assessment
The level of confidence associated with any identified trend or trend reversal is to be demonstrated and recorded (Annex V 2.4.4 WFD and Annex IV B(3) GWD).
It is recommended that for a trend to be statistically significant there should be as a rule 95% confidence in the assessment.
6.2.8 Starting point for trend reversal
Article 5(3) of the GWD requires Members States to define starting points for implementing measures to reverse trends and Annex IV, Part B GWD specifies the criteria for establishing such starting points. The starting point needs to take into account the environmental risk(s) associated with the GWB, environmental objectives and the groundwater quality standard (GW-QS) and/or threshold values (TVs) established for the body. The starting point shall be a percentage of the GW-QS or TVs.
By default, the starting point shall be when the concentration of the pollutant reaches 75 % of the relevant GW-QS or TV, unless:
(a) an earlier starting point is required to enable trend reversal measures to prevent most cost-effectively, or at least mitigate as far as possible, any environmentally significant detrimental changes in groundwater quality;
(b) a different starting point is justified where the limit of quantification does not allow for establishing the presence of a trend at 75 % of the parametric values; or
(c) the rate of increase and the reversibility of the trend are such that a later starting point for trend reversal measures would still enable such measures to prevent most cost-effectively, or at least mitigate as far as possible, any environmentally significant detrimental changes in groundwater quality. Such later starting point may not lead to any delay in achieving the deadline for the environmental objectives.
A different starting point may also be justified where natural background concentrations and threshold values are very close together or the same (Case 2 in chapter 4.3.3 and Fehler! Verweisquelle konnte nicht gefunden werden.).
The starting point for implementing measures to reverse trends depends mainly on the characteristics of the groundwater body (as defined by the conceptual model) and its ability to respond to those measures. The starting point chosen should enable Member States to reverse such trends most cost-effectively before the concentrations of pollutants cause environmentally significant detrimental changes in groundwater quality. In groundwater bodies which react very slowly to changes, an earlier starting point might be needed; for fast responding groundwater bodies a later starting point might be justified.
Once a starting point has been established for a trend, it should not be changed during the six-year cycle of the river basin management plan (GWD Annex V B 2).
36
Technical Report No. 1: Statistical aspects of the identification of groundwater pollution trends and aggregation of monitoring results – WG 2.8 Statistics (2001)

Working Group C – Groundwater, Activity WGC-2, “Status Compliance & Trends” Guidance on Groundwater Status and Trend Assessment – Final Draft 2.0, 15 October 2008
51
6.2.9 Methodology for trend reversal assessment
As required by the GWD (Annex IV B(3)) trend reversal needs to be demonstrated.
In the Technical Report No. 137
a methodology for assessing trend reversal is described. It is based on a regression analysis, where each time series is analysed for whether there is a break in the trend. This is where an identified sustained and significant upward trend is followed by a significant downward trend.
6.2.10 Schedule of trend and trend reversal assessment
The first identification of trends should be carried out by 2009, if possible, and then at least every six years thereafter (Annex IV A(2)(ii) GWD), taking into account surveillance and operational monitoring data and monitoring data that were collected before the start of the monitoring programme. This will enable reporting on trends within the first RBMP (Annex IV A(2)(a)(ii) & Annex IV A(3)).
As a draft of the RBMP is subject to public participation one year before being operational, it is recommended that if possible, Member States assess the trend and trend reversal prior to the presentation of the draft RBMP.
6.3 Tests for assessing trend and trend reversal
To implement the requirements of the WFD and GWD trend assessment is needed:
• to identify whether a groundwater body at risk is subject to a significant and sustained upward trend that needs to be reversed in accordance with Article 5(1) and 5(2); such trends fall into two broad categories (see Table 2):
- ‘Harm to actual or potential legitimate uses of the water environment’
- ‘Harm to aquatic ecosystems’ and ‘Harm to terrestrial ecosystems’
• as part of chemical status assessment (assessing saline intrusion and drinking water protected area objectives) (see Table 4);
• to assess, where relevant, the impact of plumes from point sources and contaminated sites that may compromise WFD/GWD objectives (Article 5(5) GWD) (see Table 4).
Trend reversal assessment is required if a groundwater body is subject to a significant and sustained upward trend that needed to be reversed in accordance with Article 5(1) and 5(2).
Table 3: Trend assessment (Article 5(1) & 5(2) GWD) - Summary of elements and corresponding tests
Trend assessment (Article 5(1) & 5(2) GWD) Test
Tre
nd
a
ss
ess
me
nt
Tre
nd
re
ve
rsa
l a
ss
esm
en
t
Sta
tem
en
t o
f t
ren
d a
t G
WB
le
ve
l
Re
lev
an
t m
on
ito
rin
g
po
ints
Identify and reverse trends that present a significant risk of harm to actual or potential legitimate uses of the water environment
No harm to legitimate uses. � � � �
Identify and reverse trends that present a significant risk of harm to the quality of aquatic ecosystems
No harm to aquatic ecosystems.
� � � �
Identify and reverse trends that present a significant risk of harm to terrestrial ecosystems
No harm to terrestrial ecosystems.
� � � �
37
Technical Report No. 1: Statistical aspects of the identification of groundwater pollution trends and aggregation of monitoring results – WG 2.8 Statistics (2001)

Working Group C – Groundwater, Activity WGC-2, “Status Compliance & Trends” Guidance on Groundwater Status and Trend Assessment – Final Draft 2.0, 15 October 2008
52
Table 4: Further trend assessment - Summary of elements and corresponding tests
Further Trend Assessment Test
Tre
nd
a
ss
ess
me
nt
Tre
nd
re
ve
rsa
l a
ss
esm
en
t
Sta
tem
en
t o
f t
ren
d a
t G
WB
le
ve
l
Re
lev
an
t m
on
ito
rin
g
po
ints
Plume assessment (Article 5(5) GWD)
Trend assessments may be considered in order to verify that plumes from contaminated sites do not expand, do not deteriorate the chemical status of the body or group of bodies of groundwater, and do not present a risk for human health and the environment (GWD Article 5(5)).
No expansion of plumes deteriorating chemical status and presenting risk to human health and environment.
� �
Status assessment
No entry into GWB of connate or sea water or water from substantially different chemical composition from other groundwater bodies or surface waters which is liable to cause pollution (WFD Annex V 2.3.2).
No saline or other intrusions.
� �
No deterioration in quality of waters for human consumption (GWD Article 4(2)(c) (iii)) and Annex III 4)
Meet the require-ments of WFD Article 7(3) - Drinking Water Protected Areas.
� �
6.3.1 Identifying environmentally significant trends and scale of assessment (Article 5(1) GWD)
Article 5(1) of the GWD requires Member States to identify whether the groundwater body is subject to an environmentally significant and sustained anthropogenically induced upward trend.
As the trend assessment is based on data from individual surveillance or operational monitoring points, a procedure (criteria) is needed to combine the results of the individual trend and trend reversal assessments at sampling points in order to assess the trend at the groundwater body level (Article 5(4)(a) GWD).
To determine whether a trend is environmentally significant the same principles used when assessing chemical status can be applied. This means that the trend assessment should be applied at whatever scale is needed to test for significance i.e. trend assessment may need to be carried out at individual monitoring points, groups of monitoring points or by aggregating results across the whole body. For example when considering the environmental significance of the widespread environmental risk from pollutants (e.g. due to diffuse sources of pollution) the trend data across the body should be aggregated as all monitoring points could be considered relevant. In the case where the risk is to a specific groundwater dependent ecosystem (either aquatic or terrestrial), then trends at individual, or groups of, monitoring points may be what is significant in terms of the groundwater body not achieving its environmental objectives.

Working Group C – Groundwater, Activity WGC-2, “Status Compliance & Trends” Guidance on Groundwater Status and Trend Assessment – Final Draft 2.0, 15 October 2008
53
6.3.2 Test: ‘Harm to actual or potential legitimate uses of the water environment’ (GWD Article 5(1) and 5(2))
This test identifies those trends of environmental significance caused by widespread impact or environmental risk from pollutants (e.g. due to diffuse sources of pollution across the groundwater body). In order to undertake the assessment, trend data across the groundwater body should be aggregated, and therefore all monitoring points could be considered relevant. If the overall trend assessment at body level detects a sustained upward trend, detailed trend assessments at monitoring point level could help focus measures in order to reverse such trends most efficiently.
The assessment of more local impacts (e.g. regional diffuse sources of pollution or point sources of pollution) requires grouping of the monitoring points in the groundwater body according to the conceptual model (e.g. according to relevant pressures, aquifer vulnerability etc). Only the relevant “groups” of monitoring points should be used.
Figure 15: Selection of all monitoring points as being considered relevant regarding the test on harm to legitimate uses. Optional grouping of monitoring points according to the conceptual model.
Monitoring points groups of monitoring points

Working Group C – Groundwater, Activity WGC-2, “Status Compliance & Trends” Guidance on Groundwater Status and Trend Assessment – Final Draft 2.0, 15 October 2008
54
6.3.3 Test: ‘Harm to aquatic ecosystems’ and ‘Harm to terrestrial ecosystems’ (GWD Article 5(1) and 5(2))
The test on harm to aquatic and terrestrial ecosystems is comparable to the above mentioned assessment regarding more local impacts. It is similar to the status assessment which uses only relevant monitoring points in the groundwater body (e.g. monitoring points in areas where pollutants might be transferred to the surface water body / dependent terrestrial ecosystem). In the case of aquatic and terrestrial ecosystems, only one individual relevant monitoring point could be sufficient to indicate that the GWB has a significant trend if that one relevant monitoring point indicates a trend.
Figure 16: Selection of monitoring points considered relevant regarding the test on harm to aquatic and terrestrial ecosystems.
Relevant monitoring points
Surface water
body

Working Group C – Groundwater, Activity WGC-2, “Status Compliance & Trends” Guidance on Groundwater Status and Trend Assessment – Final Draft 2.0, 15 October 2008
55
6.3.4 Trend assessment to support status assessment
Trend assessment is an integral part of the status test for saline and other intrusions (see chapter 4.4.3) and the test of no deterioration of water intended for human consumption (meeting requirements of Article 7(3) WFD – see chapter 4.4.6) (Table 4). Trend assessment in these cases is applied at the monitoring points which are appropriate for the relevant status assessment procedures
6.3.5 Trend assessment to support plume characterisation
Trend assessment may be needed to assess whether plumes from contaminated sites do not expand (Article 5(5) GWD) (Table 4). The term expand is taken to mean plumes where the overall mass of contaminants within the plume is increasing, i.e. there is an ongoing source term. The assessment should focus on relevant plumes which could present a risk to human health and the environment or deteriorate the chemical status of groundwater bodies. Where appropriate and required trend assessment should be applied at potentially affected monitoring points. This could include monitoring points that are not part of the surveillance or operational monitoring network. The assessment should focus on the relevant parameters within the plume.
Figure 17: Monitoring network for assessing whether plumes do not expand
• Background (A)
• Source (B)
• Plume (C-G)
• Migration (H-J)
J
I
H G F E D C B
A
Monitoring point
Design considers
• Receptor location
• Travel times
• Stratigraphy & hydrogeology
• No minimum number of monitoring points
H G F E D C B A

Working Group C – Groundwater, Activity WGC-2, “Status Compliance & Trends” Guidance on Groundwater Status and Trend Assessment – Final Draft 2.0, 15 October 2008
56
7 REFERENCES
Edmunds et Shand (2003) – Natural baseline quality in European aquifers: a basis for aquifer management. BaSeLiNe project, http://www.bgs.ac.uk/hydrogeology/baseline/europe/home.html
European Parliament and Council Directive 2000/60/EC of 23 October 2000 establishing a framework for Community action in the field of water policy, OJ L 327, 22.12.2000, pp1-72.
European Parliament and Council Directive 2006/118/EC of 12 December 2006 on the protection of groundwater against pollution and deterioration, OJ L372, 27.12.2006, pp19-31.
European Parliament and Council Directive on environmental quality standards in the field of water policy and amending Directive 2000/60/CE, proposal presented by the Commission, COM(2006) 398 final, SEC(2006) 947, 17
th July 2006.
European Parliament and Council Directive 98/83/EC of 3 November 1998 on the quality of water intended for human consumption, OJ L 330, 5.12.1998, pp32-54.
European Commission (2008) – Draft Commission Directive of [Day Month 2008] laying down, pursuant to Directive 2000/60/EC of the European Parliament and of the Council, technical specifications for chemical analysis and monitoring of water status. 10575/08 ENV 365.
European Commission (2007) – Guidance on Preventing or Limiting Direct and Indirect Inputs in the context of the Groundwater Directive 2006/118/EC, Guidance Document No 17. Technical Report - 2007 - 012. ISBN 978-92-79-06277-3. European Communities, Luxembourg.
European Commission (2007) – Guidance on Groundwater in Drinking Water Protected Areas, Guidance Document No 16. Technical Report - 2007 - 010. ISBN 978-92-79-06201-8. European Communities, Luxembourg.
European Commission (2007) – Guidance on Groundwater Monitoring, Guidance Document No 15. Technical Report - 002 - 2007. ISBN 92-79-04558-X. European Communities, Luxembourg.
European Commission (2006) – Mandate of the Working Group on Groundwater. Common Implementation Strategy for the Water Framework Directive. “Work Programme 2007/2009”.
European Commission (2003) – The Role of Wetlands in the Water Framework Directive, Guidance Document No 12. ISBN 92-894-6967-6. European Communities, Luxembourg.
European Commission (2003) – Guidance on Monitoring under the Water Framework Directive – Working Group 2.7 Monitoring. Guidance Document No 7. ISBN 92-894-5127-0. European Communities, Luxembourg.
European Commission (2003) – Guidance on Analysis of Impacts and Pressures – Working Group 2.1 IMPRESS. Guidance Document No 3. ISBN 92-894-5123-8. European Communities, Luxembourg.
European Commission (2003) – Identification of Water Bodies. Guidance Document No 2. ISBN 92-894-5122-X. European Communities, Luxembourg.
European Commission (2001) – Statistical aspects of the identification of groundwater pollution trends and aggregation of monitoring results – Working Group 2.8 Statistics. Technical Report No. 1. ISBN 92-894-5639-6. European Communities, Luxembourg.
European Commission (2007) – Draft Commission Decision adopting technical specifications for chemical monitoring. ENV-COM010307-7. Brussels, 23 February 2007.
Müller D., Blum A., Hart A., Hookey J., Kunkel R., Scheidleder A., Tomlin C., Wendland F. (2006) – Final proposal for a methodology to set up groundwater threshold values in Europe, Deliverable D18, BRIDGE project, 63 p, www.wfd-bridge.net.
Pauwels et al. (2006) – Impact of hydrogeological conditions on pollutant behaviour in groundwater and related ecosystems, Deliverable D10, BRIDGE project, www.wfd-bridge.net.
UNESCO (1979) – Map of the World distribution of arid regions. Man and Biosphere Technical Note - No. 7. UNESCO, Paris.
United Nations (1998) – Crop Evapotranspiration (Guidelines for computing crop water requirements). Food and Agriculture Organisation (FAO) of the United Nations Irrigation and Dranage Paper 56. ISBN 92-5-104219-5.

Working Group C – Groundwater, Activity WGC-2, “Status Compliance & Trends” Guidance on Groundwater Status and Trend Assessment – Final Draft 2.0, 15 October 2008
57
8 ANNEX 1: PRINCIPLES OF APPLYING DILUTION AND ATTENUATION FACTORS
Criteria values are ultimately meant to protect receptors, such as surface water ecosystems, groundwater dependent terrestrial ecosystems and human uses. The greatest protection would be achieved by defining criteria values at the level of the environmental quality standard for the receptor or a relevant use standard, and require compliance at every point between the recharge zone and the discharge zone in the groundwater systems. However, it might not always be necessary to set criteria values so strictly, because of the diluting and attenuating processes that occur between the recharge zone and the receptor. Whether the receptor is a surface water stream, a spring or a pumping well, the receiving water is always a mixture of water with different residence times and contribution of pollutants. Criteria values can be set recognizing these different contributions from shallow and deeper water, choosing a value which sufficiently prevents the spring water from exceeding the EQS for surface water or the terrestrial ecosystems in the long term.
While taking into account dilution and attenuation in deriving criteria values, it is important to consider the position of the monitoring points in the flow scheme and the transport times towards the receptor, both in horizontal and vertical directions. Here, the vertical distance is especially important because the groundwater generally gets older with depth and young shallow groundwater mixes with old groundwater when entering the stream or the abstraction wells. Given the differences in aquifer typologies among Member States, different monitoring types can be distinguished, including the use of pumping wells, specific monitoring wells, springs and multi-level observation wells. These monitoring types may have a different position in the groundwater flow system and have different residence time distributions. Application of dilution and attenuation factors is especially sensible for monitoring at shallow depths at short residence times from the recharge zone. In order to achieve an adequate level of protection, the dilution and attenuation factors should be tuned to the naturally occurring mixing of waters with short and long residence times at the receptor.
8.1 Dilution
Dilution typically includes (see Figure 18 A):
- The spatial extent of areas where pollutants are introduced in the system relative to the whole contributing area of the stream;
- The residence time distribution of the groundwater feeding the stream, which is determined by the 3D flow field
- The amount of groundwater feeding the stream relative to other sources of water including surface runoff and surface water supply from upstream areas outside the groundwater body.
In Figure 18 A about 10 % of the contributing area is polluted by a diffuse source, for example pesticides on farm lands. Farmlands close to the stream have short flow paths to the stream and contribute to the pollution of the river. Unpolluted water enters the stream from other areas, including farmlands which have too long flow paths and travel times to contribute already. The overall dilution factor can be calculated by considering the residence time distribution of the farmlands and the residence time distribution of the other unpolluted areas. It is recommended to consider the long term time-averaged inputs when defining dilution factors, considering the effects of crop rotations and future land use changes.
8.2 Attenuation
Reactive processes like sorption and transformation may further reduce the pollution threat of the receptors and might be used in deriving criteria values. Figure 18 B illustrates the effect of attenuation, which means that pollutants are transformed or slowed down relative to groundwater transport itself. In the methodology described further, attenuation factors may be used. As required by the GWD (Annex II.2), these factors include the “dispersion tendency” of the pollutants as well as their “persistence and bioaccumulation potential”.

Working Group C – Groundwater, Activity WGC-2, “Status Compliance & Trends” Guidance on Groundwater Status and Trend Assessment – Final Draft 2.0, 15 October 2008
58
Figure 18: Illustration of factors that determine how dilution and attenuation could affect criteria’s values derivation. A: only dilution, B: dilution and attenuation. The conceptual model is preferably based on a 3D understanding of the groundwater system and considers the mixing of uncontaminated and contaminated water discharging at the receptor.
Dilution and attenuation factors can be applied for monitoring at shallow depth close to the recharge zone and should be tuned to monitoring depths in order to achieve sufficient protection. For the example of Figure 18 A and monitoring at shallow depth in the recharge zones, a dilution factor of 0.1 still seems to protect surface water quality sufficiently because approximately 10 % of the land surface in the groundwater body contributes to contamination of the stream. The relevant criteria value was defined as: CV = EQS*AF/DF. This means that groundwater CV = EQSsurface water *(1/0.1) or this specific situation. Including attenuation as well, estimating an attenuation factor of 3 for the illustrated example, CV might be as high as EQS*3/0.1 and still be sufficient to protect this surface water receptor.
Attenuation and dilution factors may also be applied for usage criteria, prohibited that the monitoring points where compliance against the threshold value is to be assessed are at large transport times from the abstraction point. Here, attenuation and dilution factors can be used to tackle the effects of mixing which naturally occurs when water is pumped from an aquifer and both shallow and deep flow paths contribute to the water quality measured at or close to the abstraction well. This mixing process is conceptually very similar to the mixing which occurs in a stream when short and long flow path converge at the groundwater-surface water interface. Whether it is appropriate to use dilution and attenuation factors for usage criteria is to be decided by the member states themselves.

Working Group C – Groundwater, Activity WGC-2, “Status Compliance & Trends” Guidance on Groundwater Status and Trend Assessment – Final Draft 2.0, 15 October 2008
59
9 ANNEX 2: THE USE OF GROUNDWATER LEVEL MONITORING IN STATUS ASSESSMENT
The Quantitative Status Definition in the WFD is framed in terms of the relationship of a range of factors to groundwater level. The use of groundwater level alone does not lead to reliable classification. Groundwater flows are equally important but these cannot be measured directly, but only estimated on the basis of hydrological and meteorological measurements. We consider that groundwater levels alone should not be determinative of quantitative status. This annex suggests how they might be used in practice. The additional parameters required for assessing quantitative status are discussed in the WFD monitoring guidance (European Union, 2007).
Water balance element: If groundwater levels are falling in a sustained long-term manner, this will confirm that more water is being abstracted than is recharged during the period of the record, thereby indicating poor status from this element. However, long-term, sustained water levels do not necessarily indicate good status, since the water required to maintain this constant level could be drawn from surface water, potentially causing ecological damage.
Surface Water Element: If there is 100% surface water / groundwater connection, the rivers tend to locally anchor the groundwater level to the river level so that variation is minimal. In these circumstances groundwater level is not useful in indicating surface water / groundwater interaction. If there is no surface water / groundwater connection, the level in the aquifer can be above, at or below the river level and again does not indicate anything about the effects of groundwater on the river.
GWDTE element: The groundwater level at or around terrestrial ecosystems is fundamental for improving the conceptual model of how a GWDTE functions. It is an essential tool to confirm groundwater connection but there is no single signal from the level monitoring which implies or confirms this. Rather, it is a combination of absolute level measurements, of accounting for variations in the aquifer, wetland strata and the open water area. It will almost certainly involve some sort of model developed to confirm the conceptual understanding. This model will include surface water, groundwater or both.
Intrusion Element: The determination of Intrusion is to be based upon quality rather than level measurement.
In low permeability aquifers and karst aquifers, monitoring boreholes may not give a true reflection of the piezometric surface and in some areas the concept of a piezometric surface will have no relevance. In these circumstances, it may be better to use other indicators of quantitative (and qualitative) status such as river flows and spring flows.
We propose that the best use of level data is to confirm the functioning of the groundwater body and then use the knowledge of how the groundwater body works to determine whether it is in good status or not. Long-term variations in level data will be of most use. If one borehole shows inconsistent data, it may be indicating an area where greater effort needs to be made to understand the functioning of the groundwater flow system.

Working Group C – Groundwater, Activity WGC-2, “Status Compliance & Trends” Guidance on Groundwater Status and Trend Assessment – Final Draft 2.0, 15 October 2008
60
10 ANNEX 3: CASE STUDIES
10.1 Case Study 1: Implementation of the WFD and the GWD in Germany
Background information
Title/Name of case study: Implementation of the Water Framework Directive and the Groundwater Directive in Germany.
Type of case study:
Web-Link:
Objective of case study: Demonstration of German approach on establishing groundwater threshold values.
Contribution to…
Guidance focus: groundwater threshold values
Specific contributions
Background
The Guidance on Groundwater Status and Trend Assessment” proposes a methodology for setting threshold values and assessing the status of groundwater bodies and for the practical implementation of relevant requirements of the WFD and the GWD. The discussions in the course of the preparation of this document showed that national circumstances and frameworks in Member States make certain flexibility in implementing and applying the provisions advisable. The aim is to obtain comparable results while providing flexibility in the way to achieve them.
Scientific Background
Groundwater is a major element of the natural balance. It is part of the hydrological cycle and performs important ecological functions. Groundwater resources close to the surface supply plants with water and form valuable wet biotopes. Groundwater discharges in springs and feeds streams and rivers. Thus the quality and quantity of the groundwater influence surface waters as well. More than 70% of drinking water comes from groundwater, making it Germany’s most important drinking water resource. However, groundwater is also a habitat in its own right possessing great biological diversity. It is therefore of great importance for sustainable development and secure future water supplies to ensure full-coverage, use-oriented precautionary protection for groundwater.
Groundwater as a protected asset in its own right
Based on the particular significance groundwater has for the environment and humans, the approach taken in Germany is to consider groundwater as a whole to be the asset to be protected. Experience has shown that in order to protect groundwater comprehensively and in an anticipatory manner it is not sufficient to simply protect its uses. Groundwater is an integral component of the hydrological cycle and of the environment as a whole. This view is in keeping with current legislation and integrated into various laws and ordinances enacted at federal and Länder level.
Setting of threshold values for groundwater
Article 3.2 of the Groundwater Directive offers the possibility to establish threshold values at the national level, at the level of the river basin district or the part of the international river basin district falling within the territory of a Member State, or at the level of a body or a group of bodies of groundwater. In Germany threshold values will be established at the national level. This ensures a uniform and comparable procedure in all of our Federal States (Länder), reduces the administrative burdens and leads to more cost efficiency. Moreover national threshold values are the basis for further legal regulations (e.g. waste management or soil conservation).
German methodology for deriving threshold values for groundwater
The German methodology for deriving threshold values for groundwater follows the concept of so-called marginal thresholds. This takes into account health protection requirements as well as

Working Group C – Groundwater, Activity WGC-2, “Status Compliance & Trends” Guidance on Groundwater Status and Trend Assessment – Final Draft 2.0, 15 October 2008
61
requirements for protection of aquatic and terrestrial ecosystem. The threshold values derived apply in principle to all groundwater bodies. The complex and time-consuming approach of deriving individual threshold values for each individual body of groundwater can therefore be dispensed with.
The methodology to derive threshold values is based on scientific knowledge and considers the geological and hydro-geological conditions of Germany as a whole. The derivation is primarily based on human-toxicological and ecotoxicological aspects. This essentially uses standards already laid down in EU directives and values agreed in EU bodies. In the case of human toxicology, the limit values of the EU Drinking Water Directive are taken into consideration, unless they are distribution-related. If there are no such values, values are derived on the basis of this directive. In this case, decisive criteria include especially odour, taste and colour. For ecotoxicology several comparable data sources are used in the following order for the derivation of threshold values:
Firstly and unchanged, legally binding ecotoxicological environmental quality standards for aquatic biotic communities of surface waters are taken as a starting point. These include in particular environmental quality standards for classifying the chemical status of surface waters, Directive 76/464 (Water pollution by discharges of certain dangerous substances), and standards for priority substances. These are not adopted if the background levels or suspended matter content of the surface water are important for deriving the environmental quality standard. According to current knowledge, it seems justifiable to have recourse to assessment results for surface water ecosystems. Groundwater organisms react rather more sensitively, as they have no possibilities to escape and the contaminants usually have more time to influence their surroundings, due to the low flow rate of the groundwater.
If there are no environmental quality standards laid down in law, PNEC values are used. These have been derived according to the latest knowledge and according to stringent EU-wide uniform and transparent principles (Technical Guidance Documents); they have been reviewed by a large number of experts in accordance with the provisions of European chemicals legislation and then accepted on publication of the final "risk assessment report".
If European set targets do not exist either, the MPC or MPA values of a Dutch report are taken as a basis for the threshold values, using the same statistical extrapolation method as that also used in deriving the PNEC.
Threshold values are always laid down according to the lower values of the human-toxicological and ecotoxicological derivation. As this value can be below the geogenic concentrations in groundwater, for example in the case of heavy metals, the threshold value will be assessed on the basis of the background level (TV = BL). In such cases the value is only applied for that specific groundwater body. Moreover, a bottom limit of 0.01µg/l should be introduced for organic, non-natural substances for which very low values are obtained due to the ecotoxicological derivation type, unless there are concrete test results justifying a lower value. As in each case the stricter value is used as threshold value, this methodology protects all receptors covered by the Water Framework Directive and the Groundwater Directive.
Experiences gained - Conclusions - Recommendations
Outlook - Next steps – Accessibility of results

Working Group C – Groundwater, Activity WGC-2, “Status Compliance & Trends” Guidance on Groundwater Status and Trend Assessment – Final Draft 2.0, 15 October 2008
62
10.2 Case Study 2: Establishment of threshold values in the Netherlands
Background information
Title/Name of case study: Establishment of threshold values in the Netherlands
Type of case study:
Web-Link: http://www.kaderrichtlijnwater.nl
Objective of case study: This case study describes the objective and boundary conditions of threshold values and the way to establish threshold values for the Dutch situation.
Contribution to…
Guidance focus: groundwater threshold values, natural background levels
Specific contributions
The case study describes how the Netherlands will deal with the general methodology for deriving the threshold values as described in this document. Within that perspective, the Netherlands distinguishes a short term and long term approach.
2. LONG TERM APPROACH
2.1 Objective and boundary conditions: Threshold values aim at a base groundwater quality
Due to the typical geo-hydrological situation, where natural geo-hydrological boundaries are absent, the Netherlands has relatively large groundwater bodies. However, despite the long tradition in water management in the Netherlands, it is not known yet how the protection of receptors should be worked out and what role threshold values have in this protection. Relevant aspects regarding the role of threshold values in protecting receptors are:
- the extent to which groundwater actually interacts with a specific receptor: the impact of groundwater quality on receptors is often limited when compared to other impacts;
- the extent of the area associated with receptors compared to the area of the groundwater body; - the extent to which measures are effective to improve the protection of receptors: changing the
impact of groundwater on receptors is costly and may take a long period of time due to the long travel times groundwater.
Receptors generally occupy a relatively small area compared to the area of a groundwater body. In addition, the temporal scales of groundwater bodies from infiltration point toward receptor are in the range of decades, hundreds of years or even longer and during this transport attenuation and dilution processes occur. Therefore, threshold values in the Netherlands should be related with the base groundwater quality that prevails in a groundwater body. This base quality guarantees the protection of the relevant receptors, i.e., aquatic and groundwater dependent terrestrial ecosystems and human use of groundwater. Potential problems with these local functions should therefore not be solved with threshold values for the entire groundwater body. Rather, specific protection of specific functions or values of groundwater should be realized by additional specific measures.
The additional measures to restore the aquatic and terrestrial ecosystems or to protect the drinking water quality will be specific and at a local scale. The Dutch approach is to indicate the ‘Natura 2000 areas’ and groundwater protected areas identified as separated (special) areas with ‘local’ objectives regarding the groundwater quality and where, in addition to general measures, adequate local measures will be implemented to meet these objectives.
This approach is additionally based on the following pragmatic reasoning:
- the administrative efforts and costs to derive criteria values for each of the relevant receptors will be considerable;
- there is limited time left to derive threshold values in the extended manner the Guidance proposes. At the end of 2007 NL derived threshold values as proposed in this document, in order to implement them legally at the end of 2008.
- the Guidance does not take into account the differences between identified relevant receptors present in a groundwater body.
Threshold values should therefore indicate the regional base groundwater quality rather than the

Working Group C – Groundwater, Activity WGC-2, “Status Compliance & Trends” Guidance on Groundwater Status and Trend Assessment – Final Draft 2.0, 15 October 2008
63
EQS of the most critical local receptor.
As a consequence of the reasons mentioned above, the approach used in the Netherlands will be slightly different from Figure 3 and 4 of the Guidance. The approach starts with selecting one or more relevant receptors. For each of these relevant receptors criteria values (CV) will be derived. After comparing the critical values to the background level the outcome of the first part of Figure 4, deals with derivation of one relevant threshold value (TV) for each groundwater body. This TV will be introduced in the second rectangle of Figure 3 of the guidance. In the second part of this figure the ‘appropriate investigation” will be carried out for the selected relevant receptors.
3. SHORT TERM APPROACH
3.1 Selection of substances
The procedure for selection and establishment of threshold values is costly and time consuming. Therefore, the short-term focus is on the substances of concern, i.e.,
- substances for which characterisation indicates that environmental objectives will not be met; - newest insights regarding the levels of certain substances in relation to the human and
ecological risks.
The necessity to derive threshold values for other substances will be established after the re-characterization of surface and groundwater bodies scheduled from 2008 till 2012. Substances mentioned in Annex II, part B of the GWD will be treated with priority.
3.2 Setting the height of threshold values
In the Netherlands environmental standards are derived in an integral manner to insure that standards derived for the different environmental compartments are consistent alongside each other. Therefore, it is decided to set the height of threshold values by following the present version of the Guidance for the derivation of environmental risk limits within the framework of the project ‘International and National Environmental Quality Standards for Substances in the Netherlands’ (INS: van Vlaardingen and Verbruggen, 2006). This Guidance document was made in agreement with the WFD and was adjusted in compliance with the Technical Guidance Documents
38 where the
WFD was not applicable. The lower of the two environmental risk limits (ERL) should be put forward as threshold value. The maximum permissible concentration (MPC) should be used as threshold value for substances occurring naturally in the environment such as metals and salts.
Within the Dutch approach of setting standards for natural substances, it is common to calculate the MPC by adding the maximum permissible addition (MPA) to the background level (BL). The MPA can be a more detailed interpretation of the small addition that is mentioned in this guidance. In case of metals, the MPC is calculated as sum of the BL and the MPA. This MPA for metals is a constant, risk based, value. For phosphate, the MPA depends on the ecological objectives and is therefore determined by the most relevant receptor in the groundwater body. So far, no differentiation for the BL has been applied, but BLs for the identified GWB may be discerned significantly from surrounding groundwater bodies. Therefore, it is necessary to derive BLs for each individual groundwater body. As a result, threshold values for natural substances may be different for each groundwater body.
Step 1: derivation of environmental risk levels (ERL): derive ERLeco, natural from the maximum permissible addition (MPA) and background level (BL) to obtain maximum permissible concentrations (MPC):
Naturally occurring substances
- Chloride: ERLeco, natural = MPC-Cl - Metals: ERLeco, natural = MPC-metals = MPA-metals + BLGWB, assuming a constant MPA for the
various GWBs - Phosphate: ERLeco, natural = MPC-P = MPA-PGWB + BLGWB, assuming both MPA and BL a
function of the GWB;
38
Manual on the Methodological Framework to Derive Environmental Quality Standards for Priority Substances in accordance with Article 16 of the Water Framework Directive (2000/60/EC).
Working Group C – Groundwater, Activity WGC-2, “Status Compliance & Trends” Guidance on Groundwater Status and Trend Assessment – Final Draft 2.0, 15 October 2008
64
Drinking water
- ERLhuman = drinking water standard - If ERLhuman < BLGWB, ERLhuman = BLGWB
Step 2: derivation of lowest ERL (human or eco,natural) by
- selection of relevant receptors - take the lowest ERL of the selected relevant receptors (eco or drinking water)
Step 3: derivation of threshold value by:
- compare ERL value to background level - if ERL < BL then threshold value = BL - if ERL > BL then threshold value = CV
3.3. Background level
In the Netherlands a measuring network for groundwater quality is in operation since 1979. The observation wells are quite homogeneously spread over the country for the dominant soil usage / soil type combination to obtain insight in the groundwater quality and trends at a regional scale. Each observation well is equipped with three filters at a depth of about 10, 15 and 25 m beyond surface level respectively. For the derivation of the background level filters are selected that have a length between 1 and 5 m and that are located in a water layer of 10 m in the saturated zone laying at least 1 m beneath the surface level AND for which the top of the filter is at least 2 m beneath the groundwater table. The wells are placed in such a way that known point pollutions are avoided, although pristine groundwater at these levels does not exist anymore in the Netherlands. To obtain the BLs per observation well and filter the time series of observations are considered. In case of the groundwater body Central Graben (Centrale Slenk) no observation wells of the measuring network are available. The BL of this groundwater body is established with data from groundwater abstractions in stead. It is assumed that the median of each time series best represents the distribution. Out of the median values a 50-percentile and 90-percentile are calculated. Two approaches are used to establish the BL:
- use of the 50-percentile without a pre-selection procedure; - use of the 90-percentile with pre-selection based on anthropogenic impact.
When concentrations are low (heavy metals, pesticides) the treatment of less than 'Limit of Detection' values (LOD values) as suggested in the guidance may strongly affect the background levels resulting to artificial background levels. Therefore, it is necessary to consider diverging from the treatment of LOD values as given in the guidance and to substitute all LOD values that occur in a time series with the lowest LOD (excluding LOD less than zero or less than negative values).
In the first approach no pre-selection of the samples is carried out. To avoid accounting for the anthropogenic impact twice, the BL is taken at the 50-percentile. Advantage of this procedure is that no samples are removed from the data set.
In the second approach samples are selected based on the concentrations of sulphate, chloride and nitrate to remove anthropogenically affected samples. To account for the difference in geohydrological and geohydrochemical conditions distinction is made in the way brackish and fresh groundwater in a groundwaterbody are affected by anthropogenic pressure on the ecosystem. Different algorithms are applied to establish which brackish and fresh groundwater observations will be rejected and which will not, taking geohydrological and geohydrochemical conditions into consideration. After removal of the samples that are anthropogenically affected, the BL is taken at the lower part of the 90-percentile confidence interval.
Finally, the BL is determined as the highest value of the two approaches.
Experiences gained - Conclusions - Recommendations
Outlook - Next steps – Accessibility of results

Working Group C – Groundwater, Activity WGC-2, “Status Compliance & Trends” Guidance on Groundwater Status and Trend Assessment – Final Draft 2.0, 15 October 2008
65
10.3 Case Study 3: Derivation of background levels and TVs in a Romanian GWB
Background information
Title/Name of case study: Establishing threshold values for a polluted groundwater body altered due to landfill, in order to reach the environmental objectives required by the WFD and GWD.
Type of case study: Dutch – Romanian Project within the Netherlands Pre-accession Programme – Environmental Facility. The project is funded by EVD (Agency for International business and cooperation) and has two Dutch Governmental partners: Ministry of Housing, Spatial Planning and the Environment and SenterNovem/Bodem+. The Romanian counterpart organisations are the Ministry of Environment and Sustainable Development and the National Administration 'Apele Române'. The Ministry of Environment and Sustainable Development, the National Administration 'Apele Române' and Banat Water Directorate act as beneficiaries.
The project is carried out by a consortium of consultants (Grontmij Nederland bv, Witteveen+Bos, Ecorys and BDO Conti Audit) in close cooperation with the mentioned counterparts.
Web-Link:
Objective of case study: Through the project, Romania was supported by Dutch technical assistance in the implementation of three European Directives: the WFD, the new GWD and the Landfill Directive. The main purpose of the project is to develop measures to remediate the polluted groundwater affected by landfills, for a pilot area in the Banat region (south-western part of Romania), where two important landfills, Parta and Jimbolia, are located.
The influence of these landfills on groundwater was studied by a special program of monitoring and by developing a transport model. To accurately assess the monitoring results and to develop the most suitable programme of measures, the first step was the derivation of background levels (BL) and threshold values (TV) for the groundwater body situated below both landfills, namely ROBA03-Timisoara. For the derivation of BL and TV guidelines were developed and applied for the first time, in order to be used further by the other water directorates in Romania.
Contribution to…
Guidance focus: Derivation of Background levels and Threshold values.
Specific contributions: Setup of a guideline and methodology for BL and TV derivation for Romania, including pre-prepared Excel sheets for different steps in the derivation.
Characterisation
ROBA03 Timisoara groundwater body (area 2,577 km² on Romanian territory) was characterized within WFD Article 5 Report as being at risk because concentrations of nitrate and ammonia exceeded the standards for drinking water.
Romania and its delineated groundwater bodies (the pilot GWB in yellow)
Banat river basin district and the pilot GWB (ROBA03)

Working Group C – Groundwater, Activity WGC-2, “Status Compliance & Trends” Guidance on Groundwater Status and Trend Assessment – Final Draft 2.0, 15 October 2008
66
ROBA03 is hosted within a shallow porous aquifer consisting of sand and gravel with clays and silts intercalations. The aquifer is developed until 15 m in flood plains and terraces, and until 30–35 m in interfluves. The hydraulic conductivity varies form 10 to 50 m/day. At some small places, there’s a thick clay layer on top, especially around Jimbolia landfill, but the general flow conditions are those specific for shallow aquifers.
Recharge of ROBA03 groundwater body occurs mainly by precipitation (net recharge 15–30 mm/year) along with the water from meadow rivers, during high water and floods. At the lower levels, rivers drain the phreatic layer except near Bega River. Bega River permanently recharges to the phreatic level as a result of its high embanked flow.
Experiences gained - Conclusions - Recommendations
Based on WGC guidance document “Groundwater Chemical Status and Threshold Values, version 2.0 (25-10-07)” and on BRIDGE project recommendations, for the derivation of BL and TV values for ROBA03 groundwater body, all chemical reports from 1976–2006 were introduced into an EXCEL Database (207 observation wells, 3300 samples, 45.000 analyses) organized in one working sheet for each year, one row for each sample.
For the derivation of BL and TV following indicators were available:
- 1975 - 2008: pH, EC, Cl-, SO4
2-, NO3
-, NO
2-, Alkalinity, Ca
2+, Mg
2+, Fe and NH4
-.
- 1986 - 2008: also Na+, K
+, Mn
2+
- 1993 - 2008: also Zn2+
- 1996 - 2008: also PO4 - 2006 - 2008: also Cu, Ni and Pb have been analysed in 2006 for the first time.
The database was filtered by calculating errors in ion-balance for all samples (not excluding any data) and statistical parameters and also using correlation between sum of anions and measured conductivity. All samples identified as not reliable were removed. After this, the wells with anthropogenic inputs were excluded in two steps (Cl < 200 mg/l ; NO3 < 10 mg/l). TV values were established comparing BL with the drinking water and surface water quality standards.
Final results for the derivation of BL and TV has lead to the following results (for only some of the substances used in the analyses and substances responsible of a risk of failing good status i.e. nitrates and ammonium):
Table 10: Resulting TV for GWB03, 2008
BL
90-percentile
wells with:
NO3 < 10 mg/l, Cl < 200 mg/l
Romania standard drinking water
Romania standard surface water
TV
number of wells 92
Cl mg/l 103
SO4 mg/l 197
NH4 mg/l 2,11 0,50 1,0 2,11
K mg/l 11,9
NO3 mg/l 7,7
NO2 mg/l 0,21
EC µS/cm 1409
Ni µg/l 0,005
Fe mg/l 3,43
Mn mg/l 0,60
Zn mg/l 0,067 1)
EU Drinking Water Guideline for chemical compounds (Sullivan et al., 2005)
Main conclusions based on the methodology used:
- For the pilot groundwater body GWB03, most data was not available in digital form and therefore much effort was needed to make them digital. It is important to consider this as it takes serious capacity and is time consuming. However it is needed, not only for this purpose

Working Group C – Groundwater, Activity WGC-2, “Status Compliance & Trends” Guidance on Groundwater Status and Trend Assessment – Final Draft 2.0, 15 October 2008
67
but also for future activities related to the Water Framework Directive and the Groundwater Directive;
- The methodology used includes data preparation and data handling using Excel techniques. Sufficient knowledge of Excel is required;
- The methodology as described in the EU guidance document requires some basic hydro-geochemical knowledge. Without this knowledge derivation of BL and TV will be possible but will take more time (and study of relevant issues)
Recommendations
- Applying a step by step approach will most likely give the best results;
Outlook - Next steps – Accessibility of results
All Water Directorates in Romania are following the practical steps used in deriving BL and TV, based on this first appliance of the EU guidelines, made by Banat Water Directorate helped by the Dutch experts. The approach developed within this project and the results obtained will be posted on the Ministry of Environment and Sustainable Development website: http://www.mmediu.ro. The documents developed for Romania are based on the EU guidance documents, but translated into more practical tools and support.
Additional information about the implementation of TV and the Romanian strategy can be obtained at Mrs. R. Balaet, [email protected] of the Ministry of Environment and Sustainable Development. Further information about the project can be obtained at the project manager of the project: Mr. FJL Vliegenthart ([email protected]) or at Mr. P. Schipper ([email protected]) of Grontmij Nederland B.V.

Working Group C – Groundwater, Activity WGC-2, “Status Compliance & Trends” Guidance on Groundwater Status and Trend Assessment – Final Draft 2.0, 15 October 2008
68
10.4 Case Study 4: Quantitative status assessment of two GWBs in the Netherlands
Background information
Title/Name of case study: Quantitative status assessment of two GWBs in the Netherlands. Groot Salland nature restoration projects (Netherlands)
Type of case study:
Web-Link: Boetelerveld: http://www.landschapoverijssel.nl/terreinen/boetelerveld.htm
Olde Maten and Veerslootlanden: http://provincie.overijssel.nl/beleid/natuur_en_platteland/landinrichting/item_89390/strategisch/projectinformatie
Objective of case study: Demonstration of quantitative status assessment
Contribution to…
Guidance focus: quantitative status assessment
Specific contributions: Consideration of all 4 proposed tests for quantitative status assesment
Characterisation
The water management district "Waterschap Groot Salland" (82,000 ha) is situated in the Dutch part of the Rhine river basin. This area accommodates two major groundwater dependent terrestrial ecosystems which have been designated as Natura 2000 sites - the ‘Boetelerveld’ (173 ha) and the ‘Olde Maten & Veerslootlanden’ (993 ha). Both areas are remainders of former much larger nature areas. The groundwater body under the Boetelerveld (GWB B in Figure 1) is sandy and consists of Pleistocene sandy layers of around 100 m thickness. Due to occurrence of impermeable boulder clay layers, rainfall was poorly drained and wet heath land was the natural ecosystem. The groundwater body under the Olde Maten & Veerslootlanden (GWB A in Figure 1) is characterised as a clay/peat GWB consisting of extensive Holocene clay and peat layers and underneath sandy layers. Also here drainage was poor; marshland was the natural ecosystem.
Since the 1950s a drainage network of ditches and canals converted these poor rural areas into intensively cultivated land. By adjusting the water level in the ditches the water management
establishes optimum groundwater levels for agriculture. As a result of this cultivation process, the original groundwater dependent terrestrial ecosystems have largely disappeared. A few sites nevertheless remained, while significantly impacted by the lowered groundwater levels as well as by nutrient rich Rhine water which is led into the network of ditches during the dry season.
Water and nature management policy in the Netherlands have developed the ambition to preserve and restore the remaining areas where typical Dutch natural habitat types still exist. Hence, several measures have been taken to raise the groundwater table in these areas and to improve groundwater quality.
Legend

Working Group C – Groundwater, Activity WGC-2, “Status Compliance & Trends” Guidance on Groundwater Status and Trend Assessment – Final Draft 2.0, 15 October 2008
69
Experiences gained - Conclusions - Recommendations
In this case study the quantitative status of the two GWBs as described above is assessed. The assessment comprises 4 tests: water balance, saline intrusion, aquatic ecosystems and terrestrial ecosystems.
a. Water balance test:
Due to a surplus of net precipitation the water balance test does not affect the good status of the GWB [chapter 5.3.1 of the guidance].
b. Saline intrusion:
In this area, the risk of up-coning of salt water, mostly in very deep groundwater abstractions, is controlled by an ‘early warning’ permanent monitoring system. Thus saline intrusions are prevented. Hence the test on this issue does not affect the good status [chapter 5.3.4 of the guidance].
c. Surface water (aquatic ecosystems):
The watercourses in the Groot Salland district are almost all man-made, intended to improve drainage and prevent flooding, and got there present shape in particular in the 1960s and 1970s. All these surface water bodies therefore have been designated as "heavily modified". The ecological objectives for these waters (MEP/GEP) are partially determined by the quality of the Rhine water led in during the dry season. The achievement of the GEP does not significantly depend on the amount of groundwater seeping into these surface waters. Therefore, the test concerning the amount of groundwater feeding surface waters does not affect the good status of the GWB [chapter 5.3.2 of the guidance].
d. Groundwater dependent terrestrial ecosystems:
In order to raise the groundwater table in the Boetelerveld, the first measures were already taken in the 1970s. The ditches were filled up, which enhanced the conservation of precipitation in the area. In 2000 a canal with a high water level was constructed around the area in order to retain more precipitation and to achieve a higher groundwater level. An assessment of the drinking water abstractions elsewhere in the GWBs led to the conclusion that the effects of these abstractions are of minor importance for the groundwater table in the two Natura 2000 areas. Also in the Olde Maten and Veerslootlanden measures are taken to raise the groundwaterlevel. Since 2000, when the WFD came into force, the hydrological conditions in the two areas did not further deteriorate. These conditions are sufficiently favourable for preserving the two areas in their current state. Therefore, both groundwater bodies are judged as being in a good status [chapter 5.3.3 of the guidance].
If however further deterioration of the hydrological conditions since 2000 had occurred, the principle of ‘one out all out’ would lead to the overall judgement of the two groundwater bodies in 2009 as having a poor status, even though the GWDTE are only small in relation to the overall GWB (see Figure 1).
Outlook - Next steps – Accessibility of results
As stated above, the water and nature management in the Netherlands have the ambition to further restore and enlarge the desired habitat types in the Natura 2000 areas. This requires a further improvement of the hydrological conditions with respect to the situation in 2000. The aim is to establish the required hydrological conditions by 2015. The measures comprise the improvement of incoming surface water quality, raising surface water levels, shallowing ditches around the area, and further measures inside the Natura 2000 areas itself. However, the extent to which improvement is feasible is still subject of research and discussion. The process of assessing costs and benefits has not been concluded yet, and a lack of social acceptance (especially regarding the loss of agricultural production) may impede certain measures to be effectuated. Furthermore, some measures might not be as effective as expected. Finally, certain changes of the hydrological conditions since the 1950s are irreversible. E.g. the construction of the Flevopolders west of the area significantly increased the westbound groundwater flows, at the cost of local seepage. The objectives and required measures are foreseen to be agreed upon in the course of 2009. The objectives set in the RBMP 2009 will correspond to the situation in 2000. The tentative further reaching objectives for 2015, as well as the related measures, are however mentioned in the RBPM 2009, in order to clearly display the current policy ambitions.

Working Group C – Groundwater, Activity WGC-2, “Status Compliance & Trends” Guidance on Groundwater Status and Trend Assessment – Final Draft 2.0, 15 October 2008
70
10.5 Case Study 5: CIS WG 2.8 proposal for trend and trend reversal assessment
Background information
Title/Name of case study: CIS Working Group 2.8 proposal on methods for the assessment of trends and trend reversal at groundwater body scale
Type of case study: Outcome of CIS WG 2.8 “Statistical aspects of the identification of groundwater pollution trends and aggregation of monitoring results”
Web-Link: www.wfdgw.net
Objective of case study: The aim of CIS WG 2.8 was, amongst others, the establishment of an appropriate and pragmatic statistical method for trend and trend reversal assessment at GW-body scale including the determination of the minimum requirements for the assessment. The methods had to be suitable for EU-wide application and implementation based on the provisions of the WFD taking into account diffuse and point sources of pollution.
Contribution to…
Guidance focus: Trend and trend reversal assessment
Specific contributions
Procedures for trend assessment and trend reversal assessment at GWB level. Treatment of values below LOQ. Minimum requirements from statistical perspective.
Characterisation
CIS WG 2.8 formed a consortium of 16 EU countries (11 partners, 5 observers) in 2000 and 2001 and developed a methodology for data aggregation and trend (reversal) assessment. The requirements on the method were: statistically correct, pragmatic, one method for all GW-bodies, applicable to all types of parameters. Test data sets from 21 GW-bodies and 69 parameters were provided from the partners as well as an inventory of already applied methods. The outcome of the project comprises a method for assessing the monitoring network, methodologies for data aggregation, trend assessment and trend reversal assessment, treatment of values below LOQ, statistical minimum requirements, comprehensive documentation and a software tool for test and demonstration purposes, which is all available for download from the project website.
Experiences gained - Conclusions – Recommendations
The whole procedure of trend and trend reversal assessment considers following steps: 1. Treatment of values below LOQ. 2. Temporal regularisation of groundwater quality data at monitoring point level. 3. Data aggregation at GW-body level. 4. Trend (reversal) test.
Trend assessment
Proposed trend test: The generalized linear regression test (ANOVA test) based on the LOESS smoother is proposed for assessing statistically significant (monotonic) trends at GWB-level.
With regard to extensibility and power the linear methods (based on a linear model) outperform non-parametric methods based on the test of Mann-Kendall, and therefore the decision was in favour of the linear methods. The proposed methodology considers following specific requirements: applicability to all types of parameters, extensibility to potential adjustment factors, and sufficient power for the detection of a trend. Robustness was considered less important than power and extensibility (data validation is the responsibility of MS).
Power of test: One of the findings during the data assessment phase was that a significant upward trend is to be detected with a power of 90 % (for most substances) if the increase in pollutant concentration is at least 30 % or even higher, depending on the type of pollutant. In the light of the default starting point for trend reversal at 75 % of QS or TV an increase of 33 % of the pollutant concentration would mean that good status is failed.
The importance of data from operational monitoring for trend assessment was pointed out, as otherwise insufficient data would not allow for trend detection in due time.

Working Group C – Groundwater, Activity WGC-2, “Status Compliance & Trends” Guidance on Groundwater Status and Trend Assessment – Final Draft 2.0, 15 October 2008
71
Minimum length of time series: For the minimum length of time series for trend detection the power of trend detection, the timetable for WFD implementation as well as its minimum requirement regarding monitoring frequency (once a year) were taken into account. As monitoring started in 2007 and in 2015 a review and update of river basin management plans is required, it is assumed that in 2015 data from 2007 to 2014 are available. This means a time series of 8 years with at least 8 values as a minimum.
As with less than 8 yearly measurements a statistical trend assessment may be critical, it is recommended to perform a trend analysis with at least 8 measurements. In case of half-yearly measurements the total sample number should not be less than 10, in case of quarterly measurements it should not be less than 15. In each case the time span of measurements should be at least 5 years since short-term changes may distort the detection of long-term trends.
Maximum length of time series: If long-term time series are assessed, there is a risk of obtaining trend results which are clearly affected by changes in the earlier years of the time series. Therefore it is proposed to restrict the time series to the most recent 15 years.
An alternative would be the application of an adaptive method to check whether there is a significant break of the (linear) trend (e.g. by a trend reversal method (two-section method)). If there is a significant break then the recent section could be subject of trend assessment. Remark: Conceptual model and GW residence time should be considered.
Figure 19: Influence of the length of time series on the detection of a trends
Seasonality: In order to avoid bias by seasonal effects, samples should be taken within a certain period of a year. In particular for yearly measurements it should be guaranteed that the measurements are taken in one and the same quarter or within a certain time period of the year. Seasonality effects might also be induced due to different monitoring frequencies from site to site. Seasonality causes a high random variation which reduces the power of the trend analysis. The proposed method also allows for testing seasonality.
Data gaps: In the time series some observations may be missing, but the missing of two or more subsequent values should be avoided, as this would cause a bias due to extrapolation.
Trend reversal assessment
Proposed trend reversal test: For the assessment of a trend reversal, the 2-sections model is proposed, due to its simple interpretability, flexibility and high sensitivity to detect a trend reversal. The 2-sections model is a linear method, based on an extended linear regression model fitting a linear trend with one break in the interval.
For half-yearly or quarterly data seasonality can be considered in the method.
Figure 20: Two-sections model for assessing trend reversal

Working Group C – Groundwater, Activity WGC-2, “Status Compliance & Trends” Guidance on Groundwater Status and Trend Assessment – Final Draft 2.0, 15 October 2008
72
Minimum length of time series: In the light of the second review and update of river basin management plans in 2021 (with data from 2007-2020), at least 14 measurements (with yearly regularisation) are recommended in order to guarantee a certain level of power for the detection of a trend reversal. With data on a half-yearly or quarterly basis 10 years are considered to be the minimum. For half-yearly measurements at least 18 values and for measurements on a quarterly basis at least 30 values would be necessary.
Maximum length of time series: Should be limited to max. 30 years.
Data preparation
Treatment of values below the limit of quantification (LOQ): As limits of quantification may change over time, there is a need of a consistent treatment of measurements. For the treatment of "less than LOQ" measurements a ‘minimax approach’ (minimize maximum risk) is applied. In order to avoid bias (induced trend phenomena) the trend analysis should be performed with a constant LOQmax. All measurements (above or below LOQ) where the LOQ exceeds LOQmax should be eliminated, LOQs not exceeding LOQmax should be replaced by LOQmax (Definition of LOQmax and examples, see website).
Replacement of values below LOQ: It is recommended to calculate trends based on AM50 (50 means that <LOQ values are replaced by 50 % LOQ) as long as AM0/AM100 ≥ 0.6. Under these circumstances the maximum bias does not exceed 25 %. If a QS or TV is available, the LOQ should not exceed 60 % of the QS or TV. In general if AM0/AM100 < 0.6 any trend assessment should be based on sampling site level as far as sufficient data are available.
Regularisation: For each monitoring point and for each aggregation period the arithmetic mean of the concentration data is calculated considering the treatment of values below LOQ. Possible aggregation (regularisation) periods are quarterly, half-yearly, or yearly and they should be the same for each monitoring point within a GW-body that is subject of trend assessment to avoid bias.
Spatial aggregation The trend assessment method is proposed to be based on the arithmetic mean value at the GW-body level (i.e. the arithmetic mean of the arithmetic means at monitoring point level).
Outlook - Next steps – Accessibility of results
The project was finished in December 2001. Reports, data, and the software tool are available at the project website www.wfdgw.net
The final report is published as:
Technical Report No. 1: Statistical aspects of the identification of groundwater pollution trends and aggregation of monitoring results – WG 2.8 Statistics (2001);

Working Group C – Groundwater, Activity WGC-2, “Status Compliance & Trends” Guidance on Groundwater Status and Trend Assessment – Final Draft 2.0, 15 October 2008
73
10.6 Case Study 6: Trends in relation to pressures and vulnerability
Background information
Title/Name of case study: Trends in relation to pressures, monitoring set-up and properties of groundwater systems
Type of case study: Results of the FP6 Aquaterra work package TREND2 ‘Trends in Groundwater’
Web-Link: http://www.attempto-projects.de/aquaterra/21.0.html
Objective of case study:
The objective of this case study is to show that trend detection is preferably tuned to pressures to the groundwater system, to the monitoring set-up and to the hydrological and chemical properties of the system. It also illustrates how groundwater age dating can improve trend detection.
Contribution to…
WFD focus: trends, monitoring, travel times, age dating
Specific contributions: land use, pressures, response times, age dating
Characterisation
The Aquaterra work package TREND 2 was dedicated to the development of operational methods to assess, quantify and extrapolate trends in groundwater systems. Trend analysis techniques were tested at a wide range of European cases, including unconsolidated lowland deposits in the Netherlands and Germany, chalk aquifers in Belgium and a fractured aquifer with a thick unsaturated zone in France.
A trend was defined as ’a change in groundwater quality over a specific period in time, over a given region, which is related to land use or water quality management’. Trend analysis for the Groundwater Directive is dedicated to distinguishing these anthropogenic changes from natural variation with an adequate level of confidence and precision (GWD, Annex V, art 2(a)(i)). Obviously, temporal variations due to climatologic and meteorological factors might complicate trend detection, but also spatial variability is a complicating factor, especially when aggregating trends on groundwater body scale which is requested. Relevant spatial variations include 1. flow paths and travel times, 2. pressures and contaminant inputs and 3. chemical reactivity of groundwater bodies. These variations result in very variable trend behaviour over the scale of the groundwater body, because wells might as well be on a flow path which traces back to an area with high contaminant inputs, but also one tracing back to low inputs.
Trend analysis techniques aim to reduce the variability which is not related to the anthropogenic changes themselves. Therefore, trend detection becomes more efficient when forementioned spatial and temporal variability are reduced by taking into account the physical and chemical temporal characteristics of the body of groundwater, including flow conditions, recharge rates and percolation times (GWD, Annex V, Art 2(a)(iii)). Several statistical techniques, modelling techniques and combi-nations of both are available for trend analysis and some promising techniques were tested in the TREND2 work package, including age dating and transfer-function approaches (Visser et al. 2008).
Experiences gained - Conclusions - Recommendations
The TREND2 comparative approach showed that there is no unique approach which works under all hydrogeological conditions and monitoring settings. However, reducing variability by including information on pressures, hydrology and hydrochemistry did help to improve the detection of relevant trends in each of the hydrogeological settings studied. Specific conclusions are:
- grouping of wells is recommended to improve trend detection efficiency; - grouping is preferably done according to pressures (often land use related), hydrologic
vulnerability (travel time frequency distributions, unsaturated zone depth) and chemical characteristics (rock type, organic matter contents) (Figure 1)

Working Group C – Groundwater, Activity WGC-2, “Status Compliance & Trends” Guidance on Groundwater Status and Trend Assessment – Final Draft 2.0, 15 October 2008
74
- grouping of wells for trend analysis should also consider the depth dimension because groundwater generally becomes older with depth and changes at larger depth might be completely different from changes at shallow depth (Figure 2)
- it is essential to distinguish between abstraction wells and springs on the one hand and observation wells which are not pumped on the other. - Pumping wells and springs
normally have water mixed from different layers and the resulting water quality is a result of mixing water with a broad range of travel times. As a complicating factor, the contributions of young and old water in the mixture may change with time.
- Water quality measured in observation wells is normally related to a distinct groundwater age, and time series can be related to a specific infitration period once the age has been determined.
- If different monitoring types occur in a groundwater body, trend detection is best done by grouping these types separately.
- Unsaturated zone thickness is one of the controlling variables in choosing trend analysis techniques. Thick unsaturated zones lead to long response times which trouble fast detection of trends related to anthropogenic changes.
Figure 1
Figure 1: Grouping of wells
according to pressures (land
use), hydrologic vulnerability
(geohydro-logical situation)
and chemical vulnerability
(soil type). The resulting
combinations were called
homogeneous areas and used
for determining trends and
assessing chemical status
(Broers and van der Grift
2004)
Figure 2: Increase of groundwater age with
depth as determined by an analytical equation
(dashed line) and tritium-helium age dating in
14 multi-level observation wells (separate
colours for each well)
Figure 2: Increase of groundwater age with
depth as determined by an analytical equation
(dashed line) and tritium-helium age dating in
14 multi-level observation wells (separate
colours for each well)

Working Group C – Groundwater, Activity WGC-2, “Status Compliance & Trends” Guidance on Groundwater Status and Trend Assessment – Final Draft 2.0, 15 October 2008
75
- Age dating techniques proved very suitable in areas with unconsolidated deposits with shallow water tables (Figure 3) but was found to be of limited use in the dual porosity aquifers with thick unsaturated zones.
Figure 3: Translating time series measured in individual observation multi-level wells at shallow depth (10 m below surface water level) and deep (25 m below surface water level) into an aggregated time series plot using recharge year as X –axis after age dating using tritium-helium (Visser et al. 2007). The aggregated time series shows a sustained upward trend with higher concentrations with recharge time.
Outlook - Next steps – Accessibility of results
Data and research reports are available at http://www.attempto-projects.de/aquaterra/21.0.html
References:
Batlle Aguilar, J., Orban, P., Dassargues, A. and Brouyère, S., 2007. Identification of groundwater quality trends in a chalk aquifer threatened by intensive agriculture in Belgium. Hydrogeology Journal, 15(8): 1615.
Broers, H.P. (2002). Strategies for regional groundwater quality monitoring. Netherlands Geographical Studies no. 306, Ph.D. Thesis University of Utrecht, the Netherlands.
Broers, H.P. and van der Grift, B., 2004. Regional monitoring of temporal changes in groundwater quality. Journal of Hydrology, 296(1-4): 192-220.
Loftis, J.C., 1996. Trends in groundwater quality. Hydrological Processes, 10: 335-355.
Pinault, J.L. and Dubus, I.G., 2008. Stationary and non-stationary autoregressive processes with external inputs for predicting trends in water quality. Journal of Contaminant Hydrology, In Press, Accepted Manuscript.
Visser, A., Broers, H.P., Van der Grift, B. and Bierkens, M.F.P., 2007b. Demonstrating Trend Reversal of Groundwater Quality in Relation to Time of Recharge determined by 3H/3He. Environmental Pollution, 148 (3): 797-807.
Visser, A., Broers, H.P., , I.G. Dubus, J.L. Pinault, M. Korcz, Batlle Aguilar, J., Orban, P., and Brouyère, S and M.F.P. Bierkens (2008) Discussion of methods for the detection and extrapolation of trends in groundwater quality. Aquaterra deliverable T2.12, submitted to Journal of Hydrology.
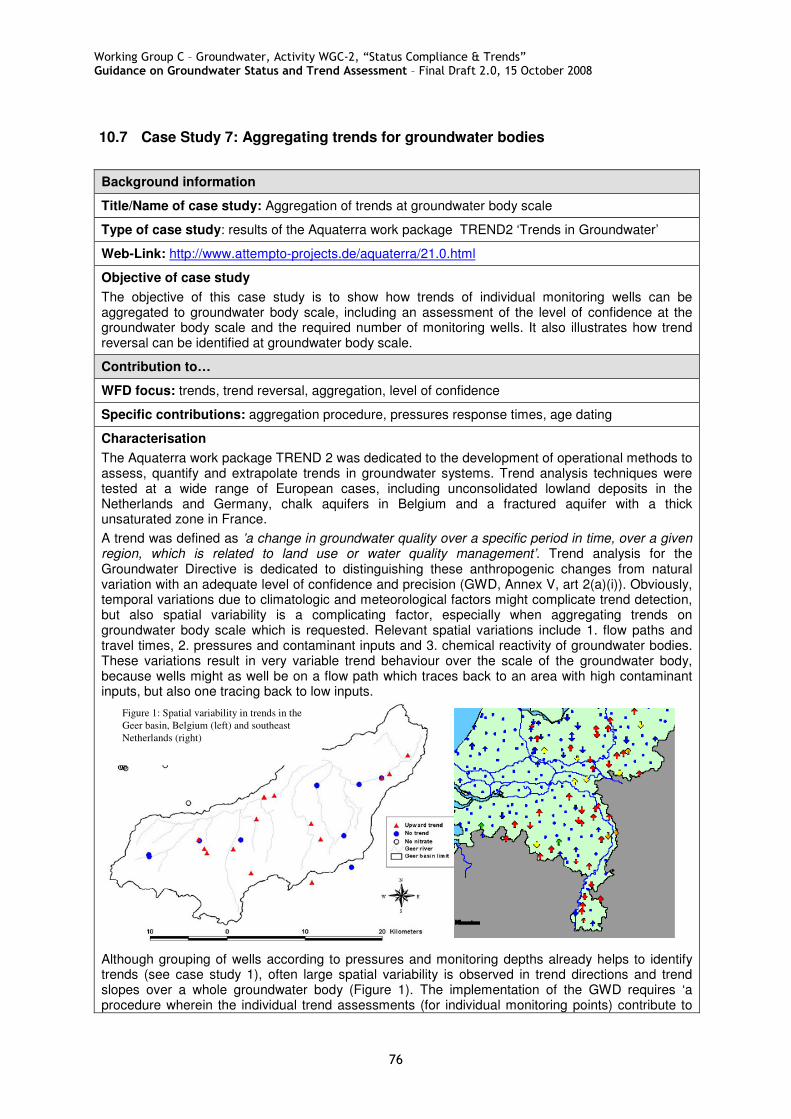
Working Group C – Groundwater, Activity WGC-2, “Status Compliance & Trends” Guidance on Groundwater Status and Trend Assessment – Final Draft 2.0, 15 October 2008
76
10.7 Case Study 7: Aggregating trends for groundwater bodies
Background information
Title/Name of case study: Aggregation of trends at groundwater body scale
Type of case study: results of the Aquaterra work package TREND2 ‘Trends in Groundwater’
Web-Link: http://www.attempto-projects.de/aquaterra/21.0.html
Objective of case study
The objective of this case study is to show how trends of individual monitoring wells can be aggregated to groundwater body scale, including an assessment of the level of confidence at the groundwater body scale and the required number of monitoring wells. It also illustrates how trend reversal can be identified at groundwater body scale.
Contribution to…
WFD focus: trends, trend reversal, aggregation, level of confidence
Specific contributions: aggregation procedure, pressures response times, age dating
Characterisation
The Aquaterra work package TREND 2 was dedicated to the development of operational methods to assess, quantify and extrapolate trends in groundwater systems. Trend analysis techniques were tested at a wide range of European cases, including unconsolidated lowland deposits in the Netherlands and Germany, chalk aquifers in Belgium and a fractured aquifer with a thick unsaturated zone in France.
A trend was defined as ’a change in groundwater quality over a specific period in time, over a given region, which is related to land use or water quality management’. Trend analysis for the Groundwater Directive is dedicated to distinguishing these anthropogenic changes from natural variation with an adequate level of confidence and precision (GWD, Annex V, art 2(a)(i)). Obviously, temporal variations due to climatologic and meteorological factors might complicate trend detection, but also spatial variability is a complicating factor, especially when aggregating trends on groundwater body scale which is requested. Relevant spatial variations include 1. flow paths and travel times, 2. pressures and contaminant inputs and 3. chemical reactivity of groundwater bodies. These variations result in very variable trend behaviour over the scale of the groundwater body, because wells might as well be on a flow path which traces back to an area with high contaminant inputs, but also one tracing back to low inputs.
Figure 1: Spatial variability in trends in the
Geer basin, Belgium (left) and southeast
Netherlands (right)
Figure 1: Spatial variability in trends in the
Geer basin, Belgium (left) and southeast
Netherlands (right)
Figure 1: Spatial variability in trends in the
Geer basin, Belgium (left) and southeast
Netherlands (right)
Although grouping of wells according to pressures and monitoring depths already helps to identify trends (see case study 1), often large spatial variability is observed in trend directions and trend slopes over a whole groundwater body (Figure 1). The implementation of the GWD requires ‘a procedure wherein the individual trend assessments (for individual monitoring points) contribute to

Working Group C – Groundwater, Activity WGC-2, “Status Compliance & Trends” Guidance on Groundwater Status and Trend Assessment – Final Draft 2.0, 15 October 2008
77
identify a significant and sustained trend at the groundwater body. Two possible ways of aggregating individual trends at groundwater body scale are illustrated below using data of the Dutch monitoring network in Noord-Brabant. The monitoring network comprises of standardized monitoring wells with fixed screens at specific depths. The wells consist of purpose built nested piezometers with a diameter of 2” and a screen length of 2 meters at a depth of about 8 and 25 meters below surface (Broers, 2002). The subsurface of Noord-Brabant consists of fluvial unconsolidated sand and gravel deposits from the Meuse River, overlain by a 2–5 m thick cover of Middle- and Upper-Pleistocene fluvio-periglacial and aeolian deposits consisting of fine sands and loam. Noord-Brabant is a relatively flat area with altitudes ranging from 0 m above Mean Sea Level (MSL) in the north and west to 30 m above MSL in the south-east. Groundwater tables are generally shallow, usually within 1-5 meters below the surface.
Experiences gained - Conclusions - Recommendations
As a first step in aggregating trends it is recommended to group monitoring wells on the basis of pressures/vulnerability and hydrological properties such as the probable travel time distribution in the groundwater body (see other case study). Now, two ways of aggregating are possible:
1. a statistical way, for example by defining the median trend slope and the corresponding confidence interval
2. a deterministic way, for example using age dating to aggregate time series along a standardized X-axis showing recharge time.
Both approaches are illustrated below using Aquaterra results.
Example 1: Aggregation using median trend slopes
First, all trend slopes of individual monitoring points are determined, through linear regression or a Kendall-Theil robust line (Helsel and Hirsch 1992). Aggregated trends are then determined by taking the median of all trend slopes and test whether the median of all trend slope differs significantly from zero (Broers and van der Grift 2004). A significant upward aggregated trend for the group of wells is established when the 95% confidence level of the median is completely above the zero slope line (Figure 2). A downward trend is identified is the complete confidence interval is below the zero slope line. Here. confidence intervals around the median slope were determined non-parametrically following Helsel and Hirsch (1992, p.70) using a table of the binomial distribution. It should be noted that trends could have reversed directions at different depths of the aquifer, due to differences in groundwater age and the corresponding contaminant inputs during the period of infiltration.
-0.50
0.00
0.50
no3 al k oxc cl sumcat
-1.00
0.00
1.00
no3 al k oxc cl sumcat
NO3
(mg/l/yr)
Al
(ug/l/yr)
K
(mg/l/yr)
OXC
(meq/l/yr)
Cl
(mg/l/yr)
Sumcat
(meq/l/yr)Figure 2: Aggregated median
trend slopes for agricultural
recharge areas in the province of
Noord-Brabant for 6 chemical
indicators for shallow screens
(upper graph) and deeper
screens (lower graph. Source:
Visser et al. 2005.
OXC= oxidation capacity,
Sumcat = sum of cations.
Significant upward trends
(filled symbols) were detected
for OXC at shallow level and
Sumcat at deeper
level and downward trends for
Sumcat at shallow level and
OXC at deeper.
-0.50
0.00
0.50
no3 al k oxc cl sumcat
-0.50
0.00
0.50
no3 al k oxc cl sumcat
-1.00
0.00
1.00
no3 al k oxc cl sumcat
-1.00
0.00
1.00
no3 al k oxc cl sumcat
NO3
(mg/l/yr)
Al
(ug/l/yr)
K
(mg/l/yr)
OXC
(meq/l/yr)
Cl
(mg/l/yr)
Sumcat
(meq/l/yr)Figure 2: Aggregated median
trend slopes for agricultural
recharge areas in the province of
Noord-Brabant for 6 chemical
indicators for shallow screens
(upper graph) and deeper
screens (lower graph. Source:
Visser et al. 2005.
OXC= oxidation capacity,
Sumcat = sum of cations.
Significant upward trends
(filled symbols) were detected
for OXC at shallow level and
Sumcat at deeper
level and downward trends for
Sumcat at shallow level and
OXC at deeper.
One of the conclusions of aggregating trends in a statistical manner is that often a relatively large number of observation wells (20 to 40) is necessary to statistically demonstrate trends because of the observed large temporal and spatial variability which is inherent to groundwater quality datasets.
Example 2: Aggregation based on recharge time using age dating

Working Group C – Groundwater, Activity WGC-2, “Status Compliance & Trends” Guidance on Groundwater Status and Trend Assessment – Final Draft 2.0, 15 October 2008
78
A new promising aggregation technique is using age dating to determine the recharge period of the groundwater and relate the measured concentration data to the derived recharge time. This technique proved to work well for monitoring systems based on multi-level observation wells in areas with porous aquifers. In the example, tritium-helium ages were used to determine the travel time to the monitoring screens. These travel times were used to relate time-series of measured concentrations to the time of recharge, instead of the time of sampling. Subsequently, the results of all 28 time series in the area type ‘intensive agricultural land use in recharge areas’ were aggregated in one graph and analysed using LOWESS smooth (Cleveland 1979) and ordinary linear regression approaches (Figure 3). The method successfully identified trend reversal of nitrate concentrations for this area type. The observed trend compares well with the known input history of agricultural pollutants based on historical data series of production and use of fertilizer and manure under various crop types. Trend reversal was most easily demonstrated for conservative solutes and indicators, such as ‘oxidation capacity’ (Visser et al. 2007). Downward trends in the most recent groundwater could also be demonstrated for reactive solutes such as nitrate, which is transformed to nitrogen when it encounters denitrification by reactive organic matter or sulfides at some depth in the subsurface.
Figure 3:
Aggregation by
using age dating to
determine
recharge year
corresponding to
the measured
concentrations.
Trend reversal
was demonstrated
significantly
(P<0.005) for
oxidation capacity
and nitrate.
Figure 3:
Aggregation by
using age dating to
determine
recharge year
corresponding to
the measured
concentrations.
Trend reversal
was demonstrated
significantly
(P<0.005) for
oxidation capacity
and nitrate.
Outlook - Next steps – Accessibility of results
Data and research reports are available at http://www.attempto-projects.de/aquaterra/21.0.html
References:
Batlle Aguilar, J., Orban, P., Dassargues, A. and Brouyère, S., 2007. Identification of groundwater quality trends in a chalk aquifer threatened by intensive agriculture in Belgium. Hydrogeology Journal, 15(8): 1615.
Broers, H.P. (2002). Strategies for regional groundwater quality monitoring. Netherlands Geographical Studies no. 306, Ph.D. Thesis University of Utrecht, the Netherlands.
Broers, H.P. and van der Grift, B., 2004. Regional monitoring of temporal changes in groundwater quality. Journal of Hydrology, 296(1-4): 192-220.
Broers H.P, Visser A.,(eds.), Gourcy L., Dubus I.G. Baran N., Mouvet C. & Gutierrez A.(2005). Report on concentration-depth, concentration-time and time-depth profiles in the Meuse basin and the Brévilles catchment. Aquaterra deliverable T2.3.
Cleveland, W. S. (1979) Robust locally weighted regression and smoothing scatterplots. J. Amer. Statist. Assoc. *74*, 829-836.
Helsel, D.R., Hirsch, R.M., 1992. Statistical methods in water resources, Studies in Environmental Science 49, Elsevier, Amsterdam.
Loftis, J.C., 1996. Trends in groundwater quality. Hydrological Processes, 10: 335-355.
Pinault, J.L. and Dubus, I.G., 2008. Stationary and non-stationary autoregressive processes with external inputs for predicting trends in water quality. Journal of Contaminant Hydrology, In Press, Accepted Manuscript.
Visser, A., Broers, H.P., Van der Grift, B. and Bierkens, M.F.P., 2007b. Demonstrating Trend Reversal of Groundwater Quality in Relation to Time of Recharge determined by 3H/3He. Environmental Pollution, 148 (3): 797-807.

Working Group C – Groundwater, Activity WGC-2, “Status Compliance & Trends” Guidance on Groundwater Status and Trend Assessment – Final Draft 2.0, 15 October 2008
79