group 7 macy, nordstrom and kohl
TRANSCRIPT
Group 7
Nordstrom- Ashley
Kohl’s- Eduardo
Macy’s-Hewitt

Industry Overview
Department Store Department store chains offering multiple lines of products…
4 trendsSimplicity
Transparency
Social Media
Customer Service
𝑆𝑎𝑙𝑒𝑠𝐺𝑟𝑜𝑠𝑠 𝑠𝑞𝑎𝑟𝑒 𝑓𝑜𝑜𝑡𝑎𝑔𝑒
𝑆𝑎𝑙𝑒𝑠𝑇𝑜𝑡𝑎𝑙𝑛𝑢𝑚𝑏𝑒𝑟 𝑜𝑓 𝑒𝑚𝑝𝑙𝑜𝑦𝑒𝑒𝑠

Nordstrom
10.35 billions in market capitalization
61000 employees
242 stores in 31 states
Apparel, Cosmetic, Shoes, Accessories
Retail and Credit are two main business segments
Affordable luxury is target market
25,290,000 square foot

Macy’s19.25 billions in market capitalization
171,000 employees
840 Stores in 45 states, 50% are wholly owned
Apparel, Cosmetic, Shoes, Accessories, Home and Miscellaneous
FDS Bank Credit Service, Merchandise Group, IT & Logistics are subsidiaries
Macy’s and Bloomingdale’s brand focus on mid-tier market and upper-tier market, respectively
150,600,000 square foot
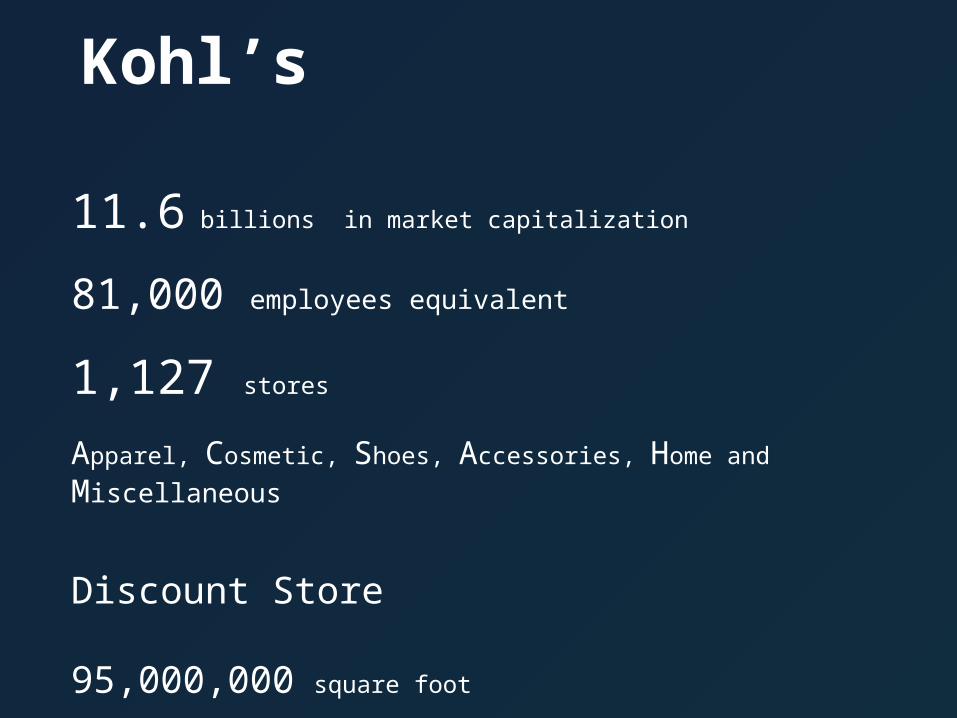
Kohl’s
11.6 billions in market capitalization
81,000 employees equivalent
1,127 stores
Apparel, Cosmetic, Shoes, Accessories, Home and Miscellaneous
Discount Store
95,000,000 square foot
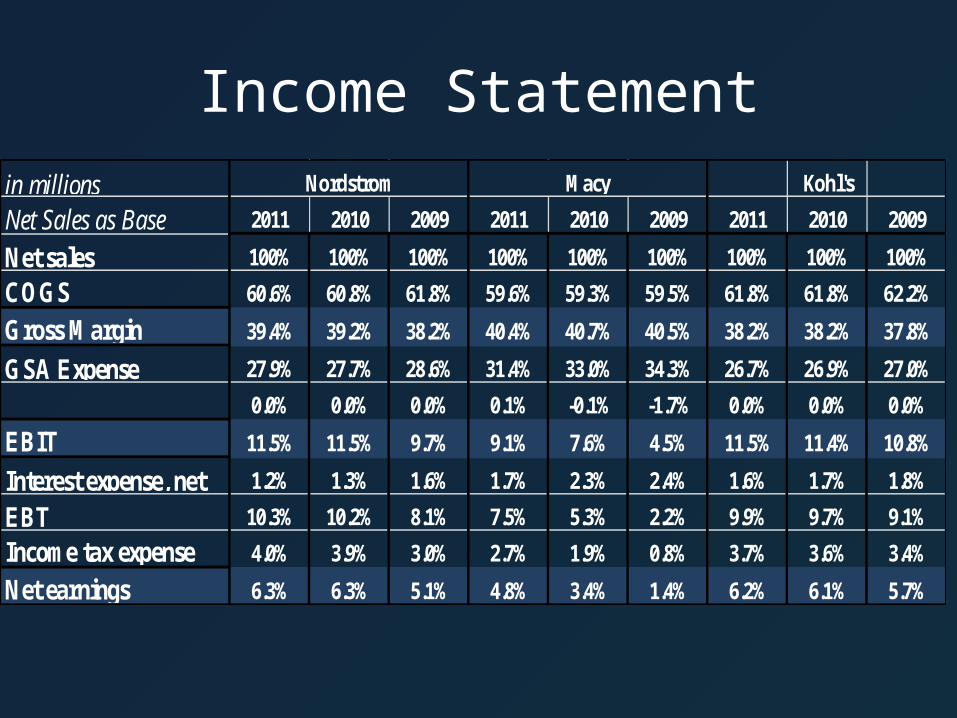
Income Statementin millions Kohl's
Net Sales as Base 2011 2010 2009 2011 2010 2009 2011 2010 2009
Net sales 100% 100% 100% 100% 100% 100% 100% 100% 100%
COGS 60.6% 60.8% 61.8% 59.6% 59.3% 59.5% 61.8% 61.8% 62.2%
Gross Margin 39.4% 39.2% 38.2% 40.4% 40.7% 40.5% 38.2% 38.2% 37.8%
GSA Expense 27.9% 27.7% 28.6% 31.4% 33.0% 34.3% 26.7% 26.9% 27.0%0.0% 0.0% 0.0% 0.1% -0.1% -1.7% 0.0% 0.0% 0.0%
EBIT 11.5% 11.5% 9.7% 9.1% 7.6% 4.5% 11.5% 11.4% 10.8%
Interest expense, net 1.2% 1.3% 1.6% 1.7% 2.3% 2.4% 1.6% 1.7% 1.8%
EBT 10.3% 10.2% 8.1% 7.5% 5.3% 2.2% 9.9% 9.7% 9.1%
Income tax expense 4.0% 3.9% 3.0% 2.7% 1.9% 0.8% 3.7% 3.6% 3.4%
Net earnings 6.3% 6.3% 5.1% 4.8% 3.4% 1.4% 6.2% 6.1% 5.7%
Nordstrom Macy

Balance SheetsASSETS: 2011 2010 2009 2011 2010 2009 2011 2010 2009Current assets:Cash and cash equivalents 22.1% 20.2% 12.1% 12.8% 7.1% 7.9% 8.5% 15.3% 17.2%Accounts receivable, net 23.9% 27.2% 30.9% 1.7% 1.9% 1.7% 0.0% 0.0% 0.0%Merchandise inventories 13.5% 13.1% 13.6% 23.4% 23.1% 21.7% 22.7% 20.4% 22.2%Current deferred tax assets, net 2.6% 3.2% 3.6% 0.0% 0.0% 0.0% 0.5% 0.5% 0.6%Prepaid expenses and other 3.3% 1.1% 1.3% 2.1% 1.4% 1.0% 2.1% 1.7% 1.7%Total current assets 65.5% 64.6% 61.6% 39.9% 33.4% 32.3% 33.9% 38.0% 41.7%Land, buildings and equipment, net 29.1% 31.1% 34.1% 38.0% 42.7% 44.6% 63.2% 58.5% 53.3%Goodwill 2.1% 0.7% 0.8% 16.9% 18.1% 17.6% 2.9% 3.5% 5.0%Other assets(add prepaid exp and deferred tax asset) 3.4% 3.6% 3.5% 5.2% 5.7% 5.5% 0.0% 0.0% 0.0%Total assets 100.0% 100.0% 100.0% 100.0% 100.0% 100.0% 100.0% 100.0% 100.0%
Nordstrom Macy's Kohl's

Balance Sheet cont.Current liabilities:Accounts payable 10.8% 11.3% 11.0% 7.2% 6.9% 6.2% 8.7% 7.7% 9.0%Accrued salaries, wages and related benefits (accrued liability) 4.6% 5.0% 5.1% 3.5% 2.9% 1.3% 8.0% 6.9% 7.6%Other current liabilities 15.0% 8.8% 14.5% 17.6% 14.4% 13.5% 1.6% 4.1% 1.5%Total current liabilities 30.3% 25.2% 30.6% 28.3% 24.2% 20.9% 18.4% 18.7% 18.2%Long-term debt, net 37.0% 37.2% 34.3% 30.0% 33.8% 39.7% 15.2% 10.1% 15.6%Other liabilities (add deferred prop incentives) 9.6% 10.5% 11.2% 14.9% 15.2% 17.5% 20.3% 18.3% 6.6%Total noncurrent liability 46.6% 47.7% 45.5% 45.0% 49.0% 57.2% 35.4% 28.4% 22.2%Total liability 77.0% 72.9% 76.1% 73.2% 73.2% 78.2% 53.8% 47.1% 40.3%Shareholders’ equity:Common stock& APIC 17.5% 15.7% 16.2% 24.4% 27.6% 26.7% 16.6% 15.0% 15.9%Retained earnings 6.1% 11.8% 8.0% 18.1% 14.5% 10.5% 72.3% 62.6% 64.1%Treasury Stock 0.0% 0.0% 0.0% -11.0% -11.8% -11.8% -42.4% -24.5% -20.1%Accumulated other comprehensive loss -0.5% -0.4% -0.3% -4.8% -3.5% -3.5% -0.4% -0.2% -0.3%Total shareholders’ equity 23.0% 27.1% 23.9% 26.8% 26.8% 21.8% 46.2% 52.9% 59.7%Total liabilities and shareholders’ equity 100.0% 100.0% 100.0% 100.0% 100.0% 100.0% 100.0% 100.0% 100.0%
Nordstrom Macy's Kohl's

Liquidity
2009 2010 20110
1
2
3
4
5
6
NordstromMacy'sKohl's
2009 2010 20110
0.5
1
1.5
2
2.5
3
Nordstrom
Macy's
Kohl's
2009 2010 20110
0.5
1
1.5
2
2.5
NordstromMacy'sKohl's
Inventory Turnover
Current Ratio
Quick Ratio

Long-term Debt Paying
2009 2010 201102468
1012
NordstromMacy'sKohl's
2009 2010 20110
0.51
1.52
2.53
3.54
NordstromMacy's Kohl's
2009 2010 20110
0.10.20.30.40.50.60.70.80.9
NordstromMacy'sKohl's
Times Interest Earned
Debt to Equity
Debt Ratio

Profitability
2009 2010 20110.36
0.37
0.38
0.39
0.4
0.41
0.42
NordstromMacy's Kohl's
2009 2010 20110
0.01
0.02
0.03
0.04
0.05
0.06
0.07
NordstromMacy'sKohl's
2009 2010 20110
0.05
0.1
0.15
0.2
0.25
NordstromMacy'sKohl's
Gross Profit Margin
Net Profit Margin
Return on Investment

Investor Analysis
2009 2010 20110
100
200
300
400
500
Nordstrom
Macy's
Kohl's
2009 2010 2011 -
50,000
100,000
150,000
200,000
250,000
NordstromMacy'sKohl's
Revenue per square feet
Revenue per employee

Investor Analysis
2009 2010 201102468
1012141618
NordstromMacy'sKohl's
2009 2010 201102468
101214161820
NordstromMacy'sKohl's
Market Cap(In billions)
Price/Earnings

Recommendation Rationale
Net profit Margin
Gross Margin
Inventory Turnover
Current Ratio
Acid Test
Debt Ratio
P/E
Revenues per sqr ft
Rev per employees
Sales growth rate
2 3 1
1 2 3
1 3 2
1 3 2
1 3 2
3 2 1
1 3 2
1 3 2
1 2 3
1 2 3
Nordstrom Macy’s Kohl’s Ranking3
2
1
1
1
3
3
2
2
1
28 49 37

Post PeriodNordstrom Macy's Kohl's
Inventory Turnover 5.93 3.17 3.54Current Ratio 2.28 1.55 1.86Acid Test 1.53 0.43 0.21Times Interest Earned 8.41 6.26 NEDebt Ratio 0.76 0.71 0.56Gross margin 38.82 40.26 36.25Net Profit Margin 6.24 4.82 5.1Return on Assets 8.72 6.1 6.93Market Cap(in billions) 12.23 19.22 11.72