growth focus discipline - eon.com · upper end of guidance +58% yoy. leverage target of 3.9x...
TRANSCRIPT
Creating the future of energy
March 13th, 2018
DisciplineFocusGrowth
http://www.energyfortomorrow.de/

• Focus: Europe’s first energy player with exclusive downstream focus
• Unique downstream footprint: RAB and customer numbers rise >60%1
• Earnings quality: network EBIT share rises to ~80%1
• Strong synergies: fading nuclear earnings overcompensated by €600-800m synergies
• Attractive dividends: aiming to deliver absolute annual dividend growth
• EPS accretion: from second year after closing
• Solid capital structure: high commitment to strong BBB rating
• Limited cash impact: acquisition of RWE‘s 76.8% in innogy via asset exchange; attractive offer to minority shareholders
2
FutureE.ON
~371, 3
EngieIberdrolaEnelNat. Grid
~501
IberdrolaEngieEnelFutureE.ON
Regulated Asset Base (RAB € bn)
Customer Numbers (m)
Iberdrola2Nat. Grid2Engie2Enel2
~51
FutureE.ON
EBIT (€ bn)
Creating the future of energy
1. Future E.ON pro-forma EBIT 2017 (innogy data based on public information), 2. Bloomberg Data, 3. RABs from different regulatory regimes are not directly comparable due to significant methodical differences.

Creating two focused energy companies
E.ON RWE
Future E.ON RWE16.67%
Target structure
Structure today~77% innogy
3

Acquisition of innogy via innovative asset exchange
innogy
76.8%(RWE)
23.2%(Min. share-
holders)
Total equity value: ~€22bn16.67% Stake in Future E.ON
(~€3.7bn)
E.ON & innogy Renewables&
Other Assets(~€13.5bn)1
Cash payment to E.ON (- €1.5bn)
Offer price and innogy dividend for 2017 and ’18 (~€5.2bn)
1. Acquisition of RWE‘s 76.8% stake in innogy via asset exchange
2. RWE to get in exchange:• 16.67% in new E.ON via 20% capital increase against
contribution in kind (authorized capital)• E.ON‘s and innogy‘s renewables businesses4
• Additional assets: E.ON’s minority stakes in two RWE operated nuclear power plants2, innogy’s gas storage business and minority participation in Kelag
3. RWE receives innogy dividends for 2017 and 20184. Net cash payment from RWE to E.ON of €1.5bn3
5. Attractive cash offer to minority shareholder in innogywith total value of €40.00 per share (offer price (€36.76) plus expected dividends of €3.24 per share for the two fiscal years 2017 & ’18 combined)
Asset exchange (limited cash impact)
Cash element
41. Equity value for transfer perimeter 2. Gundremmingen (25% stake) and Emsland (12.5% stake), 3. Payment to balance asset valuation. 4. Excludes 20% in Rampion and certain onshore capacity indirectly held by E.ON and innogy.
Innogy dividends (~€1.4bn)
Renewables11x EV/EBITDA

Upper end of guidance
+58% YoY
Leverage target of 3.9x achievedbefore monetization of Uniper
Payout ratio increased 2x since start of new E.ON
3-4% EBIT CAGR3
5-10% EPS CAGR3
Transacting from a position of strength
EBIT€3.1bn1
ANI€1.4bn1
END€19.2bn1
Dividend
Mid-term Growth
Group EBITDA
~€8bn2
Customer Solutions
>31mCustomers1
~50mCustomers2
Energy Networks
~€23bn RAB1, 4
~€37bn RAB2, 4
€5bn1
1. E.ON standalone 2017 reported, 2. Future E.ON pro-forma 2017 (innogy data based on public information), 3. 2018-2020 based on existing portfolio (E.ON standalone), 4. RABs from different regulatory regimes are not directly comparable due to significant methodical differences.
Regulated Non-regulated
E.ON today Future E.ON (’17)
5
E.ON today (’17)
E.ON standalone

Sweden1
~€4bn ~1m- ~7m1
NL/BE
- ~4m2
Germany3
~€20bn ~14m
CEE3
~€11bn4 ~13m
Turkey1
~€1bn ~9m
Unique downstream position across Europe
Energy Networks (RAB)
Customer Solutions (number of customers)
Southern Europe
- ~1m36
1. E.ON 2017 reported, 2. innogy2017 reported, 3. Future E.ON pro-forma 2017 (innogy data based on public information), 4. RABs from different regulatory regimes are not directly comparable due to significant methodical differences.
Excludes npower UK customers subject to transaction with SSE
UK
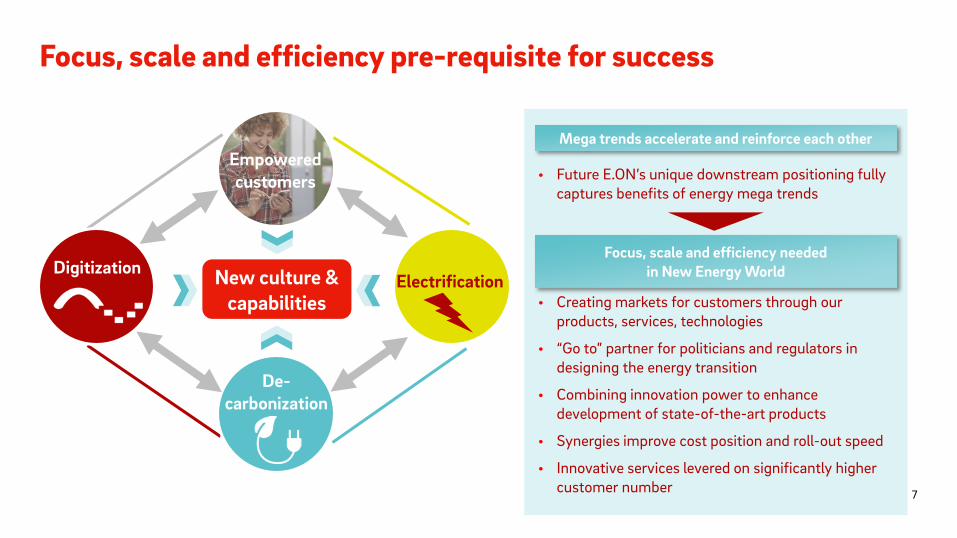
Focus, scale and efficiency pre-requisite for success
DigitizationElectrificationNew culture &
capabilities
Empoweredcustomers
De-carbonization
• Future E.ON’s unique downstream positioning fully captures benefits of energy mega trends
• Creating markets for customers through our products, services, technologies
• “Go to” partner for politicians and regulators in designing the energy transition
• Combining innovation power to enhance development of state-of-the-art products
• Synergies improve cost position and roll-out speed
• Innovative services levered on significantly higher customer number
Mega trends accelerate and reinforce each other
Focus, scale and efficiency needed in New Energy World
7

Spin-off Uniper& reset of E.ON
2016 2018 2020 and beyond
Position of strength
• Robust portfolio
• Strong financial & operational delivery
• Balance sheet headroom
Transition year
Acceleration of strategy execution
Unique strategic position
• Focus on high-performance regulated networks and state-of-the-art customer solutions
• Reduction of portfolio complexity
• Enhanced earnings quality: ~80% of EBIT1 is regulated
• Aiming to deliver absolute annual dividend growth
8
1. Future E.ON pro-forma 2017 (innogy data based on public information).

Potential for premium valuation
3
4
5
6
7
8
9
10
11
12
Value creation for shareholders
Instant redeployment of
capital
Renewables1
Platformfor high
Synergies (€600-800m)
Shareholder value
creation
91. Enterprise value (schematic).
Renewables11x EV/EBITDA
innogy acquisition at ~10x EV/EBITDA
Realization of valuation premium

Integration of innogy provides for strong synergy potential
2019 2020 2021 2022
Estimated synergies (€ m)2 Synergy focus1, 2
€600-800m
10
~55%
~25%
~5%
• Strong synergy potential of €600-800m
• 10-15% of controllable costs
• ~5000 FTEs affected (~7% of employee base)
Corporate Functions & IT
Energy Networks
Energy Sales & Customer Solutions
~100%
1. Synergy split (€ million), 2. Future E.ON pro-forma 2017 (innogy data based on public information).

~80%2
~65%1
Non-regulatedRegulated
E.ON today Future E.ON
Share of regulated network earnings (EBIT)
Attractive earnings & dividend profile secured long-term
11
Synergies to over-compensate fading nuclear earnings
0
1
2
3
4
5
6
E.ON stand-alone
EBIT development3
Enlarged E.ON
2018 2019 2020 2021 2022
1. E.ON 2017 reported, 2. Future E.ON pro-forma 2017 (innogy data based on public information), 3. Schematic illustration.

Future E.ON‘s key financials
12
EBITDA
EPS
EBIT
~€8bn1
~€5bn1
EPS accretion from second year after completion
DividendAiming to deliver absolute annual dividend growth
(fixed dividend for 2018: €0.433)
Customer Solutions
Energy Networks
Non-Core
~80% regulated2
1. Future E.ON pro-forma 2017 (innogy data based on public information), 2. Future E.ON pro-forma EBIT 2017 (innogy data based on public information), pie chart does not account for corporate functions & others, 3. Fixed for FY2018 (paid in 2019).

• Nuclear provisions: ~€0.9bn• AROs (Renewables): ~€0.9bn• Tax equity liabilities
(Renewables): ~€0.6bn• Pension provisions
(Renewables): ~€0.4bn
13
Pro forma economic net debt
Economic Net Debt 2017
~19.2
~10.6
~3.6
~5.0
E.ON today1 (€ bn)
Economic Net Debt 2017
~35
Asset-retirement obligationsProvisions for pensionsNet financial position
1. E.ON 2017 reported, 2. Future E.ON pro-forma 2017 (innogy data based on public information), 3. E.ON will address structural subordination post closing, 4. Nord Stream 1 stake.
~5+ Monetization of Uniper shares
+ Transfer of NS14 into CTA
Further deleveraging measures to be realized in ‘18 (€ bn)
Includes:• Acquisition of 23.2% minority shares • €1.5bn cash payment from RWE
Future E.ON2, 3 (€ bn)
~€2.8bn debt transferred to RWE
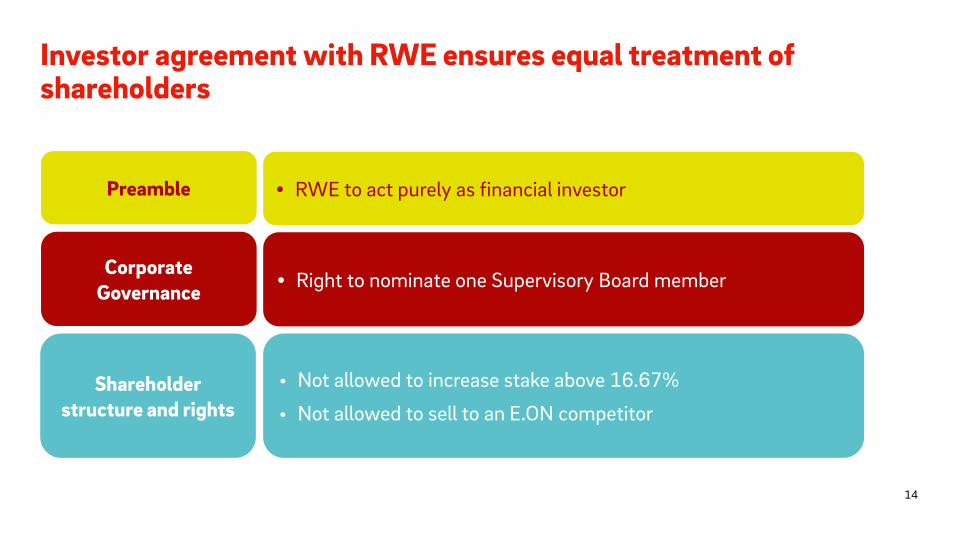
Investor agreement with RWE ensures equal treatment of shareholders
Preamble • RWE to act purely as financial investor
CorporateGovernance
Shareholder structure and rights
• Right to nominate one Supervisory Board member
• Not allowed to increase stake above 16.67%
• Not allowed to sell to an E.ON competitor
14

20192018 20212020
1. Payment to balance asset valuation, 2. Transfers of E.ON minority shares in the two RWE-operated nuclear power plants Gundremmingen (25% stake) and Emsland (12.5% stake) to RWE.
1st Closing• E.ON becomes ≥76.8%
shareholder in innogy• RWE becomes 16.67%
shareholder in E.ON (20% capital increase)
• €1.5bn cash payment to E.ON1
• Transfer of other assets2
2nd Closing• Transfer of E.ON and innogy RES Assets• Transfer of Kelag participation and gas storage assets of
innogyVoluntary public
takeover offer (PTO)(ca. May – July)
Clear path to obtain full control, irrespective of PTO acceptance rate
Antitrust approvalsFull legal integration
Integration & synergies
15

Investment highlights
Starting from position of strength: Creating the future of energy
Unique downstream positioning with ~80% regulated earnings1Focus
Aiming to deliver absolute annual dividend growthGrowth
Renewables value crystallization and €600-800m synergiesHigh commitment to strong BBB rating Discipline
161. Future E.ON pro-forma 2017 (innogy data based on public information).

Standalone strength
Dr. Johannes Teyssen – CEO and Dr. Marc Spieker - CFOMarch 13th, 2018
DisciplineFocusGrowth
E.ON standalone

Delivering step by step – Strategy & Operations
Portfolio reset completed
• €3.8bn Uniper disposal: decision to accept Fortum’s offer
• De-risking: transfer of nuclear storage liabilities to government
• €0.2bn proceeds: successful IPO of Enerjisa’sdownstream business
• + ~500MW onshore wind in US in 2017
• + ~130k customer in Q4 ’171 – turn-around achieved
• €400m delivery of Phoenix performance program
• ~€0.6bn nuclear decommissioning savings secured
• ~€1bn total contract value in B2B new solutions (2017)
• ~200% sales growth in PV/battery: fastest growing solar company in Germany
• Innovation & digitization: successful launch of new products
• E-mobility: gaining traction
New culture & capabilities Operational excellence
1. Germany and UK. 18
E.ON standalone

Each pillar with focused and disciplined growth
Customer Solutions Energy Networks Renewables
• Grow & sustain RAB• Develop transformative platform• Drive adjacent businesses
+~€2-3bn
E.ON power RAB
2017 2020
~€19bn
~€21-22bn
• Energy sales: reinvent with profitable customer growth
• New solutions: rapidly scale up• Heat: leverage existing positions
+~2m
Total Customer #
2017 2025
~22m
~24m
• Onshore: grow at scale• Offshore: leverage existing
options
+~2GW
E.ON operated capacity
~6GW
~8GW
2017 2020
19
E.ON standalone

Attractive stand-alone profile
Dividend growth
+40%
2017 2018
€0.30
EPS growth
+5-10% CAGR
€0.60 –0.70
2018 2020
EBIT growth
5.3GW
~8GW
2017 2020
2018 2020
Group CAGR: +3-4%
€2.8 –3.0bn
€0.431
20
Aiming to deliver absolute annual dividend growth
1. Fixed for FY2018 (paid in 2019).
E.ON standalone
Core CAGR: +5-6%

Drive value creation Absolute annual dividend growth
Sustainable & resilient EPS growth
Customer-led Digitization Operational excellence
Capitaldiscipline
E.ON‘s guiding principles
21
E.ON standalone
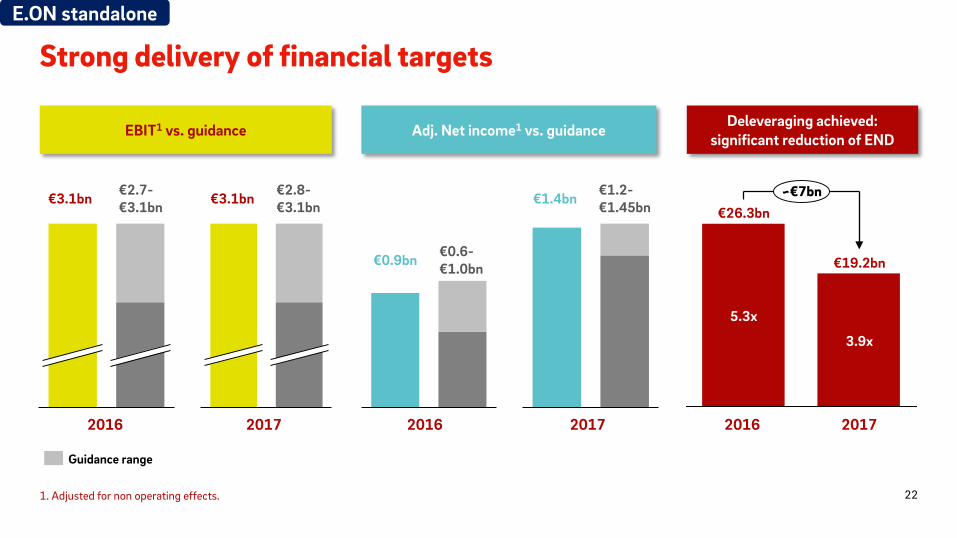
Strong delivery of financial targets
1. Adjusted for non operating effects.
2016 2017 2016 2017
~€7bn
€19.2bn
3.9x
€26.3bn
5.3x
2016 2017
€2.7-€3.1bn
€2.8-€3.1bn
€0.6-€1.0bn
€1.2-€1.45bn€3.1bn €3.1bn
€0.9bn
€1.4bn
EBIT1 vs. guidance Adj. Net income1 vs. guidance Deleveraging achieved:significant reduction of END
Guidance range
22
E.ON standalone

Deleveraging creates balance sheet headroom
Economic net debt
26.3
~4.4x EBITDA
~5.3x EBITDA
FY 16
21.5
FY 17Q2 17
~3.9x EBITDA
19.2
~5
1. Nord Stream 1 stake.
+ Nuclear fuel tax
+ Accelerated Book Build
+ Nuc. decommissioning cost savings
+ Additional measures
~2.9
~1.4
~0.6
~0.6
+ Monetization of Uniper shares
+ Transfer of NS11 into CTA
+ Nuc. decommissioning cost savings and additional measures
FY 17
19.2
~3.9x EBITDA
~3.0x EBITDA
Post deleveraging
headroom
~4.0xEBITDA
Mid-term target
Hybrid cancelled
Scrip dividendcancelled
€ bn
Achieved (€ bn) To be finalized (€ bn)
23
E.ON standalone

Disciplined capex drives EBIT growth
201920182017
EBIT driven up by additional capex (€ bn)
202020192018
New plan ~€9.5bn net capex1
~20%
1. Capex net of divestments.
EBIT flat within range (€ bn)
202020192018
2.8
3.1
2018 2019 2020
Group EBIT CAGR~3-4%
Core EBIT CAGR ~5-6%
Old plan ~€8bn net capex1
24
E.ON standalone

Capex split 2018-2020
Capex1 2018
1. Capex net of divestments.
1.0
1.0
1.5
RenewablesEnergy Networks Customer Solutions
~€ 3.5bn ~€ 9.5bn
Increase in capex drives the 5-6% EBIT growth target of the core business
Segments have to compete for capital and against other uses of funds
Strict adherence to return targets (ROCE 8-10%)
Growth
Focus
Discipline
25
E.ON standalone
Capex1 2018-2020
49%
26% 25%
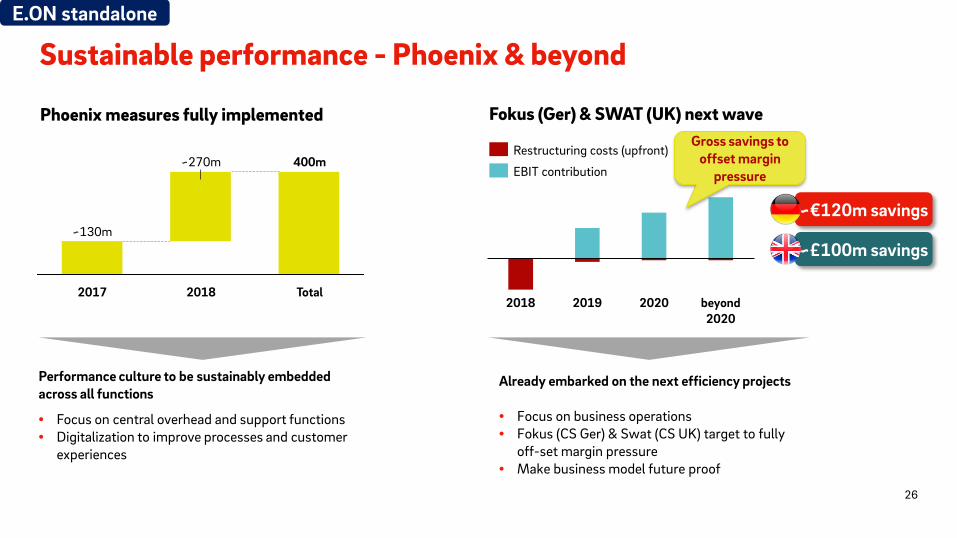
Sustainable performance - Phoenix & beyond
Fokus (Ger) & SWAT (UK) next wave
Already embarked on the next efficiency projects
• Focus on business operations• Fokus (CS Ger) & Swat (CS UK) target to fully
off-set margin pressure• Make business model future proof
202020192018 beyond 2020
Restructuring costs (upfront)
EBIT contribution
Gross savings to offset margin
pressure
~€120m savings
~£100m savings
Performance culture to be sustainably embedded across all functions
• Focus on central overhead and support functions• Digitalization to improve processes and customer
experiences
Phoenix measures fully implemented
2018
400m
~130m
Total2017
~270m
26
E.ON standalone

Group guidance FY 2018
EBIT 2017
Adj. Net Income 2017
1. Adjusted for non operating effects. 27
3.0
2.8
1.51.3
EBIT1 (€ bn)
Adj. Net Income (€ bn)
€3.1bn
€1.4bn
Includes ~€100m restructuring costs in Customer Solutions (UK, Germany)
2017
Act
uals
2018
Gui
danc
e
E.ON standalone
Guidance range

+ Offshore & Onshore: capacity additions– Onshore: subsidy expiries
+ Sweden: power tariff increase– Germany: reversal of regulatory effects, new
regulatory period gas, concession loss HH
+ Germany: Non-recurrence of a negative one-off effect in the prior year– Germany: restructuring costs– UK: competitive dynamics, restructuring costs, regulatory intervention
Segment EBIT guidance FY 2018Drivers for 20182018
Energy Networks
CustomerSolutions
Renewables
1. Adjusted for non operating effects, 2. Based on E.ON standalone EBIT 2017 pro forma figures, adjustments to reported figures: Turkey generation business reported under Non-Core (previously Energy Networks); German Heat business reported under Customer Solutions Other (previously Customer Solutions Germany); costs for digital products/services, innovative projects in Customer Solutions (previously Corp. Functions/Other).
Non-Core– PEL: lower hedged prices (-/+) Non-reoccurrence of one-off effects in 2017
EBIT1 2017€ bn
Pro forma2Actuals
1.9
0.5
0.5
0.5
2.0
0.5
0.5
0.4
28
E.ON standalone
Corp. Functions/ Other
+ Phoenix measures-0.3 -0.3

Attractive EBIT and EPS growth profile
Adj. EBITIllustrative
• Refinancing benefits of up to ~€200m1 (~2/3 effective in 2018)
• ~€4.5bn maturing bonds between 2018 –2020
5-10% p.a.
202020192018
Adj. Earnings per Share (EPS)
29
2019 20202018
Group EBIT CAGR~3-4%
Core EBIT CAGR ~5-6%
E.ON standalone
1. 2018 – 2020.

Delivering step by step – Attractive dividends
Absolute dividend growth 2018: Fixed Dividend
FY 2018Dividend
€0.431
FY 2017Dividend
€0.30
FY 2016 Dividend
€0.21
30
Aiming to deliver absolute annual dividend growth
1. Fixed for FY2018 (paid in 2019).
E.ON standalone

ReturnROCE1
8 – 10 %
E.ON FOCUS – medium-term framework Our basis for steering the company
1. Based on EBIT (= pre-tax), 2. OCFbIT divided by EBITDA, 3. Adjusted for non-operating effects, FY 2018 guidance range as basis for medium-term outlook 2018-2020, 4. Total Shareholder Return, 5. Fixed for FY2018 (paid in 2019).
CashCash conversion rate2
≥ 80 %
Executive CompensationClosely linked to EPS target achievement and relative TSR4 (in addition: share ownership obligations)
EPS3,4
Group+ 5-10%
Absolute dividend growth
Dividend Payout
Fixed dividend: €0.435EBIT3
Group+ 3-4%
31
Capital StructureStrong BBB/Baa
E.ON standalone

Investment highlights
From deleveraging to focused and disciplined growth
Management team with strong shareholder focusFocus
Deliver sustainable EPS growth andaiming for absolute annual dividend growthGrowth
Strict capital discipline and high-performance cultureDiscipline
32
E.ON standalone

Appendix

Energy Networks
DisciplineFocusGrowth
E.ON standalone

Energy Networks - The heart of E.ON
Power and gas business
Power business only
CEE &Turkey€8.5bn3
Sweden€4.0bn
Germany€10.7bn
~€23.1bn2
Regulated asset base 20171
CEE &Turkey€0.4bn
Sweden€0.5bn
~€1.9bn
Germany€1.1bn
EBIT4 2017
19 25 3212
71
27
Germany CEE & Turkey5Sweden
Market share (%)
349137
490
260
Germany Sweden
45
CEE & Turkey
Power Gas
Grid length (‘000 km) 1
∑ Grid length: 976
∑ Grid length: 107
1. 100% view for Slovakia and Turkey, 2. Differences may occur due to rounding, 3. In Hungary the RAB has been increased in 2017 by €2.8bn due to a system change towards replacement costs. It was €1.5bn before, 4. Adjusted for non operating effects, 5. Arithmetic average.
~75% of group core
35
E.ON standalone

Energy Networks - Higher capex leads to power RAB growth
2017 2020 2017 2020 2017 2020
Czech RepublicSwedenGermany
+6-10% +11-15% +12-16%
~€1.4bn~€3.8bn~€8bn
Power RABPower RABPower RAB
36
E.ON standalone

Multi-decade RAB growth engine
• Main driver is additional replacement investments
• Conservative assumptions on Renewables and E-mobility roll-out
• Acceleration of Renewables build-out• Smart meter• E-mobility• Electrical heating• Digital layer & fully digital equipment
Cautious planning
Potential upsides to “new normal”-level
+€300m –€400m
€1.4bn
2016 2017
€1.4bn
€1.7 – 1.8bn
Beyond 2020“New normal”
Disciplined & gradual ramp-up
Energy Networks capex1
371. Excluding Slovakia and Turkey.
E.ON standalone

Major transformation in Energy Networks
38
Single layer infrastructure (energy)
Physical linear network
Centralized system
Infrastructure ecosystem
Decentral, connected multi-layer infrastructure
More (semi-) autonomous local energy systems
Energy Network player
Energy network operatorFrom
Holistic system providerTo
Phys
ical
la
yer
Dig
ital l
ayer
Com
mun
i-ca
tion
laye
r
Data centerEMS Platforms
Network control center
Smart Home
Asset control systems
VPP
Local grid control
Smart Meter
Cloud
AntennaWifi
Block chain
Future energy network system will need to combine different layers of infrastructure
E.ON standalone

Turkey with extraordinary high RAB growth
Established in 3 high-growth regions
Leading electricity network operator: − 10.5 m connections− 220,000 km network length
(20% of market)
Constructive regulatory environment:− Allowed WACC for 2016-2020
regulatory period has been increased to 13.6% from 11.9% (pre-tax, real)
− Incentives to outperform capex, opex, and theft & loss allowances
High network investment due to:− Strong power demand growth of
>4% p.a.− Need for significant network
modernization
in bn TL, nominal
Regions
Target to more than double 2016 RAB by 2020
Downstream Business Market & Regulation RAB development
Strongly growing market with highly attractive returns
AnkaraIstanbul
Adana
>2x
3.8
5.3
2016 2017 2020
39
E.ON standalone

Operational excellence – digitization in practice
Transparent and effective capex allocation Providing a smooth user experience
Asset replacement decisions Digital workforce
Data driven decisions to prioritize replacement
activities
Low double digit million € added value p.a. potential after full roll-out
Expert judgement and local experience
Predictive maintenance Conventional approach
6-12 % productivity gains
Introduce digital application used by every field worker comprising all functionalities necessary in the daily work
Tool
Impa
ct
40
E.ON standalone

Aspiration to develop the platform for energy transition
41
Further decentralization and
fragmentation lead to a need for
local rebalancing
Transformative Platform
P2PTrading
Flex-Markets
LocalEnergy System
RegionalEnergySystem
Increasing system responsibility assumed by regional or local network operator
Energy transition is and will be happening essentially at the DSO-level
E.ON standalone

Opportunities in adjacent businesses - Broadband
42
Growing from existing assets
E.ON's existing fiber-optic infrastructureE.ON's new fiber-optic infrastructure
A
Local transformer station
Fiber-optic cables in every street and to every household
Network operations center
Business building
Mobile cell tower
Telco X'sbackbone
Enterprise customer's data center
Point of Presence (Switch between backbone and access network)
Extension of existing business
Entering Fiber-to-the-Home (FttH) marketB
New business concept in development
E.ON standalone

• Lower allowed returns reflect lower bond yields
• Benefits from maturing legacy bonds to be attributed to Energy Networks driving EPS growth
EBIT outlook – Stability despite two major regulatory reviews
43
German pension cost pass through
Positive one-off
2017 2018 2019 2020
€1.9bn
Lower allowed returns
Higher RAB
+5-10% p.a.
€0.60 –0.70
2018 2020
EPS growth
E.ON standalone

Customer Solutions
DisciplineFocusGrowth
E.ON standalone

Energy sales is the anchor of customer solutions
1. Excluding Turkey, 2. Total Contract Value, 3. Adjusted for non operating effects, 4. B2C customers in Germany and UK.
E.ON’s market positions
Customer
B2B
B2C
B2M
Customer focused portfolio
Heat &New
Solutions
EnergySales
EBIT3 2017 €526m Energy Sales EBIT4
B2C ~75%
B2B~25%
Energy Sales is the anchor business
High customer loyalty
Customer tenure4
> 5y
< 2y
2-5y
B2M/Heat: 10% market share in Germany & Sweden
B2B Solutions: ~€1bn TCV2 in 2017
Top 3
Top 2
Top 3
Top 3Top 3
Top 3
Top 10
Top 3
Energy Sales: 22m1 customers in 8 countries
45
E.ON standalone

7
6
5
4
Q4 17Q3 17Q2 17Q1 17Q4 16Q3 16Q2 16Q1 16
UK B2C customersUK SVT customers
2013 2014 2015 2016 2017
6
8
4
2
UK
E.ON is leading the transformation of energy sales
4646
Standard tariff customer numbers declining
Cust
omer
ac
coun
tsin
m
2016 year of peak margins1
% m
argi
n Rigorous cost focusReduce cost to acquire and cost
to serve dramatically
Attractive productsInnovative and green tariffs
complemented by smart meter rollout
Focused sales channels
Protecting revenues
Turnaround in customer numbers
Increasing EBIT into
next decade
6.3m
1. Final figure for 2017 not yet available: ~5%.
E.ON standalone

Increase customer attraction while reducing cost to acquire
Physical channel Digital channel
Product offering and selection of sales channels lead to…
…at the same time reducing costs to acquire
…increase in customer numbers…
2017 2025
Sale
s ch
anne
lsTa
riff i
nnov
atio
ns
200k innovative tariffs sold since June 2017
> 5,000 E.ON Plus products (devices as add-on to tariffs) sold
18% of our customer base with add-on services
+100% value-add services contracts in 2017
Scale sales cooperations with big retailers (e.g. Lidl) • Innovative tariff offering• Focus on earning customers’ loyalty
Sales push in digital• From broker site to own website e.g. GER, UK, SWE
Home move journey as acquisition channel
~22m
~24m
47
E.ON standalone

Closing the gap - Cost to serve to be reduced dramatically
48
Components of cost to serve1
Other
Metering & Installation
Debtresolution
Servicingand
Backoffice
SWAT
Fokus
Smart Meter Rollout
E.ON ambitionE.ON
~€120m savings
€/customer account
~£100m savings
Cost to serve ambitionEfficiency programsMeasures to reduce cost to serve
1. Example UK.
Tackling cost to serve and overall cost efficiencies to support earnings
E.ON standalone

Re-inventing our customer business with the digital attacker
Cost efficiency
Superior services
Innovative proposition
<€ 10Market Leading
Cost to Serve
Synergiesacross regions
1-clickCustomer
journey
+50 NPS1
Quick response &
accurate billing
Singleplatform for
tariff innovations
Datadriven
propositions
Fasttime to market
Selflearning
functionality
Market leading
cost of change
Gradual replacement of legacy systems – customer focused with proven stability
1. Net Promoter Score. 49
E.ON standalone

New Solutions - Strive for leadership with innovative products
1. Adjusted for non operating effects.
B2B B2M B2C
PV + battery
Smart home
Smart meter
E-mobility
Prod
uct o
ffer
ing
Am
bitio
n 20
25
EBIT1 ~€250-300 m EBIT1 ~€200 m EBIT1 >~€50 m
EBIT margin > 10%
District heating
City quarter solutions
Integrated city energy solutions
Decentral generation
Energy efficiency
Flexibility & storage
Digital energy solutions
50
E.ON standalone

~>2 x
2025
~2 x
2016 2020…2017
Become a leading Energy Service Company
B2B - E.ON to become a leading Energy Service Company in Europe
Ambitious organic growth of TCV1 … …to translate into EBIT2 over time
1. Total Contract Value, 2. Adjusted for non operating effects.
Decentral generation
Energy efficiency
Flexibility & storage
Digital energy solutions
~ €250-300m
51
2016 2017 2020 2025
~+25% CAGR
E.ON standalone

B2M – E.ON is a reliable partner for cities and communities
52
E.ON to benefit from market trends and investments
1. Germany, Sweden, UK, 2. Capex net of divestments, including investments for Högbytorp, 3. Adjusted for non operating effects.
Investments with low risk and high return
Capex2 2018-2020ROCE > 10%
Stable (long-term) earnings
15-20 year contracts
2025
~€200m
2017
UKGermanySweden
Heat EBIT3 €m
~€ 800m
ectogrid™
Högbytorp, Stockholm
> €250m capex project close to Stockholm, COD 2019
100 MW CHP district heating network extension and biogas as part of a circular economy project
Can provide heating and cooling for an entire city, optimising excess heating and cooling
First ectogrid under construction in Lund, Sweden
Patented global solution - available to be sold and integrated in other cities
Project examples
E.ON standalone

B2C - E.ON drives the electrification of the home and mobility
PV + batteryE.ON SolarCloud
E.ON Plus + smart meters
E-mobilitysolutions
Home heating
Example: PV + battery growth story
Translating into decent EBIT in the next decade
beyond2025
~€50m
2017
E.ON product offering for the electrification of home
201720162015
~3x
~5x
2025…
EBIT1 €m
PV + battery units sold
E.ON – the fastest growing solar
company in Germany
1. Adjusted for non operating effects. 53
E.ON standalone

Temporary high investments for smart meter & IT
Disciplined investment plan to support growth opportunities
Capex1 2018-2020 €2.4bn
1. Capex net of divestments, 2. Adjusted for non operating effects.
€526mHeat &
New Solutions
2025…20202018
Restructuringcharges
2017
Customer Solutions EBIT2 2017-2020
Medium-term EBIT development
Energy Sales
Heat & B2B projects
Smartmeter
IT &efficiency
Other
E-mob
Partially temporary
Asset-backedinvestments
54
E.ON standalone

Renewables
DisciplineFocusGrowth
E.ON standalone
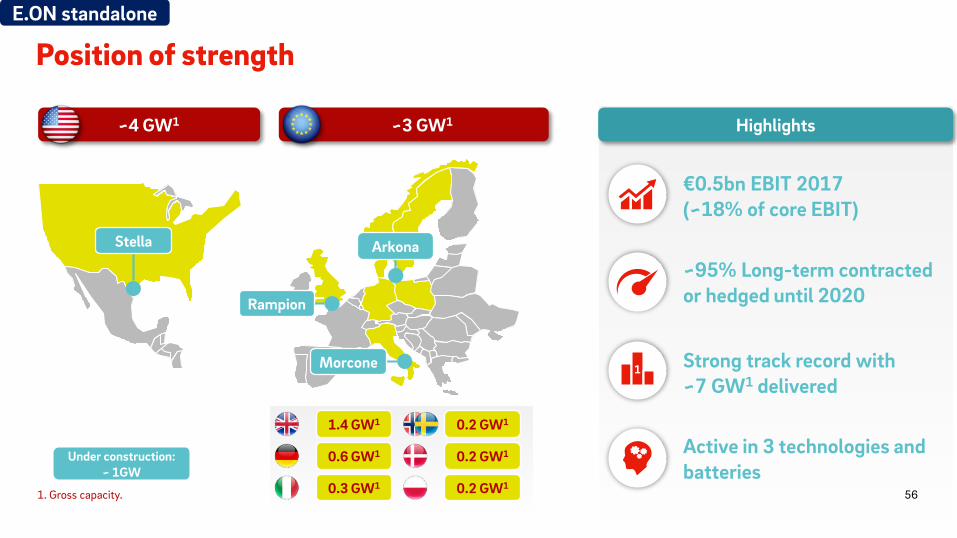
Position of strength
~4 GW1 ~3 GW1
Arkona
Rampion
Morcone
Under construction:~ 1GW
1.4 GW1
0.6 GW1
0.3 GW1
0.2 GW1
0.2 GW1
0.2 GW1
Stella
€0.5bn EBIT 2017(~18% of core EBIT)
~95% Long-term contracted or hedged until 2020
Strong track record with ~7 GW1 delivered
Active in 3 technologies and batteries
1
Highlights
561. Gross capacity.
E.ON standalone

Growth trend unbroken – RES to dominate global power generation
7 GW17 GW
CCGT
38 GW
Utility-scale PV
59 GW
Onshore
44 GW
Offshore Nuclear
Capacity additions forecastAnnual build rate avg. 2018-’301
~300 turbines per week
Strong cost decrease
Industry trends Bid prices per technology(EUR/MWh)
55
201720162015
103109
66
43
20162015 2017
Offshore Onshore
merchant2Decarbonization
571. Bloomberg New Energy Outlook 2017, 2. German Power Baseload forward 2019 (08.03.2018).
E.ON standalone

E.ON aims to grow at scale in Onshore
2017 2020
Onshore
+20-25%
Capitalize on attractive ~8 GW pipeline
~5 GW1
2017 2020
Offshore
+40%2
Leverage existing options in Europe
~1 GW1
1. Operated capacity 2. ~400MW net capacity addition. Gross capacity addition: 800MW.
• From boutique to industrial
• Capex light
Solar PV
58
E.ON standalone

High share of contracted revenues provides stability and visibility
2017 2018 2019 2020
• High earnings stability
• Secure long-term stable off-take agreements for new investments
• Revenue optimization for assets at the end of support scheme (rolling 3 year hedging)
• Active commercial risk management/value optimization incl. congestion hedging, day-ahead/intra-day optimization
Long-term contractedMerchant Hedged
High earnings stability and visibility Clear guiding principles
~75% long-term contracted1
~95% hedged or long-term contracted1
591. Average 2017 – 2020.
E.ON standalone

Integral part of E.ON - Modular value crystallization
Develop & Sell & (Operate) Build & Sell & Operate Build & Keep
• Rapid monetization of value• Capex light • Additional value from long-term
O&M services
• Reduce exposure in certain geographies
• Additional value from long-term O&M services
• Resilient long-term cash flows• Strong operational capabilities ensure
E.ON being an efficient asset owner
AftonMagic Valley 12
Amrumbank
Deal value: ~$100m1
Year: 2016Sold: 100%Cap.: 50 MW
Deal value: ~$650mYear: 2014Sold: 80%Cap.: 405 MW
Capex: ~€1bnCOD: 2015Cap.: 302 MW
Case
stu
dies
Wildcat 13
601. InfraRed Capital Partners, 2. Magic Valley 1: 203MW, 3. Wildcat 1: 202MW.
E.ON standalone

Technical/digital excellence to drive down LCOE1
Extension of life-time
Improved load factors and availability
Transparent and effective capex and opex allocation
1
Predictive maintenance roll-out
2017 2018 2019 2020
10%60%
Self-learning algorithms to optimize
wind park layout in order to increase
production and reduce wake effects
Array layout optimizer
Turbine selection tailored to site conditions
Data driven investment decision
Single digit yield increase
61
E.ON standalone
1. Levelized cost of electricity.

Play at scale in Onshore - Attractive pipeline in Tier 1 geographies
Gross capacity additions 2018-2020 (MW) Onshore pipeline
~5.9 GW
100% PTC
80% PTC
Other
Onshore pipeline
~1.8 GW
∑~2GW
UK
Nordic
Other EU
COD2016
COD2017
COD2018
COD2019
COD2020
Onshore Offshore1, 2 New Projects(Pre- FID pipeline)
621. 2018 COD: Rampion (Gross delivery: 400 MW, EU Offshore), Stella (Gross delivery: 201 MW, US Onshore) 2. 2019 COD: Arkona(Gross delivery: 385 MW, EU Offshore), Morcone (Gross delivery: 57 MW, EU Onshore).
E.ON standalone

Financial Appendix
DisciplineFocusGrowth
E.ON standalone

Highly stable business profile
Business profile
High share of regulated and long-term contracted earnings (~3/4 of EBITDA)
Predominantly quasi-regulated or contracted earnings in heat operations and RenewablesRemaining merchant exposure in Renewables and PreussenElektra largely hedged
Operations in Energy Networks under stable, well established frameworks in low risk markets with strong regulatory track record
FY EBITDA 20171
~3/4 from regulated/long-term contracted businesses2
1. Adjusted for non operating effects, representation in pie charts excluding Corporate Functions/ Other; total figure including Corporate Functions/ Other, 2. Including Energy Networks and a portion of Renewables and Heat.
15%
16%
56%
13%
Renewables
PreussenElektra (non-core)
Customer Solutions
Energy Networks
€5.0bn
64
E.ON standalone

E.ON today – Regulated Energy Networks at the heart
Key financials2017
Group EBIT1
Adj. Net Income1
€1.4bn
€3.1bn
Customer Solutions
€1.9bn€0.5bn €0.5bn
1. Adjusted for non operating effects, 2. Percentage as of Group EBIT.
Core EBIT1 2017 Share of regulated/long-term contracted
businesses2
Energy Networks Renewables
Regulated/contracted
Merchant
Strong pillars with Customer Solutions and Renewables
65
E.ON standalone

2017 yet another year of strong delivery
Highlights Key Financials1
€ m
1. Adjusted for non operating effects.
EBIT Adj. Net Income
Economic Net Debt
26.3
FY 2016 FY 2017
19.2
-7.1
EBIT and Adj. Net Income at the upper end of the guidance range
Adj. Net Income + 58% versus FY 2016
Economic net debt reduced to €19.2bn
Dividend 2017 of €0.30/share confirmed
€ m
€ bn
Guidance range EBITDA €2.8-3.1bn, Adj. Net Income 1.2-1.45bn
FY 2016 FY 2017
3,112 3,074
904
FY 2017FY 2016
1,427
+58%
66
E.ON standalone

E.ON Investor Relations contacts
T +49 (201) 184 [email protected]
Alexander Karnick T+49 (201) 184 28 38Head of Investor Relations [email protected]
Martina Burger T +49 (201) 184 28 07Manager Investor Relations [email protected]
Dr. Stephan Schönefuß T +49 (201) 184 28 22Manager Investor Relations [email protected]
Andreas Thielen T +49 (201) 184 28 15Manager Investor Relations [email protected]
67

Financial calendar & important links
Financial calendar
May 8, 2018 Quarterly Statement: January – March 2018
May 9, 2018 2018 Annual Shareholders Meeting
May 14, 2018 Dividend Payment
August 8, 2018 Half-Year Financial Report: January – June 2018
November 14, 2018 Quarterly Statement: January – September 2018
March 13, 2019 Annual Report 2018
Important links
Presentations https://www.eon.com/en/investor-relations/presentations.html
Annual Reports https://www.eon.com/en/investor-relations/financial-publications/annual-report.html
Interim Reports https://www.eon.com/en/investor-relations/financial-publications/interim-report.html
Shareholder Meeting https://www.eon.com/en/investor-relations/shareholders-meeting.html
Bonds / Creditor Relations https://www.eon.com/en/investor-relations/bonds.html
68
Transaction Website: http://www.energyfortomorrow.de/

DisclaimerThis presentation contains information relating to E.ON Group (“E.ON") that must not be relied upon for any purpose and may not be redistributed, reproduced,published, or passed on to any other person or used in whole or in part for any other purpose. By accessing this document you agree to abide by the limitations set outin this document.This document is being presented solely for informational purposes. It should not be treated as giving investment advice, nor is it intended to provide the basis for anyevaluation or any securities and should not be considered as a recommendation that any person should purchase, hold or dispose of any shares or other securities. Thispresentation is in particular neither an offer to purchase nor a solicitation of an offer to sell shares in innogy SE. The final terms and further provisions regarding thetakeover offer by E.ON Verwaltungs SE to the shareholders of innogy SE will be set forth in the offer document which will be published upon approval of its publicationby the German Federal Financial Supervisory Authority. Investors and shareholders in innogy SE are strongly recommended to read the offer document and allannouncements and documents published in connection with the takeover offer, since they will contain important information.The information contained in this presentation may comprise financial and similar information which is neither audited nor reviewed and should be consideredpreliminary and subject to change.Some of the information presented herein is based on statements by third parties. No representation or warranty, express or implied, is made as to, and no relianceshould be placed on, the fairness, accuracy, completeness or correctness of this information or any other information or opinions contained herein, for any purposewhatsoever.This announcement may contain statements about E.ON or innogy SE that are or may be “forward-looking statements”. Forward-looking statements include, withoutlimitation, statements that typically contain words such as “anticipate”, “target”, “expect”, “estimate”, “intend”, “plan”, “believe”, “hope”, “aims”, “continue”, “will”,“may”, “should”, “would”, “could”, or other words of similar meaning. By their nature, forward-looking statements involve risks and uncertainties because they relate toevents and depend on circumstances that may or may not occur in the future. E.ON cautions you that forward-looking statements are not guarantees of the occurrenceof such future events or of future performance and that in particular the actual results of operations, financial condition and liquidity, the development of the industry inwhich E.ON and innogy SE operate and the outcome or impact of the proposed acquisition on E.ON and/or innogy SE may differ materially from those made in orsuggested by the forward-looking statements contained in this announcement. Any forward-looking statements speak only as at the date of this announcement.Neither E.ON nor any respective agents of E.ON undertake any obligation to provide the recipient with access to any additional information or to update thispresentation or any information or to correct any inaccuracies in any such information.
69