facts & figures 2018 - eon.com · 2. regulated asset base 2017. 1. cee & 25 turkey ....
TRANSCRIPT
Facts & Figures 2018

Content
1. Overview
2. Energy Networks
3. Customer Solutions
4. Renewables
5. PreussenElektra
6. Other
7. Financials
2
7
43
58
84
90
92
3
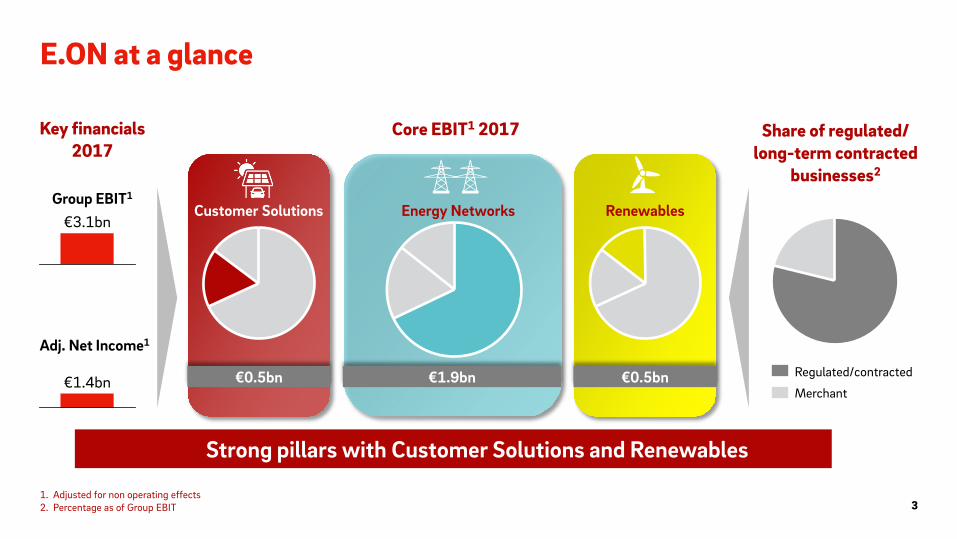
E.ON at a glance
Customer Solutions
1. Adjusted for non operating effects 2. Percentage as of Group EBIT
€1.4bn
€3.1bn Customer Solutions
€1.9bn €0.5bn €0.5bn
Core EBIT1 2017
Energy Networks Renewables
Regulated/contracted
Merchant
Strong pillars with Customer Solutions and Renewables
Key financials 2017
Share of regulated/ long-term contracted
businesses2
Group EBIT1
Adj. Net Income1

CEE1/ Turkey
Offshore Wind/ Other
Onshore Wind/ PV2
E.ON portfolio
4
Renewables
PreussenElektra
Core businesses Non-core business
Energy Networks
Germany
Sweden
Customer Solutions Germany
UK
Other
1. Central and Eastern Europe2. Photovoltaic
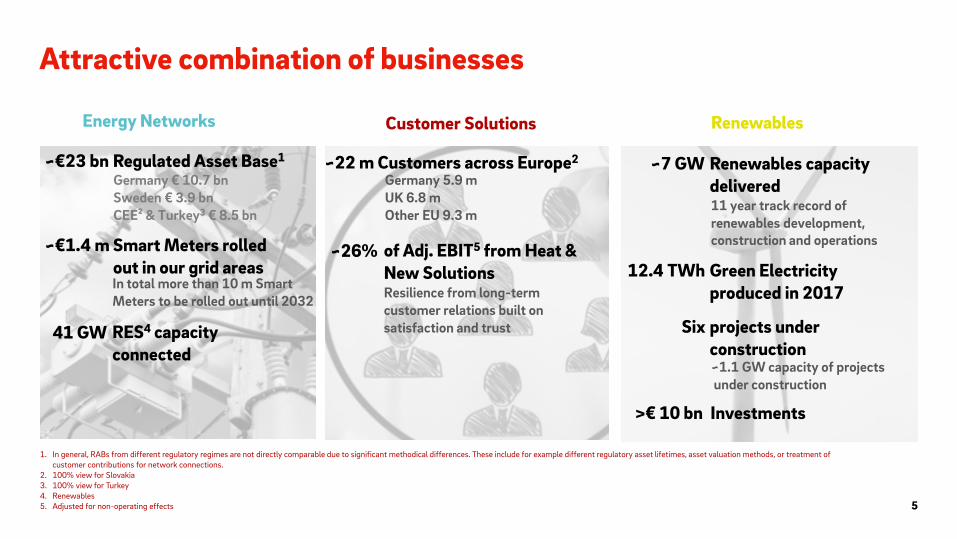
Attractive combination of businesses
5
1. In general, RABs from different regulatory regimes are not directly comparable due to significant methodical differences. These include for example different regulatory asset lifetimes, asset valuation methods, or treatment of customer contributions for network connections.
2. 100% view for Slovakia 3. 100% view for Turkey 4. Renewables 5. Adjusted for non-operating effects
Energy Networks Renewables Customer Solutions
~22 m Customers across Europe2 Germany 5.9 m UK 6.8 m Other EU 9.3 m
of Adj. EBIT5 from Heat & New Solutions Resilience from long-term customer relations built on satisfaction and trust
~26%
11 year track record of renewables development, construction and operations
~1.1 GW capacity of projects under construction
Germany € 10.7 bn Sweden € 3.9 bn CEE² & Turkey3 € 8.5 bn
RES4 capacity connected
41 GW
~7 GW Renewables capacity delivered
12.4 TWh Green Electricity produced in 2017
Six projects under construction
>€ 10 bn Investments
~€23 bn Regulated Asset Base1
~€1.4 m Smart Meters rolled out in our grid areas In total more than 10 m Smart Meters to be rolled out until 2032

Energy Networks Renewables Sustainability & HSE Procurement Consulting PreussenElektra, Enerjisa Üretim
E.ON Board of Management
6
Strategy & Portfolio Communications & Political Affairs Legal & Compliance Group HR / Executive HR Corporate Audit
Johannes Teyssen Chief Executive Officer
Risk, Accounting & Controlling Group Finance Investor Relations Mergers & Acquisitions and Participation
Management Tax
Marc Spieker Chief Financial Officer
Customer Solutions Market Excellence Solutions Management B2C & Innovation Solutions Management B2B B2M Global Energy Management Marketing Digital IT
Karsten Wildberger Chief Operating Officer Commercial
Leonhard Birnbaum Chief Operating Officer Networks & Renewables

Content
1. Overview
2. Energy Networks
3. Customer Solutions
4. Renewables
5. PreussenElektra
6. Other
7. Financials
2
7
43
58
84
90
92

Energy Networks
8
Energy Networks
Power and gas business
Power business only
CEE & Turkey
€8.5bn3
Sweden €4.0bn
Germany €10.7bn
~€23.1bn2
Regulated asset base 20171
CEE & Turkey €0.4bn
Sweden €0.5bn
~€1.9bn
Germany €1.1bn
EBIT4 2017
25 32
71
2719 12
Germany CEE & Turkey5 Sweden
Market share (%)
349490
137 452
Sweden CEE & Turkey Germany
60
Gas Power
Grid length (‘000 km) 1
∑ Grid length: 976
∑ Grid length: 107
1. 100% view for Slovakia and Turkey 2. Differences may occur due to rounding 3. In Hungary the RAB has been increased in 2017 by €2.8bn due to a system change towards replacement costs. It was €1.5bn before. 4. Adjusted for non operating effects. 5. Arithmetic average
~75% of group core
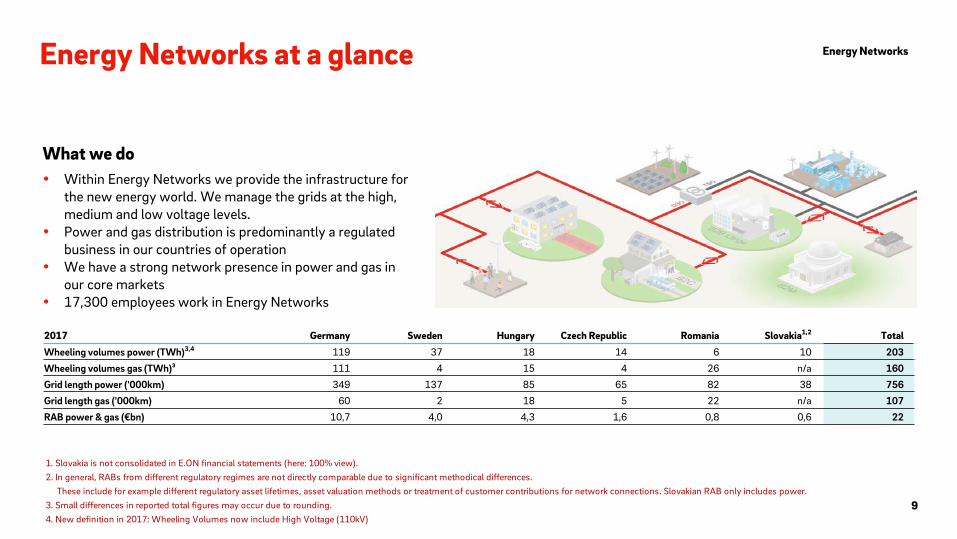
Energy Networks at a glance
9
What we do
Energy Networks
Within Energy Networks we provide the infrastructure for the new energy world. We manage the grids at the high, medium and low voltage levels.
Power and gas distribution is predominantly a regulated business in our countries of operation
We have a strong network presence in power and gas in our core markets
17,300 employees work in Energy Networks
2017 Germany Sweden Hungary Czech Republic Romania Slovakia1,2 Total
Wheeling volumes power (TWh)3,4 119 37 18 14 6 10 203
Wheeling volumes gas (TWh)³ 111 4 15 4 26 n/a 160
Grid length power ('000km) 349 137 85 65 82 38 756
Grid length gas ('000km) 60 2 18 5 22 n/a 107
RAB power & gas (€bn) 10,7 4,0 4,3 1,6 0,8 0,6 22
1. Slovakia is not consolidated in E.ON financial statements (here: 100% view). 2. In general, RABs from different regulatory regimes are not directly comparable due to significant methodical differences. These include for example different regulatory asset lifetimes, asset valuation methods or treatment of customer contributions for network connections. Slovakian RAB only includes power.3. Small differences in reported total figures may occur due to rounding.4. New definition in 2017: Wheeling Volumes now include High Voltage (110kV)

Energy Networks: Financial highlights
10
Energy Networks
2016 2017
€m Germany Sweden CEE/Turkey1 Total Germany Sweden CEE/Turkey1 Total
Revenues 13.205 1.029 1.658 15.892 14.199 1.072 1.719 16.990
Adjusted EBITDA2 1.507 562 610 2.679 1.641 632 654 2.927
Adjusted EBIT2 894 398 379 1.671 1.050 474 417 1.941
Investments (cash-effective) 846 291 282 1.419 702 345 371 1.418
Regulatory D&A3 477 278 365 1.120 477 282 382 1.141
1. Turkey included as an at equity participation (i.e. with net income result)2. Adjusted for non-operating effects3. Turkey not included; Slovakia 100% view

Energy Networks GER – Results from participations 2017
11
Company Contribution to E.ON result 2017 (€m)
Energy Networks At equity consolidation 74 Städtische Werke Magdeburg GmbH & Co. KG 17 Energie und Wasser Potsdam GmbH 11 GASAG AG 9 REWAG Regensburger Energie- und Wasserversorgung AG & Co. KG 8 Stadtwerke Brandenburg an der Havel GmbH & Co. KG 6 Gasversorgung Unterfranken GmbH 5 SWS Energie GmbH 5 LSW Holding GmbH & Co. KG 4 Other 9 At cost consolidation 43 SERVICE plus GmbH 7 GasLINE Telekommunikationsnetzgesellschaft deutscher Gasversorgungsunternehmen mbH & Co. KG. 4 ENACO Energieanlagen- und Kommunikationstechnik GmbH 3 infra fürth GmbH 3 Other 26

Upcoming regulatory periods
12 1. Discussions over estimated length of period still ongoing
2024 2022 2020
Power
Gas
Germany 2019 - 2023
2021 2019 2023
Germany 2023 - 2027
Sweden 2020 - 2023
Hungary 2021 - 2024
Romania 2019 - 20221
Czech Republic 2021 - 20251
Czech Republic 2021 - 20251
Energy Networks
Slovakia 2022 - 2026
2025 2026 2027 2028
Hungary 2021 - 2024
Romania 2019 - 20231
Content
1. Overview
2. Energy Networks
2.1 Germany
3. Customer Solutions
4. Renewables
5. PreussenElektra
6. Other
7. Financials
2
7
13
43
58
84
90
92

Energy Networks: Germany
14
Energy Networks
1. Lastest figures dated December 12, 2016
4. Pro forma RAB - not applicable for current regulatory period in power and gas; applicable RAB for current regulatory period is RAB of year 2011 (power) / 2010 (gas): €10bn3. New definition in 2017: Wheeling Volumes now include High Voltage (110kV); 2016 retroactively adjusted 2. Readjusted to reflect latest available market data
Germany 2016 2017 2016 2017 Grid length Grid conduct
Power ('000km)1 349 349 Wheeling volumes power (TWh)3 117 119 Market share (%) 19 19 Wheeling volumes gas (TWh) 107 111
Gas ('000km)1 60 60 RAB power & gas (€bn)4 10,7 10,7 Market share (%) 12² 12
Major shareholdings
Avacon AG 61,5% E.DIS AG 67,0% HanseWerk AG 66,5% Bayernwerk AG 100%

• The German networks business is based on long-term concessions granted by municipalities in the network area
• Maximum period of concession contract is 20 years
German business with 5,400 concessions
15 1. Includes for example 110 kV grid and meters
10%
10 - 15 years
35%
5 - 10 years
35% 15%
currently open
5%
2037
Renewal rate in % of revenue cap
TODAY
Existing concessions Good track record in the past
>15 years <5 years
~ 30%
Non-concession based RAB1
Concession based RAB
~ 70%
Energy Networks

Regulatory environment Germany: Power & Gas
16
1. Please note, that the information provided is a simplified version of the German regulatory framework. 2. 1.5% is the applicable factor for the current regulatory period (2nd). This factor was adjusted for the next (3rd) regulatory period to 0.49% for gas. The announcement of the value for power is expected in 2018. 3. Starts in 2018 for gas and in 2019 for power 4. Average regulatory depreciation (2017-2019) ~ 477€ m p. a. (depreciation allowance as proxy)
Cost audit +
Benchmarking
Grid expansion / Adjustment of capital
costs
Cost audit and benchmarking (for Opex/capital costs) once per regulatory period Total costs of historic base year (three years prior to start year of new regulatory period) basis for
benchmarking & revenue cap
Second regulatory period: Additional revenue allowance for grid expansion (power; grid maintenance not considered)
From third regulatory period onwards3: Annual adjustment of RAB for investments (growth/maintenance) and regulatory depreciation4 (`true up´) leads to annual adaptation of capital costs
Based on revenue cap, estimated energy consumption and revenue differences (too high/ low) from prior years
Annual adjustment of revenue cap by Consumer Price Index (CPI) General efficiency factor of currently 1.5% and 0.49% for gas in the next regulatory period2
Individual efficiency factor based on benchmarking result
Annual revenue cap
Network tariff
every 5 years
annual adjustment
annual adjustment
annual adjustment
Process steps of regulatory system1
Basics Method: Revenue cap (incentive regulation) Regulatory period: 5 years (Second regulatory period: power 2014-2018; gas 2013-2017)
Energy Networks
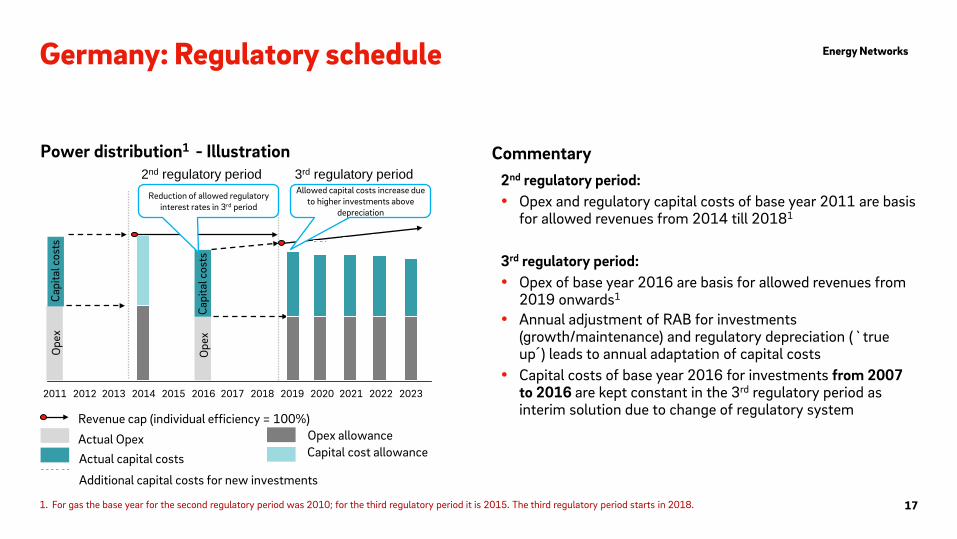
Germany: Regulatory schedule
17 1. For gas the base year for the second regulatory period was 2010; for the third regulatory period it is 2015. The third regulatory period starts in 2018.
3rd regulatory period
Revenue cap (individual efficiency = 100%)
2nd regulatory period 2nd regulatory period: Opex and regulatory capital costs of base year 2011 are basis
for allowed revenues from 2014 till 20181 3rd regulatory period: Opex of base year 2016 are basis for allowed revenues from
2019 onwards1 Annual adjustment of RAB for investments
(growth/maintenance) and regulatory depreciation (`true up´) leads to annual adaptation of capital costs
Capital costs of base year 2016 for investments from 2007 to 2016 are kept constant in the 3rd regulatory period as interim solution due to change of regulatory system
Commentary Power distribution1 - Illustration
2019 2015 2016 2017 2023 2018 2013 2022 2014 2020 2021 2011 2012
Ope
x
Ope
x
Capi
tal c
osts
Reduction of allowed regulatory interest rates in 3rd period
Capi
tal c
osts
Actual Opex Actual capital costs
Additional capital costs for new investments
Allowed capital costs increase due to higher investments above
depreciation
Energy Networks
Opex allowance Capital cost allowance

Germany: Building blocks of allowed revenues
1. Old assets are those capitalized before January 1, 2006. New assets are those capitalized after January 1,2006. Old assets are indexed up to 40% with asset-specific indices to determine the current costs. Relevant asset base for calculation of allowed return in 2017 is 2011 for power and 2010 for gas
2. Debt base consists of non-interest and interest bearing capital 3. Return on equity rate is post trade tax and pre corporate tax
Schematic illustration for 2017 (power & gas)
Totex indexed to CPI and subject to general and individual efficieny targets
40%
Cap
Opex
Capital Costs
Regu
late
d as
set b
ase1
Old
ass
ets:
Cur
rent
co
sts;
New
ass
ets:
H
isto
ric c
osts
Deb
t bas
e2
(rel
ated
to a
ctua
l cap
ital
stru
ctur
e, m
inim
um
60
%)
Regu
late
d eq
uity
bas
e
(rel
ated
to re
gula
tory
ca
pita
l str
uctu
re,
max
imum
40%
)
Retu
rn o
n eq
uity
3
Old
ass
ets:
7.1
4%
New
ass
ets:
9.0
5%
Retu
rn o
n ex
cess
ive
equi
ty
~4%
for e
quity
in e
xces
s of
40%
Trad
e ta
x al
low
ance
Dep
reci
atio
n al
low
ance
Ope
ratin
g co
sts
allo
wan
ce
(bas
ed o
n ac
tual
cos
ts o
f hi
stor
ic b
ase
year
)
Tota
l allo
wed
cos
t bas
e (T
otex
)
Add
ition
al re
venu
es
(net
wor
k ex
pans
ion,
qu
ality
bon
us/p
enal
ty…
)
Lagg
ed re
cove
ries
(net
ting
of a
ctua
l vs.
al
low
ed re
venu
es)
Pass
-thr
ough
item
s
(cha
rges
of h
ighe
r grid
le
vels
, pen
sion
s, e
tc…
)
Allo
wed
reve
nues
Pow
er
(Old
)
€ 2.2 bn
€ 2.3 bn
€ 0.3 bn
€ 5.1 bn
Pow
er
(New
) G
as
(Old
) Gas
1 (N
ew) € 10.0 bn
thereof ~ € 4.6 bn power ~ € 0.7 bn gas
€ 5.2 bn
Energy Networks
18

19
Germany: Determination of regulatory returns Energy Networks
1. Old assets are those capitalized before January 1, 2006. New assets are those capitalized after January 1, 2006. Old assets are indexed up to 40% with asset-specific indices to determine the current costs. 2. Weighted average cost of capital. The German regulator does not use a WACC-approach. The pro-forma WACC can be used to compare German regulatory returns internationally. In Germany, the regulator determines an allowed return on equity (RoE).This RoE is applied to the regulated equity base (RAB + current assets - debt base).3. Interest free liabilities (such as construction grants) not considered4. E.ON DSO filed an appeal against BNetzA decision
Equity return New assets1 Old assets1 Total New assets1 Old assets1 TotalAsset share 26% 74% 100% 50% 50% 100%Base rate 3,80% 2,24% 2,49% 1,04%Market premium 4,55% 4,55% 3,80% 3,80%Beta 0,38 0,38 0,40 0,40Levered Beta 0,79 0,79 0,83 0,83Equity return after tax 7,40% 5,84% 5,64% 4,19%Equity return pre tax 10,49% 8,27% 8,00% 5,94%Equity return pre corporate tax 9,05% 7,14% 6,91% 5,13%
Cost of debt (for equity above 40%)pre tax 3,98% 2,72%post tax 2,81% 1,92%
WACC2
pre tax 6,58% 5,70% 5,93% 4,83% 4,01% 4,42%post tax 4,64% 4,02% 4,18% 3,41% 2,83% 3,12%
Tax rate 29,53% 29,53%Corporate tax 15,83% 15,83%Trade tax 13,70% 13,70%
Financing structure3
Equity 40% 40%Debt 60% 60%
Regulatory returns in German energy networks 2nd regulatory period 3rd regulatory period4

Content
1. Overview
2. Energy Networks
2.2 Sweden
3. Customer Solutions
4. Renewables
5. PreussenElektra
6. Other
7. Financials
2
7
20
43
58
84
90
92
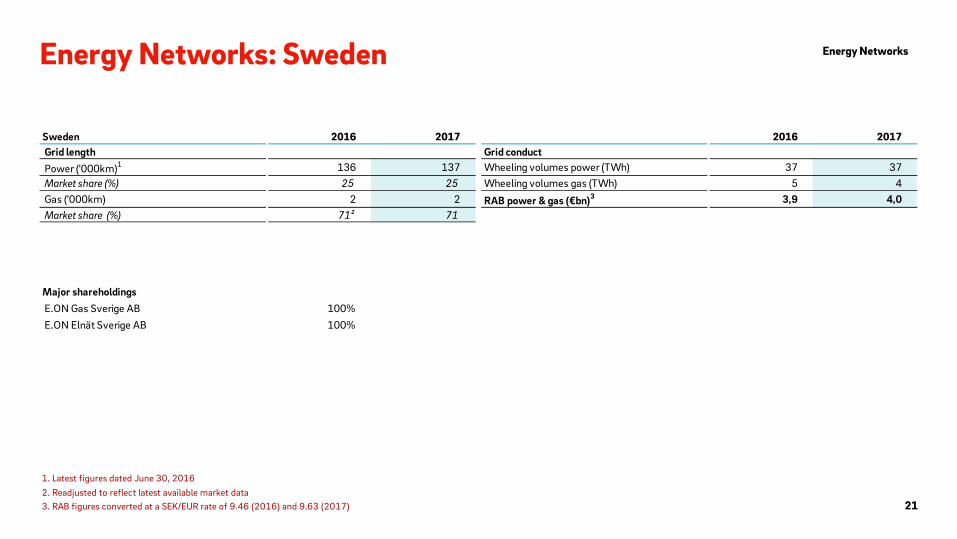
2. Readjusted to reflect latest available market data 1. Latest figures dated June 30, 2016
3. RAB figures converted at a SEK/EUR rate of 9.46 (2016) and 9.63 (2017)
Energy Networks: Sweden
21
Major shareholdings E.ON Gas Sverige AB 100% E.ON Elnät Sverige AB 100%
Energy Networks
Sweden 2016 2017 2016 2017 Grid length Grid conduct Power ('000km)1 136 137 Wheeling volumes power (TWh) 37 37 Market share (%) 25 25 Wheeling volumes gas (TWh) 5 4 Gas ('000km) 2 2 RAB power & gas (€bn)3 3,9 4,0 Market share (%) 71² 71

Overview
Other important factors Quality adjustment considers outages above 3 minutes and below 12 hrs and grid losses RES5 connections are cash neutral and included in revenue cap
Regulatory environment Sweden: Power1
22
1. E.ON also has a regulated gas distribution business in Sweden. This is disregarded in the presentation due to size. 2. The cap formula is an E.ON internal interpretation of the national regulatory framework. 3. No assets older than 38 years in the regulatory model, but additional depreciation and return allowed for assets built before 1977, for a period of 12 years 4. Average regulatory depreciation (2017-2019): ~ € 280 m p. a. 5. Renewables 6. Regulatory return readjusted following Swedish court decision.; formerly 4.56%
Basics
Opex
Capex
Cap formula2
Method: Revenue cap Regulatory period: 2016-2019 Next regulatory period: 2020-2023 Photo year for Opex allowance: Four year average
Regulatory return (WACC) on RAB (pre-tax, real): 5.85%6 Adjustment of RAB once a period: Standard prices set by regulator
applied to recognized historic assets + planned assets according to published action plans, minus disposals and depreciation
Depreciation period for power lines, cables and stations is 40 years and 10 years for meters and IT-systems
Revenue cap = (Controllable costs x (1 - efficiency factor)) + non-controllable costs + (age adjusted value (number of recognized assets and planned assets x regulatory standard prices)) x WACC 3 + depreciation3,4 +/- quality adjustment
Historical average costs 2010-2013 indexed to 2014 Efficiency factor: 1% p. a. Non-controllable costs are pass-through; one to one reflected in the
revenue cap
Key cost factors
Energy Networks

Content
1. Overview
2. Energy Networks
2.3 CEE
3. Customer Solutions
4. Renewables
5. PreussenElektra
6. Other
7. Financials
2
7
23
43
58
84
90
92
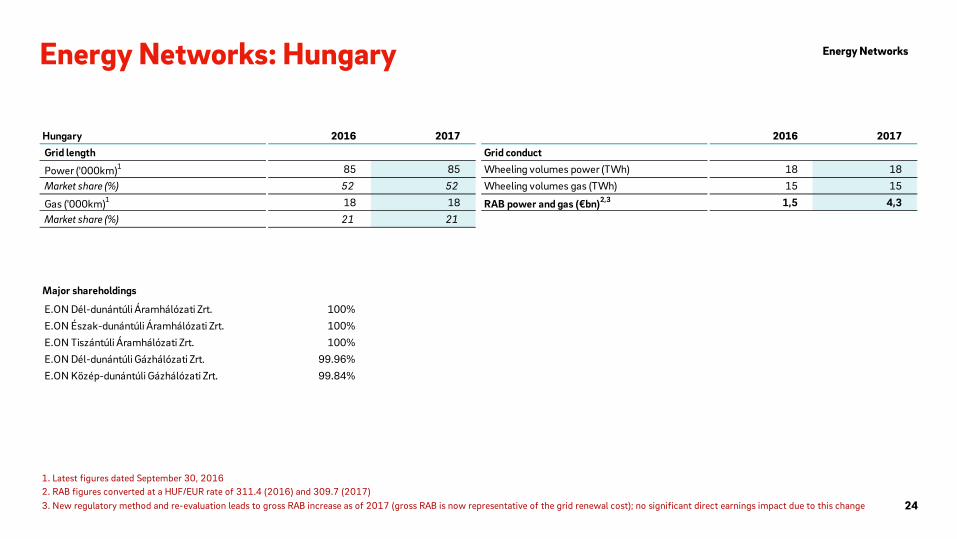
1. Latest figures dated September 30, 20162. RAB figures converted at a HUF/EUR rate of 311.4 (2016) and 309.7 (2017)3. New regulatory method and re-evaluation leads to gross RAB increase as of 2017 (gross RAB is now representative of the grid renewal cost); no significant direct earnings impact due to this change
Energy Networks: Hungary
24
Major shareholdings
E.ON Dél-dunántúli Áramhálózati Zrt. 100% E.ON Észak-dunántúli Áramhálózati Zrt. 100% E.ON Tiszántúli Áramhálózati Zrt. 100% E.ON Dél-dunántúli Gázhálózati Zrt. 99.96% E.ON Közép-dunántúli Gázhálózati Zrt. 99.84%
Energy Networks
Hungary 2016 2017 2016 2017 Grid length Grid conduct
Power ('000km)1 85 85 Wheeling volumes power (TWh) 18 18 Market share (%) 52 52 Wheeling volumes gas (TWh) 15 15
Gas ('000km)1 18 18 RAB power and gas (€bn)2,3 1,5 4,3 Market share (%) 21 21

Overview
Other important factors Quality factor for unplanned SAIDI4, SAIFI4 and an outage rate min. level defined. Sanctions possible if non-compliant in 3-years average Additional revenues granted for RES5 integration and connection of economy boosting investments (i.e. connection of industry parks) Public utility tax (125 HUF/meter of grid) and Robin Hood tax (31% of tax base) not recognized as eligible costs in the network tariffs
Regulatory environment Hungary : Power
25
1. The cap formula is an E.ON internal interpretation of the national regulatory framework. 2. Average regulatory depreciation (2017-2019) for power and gas: ~ € 120 m p. a. 3. Actual volumes from year N-2 is used as forecast 4. System Average Interruption Duration Index, System Average Interruption Frequency Index 5. Renewables
Basics
Opex
Capex
Cap formula1
Method: Price cap with actual quantity acceptance with two year time lag
Regulatory period: 2017-2020 Next regulatory period: 2021-2024 Photo year for Opex allowance: The year two years prior to the start year
of the new regulatory period
Regulatory return (WACC) on RAB (pre-tax, real): 4.69% Annual adjustments of RAB for inflation and depreciation Smart grid investments get a 1.1 return multiplier Depreciation period for power lines is 37 years
Price cap = (Allowed controllable costs + non-controllable costs + (RAB x WACC) + depreciation2 ± quality adjustment) / forecasted volume3
Historical costs 2015
Key cost factors
Energy Networks
Overview
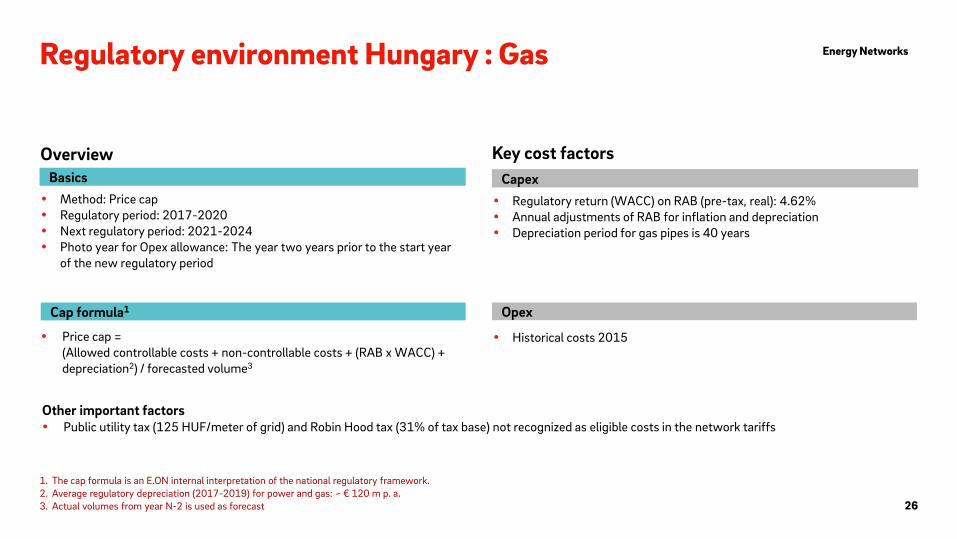
Other important factors Public utility tax (125 HUF/meter of grid) and Robin Hood tax (31% of tax base) not recognized as eligible costs in the network tariffs
Regulatory environment Hungary : Gas
26
1. The cap formula is an E.ON internal interpretation of the national regulatory framework. 2. Average regulatory depreciation (2017-2019) for power and gas: ~ € 120 m p. a. 3. Actual volumes from year N-2 is used as forecast
Basics
Opex
Capex
Cap formula1
Method: Price cap Regulatory period: 2017-2020 Next regulatory period: 2021-2024 Photo year for Opex allowance: The year two years prior to the start year
of the new regulatory period
Regulatory return (WACC) on RAB (pre-tax, real): 4.62% Annual adjustments of RAB for inflation and depreciation Depreciation period for gas pipes is 40 years
Price cap = (Allowed controllable costs + non-controllable costs + (RAB x WACC) + depreciation2) / forecasted volume3
Historical costs 2015
Key cost factors
Energy Networks
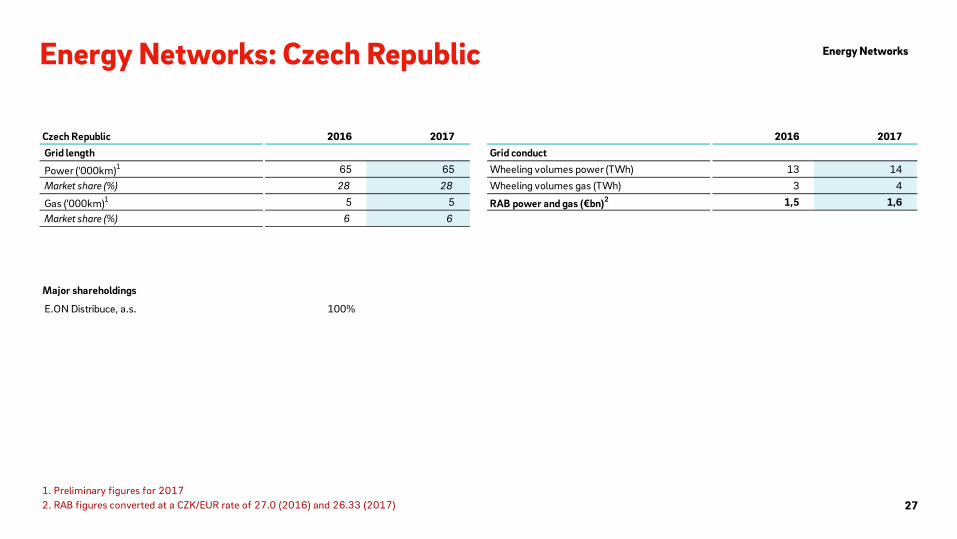
Energy Networks: Czech Republic
27
Major shareholdings
E.ON Distribuce, a.s. 100%
Energy Networks
1. Preliminary figures for 20172. RAB figures converted at a CZK/EUR rate of 27.0 (2016) and 26.33 (2017)
Czech Republic 2016 2017 2016 2017 Grid length Grid conduct
Power ('000km)1 65 65 Wheeling volumes power (TWh) 13 14 Market share (%) 28 28 Wheeling volumes gas (TWh) 3 4
Gas ('000km)1 5 5 RAB power and gas (€bn)2 1,5 1,6 Market share (%) 6 6

Overview
Other important factors 20% of customer contributions to investment costs recognized in the RAB
Regulatory environment Czech Republic: Power
28 1. The cap formula is an E.ON internal interpretation of the national regulatory framework 2. Average regulatory depreciation (2017-2019) for power and gas: ~ € 115 m p. a.
Basics
Opex
Capex
Cap formula1
Method: Revenue cap Regulatory period: 2016-2020 Next regulatory period*: 2021-2025 Photo year for Opex allowance: 2-3 year average (based on past
practice; the laws do not provide for an explicit mechanism)
Regulatory return (WACC) on RAB (pre-tax, nominal): 7.951% Depreciation period for power lines is 40 years Annual adjustments of RAB for depreciation and planned investments (no
time lag)
Revenue cap = Controllable costs x (PI - efficiency factors) + non-controllable costs + (RAB x WACC) + depreciation2
Historical average costs 2012-2013 General efficiency factor: 1.0% annually Individual efficiency factor: 0% for current regulatory period Inflation factor (PI) for Opex is 70% business service price index + 30%
(CPI+1%)
Key cost factors
Energy Networks
* ERO official decision of the new regulation period is not available
Overview
Other important factors 100% of customer contributions to investment costs recognized in the RAB
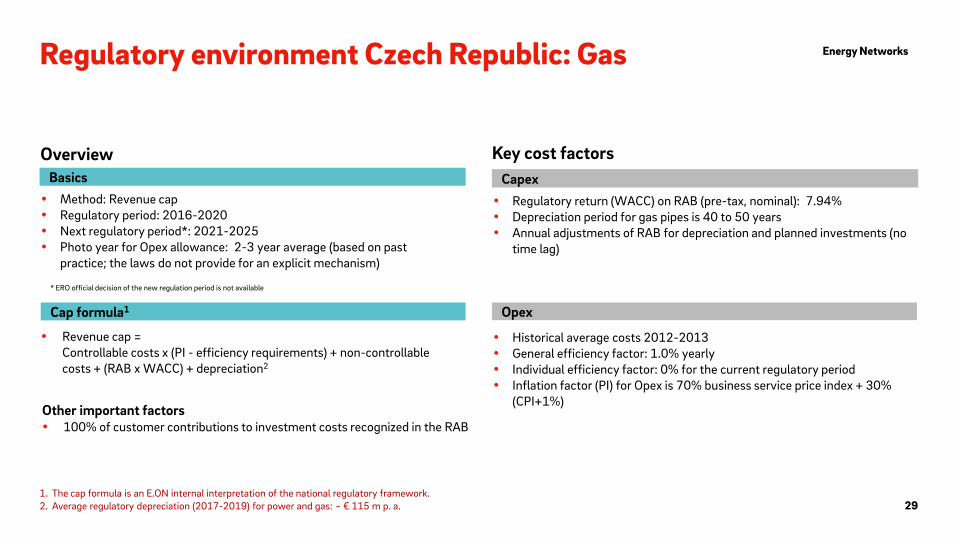
Regulatory environment Czech Republic: Gas
29 1. The cap formula is an E.ON internal interpretation of the national regulatory framework. 2. Average regulatory depreciation (2017-2019) for power and gas: ~ € 115 m p. a.
Basics
Opex
Capex
Cap formula1
Method: Revenue cap Regulatory period: 2016-2020 Next regulatory period*: 2021-2025 Photo year for Opex allowance: 2-3 year average (based on past
practice; the laws do not provide for an explicit mechanism)
Regulatory return (WACC) on RAB (pre-tax, nominal): 7.94% Depreciation period for gas pipes is 40 to 50 years Annual adjustments of RAB for depreciation and planned investments (no
time lag)
Revenue cap = Controllable costs x (PI - efficiency requirements) + non-controllable costs + (RAB x WACC) + depreciation2
Historical average costs 2012-2013 General efficiency factor: 1.0% yearly Individual efficiency factor: 0% for the current regulatory period Inflation factor (PI) for Opex is 70% business service price index + 30%
(CPI+1%)
Key cost factors
Energy Networks
* ERO official decision of the new regulation period is not available

2. RAB figures converted at a RON/EUR rate of 4.5 (2016) and 4.6 (2017)1. Readjusted to reflect latest available market data
30
Energy Networks: Romania Energy Networks
Major shareholdings
Delgaz Grid SA (former E.ON Distributie SA) 56.5%
1
Romania 2016 2017 2016 2017 Grid length Grid conduct Power ('000km) 81 82 Wheeling volumes power (TWh) 5 6 Market share (%) 16 16 Wheeling volumes gas (TWh) 26 26 Gas ('000km) 21 22 RAB power and gas (€bn)2 0,8 0,8 Market share (%) 55 55
1

Overview
Other important factors Automatic compensations for violated quality standards towards customers
Regulatory environment Romania: Power
31 1. The cap formula is an E.ON internal interpretation of the national regulatory framework. 2. Average regulatory depreciation (2017-2019) for power and gas: ~ € 62 m p. a.
Basics
Opex
Capex
Cap formula1
Method: Price cap with actual volume acceptance with one year time lag Regulatory period: 2014-2018 Next regulatory period: 2019-2023 Photo year for Opex allowance: The year prior to the start year of the next
regulatory period
Regulatory return (WACC) on RAB (pre-tax, real): 7.7% Adjustments of RAB for inflation, depreciation and planned investments
(no time lag) ex-ante of regulatory period and ex-post with actual investments
In case of underinvestment (<80% of planned investments) penalties apply
Depreciation period for power lines is 30 to 40 years
Price cap = (Controllable costs x (1+CPI - efficiency requirements) + non-controllable costs + (RAB x WACC) + planned depreciation2 + volume adjustments (t-1) – (revenue from reactive energy)) / forecasted volume
Historical costs 2013 General efficiency factor: 1.5% p. a., but 50% of gained efficiency is kept by
DSO Inflation factor is regulated CPI Grid losses: recognition at regulated prices
Key cost factors
Energy Networks

Overview
Other important factors Compensations for violated quality standards towards customers
Regulatory environment Romania: Gas
32
1. Regulatory period prolonged by one year, previously until 2017 2. The cap formula is an E.ON internal interpretation of the national regulatory framework. 3. Average regulatory depreciation (2017-2019) for power and gas: ~ € 62 m p. a. 4. Value of regulatory return valid until 2017, regulatory framework for 2018 not yet decided by energy regulatory office
Basics
Opex
Capex
Cap formula2
Method: Price cap with actual volume acceptance with one year time lag Regulatory period: 2013-20181
Next regulatory period: 2019-2022 Photo year for Opex allowance: The year prior to the start year of the next
regulatory period
Regulatory return (WACC) on RAB (pre-tax, real)4: 8.43% + 1.40% incentive for specific investments in core assets (e.g. network expansion, metering systems)
Annual adjustments of RAB for inflation, depreciation and activated investments (ex-post adjustment)
Depreciation period for gas pipes is 30 to 40 years
Price cap = (Controllable costs x (1+CPI - efficiency requirements) + non-controllable costs + (RAB x WACC) + depreciation3 ) / forecasted volume
Historical costs 2012 General efficiency factor: 1.65% p. a. Inflation factor is CPI
Key cost factors
Energy Networks

Energy Networks: Slovakia
33
Major shareholdings
Západoslovenská distribucná a.s. 49%
Energy Networks
Slovakia 2016 2017 2016 2017 Grid length Grid conduct Power ('000km) 38 38 Wheeling volumes power (TWh) 9 10 Market share (%) 43 45 Wheeling volumes gas (TWh) n/a n/a Gas ('000km) n/a n/a RAB power (€bn) 0,6 0,6 Market share (%) n/a n/a

Overview
Other important factors Automatic compensations for violated quality standards towards customers
Regulatory environment Slovakia: Power
34
1. The cap formula is an E.ON internal interpretation of the national regulatory framework. 2. 3 price caps: for high voltage (110 kV), medium voltage (22 kV) and low voltage (0.4 kV) 3. Average regulatory depreciation (2017-2019): ~ € 90 m p. a.
Basics
Opex
Capex
Cap formula1
Method: Price cap Regulatory period: 2017-2021 Next regulatory period: 2022-2026 (expected) Photo year for Opex allowance: 2010
Regulatory return (WACC pretax, nominal) on RAB: set annually; 6.27% for 2018
RAB: Depreciated asset base based on external value appraisal of assets, investments and depreciation prepared by Slovakian regulator
Depreciation period for power lines is 30 (LV) to 35 years (MV, HV)
Price cap per voltage level2 = (Opex allowance x (1 + core inflation - efficiency factor) + (RAB 2010 YE x WACC) + depreciation (from RAB 2010 YE + from planned Capex for next year)3 - revenues from connections & recovery of illegal consumption & exceeding reserved capacity ± correction on depreciation (from planned vs. actual Capex)) / forecasted volume
Actual Opex for 2010 Efficiency factor (applied to Opex): 3.5% p. a. Inflation factor for Opex is core inflation, however escalation index (1+
core inflation - efficiency) cannot be below 1.0
Key cost factors
Energy Networks
Content
1. Overview
2. Energy Networks
2.3 Turkey
3. Customer Solutions
4. Renewables
5. PreussenElektra
6. Other
7. Financials
2
7
35
43
58
84
90
92

Turkey: Enerjisa Enerji & Enerjisa Üretim
36 1. Excluding state owned EUAS
Energy Networks
Enerjisa Enerji (Networks & Retail): #1 Distribution Network Operator by grid
length
#1 Energy supplier by customer number
Network presence
2.3
Ankara
Istanbul
Adana
3.6 GW generation capacity
9.2 m retail customers
220,000 km networks
Enerjisa Üretim (Generation & Trading): #2 Private power generator by installed
capacity1
50% 50%
40% 40%
Free Float
20%
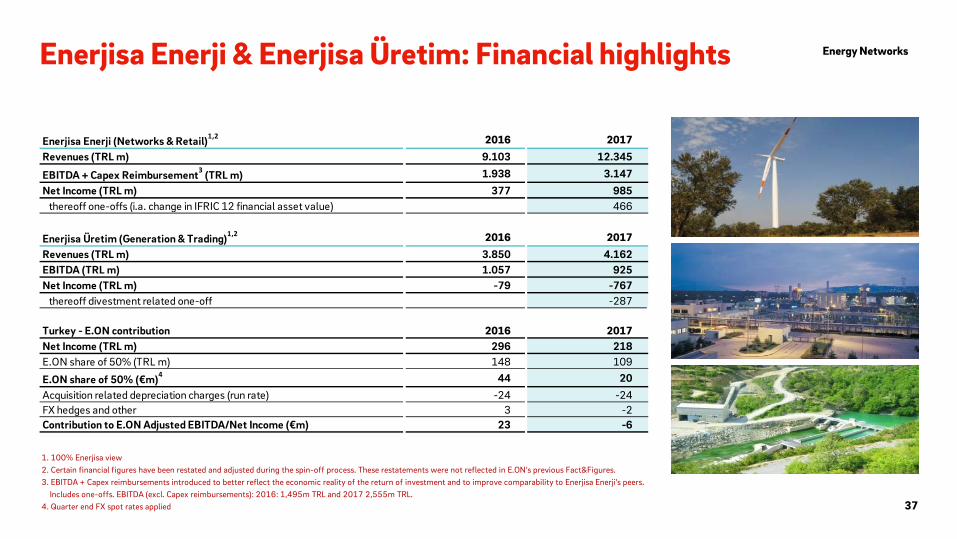
Enerjisa Enerji & Enerjisa Üretim: Financial highlights
37
Energy Networks
1. 100% Enerjisa view 2. Certain financial figures have been restated and adjusted during the spin-off process. These restatements were not reflected in E.ON's previous Fact&Figures.3. EBITDA + Capex reimbursements introduced to better reflect the economic reality of the return of investment and to improve comparability to Enerjisa Enerji's peers. Includes one-offs. EBITDA (excl. Capex reimbursements): 2016: 1,495m TRL and 2017 2,555m TRL. 4. Quarter end FX spot rates applied
Enerjisa Enerji (Networks & Retail)1,2 2016 2017Revenues (TRL m) 9.103 12.345
EBITDA + Capex Reimbursement3 (TRL m) 1.938 3.147 Net Income (TRL m) 377 985
thereoff one-offs (i.a. change in IFRIC 12 financial asset value) 466
Enerjisa Üretim (Generation & Trading)1,2 2016 2017Revenues (TRL m) 3.850 4.162 EBITDA (TRL m) 1.057 925 Net Income (TRL m) -79 -767
thereoff divestment related one-off -287
Turkey - E.ON contribution 2016 2017Net Income (TRL m) 296 218 E.ON share of 50% (TRL m) 148 109
E.ON share of 50% (€m)4 44 20 Acquisition related depreciation charges (run rate) -24 -24 FX hedges and other 3 -2 Contribution to E.ON Adjusted EBITDA/Net Income (€m) 23 -6

Enerjisa Enerji: Networks & Retail
38
Energy Networks
1. Latest available data, official data for 2017 not yet published
2. RAB figure converted at a TRL/EUR rate of 3.7 (2016, end of period) and 4.5 (2017, end of period)
3. Based on total net demand. 2017 preliminary, official data not yet published
4. 2016 adjusted for comparison. Latest available data, official data for 2017 not yet published
Distribution 2016 2017Power grid length ('000km) 220 220
Market share (%) 1 20 20Grid conduct (TWh) 44 45
RAB (€bn)2 1,0 1,2RAB (TRL bn) 3,8 5,3
Retail 2016 2017Power sales (TWh) 33,3 35,2
Market share (%) 1 14 14 # of customers 9,0 9,2
Market share (%) 2 22 22
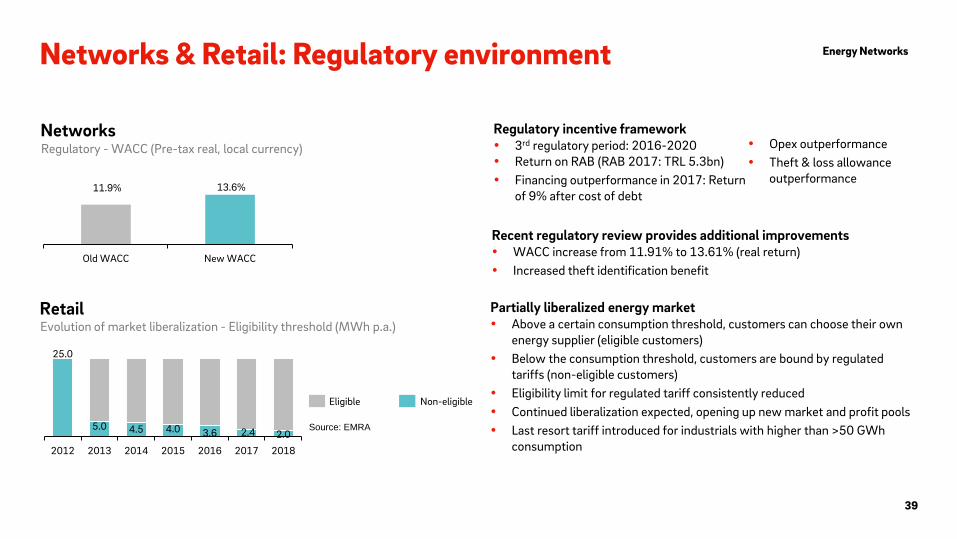
Networks & Retail: Regulatory environment
39
Source: EMRA
Partially liberalized energy market Above a certain consumption threshold, customers can choose their own
energy supplier (eligible customers) Below the consumption threshold, customers are bound by regulated
tariffs (non-eligible customers) Eligibility limit for regulated tariff consistently reduced Continued liberalization expected, opening up new market and profit pools Last resort tariff introduced for industrials with higher than >50 GWh
consumption
Evolution of market liberalization - Eligibility threshold (MWh p.a.)
25.0
5.0 4.5 4.0 3.6 2.4 2.0
2012 2013 2014 2015 2016 2017 2018
Regulatory incentive framework 3rd regulatory period: 2016-2020 Return on RAB (RAB 2017: TRL 5.3bn) Financing outperformance in 2017: Return
of 9% after cost of debt
Regulatory - WACC (Pre-tax real, local currency)
11.9% 13.6%
Old WACC New WACC
Eligible Non-eligible
Recent regulatory review provides additional improvements WACC increase from 11.91% to 13.61% (real return) Increased theft identification benefit
Networks
Retail
Energy Networks
Opex outperformance Theft & loss allowance
outperformance

Enerjisa Üretim: Generation & Trading (1)
40
Energy Networks
1. All assets are 100% owned by Enerjisa.2. Capacity mechanism implemented starting 2018. Budget for allocation & strike price will be set quartely by state-owned transmission company3. Lignite incentive in 2017 at 185TRL/MWh. Starting 2018, quarterly inflation-indexed sales price with 201 TRL/MWh for Q1 2018. 7-years PPA applies with state-owned wholesaler (TETAS) for 1.4 TWh (2018:1.5 TWh).TETAS can increase annual volume up to 40%4. Feed-in-tariff
Power plant TypeGeneration
capacity (MW)Production
(GWh)Start-up
yearRevenue stream
Remuneration per MWh
In operation
Bandırma-I Gas 931 5.605 2010 Market prices ;
Capacity mechanism 2
Bandırma-II Gas 607 3.265 2016 Market prices ;
Capacity mechanism 2
Kentsa Gas 40 1997
Tufanbeyli Coal/Lignite 450 2.393 2016 Market prices; Capacity
mechanism 2; Lignite incentive
TRL 185³
Menge Hydro 89 114 2012 FIT 4 $ 73 Köprü Hydro 156 267 2013 FIT $ 73 Kuşakli Hydro 20 25 2013 FIT $ 73 Dağdelen Hydro 8 24 2013 FIT $ 73 Kandil Hydro 208 731 2013 FIT $ 73 Sarıgüzel Hydro 103 340 2013 FIT $ 73 Hacınınoğlu Hydro 142 332 2011 FIT $ 73
Assets Enerjisa Üretim1

Enerjisa Üretim: Generation & Trading (2)
41
Energy Networks
1. All assets are 100% owned by Enerjisa.2. Production included as part of Bandirma-I
Power plant TypeGeneration
capacity (MW)Production
(GWh)Start-up
yearRevenue stream
Remuneration USD/MWh
Çambaşı Hydro 45 148 2013 FIT $ 73 Kavşakbendi Hydro 191 584 2014 FIT $ 73 Arkun Hydro 245 619 2014 FIT $ 73 Bandırma Hydro 3 2014 Yamanlı II Hydro 82 129 2016 FIT $ 73 Doğançay Hydro 62 63 2017 FIT $ 73 Çanakkale Wind 30 91 2011 FIT $ 73 Dağpazarı Wind 39 109 2012 FIT $ 73 Bares Wind 143 511 2013 FIT $ 78 Karabük Solar 7 3 2017 FIT $ 133 Bandırma Solar 2 1 2017 FIT $ 133Total in operation 3.603 15.354
Assets Enerjisa Üretim1
5
2

Generation & Trading: Regulatory environment
42
1. TETAS can increase volume up to 40% 2. Sources: EPIAS 3. Converted at a TRL/USD rate of 3.63 (average)
Source: EMRA
Incentive framework • Lignite incentive set up in 2016 to foster local energy generation further
enhanced (2017 fixed at 185 TRL/MWh, starting 2018 quarterly inflation-indexed sales price, with 201 TRL/MWh for Q1 2018)
• 7-years PPA starting in 2018 with state-owned wholesaler (TETAS) for 1.4 TWh1 (2018: 1.5 TWh)
• Stable cash flows from TRL-denominated incentive
TRL denominated - inflation indexed (TRL/MWh)
USD denominated (USD/MWh)
Renewables (Feed in Tariff)
Local lignite incentive
73 73 133
Wind Hydro Solar
Incentive framework • Stable cash flows from USD-denominated feed-in tariffs (for 10 years) • Annual flexibility to opt for either feed in tariffs or market prices • Higher feed in tariff if power plant parts were manufactured in Turkey • Renewables additionally benefit from participation in the balancing market
Source: EMRA
201
Lignite
Average power prices in Turkey2
2017: 164 TRL/MWh 45 USD/MWh3
Energy Networks
Gas & local lignite power plants
Capacity mechanism Incentive framework • Capacity mechanism starting from 2018. • Allocation of budget and strike set quarterly. Local sources are prioritized.
Content
1. Overview
2. Energy Networks
3. Customer Solutions
4. Renewables
5. PreussenElektra
6. Other
7. Financials
2
7
43
58
84
90
92

Customer Solutions
44
Customer Solutions
E.ON’s market positions
Customer
B2B
B2C
B2M
Customer Focused Portfolio
EBIT3 2017 €526m Energy Sales EBIT4
Energy Sales is the anchor business
B2M/Heat: 10% market share in Germany & Sweden
B2B Solutions: ~€1 bn TCV2 in 2017
Top 3
Top 2
Top 3
Top 3 Top 3
Top 3
Top 10
Top 3
Energy Sales: 22m1 customers in 8 countries
Energy Sales
Heat & New
Solutions B2B
~25%
B2C ~75%
1. Excluding Turkey 2. Total Contract Value 3. Adjusted for non-operating effects 4. B2C customers in Germany and UK

Customer Solutions at a glance
45
1. Domestic customers, e.g. families, single-households (B2C = Business to consumer) 2. B2B = Business to business 3. B2M = Business to municipalities 4. Consolidated on a 49% basis in adjusted EBIT/Net Income of E.ON Financial Statements. Figures shown here: 100% view
Customer Solutions comprises our energy sales, heat and new solutions business
Our product offering ranges from classic power and gas sales to district and local area heating solutions and new solutions, such as on site generation, virtual power plants, energy efficiency, smart metering, smart home and software solutions, e-mobility, PV + battery etc.
We serve customers within three business segments: B2C1, B2B2 and B2M3
19,200 employees work in Customer Solutions
Customer Solutions
What we do
2017 Germany UK Sweden Romania Hungary Czech Rep. Slovakia1 Italy Total # of customers (m) 5,9 6,8 0,7 3,1 2,5 1,3 0,9 0,8 22,0 Power sales (TWh) 39,9 34,8 15,7 6,0 14,4 16,1 5,7 7,6 140 Gas sales (TWh) 43,9 42,5 3,0 27,2 4,1 10,0 2,7 10,4 144

Customer Solutions: Financial highlights
46 1. Adjusted for non-operating effects
Customer Solutions
€bn Germany UK Other Total Germany UK Other TotalRevenues 7.781 7.791 6.796 22.368 7.452 7.205 6.910 21.567
Adjusted EBITDA1 299 460 351 1.110 192 353 302 847
Adjusted EBIT1 232 365 215 812 118 250 158 526
Adjusted EBIT margin (%)1 3,0 4,7 3,2 3,6 1,6 3,5 2,3 2,4Investments (cash-effective) 73 220 287 580 75 211 309 595
2016 2017

Customer Solutions: Financial highlights
47
1. Adjusted for non-operating earnings; Slight differences may occur due to rounding. 2. Includes Energy Sales & Other 3. Costs to serve, costs to acquire and all other cost related to running the energy sales business including D&A
Customer Solutions
Energy sales2
Adjusted EBIT1 by business pillars
Heat
0.7
2016
0.1 2017
2016 0.1
2017
0.3 0.3 2016
2017 0.5
0.8
0.4 0.2 0.2
Total Adj. EBIT
Energy sales2 financials
1.3 2017 2016 1.2
1.2 1.1
Gross Margin
0.8 1.0 2017 2016 0.8 1.0
Opex3
Continental Europe UK
€bn
€bn
Content
1. Overview
2. Energy Networks
3. Customer Solutions
3.1 Energy sales: Country-by-country
4. Renewables
5. PreussenElektra
6. Other
7. Financials
2
7
43
48
58
84
90
92
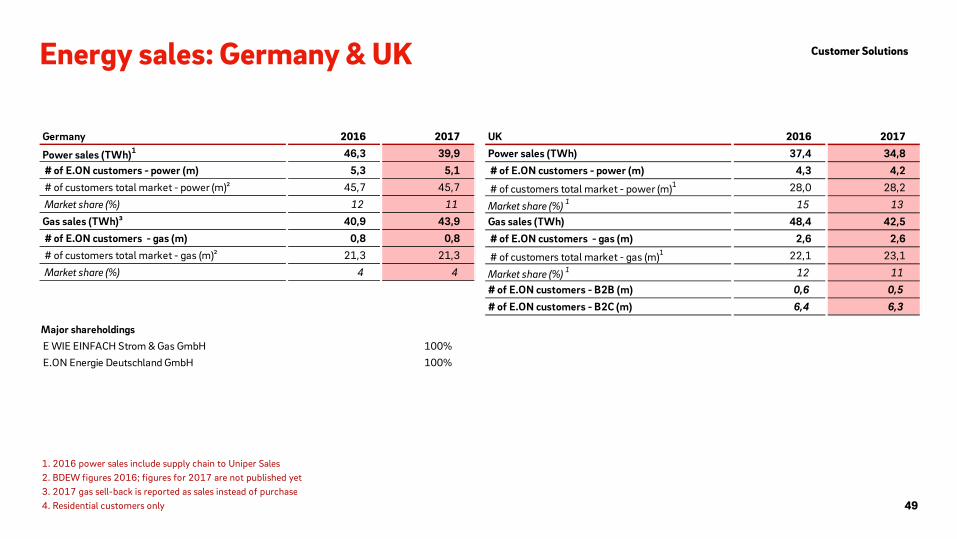
Energy sales: Germany & UK
49
Major shareholdings E WIE EINFACH Strom & Gas GmbH 100% E.ON Energie Deutschland GmbH 100%
Customer Solutions
1. 2016 power sales include supply chain to Uniper Sales2. BDEW figures 2016; figures for 2017 are not published yet3. 2017 gas sell-back is reported as sales instead of purchase4. Residential customers only
Germany 2016 2017
Power sales (TWh)1 46,3 39,9 # of E.ON customers - power (m) 5,3 5,1 # of customers total market - power (m)² 45,7 45,7 Market share (%) 12 11 Gas sales (TWh)³ 40,9 43,9 # of E.ON customers - gas (m) 0,8 0,8 # of customers total market - gas (m)² 21,3 21,3 Market share (%) 4 4
UK 2016 2017 Power sales (TWh) 37,4 34,8 # of E.ON customers - power (m) 4,3 4,2
# of customers total market - power (m)1 28,0 28,2
Market share (%) 1 15 13 Gas sales (TWh) 48,4 42,5 # of E.ON customers - gas (m) 2,6 2,6
# of customers total market - gas (m)1 22,1 23,1
Market share (%) 1 12 11 # of E.ON customers - B2B (m) 0,6 0,5 # of E.ON customers - B2C (m) 6,4 6,3

Energy sales: Sweden & Italy
50
Major shareholdings
E.ON Sverige AB 100% E.ON Nord Sverige AB 100% E.ON Värme Sverige AB 100%
Customer Solutions
Major shareholdings
E.ON Energia SpA 100%
1. Latest available estimate by Swedish official statistics, Statistiska Central Byrån
Sweden 2016 2017 Power sales (TWh) 15,7 15,7 # of E.ON customers - power (m) 0,7 0,7
# of customers total market - power (m)1 4,5 4,5 Market share (%) 16 16Gas sales (TWh) 3,6 3,0 # of E.ON customers - gas (m) 0,01 0,01
# of customers total market - gas (m)1 0,03 0,03 Market share (%) 29 29
Italy 2016 2017 Power sales (TWh) 8,2 7,6 # of E.ON customers - power (m) 0,2 0,3 # of customers total market - power (m) 12,7 13,8 Market share (%) 2 2 Gas sales (TWh) 9,5 10,4 # of E.ON customers - gas (m) 0,5 0,5 # of customers total market - gas (m) 21,2 21,1 Market share (%) 2 2
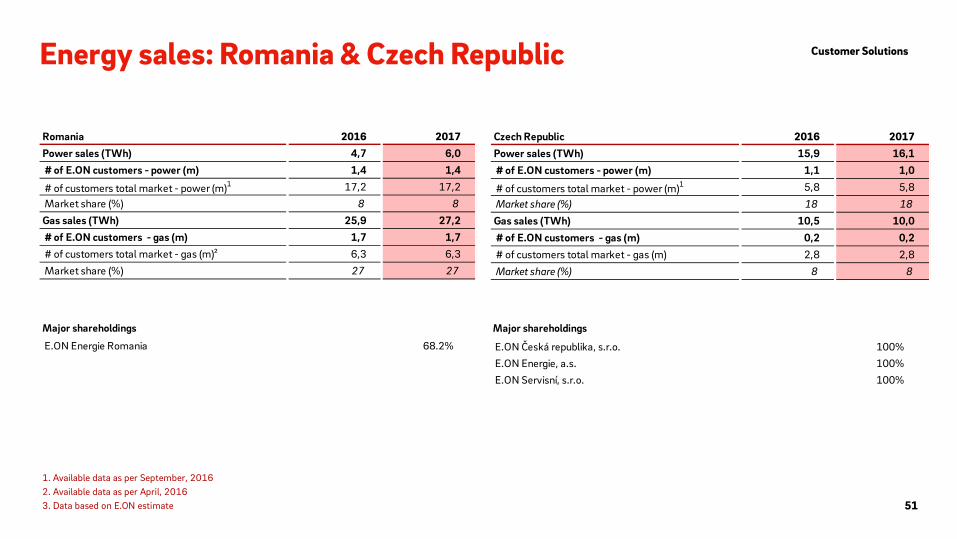
Energy sales: Romania & Czech Republic
51
Major shareholdings
E.ON Česká republika, s.r.o. 100% E.ON Energie, a.s. 100% E.ON Servisní, s.r.o. 100%
Major shareholdings
E.ON Energie Romania 68.2%
Customer Solutions
1. Available data as per September, 20162. Available data as per April, 20163. Data based on E.ON estimate
Romania 2016 2017 Power sales (TWh) 4,7 6,0 # of E.ON customers - power (m) 1,4 1,4
# of customers total market - power (m)1 17,2 17,2 Market share (%) 8 8 Gas sales (TWh) 25,9 27,2 # of E.ON customers - gas (m) 1,7 1,7 # of customers total market - gas (m)² 6,3 6,3 Market share (%) 27 27
Czech Republic 2016 2017 Power sales (TWh) 15,9 16,1 # of E.ON customers - power (m) 1,1 1,0
# of customers total market - power (m)1 5,8 5,8 Market share (%) 18 18 Gas sales (TWh) 10,5 10,0 # of E.ON customers - gas (m) 0,2 0,2 # of customers total market - gas (m) 2,8 2,8 Market share (%) 8 8

Energy sales: Hungary & Slovakia
52
Major shareholdings
Západoslovenská energetika, a.s. 49%
Customer Solutions
Major shareholdings
E.ON Energiatermelő Kft. 100% E.ON Gazdasági Szolgáltató Kft. 100% E.ON Ügyfélszolgálati Kft. 100%
E.ON Energiaszolgáltató Kft. 100% E.ON Energiakereskedelmi Kft. 100%
1. Reflects most recent Hungarian TSO data2. Exit from B2C January 1, 20163. Data based on E.ON estimate
Hungary 2016 2017 Power sales (TWh) 13,6 14,4 # of E.ON customers - power (m) 2,5 2,5
# of customers total market - power (m)1 6,9 6,9 Market share (%) 36 36 Gas sales (TWh) 4,0 4,1
# of E.ON customers - gas (m)2 0,0 0,0
# of customers total market - gas (m)1 3,4 3,4 Market share (%) 0,2 0,2
Slovakia 2016 2017 Power sales (TWh) 5,6 5,7 # of E.ON customers - power (m) 0,9 0,9
# of customers total market - power (m)1 2,2 2,2 Market share (%) 38 39 Gas sales (TWh) 2,1 2,7 # of E.ON customers - gas (m) 0,1 0,1
# of customers total market - gas (m)1 1,5 1,5 Market share (%) 3 4

Content
1. Overview
2. Energy Networks
3. Customer Solutions
3.2 Heat and New Solutions
4. Renewables
5. PreussenElektra
6. Other
7. Financials
2
7
43
53
58
84
90
92
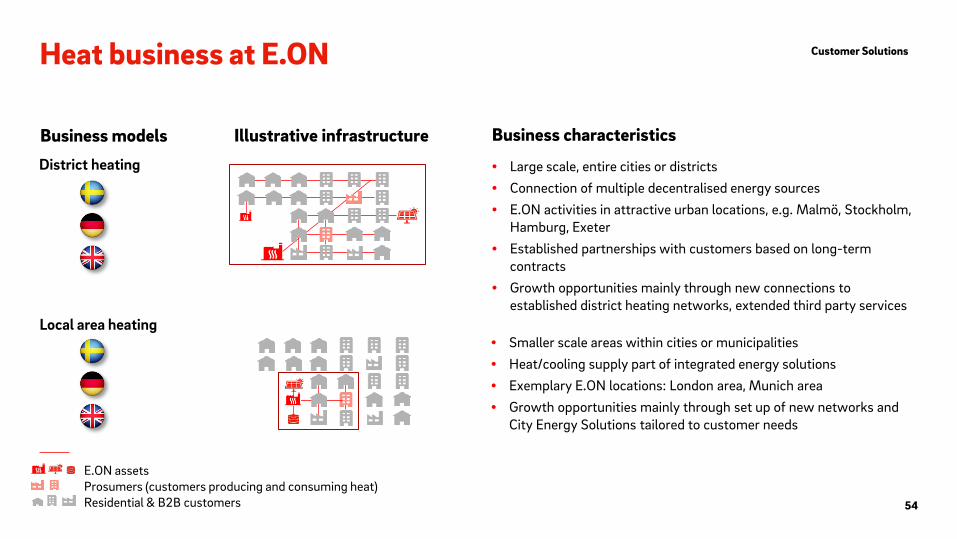
Heat business at E.ON
54
Illustrative infrastructure Business models Business characteristics
District heating • Large scale, entire cities or districts • Connection of multiple decentralised energy sources • E.ON activities in attractive urban locations, e.g. Malmö, Stockholm,
Hamburg, Exeter • Established partnerships with customers based on long-term
contracts • Growth opportunities mainly through new connections to
established district heating networks, extended third party services Local area heating
• Smaller scale areas within cities or municipalities • Heat/cooling supply part of integrated energy solutions • Exemplary E.ON locations: London area, Munich area • Growth opportunities mainly through set up of new networks and
City Energy Solutions tailored to customer needs
E.ON assets Prosumers (customers producing and consuming heat) Residential & B2B customers
Customer Solutions

Energy Consulting
New Solutions: B2B Large
55
Customer Solutions
On-site Generation
Managing energy consumption
From audits to operation
Data transparency and data analytics
Remote control and optimization of assets at customer facilities
Efficiency investment projects – with and without funding
Generating energy efficiently
On-site supply of heat, steam, power, cooling and pressurized air from: CHPs/CHCPs1 Gas-turbines Boilers, chillers, fuel cells Solar PV and heat pumps
Design, installation and financing
Remote operation & maintenance
Optimizing and monetizing flexibility
Identifying, aggregating and monetizing flexibility from renewable and thermal assets
Reducing grid and peak power charges
Avoiding production losses with back-up generation
Offering P2P2 solutions
Flexibility & Storage Solutions Digital Energy Solutions Energy Efficiency Solutions Decentral Generation
Solutions
1. Combined Heat and Power (CHP); Combined Heat, Cooling and Power (CHCP) 2. Peer-to-Peer (P2P): Regional and green electricity solutions
Digitally optimizing processes and operations Analytics, visualization and
control of energy streams
Reduction of energy waste through AI algorithm
Optimization of industrial processes and sites
End-to-end steering and unmanned operation of assets

New Solutions: B2C/SME and eMobility
56
Significant scaling of E.ON Aura across Germany – an all-in-one solution including PV, battery and a smart energy management app
E.ON SolarCloud successfully launched in Germany – a virtual storage tariff incl. value added services
Expansion of offerings in UK, Italy, and other E.ON regions
Major position in Denmark with more than one million charging transactions and >3,500 electric charge points
Cooperation with “Tank & Rast” on operating 92 fast and ultra fast charging sites in Germany
Launch of charging solutions and charge cards in Nordics and Germany for B2C, B2B and B2M customers
More than doubled sales of heating devices – boiler, heat pump, fuel cell – across E.ON regions
Profitable growth in Romania within first full year of operation
Continuous development of E.ON Heating portfolio towards electrification and sustainable solutions – e.g. replacing oil boilers with heat pumps in UK
Customer Solutions
PV & Storage Home Heating eMobility
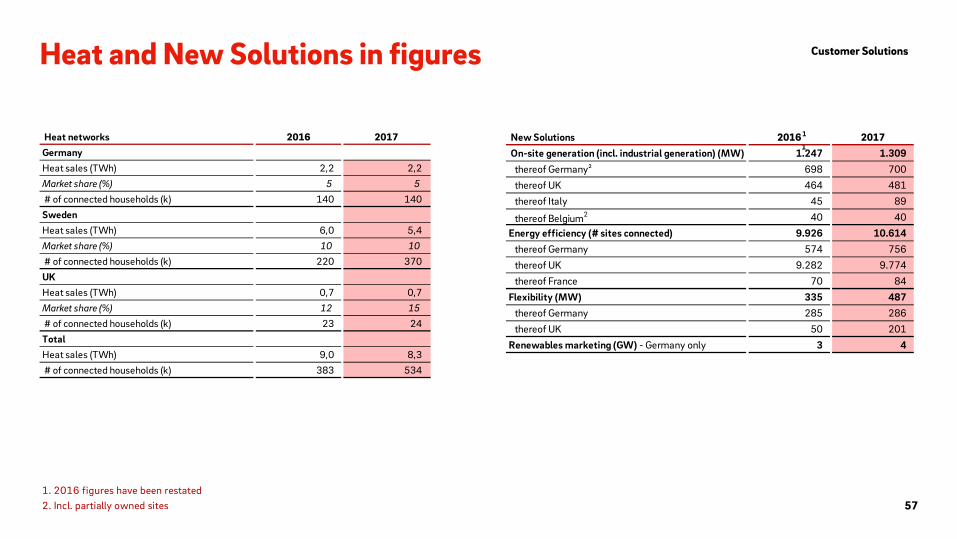
Heat and New Solutions in figures
57
Customer Solutions
1. 2016 figures have been restated2. Incl. partially owned sites
1
1
Heat networks 2016 2017 GermanyHeat sales (TWh) 2,2 2,2 Market share (%) 5 5 # of connected households (k) 140 140 SwedenHeat sales (TWh) 6,0 5,4 Market share (%) 10 10 # of connected households (k) 220 370 UKHeat sales (TWh) 0,7 0,7 Market share (%) 12 15 # of connected households (k) 23 24 TotalHeat sales (TWh) 9,0 8,3 # of connected households (k) 383 534
New Solutions 2016 2017 On-site generation (incl. industrial generation) (MW) 1.247 1.309
thereof Germany² 698 700thereof UK 464 481thereof Italy 45 89
thereof Belgium2 40 40Energy efficiency (# sites connected) 9.926 10.614
thereof Germany 574 756thereof UK 9.282 9.774thereof France 70 84
Flexibility (MW) 335 487thereof Germany 285 286thereof UK 50 201
Renewables marketing (GW) - Germany only 3 4
1

Content
1. Overview
2. Energy Networks
3. Customer Solutions
4. Renewables
5. PreussenElektra
6. Other
7. Financials
2
7
43
58
84
90
92

59
Renewables
~4 GW1 ~3 GW1
Arkona
Rampion
Morcone
Under construction: ~ 1GW
1.4 GW1
0.6 GW1
0.3 GW1
0.2 GW1
0.2 GW1
0.2 GW1 1. Gross capacity
Stella
€0.5bn EBIT 2017 (~18% of core EBIT)
~95% Long-term contracted or hedged until 2020
Strong track record with ~7 GW1 delivered Active in 3 technologies and batteries
1
Highlights
Wind Onshore
Renewables at a glance
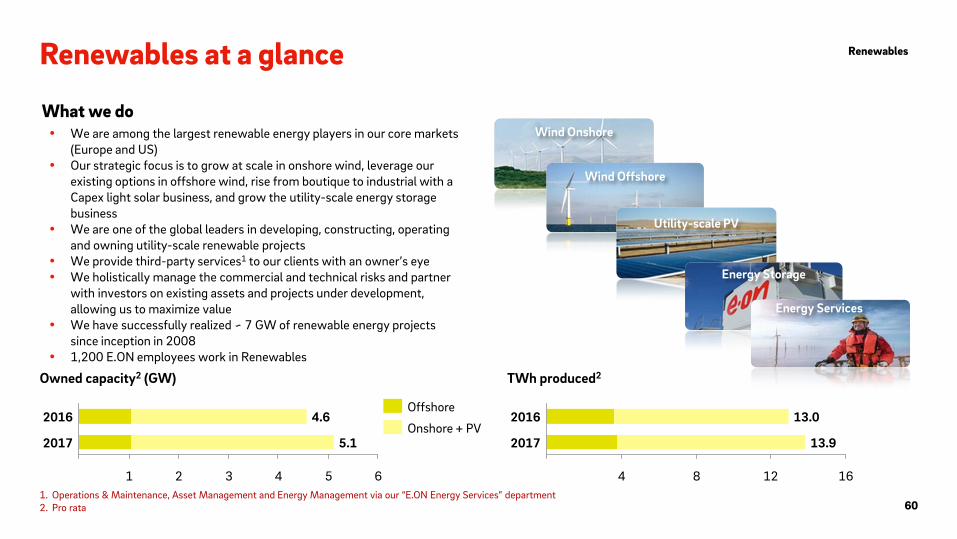
60 1. Operations & Maintenance, Asset Management and Energy Management via our “E.ON Energy Services” department 2. Pro rata
We are among the largest renewable energy players in our core markets (Europe and US)
Our strategic focus is to grow at scale in onshore wind, leverage our existing options in offshore wind, rise from boutique to industrial with a Capex light solar business, and grow the utility-scale energy storage business
We are one of the global leaders in developing, constructing, operating and owning utility-scale renewable projects
We provide third-party services1 to our clients with an owner’s eye We holistically manage the commercial and technical risks and partner
with investors on existing assets and projects under development, allowing us to maximize value
We have successfully realized ~ 7 GW of renewable energy projects since inception in 2008
1,200 E.ON employees work in Renewables
What we do
TWh produced2
16 12 8 4
2017 13.9
2016 13.0
Owned capacity2 (GW)
6 5 4 3 2 1
2017 5.1
2016 4.6
Wind Offshore
Utility-scale PV
Energy Storage
Renewables
Energy Services
Offshore
Onshore + PV

Renewables: Financial highlights
61
Renewables
1. Adjusted for non-operating effects
€m Onshore Wind/ PV Offshore Wind Total Onshore Wind/ PV Offshore Wind TotalRevenues 728 629 1.357 927 677 1.604
Adjusted EBITDA1 308 488 796 299 486 785
Adjusted EBIT1 92 338 430 117 337 454 Investments (cash-effective) 465 605 1.070 568 657 1.225
2016 2017

Technology and country profile
62
Renewables
1. UK Production does not include preCOD Rampion generation
1
1
2017 Onshore Offshore PV Total Onshore Offshore PV TotalAccounting viewGermany 220 302 0 522 392 1.144 0 1.536 UK 250 646 0 896 552 2.241 0 2.793 US 2.623 0 15 2.638 6.503 0 39 6.542 Denmark 0 0 0 0 0 0 0 0 Sweden 123 48 0 171 361 199 0 561 Poland 161 0 0 161 377 0 0 377 Italy 328 0 0 328 629 0 0 629 Total 3.706 996 15 4.716 8.815 3.584 39 12.438 Pro rata viewGermany 161 318 0 479 284 1.202 0 1.486 UK 266 646 0 911 587 2.241 0 2.829 US 3.026 0 27 3.053 7.812 0 39 7.851 Denmark 0 41 0 41 0 167 0 167 Sweden 115 48 0 163 336 199 0 536 Poland 155 0 0 155 365 0 0 365 Italy 328 0 0 328 629 0 0 629 Total 4.051 1.053 27 5.131 10.014 3.809 39 13.862
Capacity (MW) Production (GWh)
1
1

Onshore wind + PV: Key data
63
Renewables
1. Net Load Factor is the amount of generation produced compared to what is theoretically possible at maximum capacity (wind does not influence this). It is calculated by the following formula: Reported generation / (Weighted average capacity x 24 hours x number of operational days in the period). Please note that reported generation may deviate from production figures shown in this presentation due to settlement adjustments.2. Load factors for Bruenning's Breeze and Radford's Run are on an estimation basis, due to late year COD and have therefore been excluded from US and total load factor calculations
Avg. Revenue (€/MWh)2016 2017 2016 Load factor %1 2017 Load factor %2 2017
Accounting viewGermany 209 220 314 17 392 21 92 UK 250 250 505 23 552 26 112 US Onshore 2.089 2.623 5.989 34 6.503 36 38 US PV + Energy storage 19 15 37 n/a 39 n/a 133 Sweden 125 123 333 30 361 33 40 Poland 161 161 322 23 377 27 54 Italy 328 328 669 23 629 22 149 Total 3.181 3.720 8.169 30 8.854 33 Pro rata viewGermany 154 161 232 17 284 20 92 UK 257 266 517 23 587 25 112 US Onshore 2.492 3.026 7.280 34 7.812 36 40 US PV + Energy storage 19 27 37 n/a 39 n/a 133 Sweden 117 115 310 30 336 33 40 Poland 155 155 312 23 365 27 54 Italy 328 328 669 23 629 22 149 Total 3.521 4.078 9.358 30 10.053 33
Capacity (MW) Production (GWh)
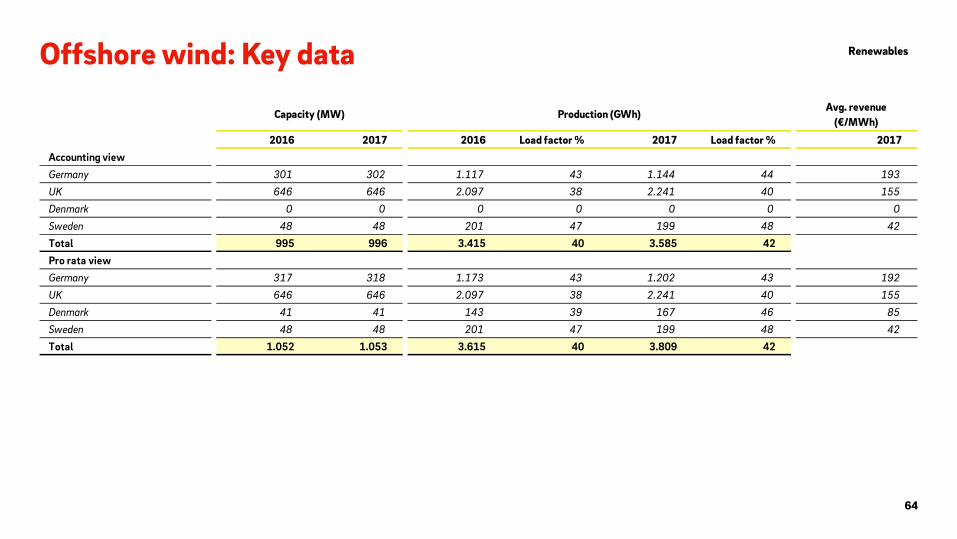
Offshore wind: Key data
64
Renewables
Avg. revenue(€/MWh)
2016 2017 2016 Load factor % 2017 Load factor % 2017Accounting viewGermany 301 302 1.117 43 1.144 44 193 UK 646 646 2.097 38 2.241 40 155 Denmark 0 0 0 0 0 0 0 Sweden 48 48 201 47 199 48 42 Total 995 996 3.415 40 3.585 42 Pro rata viewGermany 317 318 1.173 43 1.202 43 192 UK 646 646 2.097 38 2.241 40 155 Denmark 41 41 143 39 167 46 85 Sweden 48 48 201 47 199 48 42 Total 1.052 1.053 3.615 40 3.809 42
Capacity (MW) Production (GWh)
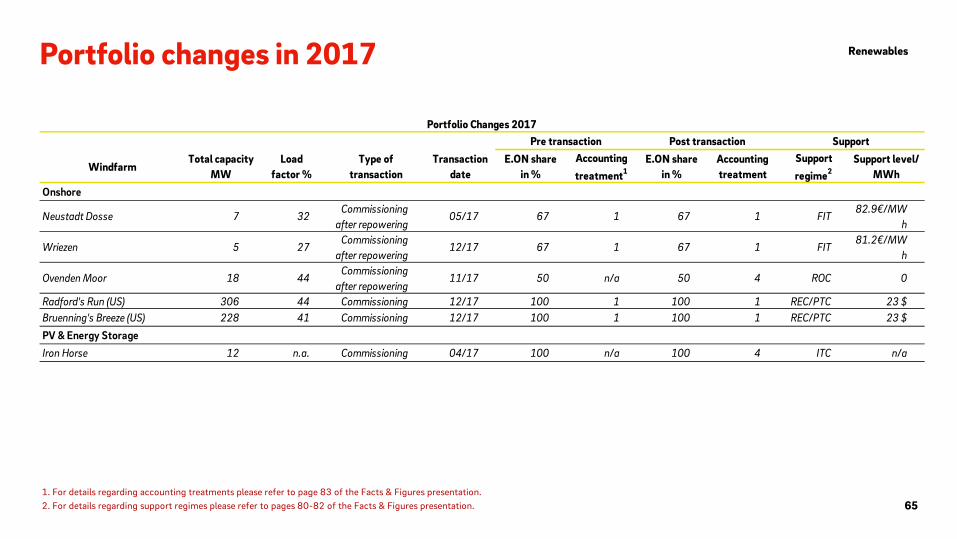
Portfolio changes in 2017
65
Renewables
1. For details regarding accounting treatments please refer to page 83 of the Facts & Figures presentation.2. For details regarding support regimes please refer to pages 80-82 of the Facts & Figures presentation.
WindfarmTotal capacity
MWLoad
factor %Type of
transactionTransaction
dateE.ON share
in %Accounting treatment1
E.ON sharein %
Accounting treatment
Support regime2
Support level/ MWh
Onshore
Neustadt Dosse 7 32 Commissioning
after repowering05/17 67 1 67 1 FIT
82.9€/MWh
Wriezen 5 27 Commissioning
after repowering12/17 67 1 67 1 FIT
81.2€/MWh
Ovenden Moor 18 44 Commissioning
after repowering11/17 50 n/a 50 4 ROC 0
Radford's Run (US) 306 44 Commissioning 12/17 100 1 100 1 REC/PTC 23 $Bruenning's Breeze (US) 228 41 Commissioning 12/17 100 1 100 1 REC/PTC 23 $PV & Energy StorageIron Horse 12 n.a. Commissioning 04/17 100 n/a 100 4 ITC n/a
Portfolio Changes 2017Pre transaction Post transaction Support

Projects under construction
66
Renewables
1. Commercial operation date2. US Remuneration only shows value of PTC3. Remuneration Arkona: 184 €/MWh for 8 years, 149 €/MWh for further 2.1 years, then 39 €/MWh for 9.9 years
Windfarm CountryTotal capacity
MWE.ON share
pro rata MWE.ON share
in %Accounting treatment
Load factor % (est.) COD1 Support
regimeSupport
expiry Support
level/MWh2
OnshoreMorcone IT 57 57 100 n/a n/a Q3/2019 CfD 2039 66/MWhStella US 201 201 100 1 41 Q4/2018 REC/PTC 2028 24 $Total Onshore 258 258 OffshoreRampion UK 400 201 50 2 42 Q2/2018 ROC 2038 1.8 ROC
Arkona 3 Germany 385 193 50 3a 46 Q2/2019 FIT 2039 184 Total Offshore 785 393 PV & Energy StorageTexas Waves - Pyron US 10 10 100 1 n/a Q1/2018 ITC 09/2032 n/aTexas Waves - Inadale US 10 10 100 1 n/a Q1/2018 ITC 09/2032 n/aTotal PV & Energy Storage 20 20
Projects under construction
67
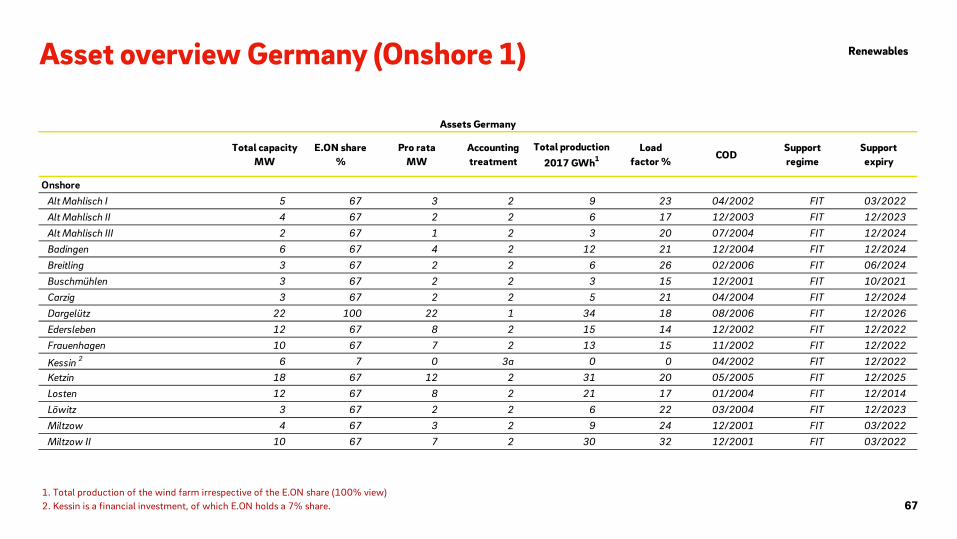
Renewables Asset overview Germany (Onshore 1)
1. Total production of the wind farm irrespective of the E.ON share (100% view)2. Kessin is a financial investment, of which E.ON holds a 7% share.
Total capacityMW
E.ON share%
Pro rataMW
Accounting treatment
Total production2017 GWh1
Loadfactor %
CODSupportregime
Supportexpiry
OnshoreAlt Mahlisch I 5 67 3 2 9 23 04/2002 FIT 03/2022Alt Mahlisch II 4 67 2 2 6 17 12/2003 FIT 12/2023Alt Mahlisch III 2 67 1 2 3 20 07/2004 FIT 12/2024Badingen 6 67 4 2 12 21 12/2004 FIT 12/2024Breitling 3 67 2 2 6 26 02/2006 FIT 06/2024Buschmühlen 3 67 2 2 3 15 12/2001 FIT 10/2021Carzig 3 67 2 2 5 21 04/2004 FIT 12/2024Dargelütz 22 100 22 1 34 18 08/2006 FIT 12/2026Edersleben 12 67 8 2 15 14 12/2002 FIT 12/2022Frauenhagen 10 67 7 2 13 15 11/2002 FIT 12/2022
Kessin 2 6 7 0 3a 0 0 04/2002 FIT 12/2022Ketzin 18 67 12 2 31 20 05/2005 FIT 12/2025Losten 12 67 8 2 21 17 01/2004 FIT 12/2014Löwitz 3 67 2 2 6 22 03/2004 FIT 12/2023Miltzow 4 67 3 2 9 24 12/2001 FIT 03/2022Miltzow II 10 67 7 2 30 32 12/2001 FIT 03/2022
Assets Germany

68
Renewables Asset overview Germany (Onshore 2)
1. Total production of the wind farm irrespective of the E.ON share (100% view)2. Insufficient data available at time of publication for calculation of load factor %
Total capacityMW
E.ON share%
Pro rataMW
Accounting treatment
Total production2017 GWh1
Loadfactor %
CODSupportregime
Supportexpiry
Mutzschen I 8 67 5 2 23 31 12/2004 FIT 01/2022Mutzschen II 6 67 4 2 18 31 09/2006 FIT 08/2023Naundorf I 14 67 9 2 18 18 04/2004 FIT 11/2023Naundorf II 4 67 3 2 9 25 02/2007 FIT 05/2023Neustadt Dosse 7 67 4 1 13 32 05/2017 FIT 02/2037Poppendorf I 5 67 3 2 10 26 01/2006 FIT 01/2025Poppendorf II 7 67 5 2 15 23 08/2007 FIT 05/2023Riethnordhausen 10 67 7 2 19 22 12/2007 FIT 12/2027Schönerlinde I 2 67 1 2 2 14 12/2002 FIT 12/2022Schönerlinde II 2 47 1 3a 0 n/a³ 12/2002 FIT 12/2022Schortewitz 15 67 10 2 17 13 11/2004 FIT 12/2024Seelow 4 67 2 2 6 18 11/2003 FIT 11/2023Thaerfelde 4 67 3 2 4 13 12/2001 FIT 12/2021Treue 8 100 8 1 17 24 09/2005 FIT 12/2025Treue Ost 8 100 8 1 14 21 07/2007 FIT 12/2027Wriezen 5 67 3 1 7 27 12/2017 FIT 12/2037
Total onshore Germany 228 161 386
Assets Germany

Asset overview Germany (Offshore)
69
Renewables
1. Total production of the wind farm irrespective of the E.ON share (100% view)2. Renumeration Alpha Ventus: 154 €/MWh for 12 years + 1.5 year on average (by turbine) due to depth of water & distance from shore, afterwards 35 €/MWh3. Remuneration Amrumbank: 194 €/MWh for 8 years +1 year on average (by turbine) due to depth of water & distance from shore, afterwards 39 €/MWh
Total capacityMW
E.ON share%
Pro rataMW
Accounting treatment
Total production2017 GWh1
Loadfactor %
CODSupportregime
Supportexpiry
Support level €/MWh
Offshore
Alpha Ventus 1 2 30 26 8 3a 110 39 03/2010 FIT 03/2030 154 Alpha Ventus 2 30 26 8 3a 110 44 08/2009 FIT 08/2029 154
Amrumbank West 3 302 100 302 1 1.144 44 10/2015 FIT 10/2024 194 Total offshore Germany 362 318 1.364 Total Germany 590 479 1.750
Assets Germany
Asset overview UK (Onshore 1)
70
Renewables
1. Total production of the wind farm irrespective of the E.ON share (100% view)
Total capacityMW
E.ON share%
Pro rataMW
Accounting treatment
Total production
2017 GWh1
Loadfactor %
CODSupportregime
Supportexpiry
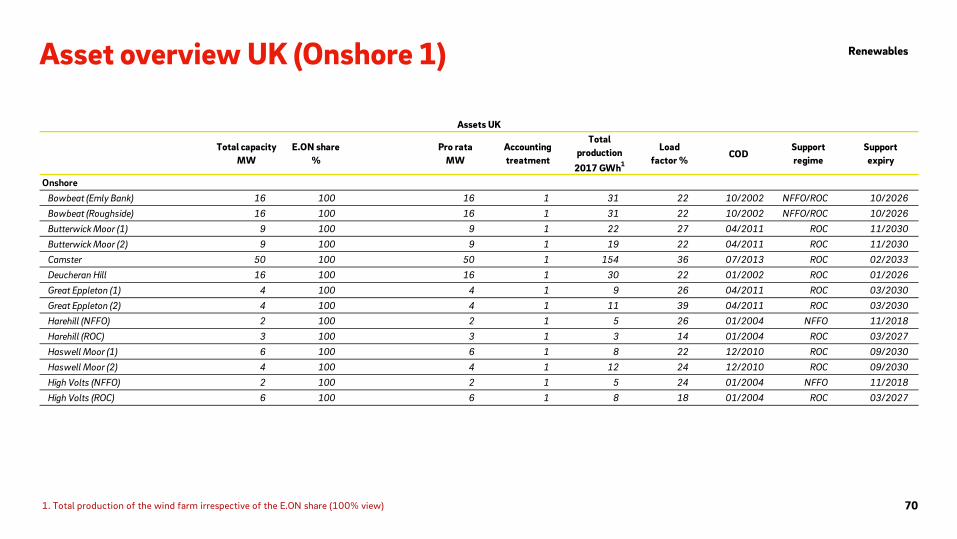
OnshoreBowbeat (Emly Bank) 16 100 16 1 31 22 10/2002 NFFO/ROC 10/2026Bowbeat (Roughside) 16 100 16 1 31 22 10/2002 NFFO/ROC 10/2026Butterwick Moor (1) 9 100 9 1 22 27 04/2011 ROC 11/2030Butterwick Moor (2) 9 100 9 1 19 22 04/2011 ROC 11/2030Camster 50 100 50 1 154 36 07/2013 ROC 02/2033Deucheran Hill 16 100 16 1 30 22 01/2002 ROC 01/2026Great Eppleton (1) 4 100 4 1 9 26 04/2011 ROC 03/2030Great Eppleton (2) 4 100 4 1 11 39 04/2011 ROC 03/2030Harehill (NFFO) 2 100 2 1 5 26 01/2004 NFFO 11/2018Harehill (ROC) 3 100 3 1 3 14 01/2004 ROC 03/2027Haswell Moor (1) 6 100 6 1 8 22 12/2010 ROC 09/2030Haswell Moor (2) 4 100 4 1 12 24 12/2010 ROC 09/2030High Volts (NFFO) 2 100 2 1 5 24 01/2004 NFFO 11/2018High Volts (ROC) 6 100 6 1 8 18 01/2004 ROC 03/2027
Assets UK

Asset overview UK (Onshore 2)
71
Renewables
71 1. Total production of the wind farm irrespective of the E.ON share (100% view)
Total capacityMW
E.ON share%
Pro rataMW
Accounting treatment
Total production
2017 GWh1
Loadfactor %
CODSupportregime
Supportexpiry
Holmside (NFFO) 2 100 2 1 4 20 01/2004 NFFO 11/2018Holmside (ROC) 3 100 3 1 5 20 01/2004 ROC 03/2027Out Newton 9 100 9 1 23 30 01/2002 ROC 03/2026Ovenden Moor 18 50 9 4 43 n.a. 11/2017 ROC 03/2037Rhyd-Y-Groes 7 50 3 4 18 31 01/1992 ROC 03/2027Rosehall 25 100 25 1 27 14 02/2013 ROC 08/2032Royd Moor 7 50 3 4 10 9 01/1993 ROC 03/2027Stags Holt 20 100 20 1 40 23 01/2007 ROC 03/2027Tween Bridge 44 100 44 1 104 28 10/2012 ROC 02/2032
Total onshore UK 281 266 622
Assets UK

Asset overview UK (Offshore)
72
Renewables
1. Total production of the wind farm irrespective of the E.ON share (100% view) except for London Array assets (pro rata production)
Total capacityMW
E.ON share%
Pro rataMW
Accounting treatment
Total production2017 GWh1
Loadfactor %
CODSupportregime
Supportexpiry
Support level ROC/MWh
OffshoreBlyth (NFFO) (decom in 2018) 2 100 2 0 0 NFFOBlyth (ROC) (decom in 2018) 2 100 2 1 0 0 01/2000 ROC 03/2027 n/aHumber 1 108 100 108 1 452 49 08/2015 ROC 03/2035 2,0 Humber 2 111 100 111 1 425 45 08/2015 ROC 03/2035 2,0 London Array LARYW-1 155 30 46 3b 166 41 05/2013 ROC 11/2032 2,0 London Array LARYW-2 158 30 48 3b 159 39 05/2013 ROC 11/2032 2,0 London Array LARYW-3 158 30 48 3b 168 41 05/2013 ROC 11/2032 2,0 London Array LARYW-4 158 30 48 3b 167 41 05/2013 ROC 11/2032 2,0 Robin Rigg East 84 100 84 1 247 34 04/2010 ROC 04/2030 2,0 Robin Rigg West 90 100 90 1 289 37 07/2009 ROC 07/2029 1,5 Scroby Sands 60 100 60 1 169 33 12/2004 ROC 03/2027 1,0
Total offshore UK 1.087 646 2.241 Total UK 1.368 911 2.864
Assets UK

Asset overview Italy
73
Renewables
1. Total production of the wind farm irrespective of the E.ON share (100% view)
Total capacityMW
E.ON share%
Pro rataMW
Accounting treatment
Total production2017 GWh1
Loadfactor %
CODSupportregime
Supportexpiry
OnshoreAlcamo 32 100 32 1 70 25 10/2011 FIP 10/2026Florinas 20 100 20 1 30 17 04/2004 expired 04/2016Iardino 14 100 14 1 22 18 10/2005 expired 11/2017Marco A. Severino 32 100 32 1 56 20 10/2007 FIP 10/2019Marco A. Severino II 12 100 12 1 21 20 10/2007 FIP 10/2019Montecute 42 100 42 1 78 21 11/2006 FIP 02/2019Montecute II 2 100 2 1 4 21 11/2006 FIP 02/2019Piano di Corda I 38 100 38 1 74 22 12/2007 FIP 02/2021Piano di Corda II 6 100 6 1 12 23 06/2010 FIP 02/2021Poggi Alti 20 100 20 1 33 19 12/2006 FIP 01/2019Santa Ninfa (Trapani) (G52 part) 9 100 9 1 17 23 01/2007 FIP 01/2019Santa Ninfa (Trapani) (G58 part) 24 100 24 1 48 23 01/2007 FIP 01/2019Serra Pelata I 42 100 42 1 99 28 12/2007 FIP 12/2019Serra Pelata II 12 100 12 1 28 23 11/2010 FIP 12/2019Vizzini 24 100 24 1 37 18 12/2006 FIP 12/2018
Total Italy 328 328 629
Assets Italy

Asset overview Denmark
74
Renewables
1. Total production of the wind farm irrespective of the E.ON share (100% view)2. Level of CfD strike price
Total capacityMW
E.ON share%
Pro rataMW
Accounting treatment
Total production2017 GWh1
Loadfactor %
CODSupportregime
Supportexpiry
Support level DKK/MWh2
OffshoreRødsand 2 207 20 41 3a 833 46 12/2010 CfD 01/2022 629
Total Denmark 207 41 833
Assets Denmark

Asset overview Sweden
75
Renewables
1. Total production of the wind farm irrespective of the E.ON share (100% view)
Total capacityMW
E.ON share%
Pro rataMW
Accounting treatment
Total production2017 GWh1
Loadfactor %
CODSupportregime
Supportexpiry
OnshoreBoel (decom) 0 100 0 1 3 33 01/2001 expired 12/2015Knäred 20 100 20 1 55 31 05/2012 Green Certificate 04/2027Lilla Edet 6 100 6 1 18 34 03/2011 Green Certificate 04/2026Lundåkra 1 & 2 4 100 4 1 10 28 01/2003 expired 12/2014Lundåkra 3 & 4 5 100 5 1 15 33 01/2008 Green Certificate 10/2018Nybro 20 90 18 2 62 36 12/2011 Green Certificate 09/2026Öringe 6 80 5 2 18 34 09/2011 Green Certificate 05/2026Örja 6 100 6 1 20 39 10/2012 Green Certificate 09/2027Örken 18 100 18 1 49 31 12/2012 Green Certificate 11/2027Skabersjö 10 51 5 2 31 36 02/2012 Green Certificate 03/2027Villköl 21 100 21 1 62 34 02/2013 Green Certificate 02/2028Vindön 7 100 7 1 17 26 01/1996 expired 01/2011
Total onshore Sweden 123 115 361 Offshore
Karehamn 48 100 48 1 199 48 10/2013 Green Certificate 07/2028Total offshore Sweden 48 48 199 Total Sweden 171 163 561
Assets Sweden

Asset overview Poland
76
Renewables
1. Total production of the wind farm irrespective of the E.ON share (100% view)
Total capacityMW
E.ON share%
Pro rataMW
Accounting treatment
Total production2017 GWh1
Loadfactor %
CODSupportregime
Supportexpiry
OnshoreBarzowice I 21 100 21 1 68 38 09/2011 Green certificate 07/2026Lebcz I 8 67 5 2 18 27 01/2007 Green certificate 06/2022Lebcz II 10 67 7 2 18 21 01/2008 Green certificate 09/2023Wielkopolska 53 100 53 1 131 28 07/2010 Green certificate 03/2025Wielkopolska 2a 15 100 15 1 34 26 01/2014 Green certificate 10/2029Wysoka 8 100 8 1 14 23 03/2013 Green certificate 09/2028Wysoka II 48 100 48 1 94 23 01/2014 Green certificate 09/2029
Total Poland 161 155 377
Assets Poland

Asset overview US (1)
77
Renewables
1. Total production of the wind farm irrespective of the E.ON share (100% view)
2. Load factors for Bruenning's Breeze and Radford's run are on an estimation basis due to late year COD
3. US Remuneration only shows value of PTC
Total capacityMW
E.ON share%
Pro RataMW
Accountingtreatment
Total production2017 GWh1
Loadfactor %2 COD
Supportregime
Supportexpiry
Support level $/MWh3 PPA
OnshoreAnacacho 100 100 100 1 333 39 12/2012 REC/PTC 12/2022 24 yesBruenning's Breeze 228 100 228 1 53 41 12/2017 REC/PTC 12/2027 24 noChampion 127 100 127 1 366 34 02/2008 REC/PTC 02/2018 24 noColbeck’s Corner (Grandview II) 200 100 200 1 838 49 05/2016 REC/PTC 05/2026 24 yesForest Creek 124 100 124 1 387 36 03/2007 REC/PTC expired noGrand View I 211 50 106 3a 835 46 12/2014 REC/PTC 12/2024 24 noInadale 197 100 197 1 509 30 09/2009 REC expired noMagic Valley I 203 20 41 3a 677 39 10/2012 REC/PTC 09/2022 24 yesMunnsville 35 100 35 1 97 33 10/2007 PTC expired yesPanther Creek - Phase I 143 100 143 1 479 39 09/2008 REC/PTC 12/2018 24 noPanther Creek - Phase II 116 100 116 1 375 37 12/2008 REC/PTC 12/2018 24 noPanther Creek - Phase III 200 100 200 1 609 35 08/2009 REC expired noPapalote Creek I 180 50 90 3a 511 33 09/2009 REC expired yesPapalote Creek II 200 50 100 3a 567 33 12/2010 REC expired yes
Assets US
Asset overview US (2)
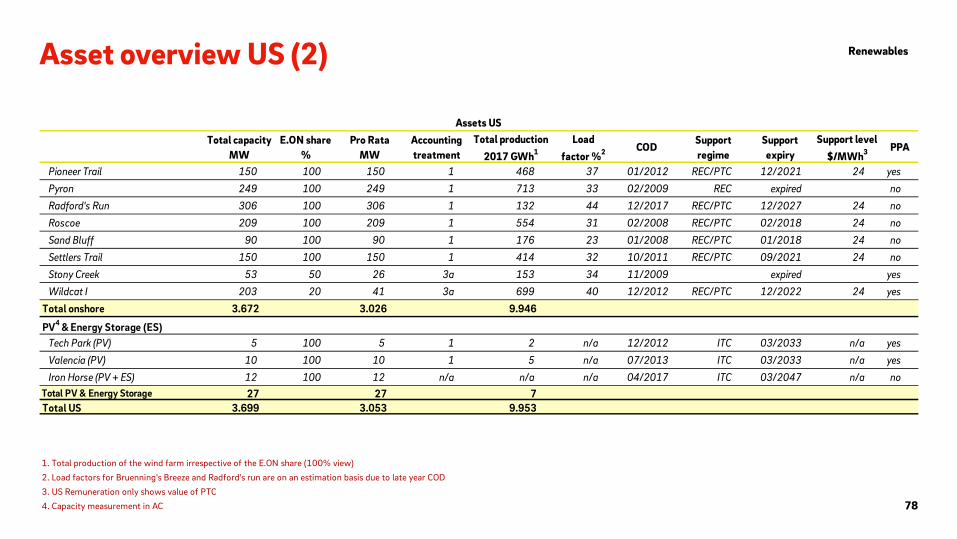
78
Renewables
1. Total production of the wind farm irrespective of the E.ON share (100% view)
2. Load factors for Bruenning's Breeze and Radford's run are on an estimation basis due to late year COD
3. US Remuneration only shows value of PTC
4. Capacity measurement in AC
Total capacityMW
E.ON share%
Pro RataMW
Accountingtreatment
Total production2017 GWh1
Loadfactor %2 COD
Supportregime
Supportexpiry
Support level $/MWh3 PPA
Pioneer Trail 150 100 150 1 468 37 01/2012 REC/PTC 12/2021 24 yesPyron 249 100 249 1 713 33 02/2009 REC expired noRadford's Run 306 100 306 1 132 44 12/2017 REC/PTC 12/2027 24 noRoscoe 209 100 209 1 554 31 02/2008 REC/PTC 02/2018 24 noSand Bluff 90 100 90 1 176 23 01/2008 REC/PTC 01/2018 24 noSettlers Trail 150 100 150 1 414 32 10/2011 REC/PTC 09/2021 24 noStony Creek 53 50 26 3a 153 34 11/2009 expired yesWildcat I 203 20 41 3a 699 40 12/2012 REC/PTC 12/2022 24 yes
Total onshore 3.672 3.026 9.946
PV4 & Energy Storage (ES)Tech Park (PV) 5 100 5 1 2 n/a 12/2012 ITC 03/2033 n/a yesValencia (PV) 10 100 10 1 5 n/a 07/2013 ITC 03/2033 n/a yesIron Horse (PV + ES) 12 100 12 n/a n/a n/a 04/2017 ITC 03/2047 n/a no
Total PV & Energy Storage 27 27 7 Total US 3.699 3.053 9.953
Assets US
79
Renewables Regulatory support
E.ON Renewables footprint (2017)1 Revenues
Duration of regulated revenues
~ 9 years
Onshore Offshore
Merchant: Wholesale power price, Variable certificates
Quasi-regulated: Feed in tariffs, Production Tax Credits (PTC),
Contracts for Difference (CfD), Fixed Power Purchase Agreements
(PPAs), Long-term hedges, Fixed certificates
~ 7 years ~ 11 years
Total
1. Based on pro rata view
36%
6-10 Years
38%
3-5 Years
12%
1-2 Years
13%
11-25 Years
11-25 Years
21%
6-10 Years
25%
3-5 Years
21%
1-2 Years
33%
1-2 Years
0%
3-5 Years
47%
11-25 Years
6%
47%
6-10 Years
28% 72%
Quasi-regulated Merchant
80
Renewables Current regulatory regimes and frameworks
1. Production Tax Credit (PTC) annually inflation-adjusted, paying out over 10 years. Eligible projects receive 100% ($23.00) in the first year, thereafter 80% ($18.40), 60% ($13.80) and 40% ($9.20). 2. Investment Tax Credit (ITC) for solar amounts to 30% for projects that have begun construction before 2020, then gradually decreases to 10% level for projects starting construction after 2021. Investment Tax Credit (ITC)
also applies to wind: 30% for projects with construction before 2017 3. At a CfD (Contract for Difference) auction, bidders submit a price/MWh they want to achieve. In case they are successful, they will sell their power on the market, but receive the difference between market price and bid level
from the regulator.
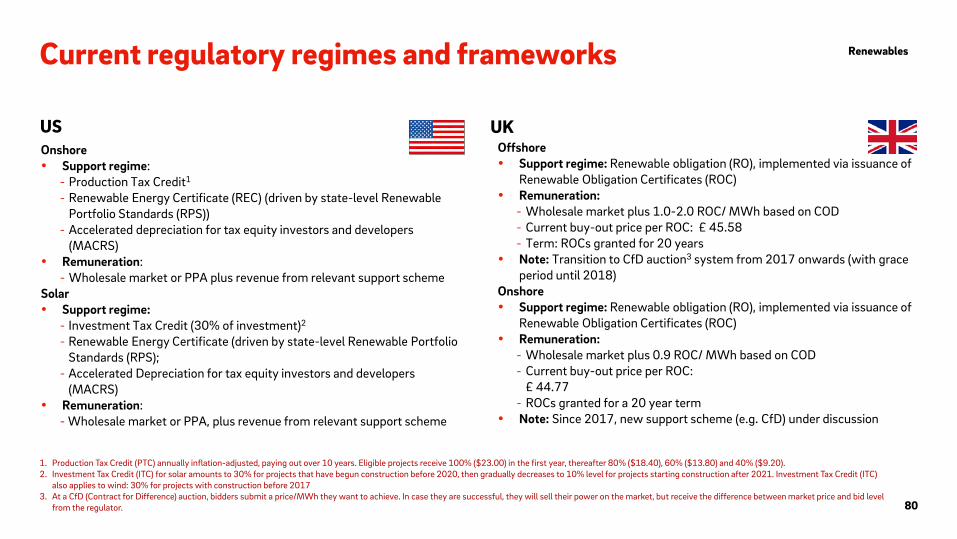
US UK Onshore Support regime:
- Production Tax Credit1 - Renewable Energy Certificate (REC) (driven by state-level Renewable
Portfolio Standards (RPS)) - Accelerated depreciation for tax equity investors and developers
(MACRS) Remuneration:
- Wholesale market or PPA plus revenue from relevant support scheme Solar Support regime:
- Investment Tax Credit (30% of investment)2 - Renewable Energy Certificate (driven by state-level Renewable Portfolio
Standards (RPS); - Accelerated Depreciation for tax equity investors and developers
(MACRS) Remuneration:
- Wholesale market or PPA, plus revenue from relevant support scheme
Offshore Support regime: Renewable obligation (RO), implemented via issuance of
Renewable Obligation Certificates (ROC) Remuneration:
- Wholesale market plus 1.0-2.0 ROC/ MWh based on COD - Current buy-out price per ROC: £ 45.58 - Term: ROCs granted for 20 years
Note: Transition to CfD auction3 system from 2017 onwards (with grace period until 2018)
Onshore Support regime: Renewable obligation (RO), implemented via issuance of
Renewable Obligation Certificates (ROC) Remuneration:
- Wholesale market plus 0.9 ROC/ MWh based on COD - Current buy-out price per ROC: £ 44.77 - ROCs granted for a 20 year term
Note: Since 2017, new support scheme (e.g. CfD) under discussion
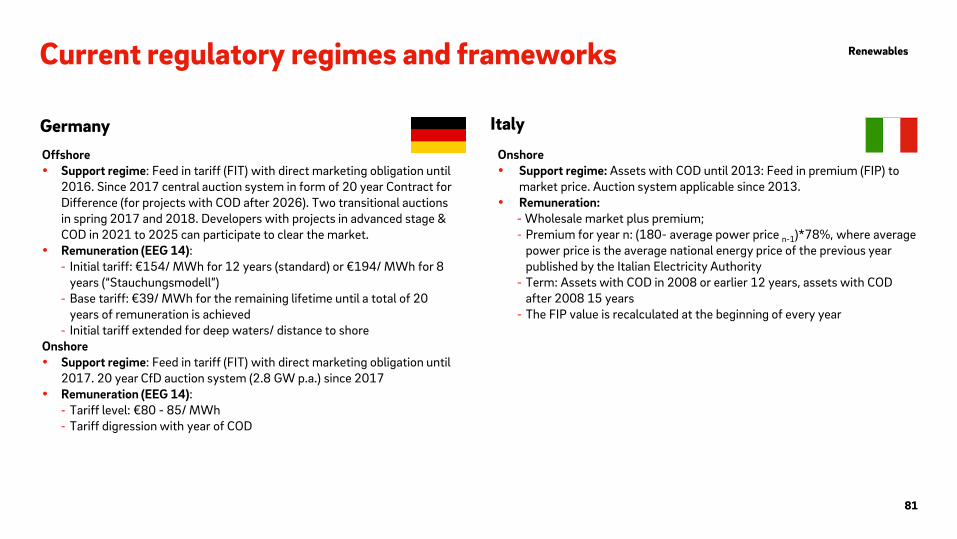
Current regulatory regimes and frameworks
81
Renewables
Germany Italy
Onshore Support regime: Assets with COD until 2013: Feed in premium (FIP) to
market price. Auction system applicable since 2013. Remuneration:
- Wholesale market plus premium; - Premium for year n: (180- average power price n-1)*78%, where average
power price is the average national energy price of the previous year published by the Italian Electricity Authority
- Term: Assets with COD in 2008 or earlier 12 years, assets with COD after 2008 15 years
- The FIP value is recalculated at the beginning of every year
Offshore Support regime: Feed in tariff (FIT) with direct marketing obligation until
2016. Since 2017 central auction system in form of 20 year Contract for Difference (for projects with COD after 2026). Two transitional auctions in spring 2017 and 2018. Developers with projects in advanced stage & COD in 2021 to 2025 can participate to clear the market.
Remuneration (EEG 14): - Initial tariff: €154/ MWh for 12 years (standard) or €194/ MWh for 8
years (“Stauchungsmodell”) - Base tariff: €39/ MWh for the remaining lifetime until a total of 20
years of remuneration is achieved - Initial tariff extended for deep waters/ distance to shore
Onshore Support regime: Feed in tariff (FIT) with direct marketing obligation until
2017. 20 year CfD auction system (2.8 GW p.a.) since 2017 Remuneration (EEG 14):
- Tariff level: €80 - 85/ MWh - Tariff digression with year of COD

Current regulatory regimes and frameworks
82
Renewables
Sweden Poland
Onshore Support regime: Green certificates until
2016. Transition to auction system in 2016, auctions for different renewable technologies, e.g. wind onshore 150 MW in 2018
Remuneration: - Offtake agreement with DSO until end of
2017 at regulated power price - Green certificates - Term of green certificates: Full lifetime of
the assets - The value of green certificates depends on
bilateral offtake agreements
Onshore/ Offshore Support regime: Green certificates Remuneration:
- Wholesale market plus green certificates per MWh of production
- Term of green certificates: 15 years - The value of green certificates depends
on bilateral offtake agreements
Denmark Denmark Offshore Support regime: Contract for difference
(CfD), whereby CfD strike price is derived through auction process
Remuneration: - Wholesale market plus CfD premium to
reach CfD strike price - Term: Earlier of 10 TWh of production or
20 years from COD

Accounting treatment of renewable assets in E.ON financial statements1
83
Renewables
1. Disregarding any financing structures (e.g. Tax equity, project financing etc.)2. Dividends
Model 1 (full consolidation)
Model 2(full consolidation)
Model 3a(at equity consolidation)
Model 3b (pro rata consolidation)
Model 4 (At costs consolidation)
E.ON share of project 100% >50% < 100% = < 50% = < 50% n/aCapacity viewPro rata MW 100% pro rata pro rata pro rata n/aAccounting MW 100% 100% n/a pro rata n/aProfit and loss statementContribution to EBITDA 100% 100% 0% pro rata 0%Contribution to depreciation 100% 100% 0% pro rata 0%Contribution to EBIT 100% 100% 0% pro rata 0%Contribution to at equity income as part of EBIT n/a n/a pro rata n/a pro rataMinorities n/a (100% - E.ON share) n/a n/a n/aCash flow statement n/aConsideration in operating cash flow
100% 100% pro rata² pro rata pro rata
Consideration in investing cash flow 100% 100% pro rata pro rata pro rata
Consideration in financing cash flow1 n/a (100% - E.ON share) n/a n/a n/aBalance sheet assetsConsolidated assets 100% 100% n/a pro rata n/aEquity investments n/a n/a pro rata n/a pro rata

Content
1. Overview
2. Energy Networks
3. Customer Solutions
4. Renewables
5. PreussenElektra
6. Other
7. Financials
2
7
43
58
84
90
92
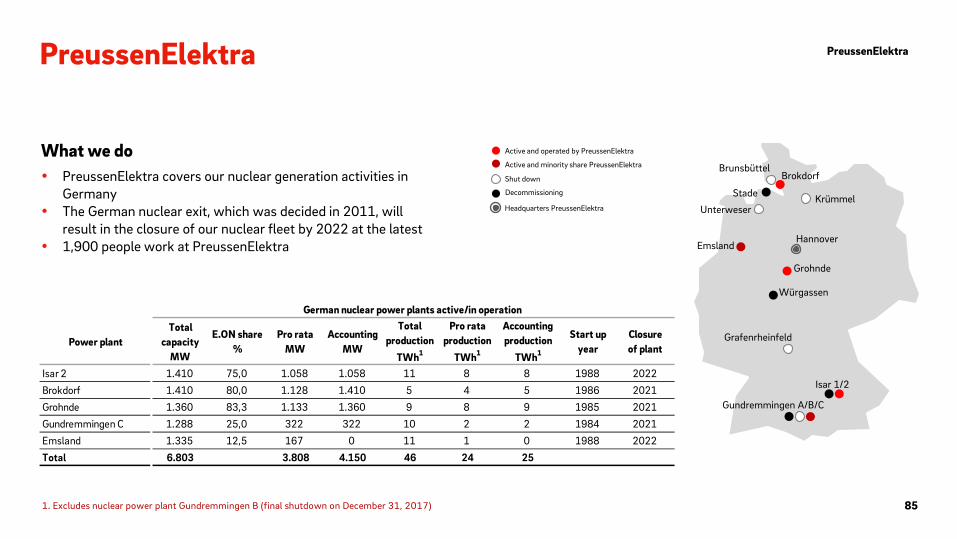
PreussenElektra PreussenElektra
Brunsbüttel Brokdorf
Stade
Unterweser Krümmel
Hannover Emsland
Grohnde
Würgassen
Grafenrheinfeld
Isar 1/2
Gundremmingen A/B/C
PreussenElektra covers our nuclear generation activities in Germany
The German nuclear exit, which was decided in 2011, will result in the closure of our nuclear fleet by 2022 at the latest
1,900 people work at PreussenElektra
What we do Shut down
Decommissioning
Active and operated by PreussenElektra
Active and minority share PreussenElektra
Headquarters PreussenElektra
85 1. Excludes nuclear power plant Gundremmingen B (final shutdown on December 31, 2017)
Power plantTotal
capacityMW
E.ON share%
Pro rataMW
AccountingMW
Total production
TWh1
Pro rata production
TWh1
Accounting production
TWh1
Start upyear
Closureof plant
Isar 2 1.410 75,0 1.058 1.058 11 8 8 1988 2022Brokdorf 1.410 80,0 1.128 1.410 5 4 5 1986 2021Grohnde 1.360 83,3 1.133 1.360 9 8 9 1985 2021Gundremmingen C 1.288 25,0 322 322 10 2 2 1984 2021Emsland 1.335 12,5 167 0 11 1 0 1988 2022Total 6.803 3.808 4.150 46 24 25
German nuclear power plants active/in operation

Financials and nuclear power sales
86
PreussenElektra
1. Adjusted for non-operating effects
€m 2016 2017Revenues 1.538 1.585
Adjusted EBITDA1 644 654
Adjusted EBIT1 553 506 Investments (cash-effective) 15 14
Financials
2016 2017 Owned generation (Accounting view) 32,4 27,5 Purchases 4,3 9,9
thereof jointly owned power plants (E.ON has minority interest) 1,3 1,3 thereof third parties (long term contracts) 3,0 8,6
Total power procurement 36,7 37,4 Station use, line loss -0,1 -0,2 Power sales 36,6 37,2
Nuclear power sales (TWh)

Decommissioning (1)
87
PreussenElektra
Capacity MW
E.ON share%
Shut downyear
Start ofdecommissioning
Currentphase
Progress of decommissioning
E.ON as operator
Würgassen 670 100 1995 1997 DecommissioningStade 640 67 2003 2005 DecommissioningIsar 1 878 100 2011 2017 DecommissioningGrafenrheinfeld 1.275 100 2015 2018 Final shut downUnterweser 1.345 100 2011 2018 Final shut downE.ON as minority shareholderBrunsbüttel 771 33 2011 2018 Final shut downKrümmel 1.364 50 2011 2019 Shut down
Gundremmingen A 237 25 1980 1983 Reconstruction as Technology Center
Gundremmingen B 1.284 25 2017 2018 Final shut down
German nuclear power plants shut down
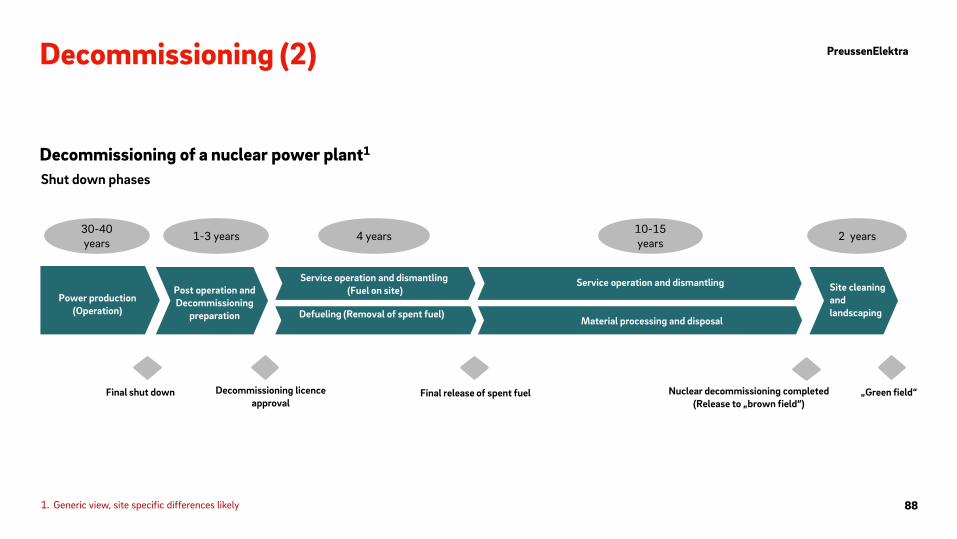
Final shut down Nuclear decommissioning completed (Release to „brown field“)
Decommissioning licence approval
Final release of spent fuel
4 years 30-40 years
10-15 years 2 years
„Green field“
1-3 years
Service operation and dismantling (Fuel on site) Post operation and
Decommissioning preparation Defueling (Removal of spent fuel)
Service operation and dismantling
Material processing and disposal
Site cleaning and landscaping
Decommissioning (2)
Decommissioning of a nuclear power plant1
Power production (Operation)
Shut down phases
PreussenElektra
88 1. Generic view, site specific differences likely

Provision utilization for German nuclear
Provisions for decommissioning
89 1. Disregarding any provision utilization in the decommissioning provision 2. Actual amount of the obligations as per year-end 2017 excl. effects of discounting and cost increases
Schematic illustration of provision building at E.ON1
237
630
2016 2017
€m
PreussenElektra
t+n t+2 t+1 t0 t0
Real discount rate: -0.9%
Costs for decommissioning
Accretion
Decommissioning provisions
Current cost approach2 used for AROs that apply negative real interest rates

Content
1. Overview
2. Energy Networks
3. Customer Solutions
4. Renewables
5. PreussenElektra
6. Other
7. Financials
2
7
43
58
84
90
92

Relevant at equity participations of E.ON
91
1. Direct and indirect share2. Uranit GmbH is a joint venture between RWE AG and E.ON SE.3. Relevant from 2017 onwards
Company Description E.ON share1
%At equity contribution
to E.ON result 2017 (€m)
Energy Networks GermanyStädtische Werke Magdeburg GmbH & Co. KG Municipal utility (energy, water) in the city of Magdeburg 26,7 17,1Energie und Wasser Potsdam GmbH Municipal utility (energy, water) in the city of Potsdam 35,0 10,6REWAG Regensburger Energie- und Wasserversorgung Municipal utility (energy, water) in the city of Regensburg 35,5 8,0Stadtwerke Brandenburg an der Havel GmbH & Co. KG Municipal utility (energy, gas and heat) in the city of Brandenburg an der Havel 36,8 6,1CEE&TurkeyZápadoslovenská energetika a.s. Integrated utility in Slovakia (generation, distribution, retail) 49,0 48,2Enerjisa Enerji A.Ş. Integrated utility in Turkey (distribution and retail) 50,0 23,4Enerjisa Üretim Integrated utility in Turkey (generation) 50,0 -27,9Customer SolutionsGasag Berliner Gaswerke Aktiengesellschaft Utility (power, gas, energy services) in the city of Berlin 36,9 9,3ŠKO-ENERGO FIN, s.r.o. Electricity generation company (main customer: Škoda Auto) 42,5 5,7Non-core business (PreussenElektra)
Uranit GmbH2 Uranit GmbH is a holding company holding 33% of Urenco Ltd. Urenco Ltd. is an international company active in uranium mining, conversion, enrichment and fabrication.
50,0 49,1
Other Nord Stream AG Owner and operator of the Nord Stream gas pipeline from Russia to Europe 15,5 67,0Not reflected in Adjusted EBIT/ Net Income
Uniper SE3 Upstream electricity generation company 46,7 466,4

Content
1. Overview
2. Energy Networks
3. Customer Solutions
4. Renewables
5. PreussenElektra
6. Other
7. Financials
2
7
43
58
84
90
92

93
E.ON Quarterly Financials – P&L
1. All figures up to Q1/2016 on a pro forma basis2. Adjusted for non-operating effects
€m Q1 20161 Q2 2016 H1 2016 Q3 2016 9M 2016 Q4 2016 FY 2016Sales 11.271 8.983 20.254 7.944 28.198 9.975 38.173
Adjusted EBITDA2 2.012 889 2.901 739 3.640 1.299 4.939 Depreciation/amortization recognized in Adjusted EBIT -441 -459 -900 -429 -1.329 -498 -1.827Adjusted EBIT2 1.571 430 2.001 310 2.311 801 3.112 Economic interest expense (net) -422 -388 -810 -308 -1.118 -334 -1.452
Adjusted EBT2 1.149 42 1.191 2 1.193 467 1.660 Income Taxes on Adjusted EBT -384 -72 -456 69 -387 -91 -478% of Adjusted EBT 33% 171% 38% -3450% 32% 19% 29%Non-controlling interest on results of operations -107 -24 -131 -34 -165 -113 -278
Adjusted Net Income2 658 -54 604 37 641 263 904
€m Q1 2017 Q2 2017 H1 2017 Q3 2017 9M 2017 Q4 2017 FY 2017Sales 10.480 9.103 19.583 8.354 27.937 10.028 37.965
Adjusted EBITDA2 1.517 1.198 2.715 825 3.540 1.415 4.955 Depreciation/amortization recognized in Adjusted EBIT -479 -469 -948 -475 -1.423 -458 -1.881Adjusted EBIT2 1.038 729 1.767 350 2.117 957 3.074 Economic interest expense (net) -195 -188 -383 -192 -575 -169 -744
Adjusted EBT2 843 541 1.384 158 1.542 788 2.330 Income Taxes on Adjusted EBT -210 -137 -347 -39 -386 -227 -613% of Adjusted EBT 25% 25% 25% 25% 25% 29% 26%Non-controlling interest on results of operations -108 -48 -156 -35 -191 -99 -290
Adjusted Net Income2 525 356 881 84 965 462 1.427

E.ON Quarterly Financials – KPIs
94 1. Q1/2016 on a pro forma basis
€m Q1 20161 Q2 2016 H1 2016 Q3 2016 9M 2016 Q4 2016 FY 2016
Energy Networks 4.181 4.141 8.322 3.885 12.207 3.685 15.892 Germany 3.458 3.544 7.002 3.286 10.288 2.917 13.205
Sweden 276 233 509 227 736 293 1.029
CEE & Turkey 447 364 811 372 1.183 475 1.658
Customer Solutions 7.099 4.898 11.997 4.082 16.079 6.289 22.368 Germany 2.414 1.736 4.150 1.376 5.526 2.255 7.781
UK 2.635 1.721 4.356 1.320 5.676 2.115 7.791
Other 2.050 1.441 3.491 1.386 4.877 1.919 6.796
Renewables 397 283 680 342 1.022 335 1.357 Onshore Wind/ PV 196 151 347 220 567 161 728
Offshore Wind/ Other 201 132 333 122 455 174 629
Corporate Functions/ Other 237 259 496 259 755 279 1.034 Consolidation -1.165 -916 -2.081 -942 -3.023 -1.083 -4.106 Non-core business (PreussenElektra) 453 298 751 317 1.068 470 1.538 Other (Divested Operations) 69 20 89 1 90 0 90 Total 11.271 8.983 20.254 7.944 28.198 9.975 38.173
Sales

E.ON Quarterly Financials – KPIs
95
€m Q1 2017 Q2 2017 H1 2017 Q3 2017 9M 2017 Q4 2017 FY 2017
Energy Networks 4.199 4.428 8.627 4.240 12.867 4.123 16.990 Germany 3.426 3.782 7.208 3.589 10.797 3.402 14.199
Sweden 298 265 563 268 831 241 1.072
CEE & Turkey 475 381 856 383 1.239 480 1.719
Customer Solutions 6.546 4.649 11.195 4.284 15.479 6.088 21.567 Germany 2.291 1.626 3.917 1.507 5.424 2.028 7.452
UK 2.151 1.572 3.723 1.360 5.083 2.122 7.205
Other 2.104 1.451 3.555 1.417 4.972 1.938 6.910
Renewables 376 334 710 420 1.130 474 1.604 Onshore Wind/ PV 188 201 389 302 691 236 927
Offshore Wind/ Other 188 133 321 118 439 238 677
Corporate Functions/ Other 197 195 392 170 562 234 796 Consolidation -1.202 -1.030 -2.232 -1.099 -3.331 -1.246 -4.577Non-core business (PreussenElektra) 364 527 891 339 1.230 355 1.585 Other (Divested Operations) 0 Total 10.480 9.103 19.583 8.354 27.937 10.028 37.965
Sales
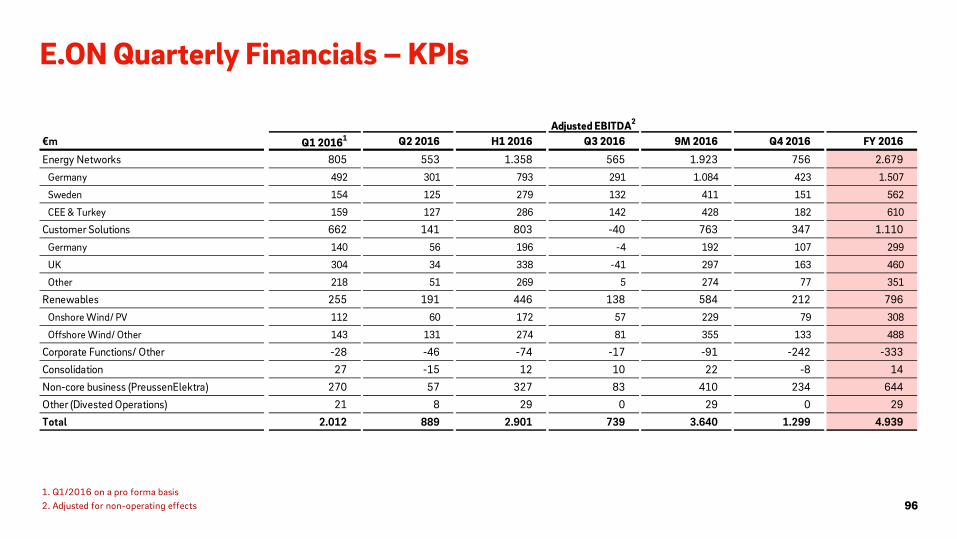
E.ON Quarterly Financials – KPIs
96 1. Q1/2016 on a pro forma basis 2. Adjusted for non-operating effects
€m Q1 20161 Q2 2016 H1 2016 Q3 2016 9M 2016 Q4 2016 FY 2016
Energy Networks 805 553 1.358 565 1.923 756 2.679 Germany 492 301 793 291 1.084 423 1.507
Sweden 154 125 279 132 411 151 562
CEE & Turkey 159 127 286 142 428 182 610
Customer Solutions 662 141 803 -40 763 347 1.110 Germany 140 56 196 -4 192 107 299
UK 304 34 338 -41 297 163 460
Other 218 51 269 5 274 77 351
Renewables 255 191 446 138 584 212 796 Onshore Wind/ PV 112 60 172 57 229 79 308
Offshore Wind/ Other 143 131 274 81 355 133 488
Corporate Functions/ Other -28 -46 -74 -17 -91 -242 -333 Consolidation 27 -15 12 10 22 -8 14 Non-core business (PreussenElektra) 270 57 327 83 410 234 644 Other (Divested Operations) 21 8 29 0 29 0 29 Total 2.012 889 2.901 739 3.640 1.299 4.939
Adjusted EBITDA2
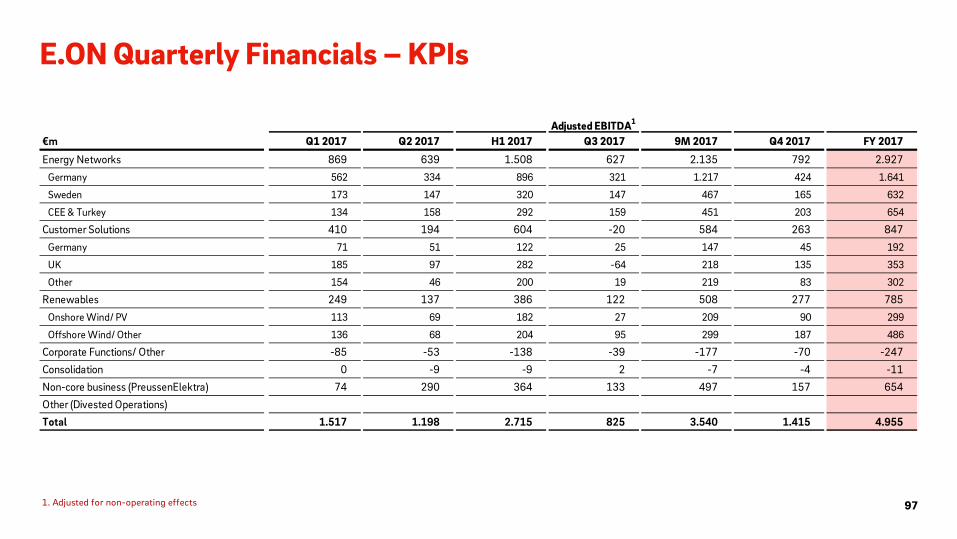
E.ON Quarterly Financials – KPIs
97 1. Adjusted for non-operating effects
€m Q1 2017 Q2 2017 H1 2017 Q3 2017 9M 2017 Q4 2017 FY 2017
Energy Networks 869 639 1.508 627 2.135 792 2.927 Germany 562 334 896 321 1.217 424 1.641
Sweden 173 147 320 147 467 165 632
CEE & Turkey 134 158 292 159 451 203 654
Customer Solutions 410 194 604 -20 584 263 847 Germany 71 51 122 25 147 45 192
UK 185 97 282 -64 218 135 353
Other 154 46 200 19 219 83 302
Renewables 249 137 386 122 508 277 785 Onshore Wind/ PV 113 69 182 27 209 90 299
Offshore Wind/ Other 136 68 204 95 299 187 486
Corporate Functions/ Other -85 -53 -138 -39 -177 -70 -247 Consolidation 0 -9 -9 2 -7 -4 -11 Non-core business (PreussenElektra) 74 290 364 133 497 157 654 Other (Divested Operations)Total 1.517 1.198 2.715 825 3.540 1.415 4.955
Adjusted EBITDA1

E.ON Quarterly Financials – KPIs
98 1. Q1/2016 on a pro forma basis 2. Adjusted for non-operating effects
€m Q1 20161 Q2 2016 H1 2016 Q3 2016 9M 2016 Q4 2016 FY 2016
Energy Networks 570 302 872 324 1.196 475 1.671 Germany 348 144 492 146 638 256 894
Sweden 113 84 197 91 288 110 398
CEE & Turkey 109 74 183 87 270 109 379
Customer Solutions 588 71 659 -111 548 264 812 Germany 120 44 164 -20 144 88 232
UK 280 11 291 -64 227 138 365
Other 188 16 204 -27 177 38 215
Renewables 163 91 254 55 309 121 430 Onshore Wind/ PV 59 -6 53 13 66 26 92
Offshore Wind/ Other 104 97 201 42 243 95 338
Corporate Functions/ Other -43 -66 -109 -28 -137 -261 -398 Consolidation 24 -11 13 8 21 -6 15 Non-core business (PreussenElektra) 248 35 283 62 345 208 553 Other (Divested Operations) 21 8 29 0 29 0 29 Total 1.571 430 2.001 310 2.311 801 3.112
Adjusted EBIT2

E.ON Quarterly Financials – KPIs
99 1. Adjusted for non-operating effects
€m Q1 2017 Q2 2017 H1 2017 Q3 2017 9M 2017 Q4 2017 FY 2017
Energy Networks 630 396 1.026 391 1.417 524 1.941 Germany 418 188 606 182 788 262 1.050
Sweden 132 107 239 106 345 129 474
CEE & Turkey 80 101 181 103 284 133 417
Customer Solutions 330 119 449 -96 353 173 526 Germany 52 34 86 7 93 25 118
UK 161 72 233 -89 144 106 250
Other 117 13 130 -14 116 42 158
Renewables 160 45 205 43 248 206 454 Onshore Wind/ PV 61 16 77 -15 62 55 117
Offshore Wind/ Other 99 29 128 58 186 151 337
Corporate Functions/ Other -111 -67 -178 -72 -250 -92 -342 Consolidation 2 -8 -6 -2 -8 -3 -11 Non-core business (PreussenElektra) 27 244 271 86 357 149 506 Other (Divested Operations)Total 1.038 729 1.767 350 2.117 957 3.074
Adjusted EBIT1

E.ON Quarterly Financials – KPIs
100 1. Q1/2016 on a pro forma basis
€m Q1 20161 Q2 2016 H1 2016 Q3 2016 9M 2016 Q4 2016 FY 2016
Energy Networks 567 942 1.509 1.092 2.601 168 2.768 Germany 308 621 929 880 1.809 -221 1.588
Sweden 122 156 278 120 398 177 575
CEE & Turkey 137 165 302 92 394 211 605
Customer Solutions 119 430 549 591 1.140 27 1.167 Germany -79 11 -68 420 352 -1 351
UK -13 149 136 147 283 152 435
Other 211 270 481 24 505 -124 381
Renewables 207 200 407 118 525 174 699 Corporate Functions/ Other -349 -230 -579 -160 -739 -40 -779 Consolidation 7 5 12 4 16 -13 3 Non-core business (PreussenElektra) 223 138 361 -102 259 -166 93 Other (Divested Operations) 0 23 23 2 25 -2 23 Total 774 1.508 2.282 1.545 3.827 147 3.974
OCFbIT

E.ON Quarterly Financials – KPIs
101
€m Q1 2017 Q2 2017 H1 2017 Q3 2017 9M 2017 Q4 2017 FY 2017
Energy Networks 1.016 722 1.738 1.235 2.973 723 3.696 Germany 722 392 1.114 992 2.106 345 2.451
Sweden 142 163 305 138 443 197 640
CEE & Turkey 152 167 319 105 424 181 605
Customer Solutions -155 586 431 301 732 235 967 Germany -186 57 -129 355 226 91 317
UK 10 275 285 -56 229 174 403
Other 21 254 275 2 277 -30 247
Renewables 187 50 237 303 540 61 601 Corporate Functions/ Other -231 12 -219 -42 -261 114 -147 Consolidation 3 -3 0 -6 -6 11 5 Non-core business (PreussenElektra) 207 2.866 3.073 -10.142 -7.069 -288 -7.357 Other (Divested Operations)Total 1.027 4.233 5.260 -8.351 -3.091 856 -2.235
OCFbIT
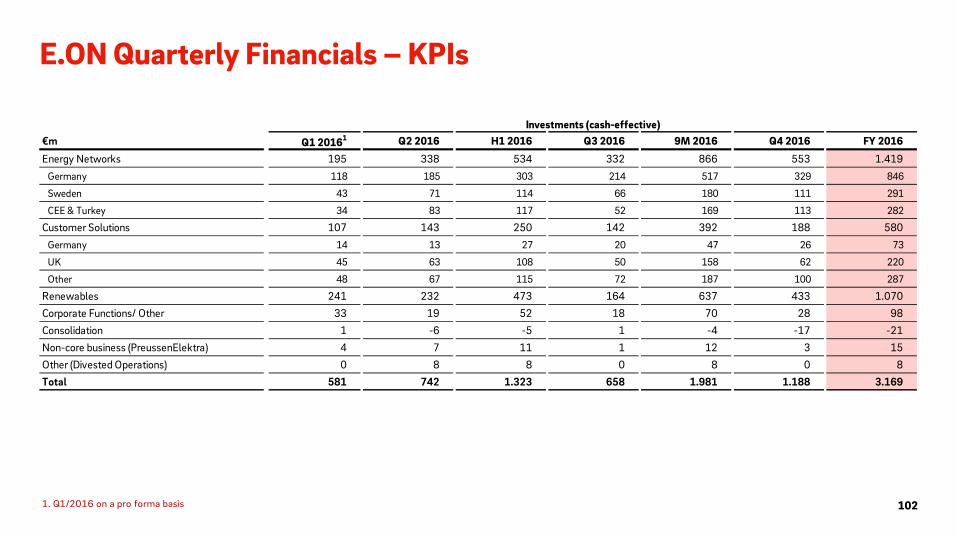
E.ON Quarterly Financials – KPIs
102 1. Q1/2016 on a pro forma basis
€m Q1 20161 Q2 2016 H1 2016 Q3 2016 9M 2016 Q4 2016 FY 2016
Energy Networks 195 338 534 332 866 553 1.419 Germany 118 185 303 214 517 329 846
Sweden 43 71 114 66 180 111 291
CEE & Turkey 34 83 117 52 169 113 282
Customer Solutions 107 143 250 142 392 188 580 Germany 14 13 27 20 47 26 73
UK 45 63 108 50 158 62 220
Other 48 67 115 72 187 100 287
Renewables 241 232 473 164 637 433 1.070 Corporate Functions/ Other 33 19 52 18 70 28 98 Consolidation 1 -6 -5 1 -4 -17 -21 Non-core business (PreussenElektra) 4 7 11 1 12 3 15 Other (Divested Operations) 0 8 8 0 8 0 8 Total 581 742 1.323 658 1.981 1.188 3.169
Investments (cash-effective)
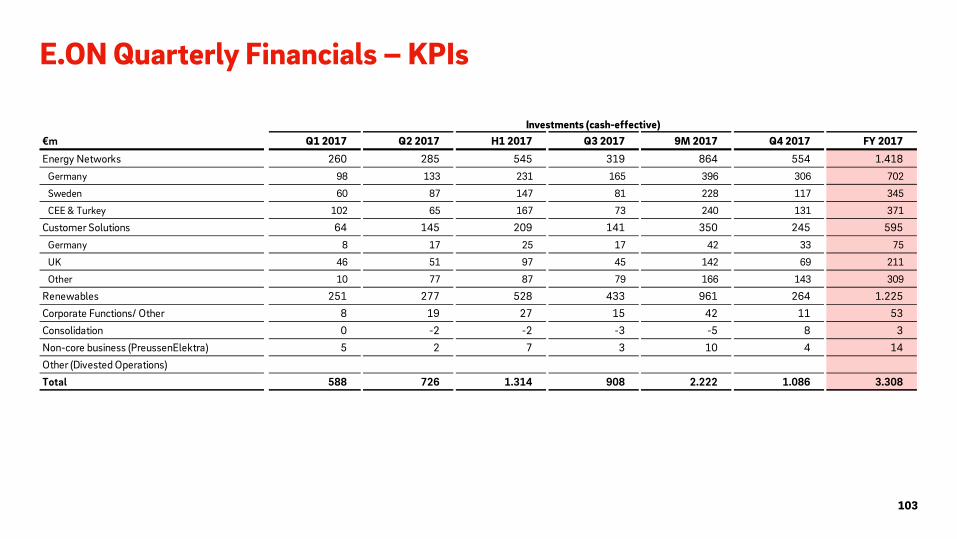
E.ON Quarterly Financials – KPIs
103
€m Q1 2017 Q2 2017 H1 2017 Q3 2017 9M 2017 Q4 2017 FY 2017
Energy Networks 260 285 545 319 864 554 1.418 Germany 98 133 231 165 396 306 702
Sweden 60 87 147 81 228 117 345
CEE & Turkey 102 65 167 73 240 131 371
Customer Solutions 64 145 209 141 350 245 595 Germany 8 17 25 17 42 33 75
UK 46 51 97 45 142 69 211
Other 10 77 87 79 166 143 309
Renewables 251 277 528 433 961 264 1.225 Corporate Functions/ Other 8 19 27 15 42 11 53 Consolidation 0 -2 -2 -3 -5 8 3 Non-core business (PreussenElektra) 5 2 7 3 10 4 14 Other (Divested Operations)Total 588 726 1.314 908 2.222 1.086 3.308
Investments (cash-effective)

E.ON Quarterly Financials – KPIs
104 1. Q1/2016 on a pro forma basis
€m Q1 20161 Q2 2016 H1 2016 Q3 2016 9M 2016 Q4 2016 FY 2016
Energy Networks 40 38 78 23 101 28 129 Germany 10 22 32 22 54 12 66
Sweden 0 0 0 0 0 0 0
CEE & Turkey 30 16 46 1 47 16 63
Customer Solutions 4 1 5 3 8 2 10 Germany 2 -2 0 0 0 0 0
UK 0 0 0 0 0 0 0
Other 2 3 5 3 8 2 10
Renewables 11 0 11 0 11 4 15 Corporate Functions/ Other 19 15 34 14 48 17 65 Consolidation 0 0 0 2 2 -2 0 Non-core business (PreussenElektra) 21 20 41 9 50 13 63 Other (Divested Operations) 0 0 0 0 0 0 0 Total 95 74 169 51 220 62 282
At equity contribution to Adjusted EBITDA/EBIT
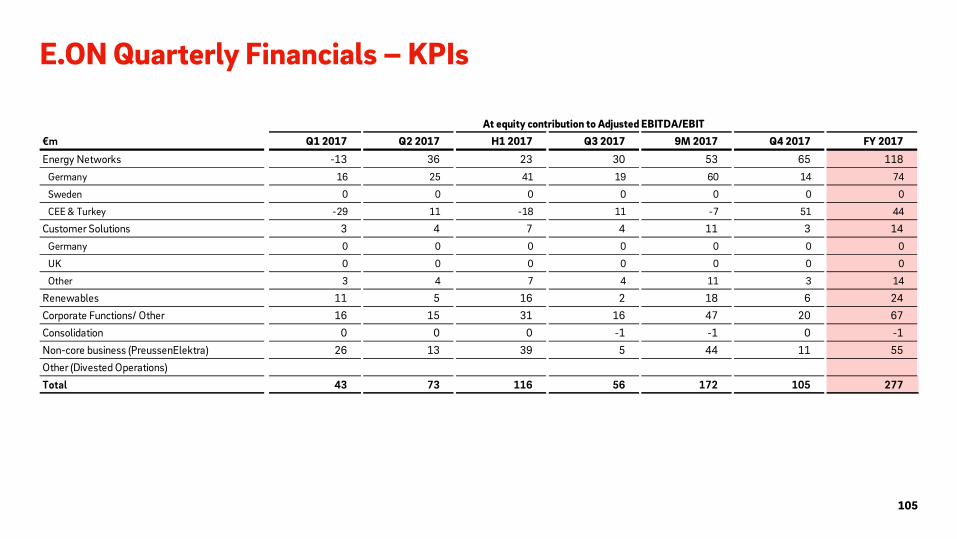
E.ON Quarterly Financials – KPIs
105
€m Q1 2017 Q2 2017 H1 2017 Q3 2017 9M 2017 Q4 2017 FY 2017
Energy Networks -13 36 23 30 53 65 118 Germany 16 25 41 19 60 14 74
Sweden 0 0 0 0 0 0 0
CEE & Turkey -29 11 -18 11 -7 51 44
Customer Solutions 3 4 7 4 11 3 14 Germany 0 0 0 0 0 0 0
UK 0 0 0 0 0 0 0
Other 3 4 7 4 11 3 14
Renewables 11 5 16 2 18 6 24 Corporate Functions/ Other 16 15 31 16 47 20 67 Consolidation 0 0 0 -1 -1 0 -1 Non-core business (PreussenElektra) 26 13 39 5 44 11 55 Other (Divested Operations)Total 43 73 116 56 172 105 277
At equity contribution to Adjusted EBITDA/EBIT

Disclaimer
This presentation contains information relating to E.ON Group ("E.ON") that must not be relied upon for any purpose and may not be redistributed, reproduced, published, or passed on to any other person or used in whole or in part for any other purpose. By accessing this document you agree to abide by the limitations set out in this document as well as any limitations set out on the webpage of E.ON SE on which this presentation has been made available. This document is being presented solely for informational purposes. It should not be treated as giving investment advice, nor is it intended to provide the basis for any evaluation or any securities and should not be considered as a recommendation that any person should purchase, hold or dispose of any shares or other securities. The information contained in this presentation may comprise financial and similar information which is neither audited nor reviewed and should be considered preliminary and subject to change. Some of the information presented herein is based on statements by third parties. No representation or warranty, express or implied, is made as to, and no reliance should be placed on, the fairness, accuracy, completeness or correctness of this information or any other information or opinions contained herein, for any purpose whatsoever. This presentation may contain forward-looking statements based on current assumptions and forecasts made by E.ON management and other information currently available to E.ON. Various known and unknown risks, uncertainties and other factors could lead to material differences between the actual future results, financial situation, development or performance of the company and the estimates given here. E.ON does not intend, and does not assume any liability whatsoever, to update these forward-looking statements or to conform them to future events or developments. Neither E.ON nor any respective agents of E.ON undertake any obligation to provide the recipient with access to any additional information or to update this presentation or any information or to correct any inaccuracies in any such information. Certain numerical data, financial information and market data (including percentages) in this presentation have been rounded according to established commercial standards. As a result, the aggregate amounts (sum totals or interim totals or differences or if numbers are put in relation) in this presentation may not correspond in all cases to the amounts contained in the underlying (unrounded) figures appearing in the consolidated financial statements. Furthermore, in tables and charts, these rounded figures may not add up exactly to the totals contained in the respective tables and charts.