growth of wafer-scale mos2 monolayer by magnetron sputteringqihuagroup/data/xiong/papers... ·...
TRANSCRIPT

Nanoscale
PAPER
Cite this: DOI: 10.1039/c4nr06411a
Received 31st October 2014,Accepted 13th December 2014
DOI: 10.1039/c4nr06411a
www.rsc.org/nanoscale
Growth of wafer-scale MoS2 monolayer bymagnetron sputtering†
Junguang Tao,*a,c Jianwei Chai,*a Xin Lu,b Lai Mun Wong,a Ten It Wong,a
Jisheng Pan,a Qihua Xiong,b,d Dongzhi Chia and Shijie Wang*a
The two-dimensional layer of molybdenum disulfide (MoS2) exhibits promising prospects in the appli-
cations of optoelectronics and valleytronics. Herein, we report a successful new process for synthesizing
wafer-scale MoS2 atomic layers on diverse substrates via magnetron sputtering. Spectroscopic and micro-
scopic results reveal that these synthesized MoS2 layers are highly homogeneous and crystallized; more-
over, uniform monolayers at wafer scale can be achieved. Raman and photoluminescence spectroscopy
indicate comparable optical qualities of these as-grown MoS2 with other methods. The transistors com-
posed of the MoS2 film exhibit p-type performance with an on/off current ratio of ∼103 and hole mobility
of up to ∼12.2 cm2 V−1 s−1. The strategy reported herein paves new ways towards the large scale growth
of various two-dimensional semiconductors with the feasibility of controllable doping to realize desired
p- or n-type devices.
Introduction
Recently, atomically thin two-dimensional (2D) transitionmetal dichalcogenides (TMDs), MX2 (M = Mo, W; X = S, Se,Te), were demonstrated to offer rich collection of physical pro-perties and functionalities in the area of nanoelectronics,1–3
optoelectronics,4 catalysis,5 photo-detection,6 photovoltaics7
and photocatalysis.8 The lattice of bulk TMDs is formed by co-valently bonded X-M-X 2D hexagonal trilayers, which weaklybonds with neighboring layers via van der Waals forces.9,10 Ineach layer, the electrons and holes are vertically confined,giving rise to numerous exotic physics phenomena, particu-larly at the monolayer limit. When exfoliated down to a mono-layer, the band gap of TMDs crosses over from indirect todirect due to quantum confinement, which entails ratherefficient light absorption and emission. As a prototype ofTMDs, molybdenum disulfide (MoS2) has been demonstratedto exhibit high current on/off ratio (1 × 10⁸),11,12 high mobility
(∼200 cm2 V−1 s−1) and negligible off current. This indicatesthat the sensitivity can be significantly improved with MoS2-based field effect transistors (FETs).3,4,13 In addition to itsgood electronic properties, the inherent band gap (1.8 eV formonolayer and 1.2 eV for bulk),4,14,15 excellent mechanical andoptical properties permit its applications in large-area flexibleoptoelectronics.3 To facilitate the integration of this fascinat-ing material into macroscopic electronic applications, it isessential to develop a large-area growth technique that is com-patible with current micro- or nano-fabrication processes.
Single and few-layered MoS2 were first obtained by a top-down mechanical exfoliation technique,11 which is commonlyused for graphene. Although this exfoliation method has thepotential to achieve high quality materials, it is unsuitable forlarge scale commercially viable devices. More recently, thin-ning of the TMD few-layers via laser,16 plasma,17 patterningmethod18 or thermal annealing19 was reported; however, thesemethods require thin layers and thus are not feasible for large-scale and massive production. Subsequently, bottom-upgrowth methods have been introduced to develop more scal-able techniques such as physical vapor deposition (PVD),20,21
chemical vapor deposition (CVD),22,23 sulfurization of molyb-denum oxides,24 hydrothermal synthesis,25 and electrochemi-cal lithiation processes.26 Several approaches based on CVDhave been reported by using Mo,27 MoO3,
23,24 MoCl5,22 or
(NH4)2MoS428 as an Mo precursor followed by the second-step
thermal sulfurization. More recently, a seeding promoter hasbeen used to improve the CVD growth quality.29 Although theCVD method has demonstrated its success in synthesis oflarge scale, high quality TMDs on various substrates, the
†Electronic supplementary information (ESI) available. See DOI: 10.1039/c4nr06411a
aInstitute of Materials Research and Engineering (IMRE), A*STAR (Agency for
Science, Technology and Research), 3, Research Link, Singapore 117602.
E-mail: [email protected], [email protected],
[email protected] of Physics and Applied Physics, School of Physical and Mathematical
Sciences, Nanyang Technological University, Singapore 637371cSchool of Materials Science and Engineering, Hebei University of Technology,
Tianjin 300130, ChinadNOVITAS, Nanoelectronics Centre of Excellence, School of Electrical and Electronic
Engineering, Nanyang Technological University, Singapore 639798
This journal is © The Royal Society of Chemistry 2015 Nanoscale
Publ
ishe
d on
16
Dec
embe
r 20
14. D
ownl
oade
d by
Nan
yang
Tec
hnol
ogic
al U
nive
rsity
on
23/0
1/20
15 0
6:50
:18.
View Article OnlineView Journal
control of thickness, purity and uniformity is still a challenge.For practical application, a scalable and controlled synthesistechnique is required. Therefore, alternative approaches,either complementary or advanced, are highly desired.
To date, the majority of the synthesized MoS2 films basedon the abovementioned methods are n-type doped.13,28,30 Veryrecently, it has been reported that p-type-doped MoS2 can berealized by efficient plasma treatment.31 Moreover, the for-mation of MoS2 p–n junction devices was exhibited by usingelectric double-layer gating.32,33 To meet the digital logic appli-cation demands, the research for an intrinsically p-type TMDmonolayer has become necessary. However, the large-scaledevice applications still rely on the breakthrough in the growthof large-sized, controlled-doping thin layers.
In this work, we report a one-step process that can growgood quality monolayers or few-layer MoS2 films at wafer scaleon various substrates using magnetron sputtering. Thedetailed growth procedure is given in the ESI.† As is wellknown, the magnetron sputtering technique is capable oflarge scale massive production, which is compatible withcurrent industrial processes with low cost and easy controll-ability. Previously, the magnetron sputtering method is infre-quently used for 2D material growth, particularly for theTMDs. The main obstacle is possibly the difficulty of control-ling the S or Se sources. In contrast to previous CVDmethods,22–24,27,28 Mo was sputtered to produce energizedmolecular-sized reactive Mo atoms or clusters that are morereactive than Mo or MoO3 films in the CVD method. Mo atomsreact with vaporized S atoms before being placed on hot sub-strates to form MoS2 layers. Our spectroscopic, microscopicand electrical measurements suggest that this syntheticprocess can lead to the growth of monolayers, bilayers, trilayersand thicker MoS2 sheets. These MoS2 films are highly homo-geneous, and their size is up to several centimeters, which iscurrently limited by the size of our sample stage. They exhibitoptical and electrical qualities comparable to that of the MoS2synthesized by other methods.
Experimental methodsCharacterization
The surface morphology of the samples was examinedwith a commercial atomic force microscope (AFM, BrukerICON-PKG). Raman spectra were obtained on a single-gatingmicro-Raman spectrometer (Horiba-JY T64000) excited with532 nm laser. The signal was collected through a 100× objec-tive lens, dispersed with a grating of 1800 g mm−1, anddetected by a liquid nitrogen-cooled charge-coupled device.Photoluminescence (PL) was obtained from the same micro-Raman spectrometer. Note that the Si peak at 520 cm−1 wasused for calibration in the experiments.
The samples were in situ transferred to an X-ray photo-electron spectroscopy (XPS) chamber for analysis. XPSmeasurements were performed in a VG ESCALAB 220i-XLsystem using a monochromatic Al Kα source. The pass energy
of the analyzer was set to 10 eV for high measurementresolution.
Transmission electron microscopy (TEM) (JEOL 2100) wasused to obtain information of the microstructures. For sampletransfer, poly(methyl methacrylate) (PMMA, from MicroChem)was spin-coated on the top of the sample. After baking at180 °C for 2 min, the PMMA-coated sample was immersedinto a 60 °C 2 M NaOH solution to etch the SiO2 until thePMMA with MoS2 film floated on the surface. Subsequently, alacey carbon TEM grid was used to identify PMMA and theMoS2 film. Finally, the PMMA film was removed by acetoneand the MoS2 layers were cleaned by DI water.
Field-effect transistors fabrication and measurements
To fabricate back-gated MoS2 FETs, the metallic drain/sourcecontacts (5 nm Cr/100 nm Au) were fabricated by photolitho-graphy, followed by metal deposition and lift-off. Finally,another Au coating layer was made onto the backside of the Sisubstrate, which served as a back gate contact. The devicecharacteristic curves were measured using a Keithley 4200semiconductor parameter analyzer.
Results and discussion
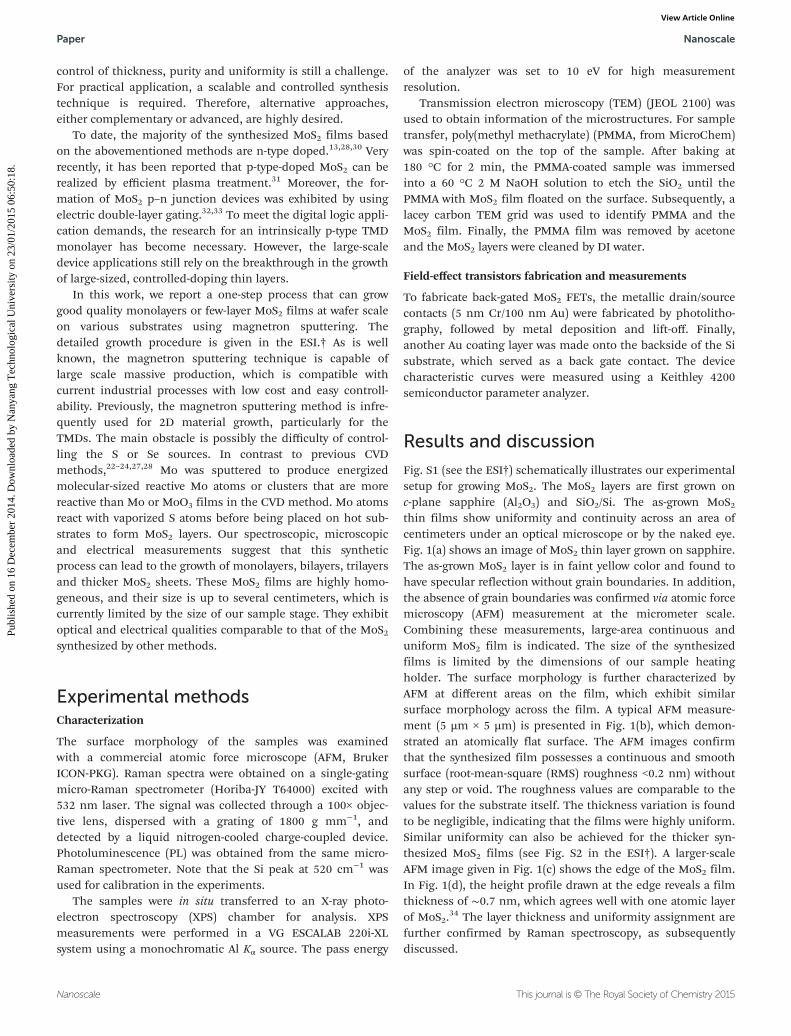
Fig. S1 (see the ESI†) schematically illustrates our experimentalsetup for growing MoS2. The MoS2 layers are first grown onc-plane sapphire (Al2O3) and SiO2/Si. The as-grown MoS2thin films show uniformity and continuity across an area ofcentimeters under an optical microscope or by the naked eye.Fig. 1(a) shows an image of MoS2 thin layer grown on sapphire.The as-grown MoS2 layer is in faint yellow color and found tohave specular reflection without grain boundaries. In addition,the absence of grain boundaries was confirmed via atomic forcemicroscopy (AFM) measurement at the micrometer scale.Combining these measurements, large-area continuous anduniform MoS2 film is indicated. The size of the synthesizedfilms is limited by the dimensions of our sample heatingholder. The surface morphology is further characterized byAFM at different areas on the film, which exhibit similarsurface morphology across the film. A typical AFM measure-ment (5 µm × 5 µm) is presented in Fig. 1(b), which demon-strated an atomically flat surface. The AFM images confirmthat the synthesized film possesses a continuous and smoothsurface (root-mean-square (RMS) roughness <0.2 nm) withoutany step or void. The roughness values are comparable to thevalues for the substrate itself. The thickness variation is foundto be negligible, indicating that the films were highly uniform.Similar uniformity can also be achieved for the thicker syn-thesized MoS2 films (see Fig. S2 in the ESI†). A larger-scaleAFM image given in Fig. 1(c) shows the edge of the MoS2 film.In Fig. 1(d), the height profile drawn at the edge reveals a filmthickness of ∼0.7 nm, which agrees well with one atomic layerof MoS2.
34 The layer thickness and uniformity assignment arefurther confirmed by Raman spectroscopy, as subsequentlydiscussed.
Paper Nanoscale
Nanoscale This journal is © The Royal Society of Chemistry 2015
Publ
ishe
d on
16
Dec
embe
r 20
14. D
ownl
oade
d by
Nan
yang
Tec
hnol
ogic
al U
nive
rsity
on
23/0
1/20
15 0
6:50
:18.
View Article Online

We controlled the layer thickness via growth parameters,including deposition time, substrate temperature, and growthpower. To demonstrate the control on thickness of atomicallythin MoS2 layers, Fig. 2 shows the Raman spectra collectedfrom the as-grown MoS2 thin films on sapphire for variablethickness. The Raman spectra for the MoS2 films grown onSiO2 are given in Fig. S3 of the ESI.† By comparing the Ramanspectra in Fig. 2 and S3,† we found that the MoS2 film on sap-phire exhibits narrower and stronger Raman peaks than thaton SiO2, which suggests better crystalline quality of MoS2 filmon sapphire than that on SiO2/Si. The better crystalline qualityof MoS2 film grown on sapphire is due to the fact that sapphireis atomically flat with a step height of 0.22 nm, which issufficiently low to ensure the growth of continuous MoS2 film.In addition, dipole–dipole interactions exist between S and Alatoms on sapphire, which align the MoS2 layers in a bettermanner.35 In Fig. S4 of the ESI,† the Raman spectra were col-lected with lower (0.74 mW) and higher (11 mW) laser intensi-ties. It is shown that the Raman spectrum under 11 mW laserintensity exhibits a strong signal without burning the sample.Moreover, the peak positions and their separation do notdepend on the excitation laser intensity, which confirms thatthere is no laser heating effect. Therefore, 11 mW is used forthe following measurements. As shown in Fig. 2a, the MoS2films exhibit two Raman characteristic bands at ∼406 cm−1
and ∼386 cm−1, corresponding to out-of-plane (A1g) and in-plane (E1
2g) vibration modes, respectively. The full width athalf maximum (FWHM) of the A1g peak of the synthesizedMoS2 monolayer is 4.4 cm−1, close to that of the exfoliatedmonolayer, 3.7 cm−1, which suggests a good crystalline qualityfor our synthesized film. As expected, these two bands shiftwith MoS2 layer thickness. In addition, the frequency differen-tial (Δk) between A1g and E12g modes has been used to identifythe layer number of MoS2. In general, the E12g vibration sof-tened, whereas the A1g vibration stiffened at higher layernumbers. This is demonstrated in Fig. 2(a), in which the A1g isblue-shifted and E12g is red-shifted with an increase in filmthickness. Δk of the synthesized thin film increases from 19.3to 24.3 cm−1 from monolayer to bulk, respectively. The assign-ment of Δk = 19.3 cm−1 to monolayer is in agreement with pre-vious reports.22,27,36 The thicknesses of the bilayer (2L) andtrilayer (3L) are confirmed by transmission electron micro-scopic (TEM) measurement. Note that the optimized processreported herein reproduces homogeneous MoS2 bilayers or tri-layers fairly easily. However, the monolayer MoS2 is moredifficult to achieve, which is attributed to the growth kineticsof this process.
The uniformity of the layers is quantitatively assessed byconducting numerous Raman spectra at random spots over atypical ∼1 cm × 1 cm sapphire substrate. Fig. 2(b) shows
Fig. 1 Large-area uniform MoS2 films on sapphire substrate. (a) Images of a MoS2 film on sapphire substrate. (b) AFM image of the as-grown MoS2film. (c) A larger scanning area AFM image of the as-grown film with a clear film edge. (d) Height profile from the section as indicated by the blueline in panel (c). The monolayer MoS2 is ∼0.7 nm thick.
Nanoscale Paper
This journal is © The Royal Society of Chemistry 2015 Nanoscale
Publ
ishe
d on
16
Dec
embe
r 20
14. D
ownl
oade
d by
Nan
yang
Tec
hnol
ogic
al U
nive
rsity
on
23/0
1/20
15 0
6:50
:18.
View Article Online

Raman spectra for each measured spot for a monolayer MoS2.It is known that the peak width of the Raman peak is also sen-sitive to the crystalline quality, and therefore the FWHMs of allE12g and A1g modes are also analyzed. As shown in Fig. 2(b),the variation of Δk and FWHMs are reasonably small:±0.27 cm−1 for Δk and ±0.16 cm−1 for FWHMs. These resultsconfirm that the synthesis method described herein canprovide highly homogeneous films with similar crystallinequality across the entire substrate. In addition, shear or breath-ing Raman modes would appear at low frequency for multi-layers.36,37 The absence of these modes crossing over thesurface of our sample suggests the formation of uniformmonolayers on a large scale.
X-ray photoemission spectroscopy (XPS) was used toexamine the film-substrate interface chemistry, as well as theelectronic structure of the synthesized films. Fig. 3 shows thecore-level XPS spectra of Mo 3d, S 2p and the valence band(VB) for MoS2 films on sapphire. The peaks at 229.3 and 232.5 eVare attributed to the doublet Mo 3d5/2 and 3d3/2 orbitals,respectively, in agreement with reported binding energyvalues.26,28 From the perspective of thermodynamics, the Molayer would prefer to bind to an oxide surface to form an inter-facial Mo–O oxide on an oxidized substrate. However, our XPSanalysis shows no evidence of Mo–O peak at higher energyside, suggesting a negligible interfacial interaction, owingto kinetic reasons. As shown in Fig. 3(b), the spin–orbital
splitting for S 2p is well resolved into S 2p3/2 and 2p1/2 at 162.2and 163.3 eV, respectively. Especially, the S 2p spectrum of the2L film almost bears the same shape of that of the bulk, whichindicates good crystalline structure for the atomically thinfilm. In addition, as previously demonstrated, 1T-MoS2 and2H-MoS2 phases display distinguished binding energies forMo 3d.26 Our XPS results support the formation of pure phaseof 2H-MoS2 crystal structure. The valence band of MoS2 isbuilt up by the hybridization of Mo 4d and S 3p, which exhi-bits four major features within 0–10 eV.38 As shown in Fig. 3(c),the electronic states of Mo 4dz2 band is readily developed at∼2 eV38 for monolayer MoS2. The higher binding energy Mo4d–S 3p orbitals are overlapped with the substrate O 2p peaksand are gradually pronounced with increasing layer thickness.These observations indicate well-developed band formationfrom hybridized Mo 4d–S 3p orbitals, which indicate long-range in-plane ordering of the MoS2 structure. Along with thedevelopment of the valence band structure, the separationbetween the Mo 3d5/2 and Mo 4dz2 peaks increases withincrease in layer thicknesses (see Fig. S5 of the ESI†). Itchanges from 227.25 eV for the monolayer to 227.55 eV for thethicker films. This observation confirms the development ofthe electronic structure of MoS2 film with the previouslydemonstrated thickness.39 In addition, the smaller separationfor the monolayer indicates a better screening effect of thevalence electrons to the core level. Our synthesized thick filmshows almost identical XPS spectra to that of the commercialbulk sample, as shown in Fig. S6 of the ESI,† indicating thatgood quality synthesized film can be obtained using our novellarge area, one-step sputtering process.
To further elucidate the crystalline structure, the as-grownMoS2 film was transferred onto a lacey carbon grid for TEMcharacterization. A typical high resolution TEM image as wellas the selected area electron diffraction (SAED) pattern aregiven in Fig. 4(a), which reveals the ordered crystalline withhexagonal lattice structure, and the lattice spacing of 0.27 nm
Fig. 2 Raman spectra of the as-grown MoS2 on sapphire. (a) Develop-ment of the Raman spectra for monolayer (1L), bilayer (2L), trilayer (3L)and thick (bulk) MoS2 samples. The two characteristic Raman modes arelabeled. The small peak at ∼418 cm−1 is caused by a sapphire substrate.The dashed vertical lines indicate the peak positions for the monolayersample. (b) Raman spectra collected from eight random spots of theMoS2 monolayer film. All of the measured frequency separation (Δk) is19.3 cm−1.
Fig. 3 Normalized XPS spectra of as-grown MoS2 on sapphire. (a) Mo3d, (b) S 2p spectra and (c) valence band (VB) as a function of the filmthickness: monolayer (1L, black curves), bilayer (2L, red curves), trilayer(3L, blue curves) and thick (bulk, pink curves) MoS2 samples.
Paper Nanoscale
Nanoscale This journal is © The Royal Society of Chemistry 2015
Publ
ishe
d on
16
Dec
embe
r 20
14. D
ownl
oade
d by
Nan
yang
Tec
hnol
ogic
al U
nive
rsity
on
23/0
1/20
15 0
6:50
:18.
View Article Online

for (100) planes is observed. The hexagonal atomic arrange-ment shown in the TEM image and the SAED pattern indicatethat the basal plane of the synthesized thin film is (001), i.e.the c-axis of the MoS2 films is perpendicular to the substrate.Fig. 4(b) is the magnified TEM image of a specific area, whichis indicated by a square, in Fig. 4(a). The periodic atomarrangement for Mo is shown, confirming that the MoS2 filmhas a crystalline structure. The MoS2 film on TEM grids exhibitsome wrinkles at the edge of the film, which is caused by un-avoidable film folding of the free-hanging MoS2 sheets at theedge during the TEM sample preparation. This, however,permits the assessment of layer numbers under top-view TEM.For instance, bilayer (2L) and trilayer (3L) edges are displayedin Fig. 4(c). This local layer thickness characterization is inagreement with the Raman spectra.
In addition, photoluminescence (PL) measurement at roomtemperature is shown in Fig. 4(d), exhibiting the layer-depen-dent optical properties. The PL spectrum for the monolayerMoS2 exhibits the strongest emission at 1.83 eV, as well as ashoulder at 2.00 eV, which can be correlated to the A and Bexciton transition arising from direct gap transitions at the Kpoint. These excitonic energies, as well as the splitting of∼170 meV, agree well with previous reports,4,14,26 which resultfrom the strong spin–orbit coupling due to the breaking of
inversion symmetry.40,41 The PL response confirms the directband transition in the 2H-MoS2 monolayer. Our resultssuggest a comparable optical quality as that of other syn-thesized MoS2 films.28,42 The strong PL intensity for monolayerMoS2 drops dramatically for bilayer film and falls to zero whenthe layer number is larger than three. This suggests that theband structure of our MoS2 film bears a similar dependencewith that of exfoliated films, thus further confirming the layernumber assignment for our sputter-grown MoS2 films. Wenote that, similar to some previous reports,43,44 the exciton Bpeak is less resolved as compared to the mechanically ex-foliated monolayer. This could be due to the presence of latticedisorder or residual dopants that decouple the spin–orbitalinteraction.
Thin layer MoS2 are well suited as a channel material infield effect transistor (FET) applications, exhibiting high mobi-lity, almost ideal switching characteristics and low standbypower dissipation. To evaluate the electrical performance ofthe as-grown MoS2 sheets, we fabricated bottom-gate FETs onMoS2 films by evaporating Cr/Au electrodes as source anddrain electrodes on top of the MoS2 thin film, 200 nm thickSiO2 as a dielectric and Au-coated Si as a back gate. We per-formed electrical measurements at room temperature in anambient environment. Fig. 5(a) shows the typical transport
Fig. 4 Crystal structure characterization of the MoS2 film using TEM. (a) High resolution TEM image of the MoS2 film transferred onto a laceycarbon grid. The inset shows the diffraction pattern of the electron-transmitting area, showing the hexagonal symmetry of the MoS2 structure.(b) Zoom-in image of the area highlighted in (a). The hexagonal structure formed by Mo atoms is indicated. (c) TEM image at the folded area at theedge from bilayer (2L) and trilayer (3L) samples. All scale bars in (a)–(c) are 2 nm. (d) Thickness-dependent photoluminescence spectra of MoS2 filmson SiO2. Layer numbers are indicated on the curves. The inset of (d) is a zoom-in image to highlight the existence of the B exciton transition.
Nanoscale Paper
This journal is © The Royal Society of Chemistry 2015 Nanoscale
Publ
ishe
d on
16
Dec
embe
r 20
14. D
ownl
oade
d by
Nan
yang
Tec
hnol
ogic
al U
nive
rsity
on
23/0
1/20
15 0
6:50
:18.
View Article Online

characteristic of a representative device having a channellength of 100 µm and a width of 10 µm as shown in the inset.In contrast to previous results,13,28,30 a p-type field effect be-havior is exhibited with an on/off current ratio of ∼103 at ∼−20 Vgate voltage (Vg) and a bias voltage (Vds) at 4 V. The lineardependence of drain current (Ids)–Vds characteristic curves, seeFig. 5(b), suggests ohmic contact between the film and theelectrodes, indicating that the observed field effect behavior iscaused by the MoS2 channel rather than Schottky barriers atthe contact. Consistent with the transfer curves, Ids increasesat a negative gate voltage, indicating that the hole is themajority carrier. From the measurements, the value of holefield-effect mobility (µ) of this MoS2 FET is estimated to be
∼12.2 cm2 V−1 s−1 based on the slope ofΔIdsΔVg
, fitted to the
linear regime of the transfer curves using the expression
μ ¼ LCoxVd
W
� �ΔIdsΔVg
� �; ð1Þ
where L and W is the length and width of the channel, respect-ively, Cox is the capacitance between the channel and the back-gate per unit area (∼1.7 × 10⁻⁴ F m−2 for 200 nm SiO2). Wehave performed numerous measurements over several channelsand found the mobility ranging from ∼2 to ∼12 cm2 V−1 s−1,which is centered at ∼7 cm2 V−1 s−1. This result is reason-ably comparable to those of back-gated FETs made withmechanically exfoliated monolayers measured in similar con-ditions (0.1–10 cm2 V−1 s−1).13,23,24,27,28 The mobility of theMoS2 FETs could be significantly improved by using local top-gate high-κ dielectrics, such as HfO2, as gate materials. We canthus conclude that the synthesized thin film has a reasonablycomparable electrical quality with that of exfoliated MoS2. Wespeculate that by controlling annealing time, annealingenvironment or the substrate material, the film quality can befurther improved, leading to higher carrier mobility.
The p-type doping could be caused by cationic/anionicvacancies/interstitials that are introduced during the depo-sition process. Tentatively, this is assigned to the S interstitialsbased on slightly larger S concentration from our XPS measure-ment (atomic ratio of Mo : S ∼ 1 : 2.06). In addition, recenttheoretical calculations predict that the absorption of H2, O2,and H2O on the surface of MoS2 can also result in p-typedoping.45 This could mostly occur at the surface defect sites.
The major difference between our one-step sputteringgrowth method and other growth methods, such as CVD, isthe kinetic energy of landing MoS2 molecules. The typicalkinetic energies of landing molecules are on the order of tensof eV, even after multiple scattering events within the back-ground gas, the residual energy of which requires in-planemovement. With this energy, the requirement for the nuclea-tion center as required for CVD growth34 is no longer a keyissue. Our experimental observations suggest that the Arpressure and sputtering power play key roles in this growthmechanism. With this difference, different crystal structureimperfections may be introduced as compared to previousmethods. This, however, brings new functionalities and opensnew possibilities to explore the material properties. In case ofCVD growth, S vacancies are normally formed, which lead ton-type doping. While using sputtering method, additional ener-gized S can be incorporated into the lattice to serve as p-typedopants, which is the case as we demonstrated herein. Notethat the S interstitials are not observed for the CVD film,suggesting that the excess S vapor itself is not enough forp-type doping, as opposed to the sufficient kinetic energy. UnderMo deficiency conditions, either Mo vacancies or S interstitialswill create acceptor levels inside the band gap of MoS2, whichlead to p-type doping. Although the detailed growth dynamicstudies require further investigation, which are not covered bythe current work, we note that the doping type can be modu-lated via sputtering power and that the p-type doping is relatedto the Mo deficiency conditions. Moreover, we like to empha-size that the controlled doping study can be easily realized viathe use of some alloy targets adopting this strategy.
Conclusion
In conclusion, we demonstrated a proof-of-concept, one-step,large-area synthesis of uniform MoS2 films with readily con-trolled layer numbers using a magnetron sputtering method.This method can be used to produce large-area, good qualityMoS2 monolayers and few-layer films with great uniformityand controllability. The electric measurement for the bottom-gate transistor shows p-type semiconductor behavior. Theon/off current ratio is ∼1 × 10³, and the hole mobility is up to∼12.2 cm2 V−1 s−1. This synthesis approach can be readilyscaled up to produce wafer-scale 2D MoS2 for the developmentof practical electronic and photonic devices. This synthesismethod could be extended to the growth of other TMDs aswell as controlled doping for these systems, opening up newavenues for 2D material studies.
Fig. 5 Electrical properties of the MoS2 films on SiO2/Si. (a) Transfercurves: Ids–Vg curves plotted in semilog (black curve) and linear (pinkcurve) scales at Vds = 4 V. Inset: optical image of the back-gated FETdevice. (b) Output characteristics: Ids–Vds curves of the device forvarious positive and negative gate voltages. Inset: optical image of thedevice array.
Paper Nanoscale
Nanoscale This journal is © The Royal Society of Chemistry 2015
Publ
ishe
d on
16
Dec
embe
r 20
14. D
ownl
oade
d by
Nan
yang
Tec
hnol
ogic
al U
nive
rsity
on
23/0
1/20
15 0
6:50
:18.
View Article Online

References
1 K. S. Novoselov, D. Jiang, F. Schedin, T. J. Booth,V. V. Khotkevich, S. V. Morozov and A. K. Geim, Proc. Natl.Acad. Sci. U. S. A., 2005, 102, 10451–10453.
2 C. Lee, Q. Li, W. Kalb, X.-Z. Liu, H. Berger, R. W. Carpickand J. Hone, Science, 2010, 328, 76–80.
3 Q. H. Wang, K. Kalantar-Zadeh, A. Kis, J. N. Coleman andM. S. Strano, Nat. Nanotechnol., 2012, 7, 699–712.
4 K. F. Mak, C. Lee, J. Hone, J. Shan and T. F. Heinz, Phys.Rev. Lett., 2010, 105, 136805.
5 K. H. Hu, X. G. Hu and X. J. Sun, Appl. Surf. Sci., 2010, 256,2517–2523.
6 Z. Yin, H. Li, H. Li, L. Jiang, Y. Shi, Y. Sun, G. Lu, Q. Zhang,X. Chen and H. Zhang, ACS Nano, 2012, 6, 74–80.
7 E. Gourmelon, O. Lignier, H. Hadouda, G. Couturier,J. C. Bernède, J. Tedd, J. Pouzet and J. Salardenne, Sol.Energy Mater. Sol. Cells, 1997, 46, 115–121.
8 W. Ho, J. C. Yu, J. Lin, J. Yu and P. Li, Langmuir, 2004, 20,5865–5869.
9 R. A. Bromley, R. B. Murray and A. D. Yoffe, J. Phys. C: SolidState Phys., 1972, 5, 759.
10 L. F. Mattheiss, Phys. Rev. B: Solid State, 1973, 8, 3719–3740.
11 B. Radisavljevic, A. Radenovic, J. Brivio, V. Giacometti andA. Kis, Nat. Nanotechnol., 2011, 6, 147–150.
12 L. Ming-Wei, L. Lezhang, L. Qing, T. Xuebin,S. D. Kulwinder, Z. Peng, M. N. Vaman, C. Mark Ming-Cheng and Z. Zhixian, J. Phys. D: Appl. Phys., 2012, 45,345102.
13 B. Radisavljevic, A. Radenovic, J. Brivio, V. Giacometti andA. Kis, Nat. Nanotechnol., 2011, 6, 147–150.
14 A. Splendiani, L. Sun, Y. Zhang, T. Li, J. Kim, C.-Y. Chim,G. Galli and F. Wang, Nano Lett., 2010, 10, 1271–1275.
15 S. Lebègue and O. Eriksson, Phys. Rev. B: Condens. Matter,2009, 79, 115409.
16 A. Castellanos-Gomez, M. Barkelid, A. M. Goossens,V. E. Calado, H. S. J. van der Zant and G. A. Steele, NanoLett., 2012, 12, 3187–3192.
17 Y. Liu, H. Nan, X. Wu, W. Pan, W. Wang, J. Bai, W. Zhao,L. Sun, X. Wang and Z. Ni, ACS Nano, 2013, 7, 4202–4209.
18 M. I. B. Utama, X. Lu, D. Zhan, S. T. Ha, Y. Yuan, Z. Shenand Q. Xiong, Nanoscale, 2014, 6, 12376–12382.
19 X. Lu, M. I. B. Utama, J. Zhang, Y. Zhao and Q. Xiong,Nanoscale, 2013, 5, 8904–8908.
20 S. Helveg, J. V. Lauritsen, E. Lægsgaard, I. Stensgaard,J. K. Nørskov, B. S. Clausen, H. Topsøe and F. Besenbacher,Phys. Rev. Lett., 2000, 84, 951–954.
21 J. V. Lauritsen, J. Kibsgaard, S. Helveg, H. Topsoe,B. S. Clausen, E. Laegsgaard and F. Besenbacher, Nat.Nanotechnol., 2007, 2, 53–58.
22 Y. Yu, C. Li, Y. Liu, L. Su, Y. Zhang and L. Cao, Sci. Rep.,2013, 3, 1866.
23 Y.-H. Lee, X.-Q. Zhang, W. Zhang, M.-T. Chang, C.-T. Lin,K.-D. Chang, Y.-C. Yu, J. T.-W. Wang, C.-S. Chang, L.-J. Liand T.-W. Lin, Adv. Mater., 2012, 24, 2320–2325.
24 Y.-C. Lin, W. Zhang, J.-K. Huang, K.-K. Liu, Y.-H. Lee,C.-T. Liang, C.-W. Chu and L.-J. Li, Nanoscale, 2012, 4,6637–6641.
25 Y. Peng, Z. Meng, C. Zhong, J. Lu, W. Yu, Y. Jia and Y. Qian,Chem. Lett., 2001, 30, 772–773.
26 G. Eda, H. Yamaguchi, D. Voiry, T. Fujita, M. Chen andM. Chhowalla, Nano Lett., 2011, 11, 5111–5116.
27 Y. Zhan, Z. Liu, S. Najmaei, P. M. Ajayan and J. Lou, Small,2012, 8, 966–971.
28 K.-K. Liu, W. Zhang, Y.-H. Lee, Y.-C. Lin, M.-T. Chang,C. Su, C.-S. Chang, H. Li, Y. Shi, H. Zhang, C.-S. Lai andL.-J. Li, Nano Lett., 2012, 12, 1538–1544.
29 X. Ling, Y.-H. Lee, Y. Lin, W. Fang, L. Yu, M. S. Dresselhausand J. Kong, Nano Lett., 2014, 14, 464–472.
30 H. Li, Z. Yin, Q. He, H. Li, X. Huang, G. Lu, D. Fam, A. Tok,Q. Zhang and H. Zhang, Small, 2012, 8, 63–67.
31 H. Nam, S. Wi, H. Rokni, M. Chen, G. Priessnitz, W. Luand X. Liang, ACS Nano, 2013, 7, 5870–5881.
32 Y. J. Zhang, J. T. Ye, Y. Yomogida, T. Takenobu andY. Iwasa, Nano Lett., 2013, 13, 3023–3028.
33 Y. Zhang, J. Ye, Y. Matsuhashi and Y. Iwasa, Nano Lett.,2012, 12, 1136–1140.
34 S. Najmaei, Z. Liu, W. Zhou, X. Zou, G. Shi, S. Lei,B. I. Yakobson, J.-C. Idrobo, P. M. Ajayan and J. Lou, Nat.Mater., 2013, 12, 754–759.
35 D. Dumcenco, D. Ovchinnikov, K. Marinov, O. Lopez-Sanchez,D. Krasnozhon, M.-W. Chen, P. Gillet, A. F. i. Morral,A. Radenovic and A. Kis, 2014, arXiv:1405.0129v1.
36 Y. Zhao, X. Luo, H. Li, J. Zhang, P. T. Araujo, C. K. Gan,J. Wu, H. Zhang, S. Y. Quek, M. S. Dresselhaus andQ. Xiong, Nano Lett., 2013, 13, 1007–1015.
37 X. Zhang, W. P. Han, J. B. Wu, S. Milana, Y. Lu, Q. Q. Li,A. C. Ferrari and P. H. Tan, Phys. Rev. B: Condens. Matter,2013, 87, 115413.
38 K. S. Liang, G. J. Hughes and R. R. Chianelli, J. Vac. Sci.Technol., A, 1984, 2, 991–994.
39 W. Jin, P.-C. Yeh, N. Zaki, D. Zhang, J. T. Sadowski,A. Al-Mahboob, A. M. van der Zande, D. A. Chenet,J. I. Dadap, I. P. Herman, P. Sutter, J. Hone andR. M. Osgood, Phys. Rev. Lett., 2013, 111, 106801.
40 R. Suzuki, M. Sakano, Y. J. Zhang, R. Akashi, D. Morikawa,A. Harasawa, K. Yaji, K. Kuroda, K. Miyamoto, T. Okuda,K. Ishizaka, R. Arita and Y. Iwasa, Nat. Nanotechnol., 2014,9, 611–617.
41 N. Alidoust, G. Bian, S.-Y. Xu, R. Sankar, M. Neupane,C. Liu, I. Belopolski, D.-X. Qu, J. D. Denlinger, F.-C. Chouand M. Z. Hasan, Nat. Commun., 2014, 5.
42 Y. Lee, J. Lee, H. Bark, I.-K. Oh, G. H. Ryu, Z. Lee, H. Kim,J. H. Cho, J.-H. Ahn and C. Lee, Nanoscale, 2014, 6, 2821–2826.
43 A. P. S. Gaur, S. Sahoo, M. Ahmadi, S. P. Dash, M. J. F. Guineland R. S. Katiyar, Nano Lett., 2014, 14, 4314–4321.
44 K. Mak, C. Lee, J. Hone, J. Shan and T. Heinz, Phys. Rev.Lett., 2010, 105, 136805.
45 Q. Yue, Z. Shao, S. Chang and J. Li, Nanoscale Res. Lett.,2013, 8, 425.
Nanoscale Paper
This journal is © The Royal Society of Chemistry 2015 Nanoscale
Publ
ishe
d on
16
Dec
embe
r 20
14. D
ownl
oade
d by
Nan
yang
Tec
hnol
ogic
al U
nive
rsity
on
23/0
1/20
15 0
6:50
:18.
View Article Online