growth remains strong for market expansion
TRANSCRIPT

Study highlights
Zurich, January 2017
Growth remains strong for market expansion services in Asia

2
> Until 2021, market expansion services are expected to grow by 6.5%
annually across all industries analyzed
> The overall MES penetration growth rate remains stable at 0.9% p.a.
> Asian markets are still exhibiting robust growth, mainly due to the growing
wealth of the middle-class with higher disposable income as well as initiatives of
governments and policy-makers towards improved infrastructures, free trade,
and increased employment rates
> The demand for market expansion services is further increasing as
– companies are increasingly focusing on their core competencies
– supply chain efficiency becomes more important as competitive pressure
accelerates
– increasing regulations across many sectors and countries require in-depth
market knowledge and experience
> Among the pan-Asian cross-industry market expansion services providers,
DKSH continues to be the leading player2) - Other market participants, with
partial regional and cross-industry coverage, being LF Asia/DCH3) and
Jebsen & Jessen
Market expansion services for FMCG, healthcare, specialty chemicals, and engineered products expected to grow with 6.5% p.a. until 2021
Source/Notes: Detailed information can be obtained from the associated Roland Berger report 2017
Overall market development for market expansion services [USD bn]
CAGR1) ['16-'21]
+ 6.5%
1) Compound annual growth rate 2) Other pan-Asian market expansion service specialists focus on a single industry – e.g. Zuellig Pharma (pharmaceuticals), Brenntag and Connell Brothers (specialty chemicals) 3) LF Asia has been acquired by DCH
866
632
2021 2016
3
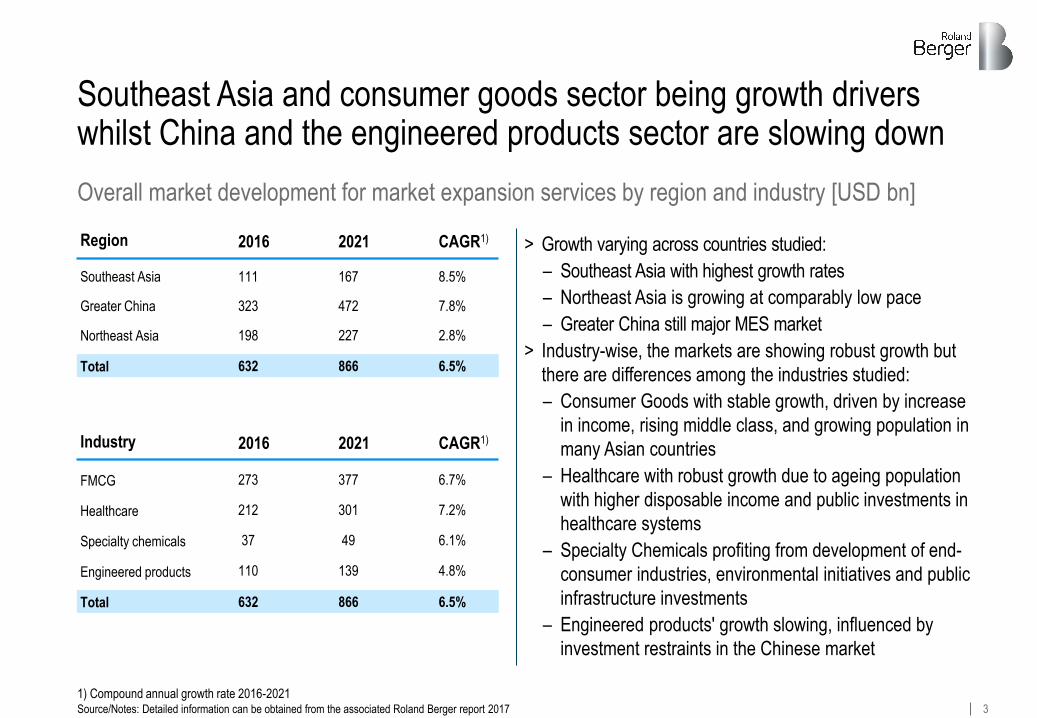
Southeast Asia and consumer goods sector being growth drivers whilst China and the engineered products sector are slowing down
Overall market development for market expansion services by region and industry [USD bn]
> Growth varying across countries studied:
– Southeast Asia with highest growth rates
– Northeast Asia is growing at comparably low pace
– Greater China still major MES market
> Industry-wise, the markets are showing robust growth but
there are differences among the industries studied:
– Consumer Goods with stable growth, driven by increase
in income, rising middle class, and growing population in
many Asian countries
– Healthcare with robust growth due to ageing population
with higher disposable income and public investments in
healthcare systems
– Specialty Chemicals profiting from development of end-
consumer industries, environmental initiatives and public
infrastructure investments
– Engineered products' growth slowing, influenced by
investment restraints in the Chinese market
Southeast Asia
Greater China
Northeast Asia
Total
Region
Industry
FMCG
Healthcare
Specialty chemicals
Engineered products
1) Compound annual growth rate 2016-2021
Total
2016
2016
111
323
198
632
273
212
37
110
632
2021
167
472
227
866
2021
377
301
49
139
866
CAGR1)
CAGR1)
8.5%
7.8%
2.8%
6.5%
6.7%
7.2%
6.1%
4.8%
6.5%
Source/Notes: Detailed information can be obtained from the associated Roland Berger report 2017

4
For FMCG, Asia-Pacific region growing at high levels – Main drivers are the growing middle class, increasing population, and incomes
Market development for market expansion services – FMCG [USD bn]
> Market expansion services for the FMCG industry are
expected to show a robust growth of 6.7% whereof 5.8%
stems from a change in consumption and 0.9% from a
change in MES penetration
> Overall growth in the FMCG market is driven by population
growth, rising share of middle class households, increasing
disposable income and the rise of new sales channels (e.g.
digitization)
> Additionally, increasing number of trade-agreements (e.g.
TPP2)) and lower trade barriers across analyzed countries
continue to stimulate consumption in the FMCG market
> Trends towards outsourcing expected to continue as
relevance of "frugal products" (products being tailor-made
for the specific needs of the middle-class of emerging
countries) for western firms is constantly growing – Specific
knowledge about local conditions and customer groups is
vital but widely lacking among western firms
2021 Change in MES
penetration
Change in
consumption
2016
377
273
+ 5.8% + 0.9% CAGR1) ['16-'21]
+ 6.7%
1) In some cases 'Change in consumption' and 'Change in MES penetration' do not add up to 'Compound annual growth rate' (CAGR) due to rounding errors 2) Trans-Pacific Partnership Source/Notes: Detailed information can be obtained from the associated Roland Berger report 2017
5
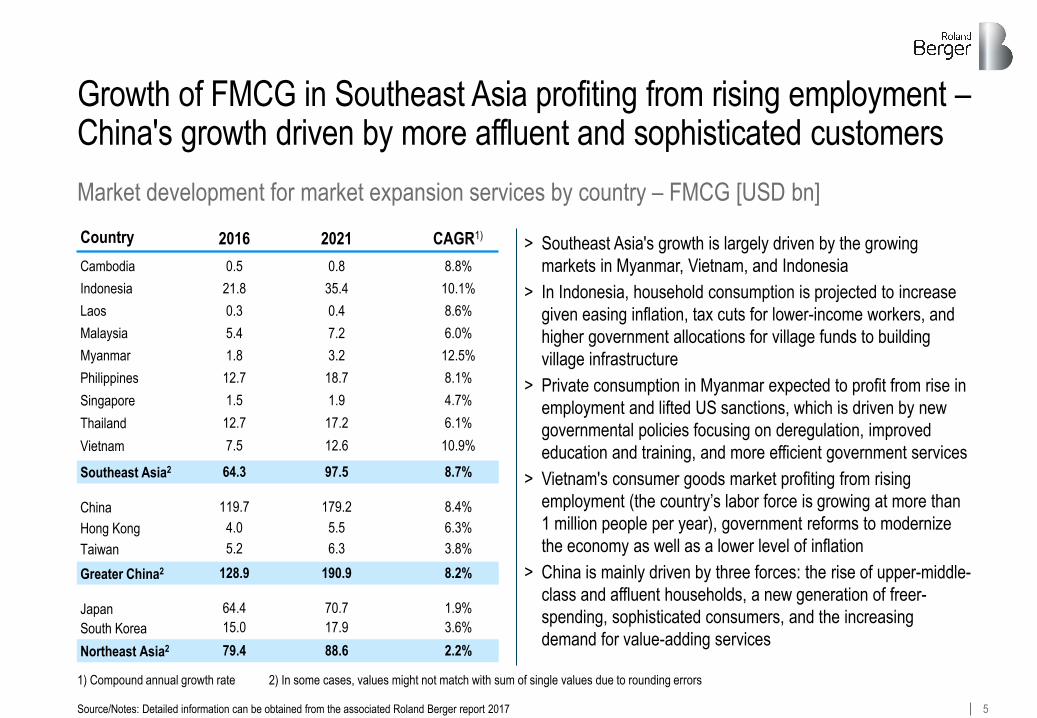
Growth of FMCG in Southeast Asia profiting from rising employment – China's growth driven by more affluent and sophisticated customers
Market development for market expansion services by country – FMCG [USD bn]
> Southeast Asia's growth is largely driven by the growing
markets in Myanmar, Vietnam, and Indonesia
> In Indonesia, household consumption is projected to increase
given easing inflation, tax cuts for lower-income workers, and
higher government allocations for village funds to building
village infrastructure
> Private consumption in Myanmar expected to profit from rise in
employment and lifted US sanctions, which is driven by new
governmental policies focusing on deregulation, improved
education and training, and more efficient government services
> Vietnam's consumer goods market profiting from rising
employment (the country’s labor force is growing at more than
1 million people per year), government reforms to modernize
the economy as well as a lower level of inflation
> China is mainly driven by three forces: the rise of upper-middle-
class and affluent households, a new generation of freer-
spending, sophisticated consumers, and the increasing
demand for value-adding services
1) Compound annual growth rate 2) In some cases, values might not match with sum of single values due to rounding errors
Country
Cambodia
Laos
Philippines
Singapore
Thailand
Vietnam
Southeast Asia2
Indonesia
Malaysia
Myanmar
China
Hong Kong
Taiwan
Greater China2
Japan
South Korea
Northeast Asia2
2016
0.5
0.3
12.7
1.5
12.7
7.5
64.3
21.8
5.4
1.8
119.7
4.0
5.2
128.9
64.4
15.0
79.4
2021
0.8
0.4
18.7
1.9
17.2
12.6
97.5
35.4
7.2
3.2
179.2
5.5
6.3
190.9
70.7
17.9
88.6
CAGR1)
8.8%
8.6%
8.1%
4.7%
6.1%
10.9%
8.7%
10.1%
6.0%
12.5%
8.4%
6.3%
3.8%
8.2%
1.9%
3.6%
2.2%
Source/Notes: Detailed information can be obtained from the associated Roland Berger report 2017

6
Asian healthcare market driven by an ageing population with higher disposable income and investments in healthcare infrastructure
Market development for market expansion services – Healthcare1) [USD bn]
> Market expansion services for the healthcare industry are
expected to grow by 7.2% whereof 6.7% stems from a
change in consumption and 0.5% from a change in MES
penetration
> Asian healthcare market remains very promising, mainly
because of:
– General growth of populations in most countries as well
as growing disposable income and higher standards of
living
– Significant ageing of the population (APAC being fastest
ageing region in the world) with an increase of 71% in the
number of elderly people by 2030, compared to increases
of 55% in North America and 31% in Europe over the
same period
– Developing healthcare infrastructure (e.g. hospitals or
pharmacies) and increasing focus of governments to
provide sufficient healthcare insurance/ coverage
212
2021 Change in MES
penetration
Change in
consumption
2016
301
+ 6.7% + 0.5% CAGR1) ['16-'21]
+ 7.2%
1) In some cases 'Change in consumption' and 'Change in MES penetration' do not add up to 'Compound annual growth rate' (CAGR) due to rounding errors Source/Notes: Detailed information can be obtained from the associated Roland Berger report 2017
7
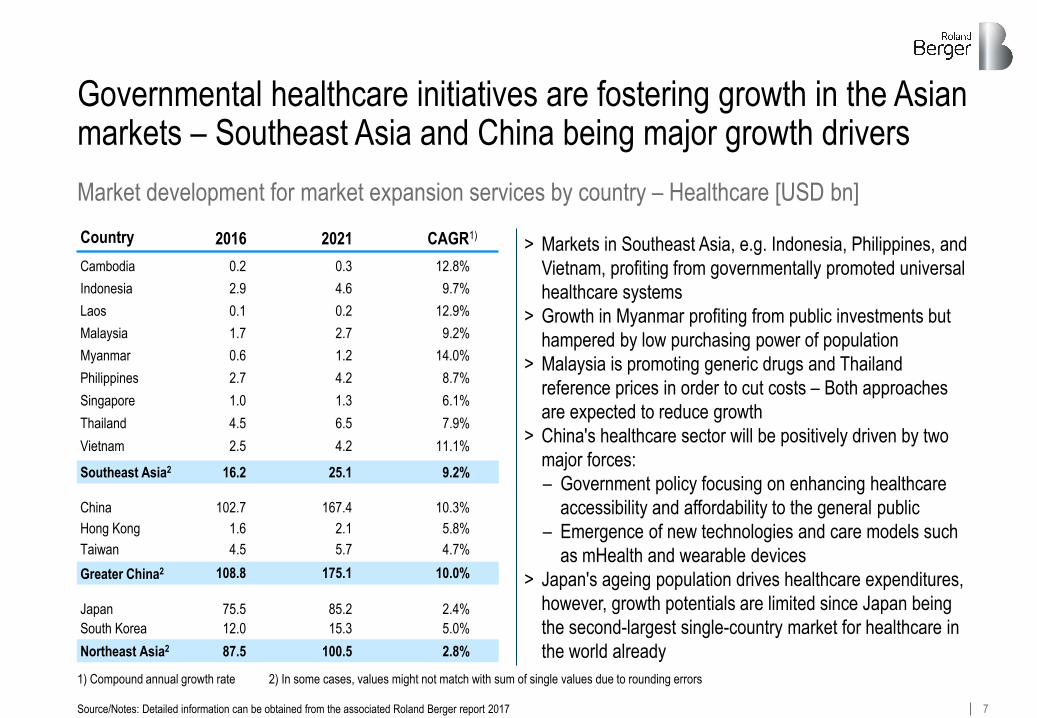
Governmental healthcare initiatives are fostering growth in the Asian markets – Southeast Asia and China being major growth drivers
Market development for market expansion services by country – Healthcare [USD bn]
> Markets in Southeast Asia, e.g. Indonesia, Philippines, and
Vietnam, profiting from governmentally promoted universal
healthcare systems
> Growth in Myanmar profiting from public investments but
hampered by low purchasing power of population
> Malaysia is promoting generic drugs and Thailand
reference prices in order to cut costs – Both approaches
are expected to reduce growth
> China's healthcare sector will be positively driven by two
major forces:
– Government policy focusing on enhancing healthcare
accessibility and affordability to the general public
– Emergence of new technologies and care models such
as mHealth and wearable devices
> Japan's ageing population drives healthcare expenditures,
however, growth potentials are limited since Japan being
the second-largest single-country market for healthcare in
the world already
Country
China
Hong Kong
Taiwan
Greater China2
Cambodia
Laos
Philippines
Singapore
Thailand
Vietnam
Southeast Asia2
Indonesia
Malaysia
Myanmar
Japan
South Korea
Northeast Asia2
1) Compound annual growth rate 2) In some cases, values might not match with sum of single values due to rounding errors
2016
0.2
2.9
0.1
1.7
0.6
2.7
1.0
4.5
2.5
102.7
1.6
4.5
75.5
12.0
16.2
108.8
87.5
2021
0.3
4.6
0.2
2.7
1.2
4.2
1.3
6.5
4.2
167.4
2.1
5.7
85.2
15.3
25.1
175.1
100.5
CAGR1)
12.8%
9.7%
12.9%
9.2%
14.0%
8.7%
6.1%
7.9%
11.1%
10.3%
5.8%
4.7%
2.4%
5.0%
9.2%
10.0%
2.8%
Source/Notes: Detailed information can be obtained from the associated Roland Berger report 2017
8
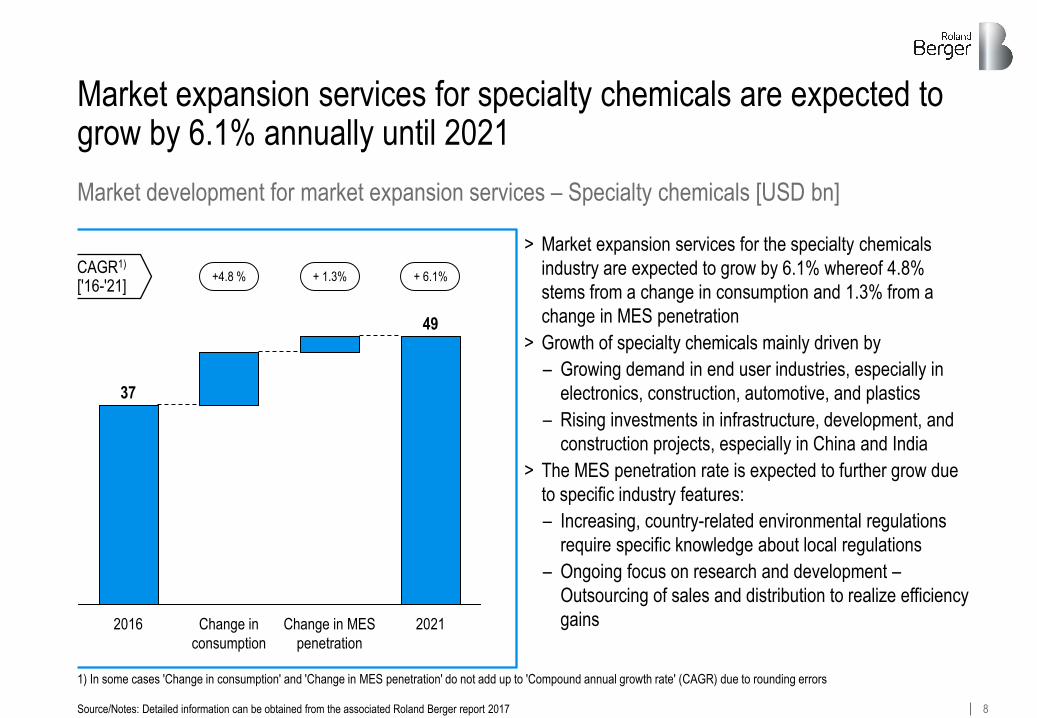
Market expansion services for specialty chemicals are expected to grow by 6.1% annually until 2021
Market development for market expansion services – Specialty chemicals [USD bn]
> Market expansion services for the specialty chemicals
industry are expected to grow by 6.1% whereof 4.8%
stems from a change in consumption and 1.3% from a
change in MES penetration
> Growth of specialty chemicals mainly driven by
– Growing demand in end user industries, especially in
electronics, construction, automotive, and plastics
– Rising investments in infrastructure, development, and
construction projects, especially in China and India
> The MES penetration rate is expected to further grow due
to specific industry features:
– Increasing, country-related environmental regulations
require specific knowledge about local regulations
– Ongoing focus on research and development –
Outsourcing of sales and distribution to realize efficiency
gains
2021
49
Change in MES
penetration
Change in
consumption
2016
37
+4.8 % + 1.3% CAGR1) ['16-'21]
+ 6.1%
Source/Notes: Detailed information can be obtained from the associated Roland Berger report 2017
1) In some cases 'Change in consumption' and 'Change in MES penetration' do not add up to 'Compound annual growth rate' (CAGR) due to rounding errors
9
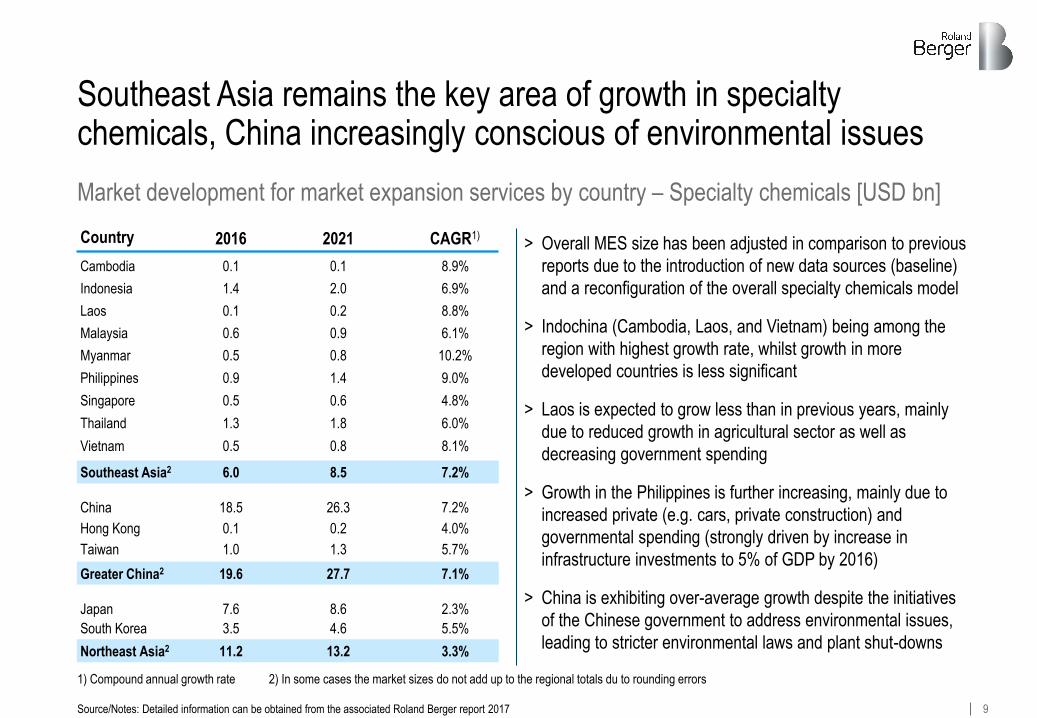
Southeast Asia remains the key area of growth in specialty chemicals, China increasingly conscious of environmental issues
Market development for market expansion services by country – Specialty chemicals [USD bn]
> Overall MES size has been adjusted in comparison to previous
reports due to the introduction of new data sources (baseline)
and a reconfiguration of the overall specialty chemicals model
> Indochina (Cambodia, Laos, and Vietnam) being among the
region with highest growth rate, whilst growth in more
developed countries is less significant
> Laos is expected to grow less than in previous years, mainly
due to reduced growth in agricultural sector as well as
decreasing government spending
> Growth in the Philippines is further increasing, mainly due to
increased private (e.g. cars, private construction) and
governmental spending (strongly driven by increase in
infrastructure investments to 5% of GDP by 2016)
> China is exhibiting over-average growth despite the initiatives
of the Chinese government to address environmental issues,
leading to stricter environmental laws and plant shut-downs
Country
China
Hong Kong
Taiwan
Greater China2
Cambodia
Laos
Philippines
Singapore
Thailand
Vietnam
Southeast Asia2
Indonesia
Malaysia
Myanmar
Japan
South Korea
Northeast Asia2
1) Compound annual growth rate 2) In some cases the market sizes do not add up to the regional totals du to rounding errors
2016
0.1
1.4
0.1
0.6
0.5
0.9
0.5
1.3
0.5
18.5
0.1
1.0
7.6
3.5
6.0
19.6
11.2
2021
0.1
2.0
0.2
0.9
0.8
1.4
0.6
1.8
0.8
26.3
0.2
1.3
8.6
4.6
8.5
27.7
13.2
CAGR1)
8.9%
6.9%
8.8%
6.1%
10.2%
9.0%
4.8%
6.0%
8.1%
7.2%
4.0%
5.7%
2.3%
5.5%
7.2%
7.1%
3.3%
Source/Notes: Detailed information can be obtained from the associated Roland Berger report 2017

10
Market expansion services in the engineered products industry are expected to grow 4.8 % annually despite economic slowdown
Market development for market expansion services – Engineered products [USD bn]
> Market expansion services for the engineered products
industry are expected to grow by 4.8% whereof 3.5%
stems from a change in consumption and 1.4% from a
change in MES penetration, thus predicting lower growth
than in last year's report
> Southeast Asia is forecasted to see the strongest growth
within the region, profiting from increase of domestic
demand as well as foreign direct investments
> In China, however, the restraints on investments and the
overall economic uncertainty have a negative influence on
demand for engineered products
> Japan and South Korea as traditionally more
technologically advanced countries in Asia will be facing
stronger competition in the region due to the growing
technological competencies of adjacent economies
139
110
Change in MES
penetration
Change in
consumption
2016 2021
+ 3.5% + 1.4% CAGR1) ['16-'21]
+ 4.8%
1) In some cases 'Change in consumption' and 'Change in MES penetration' do not add up to 'Compound annual growth rate' (CAGR) due to rounding errors Source/Notes: Detailed information can be obtained from the associated Roland Berger report 2017

11
Southeast Asia with significant growth of engineered products due to positive influences by policy-makers – China's growth slackening
Market development for market expansion services by country – Engineered products [USD bn]
> Southeast Asia expected to profit from several positive
developments:
– The launch of the ASEAN Economic Community (AEC)
is set to become a key influence on the manufacturing
landscape in Southeast Asia by creating a single-market
and production place
– As China is transforming into a higher added-value
manufacturing place, Southeast Asia is becoming a hub
for low-cost manufacturing
– Investments in infrastructure, e.g. improved railway
network in Thailand and Myanmar, are facilitating
industry growth
> China is characterized by slowing industry growth on the
one hand and transformation into a high-value
manufacturing country (e.g. increased automation, more
widespread use of up-to-date production technologies) on
the other hand
Country 2016 2021 CAGR1)
China
Hong Kong
Taiwan
Greater China
Cambodia
Laos
Philippines
Singapore
Thailand
Vietnam
Southeast Asia
Indonesia
Malaysia
Myanmar
Japan
South Korea
Northeast Asia
1) Compound annual growth rate
0.3 0.6 11.6%
3.5 5.6 9.5%
0.3 0.4 9.2%
3.9 4.7 3.6%
0.6 1.2 15.9%
3.6 4.8 6.0%
1.2 1.5 5.0%
6.5 8.9 6.4%
4.9 8.4 11.7%
57.4 68.7 3.6%
2.0 2.3 3.7%
5.9 7.6 5.3%
7.5 9.0 3.6%
12.5 15.7 4.7%
24.8 36.0 7.8%
65.3 78.7 3.8%
20.0 24.7 4.3%
Source/Notes: Detailed information can be obtained from the associated Roland Berger report 2017
12
Methodology
For the purposes of this study, Roland Berger developed a market model that covers four main industries (including nearly 40 sub-industries and segments) in 14 Asian
countries. The model provides a market outlook through 2021. Detailed information regarding 'data sources used for each industry', 'market sizing', 'market breakdown',
'market projection' can be obtained from the associated Roland Berger report 2017
Restrictions As with any model, forecasting methodology or competitive analysis, our analysis tool is subject to certain limitations. For the methodology
described above, the most important restrictions are as follows:
Market size: The market sizes are based on market data from leading institutes. As explained above, incomplete data was modeled on the
basis of the best available proxies. However, the market sizes modeled are only approximations and may differ from actual market sizes.
Market breakdown: The market breakdown is the result of our analysis of quantitative and qualitative information consolidated from market
reports and interviews with experts. Qualitative information is necessary for a realistic market breakdown. By consequence, however,
estimates are inherent in the methodology, resulting in best approximations that may again differ from actual market sizes. In order to assure
latest and state of the art analysis of the market breakdown, we reviewed the underlying assumptions of the model and added an additional
criterion compared to last year's report; the assessment of the political stability proves to be an important factor on economic developments.
Market forecasts: The market forecasts are projections of the future and can never fully take account of all eventualities. It follows that any
unpredictable events that impact economic developments cannot be mirrored in such forecasts. The forecasts made in this report incorporate
expected future market trends based on the information available at the time of quantification. Certain deviations are to be expected.
Data sources: As with all external data sources, they change over time. We adapted and included new data sources where needed and
appropriate (especially specialty chemicals) and added new subindustries for specialty chemicals such as agrochemicals and polymers &
plastic additives. Following from these changes, the size of the market for specialty chemicals changed in comparison to last year's model.
Despite these significant restrictions, we are convinced that our analysis presents a true and fair picture of the markets analyzed.
Source: Roland Berger

13
To create transparency in an industry not yet researched by any independent analysis, this report, commissioned by DKSH, has been
prepared by Roland Berger AG on a neutral, objective and independent basis.
The present report is provided by Roland Berger AG for information purposes only. Each recipient should conduct its own analysis of the
information contained in this report. No recipient is entitled to rely on the work of Roland Berger AG in this report for any purpose. No
representation or warranty (express or implied) is given as to the accuracy or completeness of the information contained in this report. To
the extent permitted by law, Roland Berger AG, its members, employees and agents accept no liability, and disclaim all responsibility for the
consequences of the recipient or anyone else acting, or refraining to act, in reliance on the information contained in this report or for any
decision based on it. Any estimates or projections of future economic performance are influenced by numerous factors that may impact the
various components of the estimates or projections. Although Roland Berger AG exercises reasonable care when making forecasts or
predictions, factors in the process, such as market behavior, are inherently uncertain. As such, future events may not unfold as expected
and actual results achieved for the forecast periods covered may vary from the information presented. Any estimates or projections will only
take into account information available to Roland Berger AG up to the date of delivery of this report; hence, findings may be affected by new
developments. Accordingly, we do not guarantee that any outcome presented in this report will be achieved. Further, events may have
occurred since we prepared this report which may affect it and its findings.
Roland Berger AG has indicated within this report the sources of the information provided. We have not sought to independently verify
those sources unless otherwise noted within this report. Roland Berger AG is under no obligation in any circumstances to update this report,
in either oral or written form, for events occurring after the report has been issued in final form. The recipient must not reproduce, disclose
or distribute the information herein without the express prior written consent of Roland Berger AG.
Disclaimer
Source: Roland Berger
