gsα overexpression and loss of gsα imprinting in human somatotroph adenomas: association with...
TRANSCRIPT

Gsa overexpression and loss of Gsa imprinting in human somatotroph adenomas:
Association with tumor size and response to pharmacologic treatment
Christophe Picard1,2, Monique Silvy2,3, Corinne Gerard1, Christophe Buffat3, Esteban Lavaque1,Dominique Figarella-Branger4, Henri Dufour5, Jean Gabert2, Albert Beckers6, Thierry Brue7,Alain Enjalbert
1,3and Anne Barlier
1,3*
1Laboratory Interactions Cellulaires Neuroendocriniennes, UMR 6544 CNRS, Institut F�ed�eratif Jean Roche,Facult�e de M�edecine Nord, Universit�e de la M�editerran�ee, Marseille, France2ERT Media, Institut F�ed�eratif Jean Roche, Facult�e de M�edecine Nord, Universit�e de la M�editerran�ee, Marseille, France3Laboratory of Biochemistry and Molecular Biology, Centre Hospitalo-Universitaire Conception, Marseille, France4Laboratory of Neuropathology, Centre Hospitalo-Universitaire Timone, Marseille, France5Department of Neurosurgery, Centre Hospitalo-Universitaire Timone, Marseille, France6Department of Endocrinology, CHU de Liege, Universit�e de Liege, Domaine Universitaire du Sart-Tilman 4000 Liege, Belgium7Department of Endocrinology, Centre Hospitalo-Universitaire Timone, Marseille, France
Gsa, the a-subunit of the heterotrimeric GTP-binding protein, iscoded from the GNAS gene, which is imprinted in a tissue-specificmanner. Gsa is paternally silenced in normal pituitary, but Gsaimprinting relaxation is found in some tumoral tissue. In addition,Gsa mRNA levels are high in some somatotroph adenomas notbearing the active Gsa mutant, the gsp oncogene. In this study, theimpact of loss of imprinting on Gsa expression level and ontumoral phenotype has been investigated. We compared theexpression and imprinting of 4 transcripts of GNAS locus(NESP55, XLas, exon 1A, Gsa) of 60 somatotroph adenomas withthose of 23 lactotroph adenomas. The paternal and maternal tran-scripts were quantified using allele-specific real-time PCR andFokI polymorphism. Moreover, the methylation of exon 1A DMRwas analyzed. As is the case for the gsp oncogene, high Gsa expres-sion in gsp- tumors was associated with smaller tumor size andbetter octreotide sensitivity. A strong imprinting relaxation (per-centage of paternal Gsa expression �7.5%) was found only in gsp-tumors. The loss of Gsa imprinting was associated with a decreasein exon 1A mRNA expression. Unexpectedly, the methylation sta-tus of exon 1A DMR was not modified in relaxed tumors. Mater-nal Gsa mRNA level decreased with exon 1A level, and conse-quently the loss of Gsa imprinting did not induce the expectedGsa overexpression. Finally, XLas mRNA level correlated withthat of paternal Gsa and of NESP55 showing the complexity ofgene regulation in the GNAS locus.' 2007 Wiley-Liss, Inc.
Key words: imprinting; pituitary adenomas; exon 1A; GNAS; gsponcogene; methylation
The GNAS gene encodes the a-subunit of the heterotrimericGTP-binding protein (Gsa) and is a complex imprinted locuslocalized on human chromosome 20q13. Multiple gene productsare generated by alternative promoters and the first exons thatsplice onto a common set of downstream exons (Fig. 1).1 Themost upstream alternative promoter (49 kb upstream of Gsa exon1) produces transcripts encoding the 55 kDa neuroendocrine secre-tory protein (NESP55), a chromogranin-like protein. The secondalternative promoter, about 35 kb upstream of Gsa exon 1, pro-duces transcripts encoding extra-large as (XLas), an isoform ofGsa with a long amino-terminal extension. NESP55 transcriptsare expressed from the maternal allele, while XLas transcripts areexpressed from the paternal allele. Gsa is imprinted in a tissue-specific manner; it is expressed primarily from the maternal allelein renal proximal tubules and in endocrine organs.2–4 In otherorgans, Gsa expression is biallelic, as confirmed in several humanfetal tissues5 and more recently in human bone and adipose tis-sues.6
It is well known that genomic imprinting involves allele-spe-cific epigenetic changes such as DNA methylation of CpG dinu-cleotides or acetylation and methylation of histones. However, theGsa promoter itself is unmethylated on both alleles.7 In fact, a
region about 2.5 kb upstream of Gsa exon 1 was identified asbeing a differentially methylated region (DMR) required for thetissue-specific imprinting of Gsa.7 This region, named 1A DMR,contains exon 1A (also referred to as exon A/B), which splicesonto the common exon 2 of GNAS to generate paternal-specificuntranslated transcripts, and its promoter. Confirming the involve-ment of exon 1A DMR in Gsa imprinting, paternal 1A DMR dele-tion in transgenic mice abolishes tissue-specific imprinting ofGsa.8,9
We previously reported on the imprinting of Gsa in normalhuman pituitary.2 However, a paternally derived expression hasbeen detected in some pituitary tumoral tissues.2,3 Pituitary adeno-mas are the most frequent intracranial tumors. Twenty percent ofpituitary tumors are somatotroph adenomas (growth hormone(GH) secretors). Although often considered as benign, they caninduce serious neurological and metabolic complications. GHhypersecretion can be inhibited by somatostatin agonists such asoctreotide. However, serum GH levels reach normal values inonly 50% of treated patients. Forty percent of human somatotrophadenomas contain heterozygous mutations in the GNAS gene thatconstitutively activate Gsa by substitutions at arginine 201 or glu-tamine 227.10 The mutated protein has been named gsp oncogene.We previously showed that gsp oncogene impacted tumoral phe-notype; gsp1 tumors being smaller and more sensitive to octreo-tide treatment than gsp2 ones.11 On the other hand, Gsa mRNAlevel varied among human somatotroph adenomas, the highestexpression being observed in gsp2 tumors.12 So far, it wasunknown how Gsa expression level impacted the phenotype of pi-tuitary adenomas. The absence of GHRH response is a characteris-tic of somatotroph adenomas bearing the gsp oncogene. However,the increased expression of wild type Gsa protein could have astronger impact than the mutation itself on the intensity of theGHRH response.13 It is well known that genomic imprinting dys-regulation impacts gene expression level and participates in tu-morigenesis.14 Thus, we hypothesized that an imprinting dysregu-lation of Gsa transcript in somatotroph tumors2,3 could accountfor the high Gsa expression level of these tumors and mightimpact tumoral phenotype.
Expression and imprinting of 4 gene products of GNAS locus(NESP55, XLas, exon 1A, Gsa) were analyzed in somatotrophadenomas in comparison with lactotroph ones. The paternal and
*Correspondence to: Laboratoire ICNE UMR 6544-CNRS, InstitutJean-Roche, Facult�e de M�edecine Nord, Boulevard Pierre Dramard, 13916Marseille Cedex 20, France. E-mail: [email protected] 2 June 2006; Accepted after revision 20 March 2007DOI 10.1002/ijc.22816Published online 18 May 2007 in Wiley InterScience (www.interscience.
wiley.com).
Int. J. Cancer: 121, 1245–1252 (2007)' 2007 Wiley-Liss, Inc.
Publication of the International Union Against Cancer

maternal Gsa transcripts were quantified using a silent Fok1 poly-morphism at exon 5 and allele-specific real-time PCR. Resultsshowed Gsa mRNA levels impacted tumoral phenotype of gsp2somatotroph adenomas. Moreover, Gsa imprinting relaxation wasstrong only in this type of tumors and was associated with adecrease in exon 1A mRNA level. However, the methylation sta-tus of exon 1A DMR was not modified in these relaxed tumors.Gsa imprinting relaxation did not cause Gsa overexpressionbecause of a reduced maternal Gsa. Furthermore, XLas mRNAlevel correlated with that of paternal Gsa and of NESP55. Theseresults showed the complexity of gene regulation and genomicimprinting of the GNAS locus.
Material and methods
Pituitary tumors
Eighty-three pituitary adenomas (60 somatotroph and 23 lacto-troph) were obtained at transphenoidal surgery. They were classi-fied using clinical, hormonal11 and immunocytochemical data,including absence of contamination with normal pituitary.12 Thesize and extent of each pituitary tumor were evaluated by mag-netic resonance imaging. Fifty-two somatotroph adenomas weretested for gsp mutations as previously described.11 Twelve tumorswere gsp1 and 40 gsp2. In 33 patients bearing gsp2 tumors, so-matostatin sensitivity was evaluated by an acute test with a single100-lg s.c. injection of octreotide (Sandostatin, Novartis, Bazel,Switzerland) as described.11 Acromegalic patients were consid-ered as good responders when the mean GH levels between 2 and6 hr after the acute octreotide administration were under 5 lg/l.
Sensitivity to octreotide was expressed as the percent decrease inGH from basal value to the mean GH values 2–6 hr after octreo-tide injection. According to the test results, 16 patients were con-sidered as full octreotide responders (mean GH suppression 84%6 11%), whereas 17 were considered partial octreotide responders(mean GH suppression 51% 6 14%). For all samples, institutionalapproval was received from the Ethics Committees of the Univer-sity of Aix-Marseilles, and informed consent was received fromeach patient. Moreover, autopsy specimens from normal humanpituitaries and 2 human embryonic pituitaries were analyzed.
Quantification of Gsa protein by Western blot
Gsa protein was quantified in 10 somatotroph adenomas (2gsp1 and 8 gsp2). Samples were broken in a glass Teflon PotterElvehjem homogenizer in 10 mM Tris/1 mM EGTA buffer pH 7.4containing 3% sucrose and centrifuged 7 min at 500g at 4�C. Thesupernatant was then centrifuged 15 min at 12,500g at 4�C. Theresulting pellet was resuspended in 50 mM Tris pH 7.4. Membraneproteins (5 lg) [quantified by DC protein assay (Biorad, France)]were denatured in Laemmli’s sample buffer, separated on 10%SDS page, and transferred to PVDF membrane (Perkin Elmer,France). Immunodetection of Gsa was performed using anti-Gsaantibodies (Calbiochem, VWR international, France) and anti-rab-bit IgG coupled to alkaline phosphatase as secondary antibodies.Blots were developed with the enhanced chemiluminescenceWestern-StarTM detection system (Tropix, Applera, France) andquantified with a GeneGnome (Ozyme, France). Two bands corre-sponding to 2 isoforms arising from alternative splicing of mRNAtranscripts15 were visualized in each tumor. The Gsa protein levelcorresponded to the sum of the signals from these 2 bands. Then,the levels were normalized to those of b-actin by reprobing themembrane with a monoclonal b-actin antibody (Sigma–Aldrich,France). Results were expressed as Gsa arbitrary units/b-actin ar-bitrary units (AU).
Quantification of NESP55 XLas, exon 1A and Gsa mRNA
Total RNAs were isolated from 10 to 30 mg of tissue from eachtumor by the RNA easy isolation system (Qiagen, Courtaboeuf,France). cDNA was made from 1 lg of total RNA using randomprimed reverse transcription and Superscript II reverse transcrip-tase (Invitrogen Cergy-Pontoise, France) as described.11
Four transcripts of the GNAS locus (NESP55, XLas, exon 1Aand Gsa) were measured by real-time quantitative PCR based onTaqman methodology using the MX 3000 apparatus (Stratagene,Amsterdam, The Netherlands). A common LNA probe, on thejunction of exon 5 and 6, was used for NESP55, XLas and exon1A mRNA quantification. Specific forward primers were designedon exon 1 of each gene, and a common reverse primer on exon 6was used (Table I). For Gsa and to avoid the complexity intro-duced by the alternative splicing of exon 3, the forward primer,reverse primer and probe were designed on exon 1, exon 2 and onexon 1–exon 2 junction, respectively.
Amplification of cDNA derived from 50 to 100 ng of total RNAwas performed in a 25 ll reaction volume with 300 nmol of eachprimer (except for NESP55 primers, 900 nM), 200 nM of theprobe and 12.5 ll of Master Mix (PE Applied Biosystems, Paris,France). Standard curves were constructed using plasmid dilu-tions. cDNA of each transcript was subcloned into the PCR IITOPO vector (Invitrogen). Each plasmid was verified by DNAsequencing (Beckman- Coulter, Ceq 8000) and linearized. Thecopy number in 1 lg of DNA was estimated according to the mo-lecular weight of the vector and insert. The digested plasmidswere serially diluted in a solution of Tris 10 mM, pH 8 containing200 ng/ll of Escherichia Coli 16S and 23S rRNA (Roche, Meylan,France) and stored at 220�C until use. The mRNA levels werenormalized to the b-glucuronidase (b-Gus) mRNA levels.16 Theb-Gus primers and probe were purchased from PE Applied Bio-system (Paris, France). The results were expressed as copies of in-terest gene/b-Gus copies. Quantification of the 4 transcripts from
FIGURE 1 – (a) Diagram showing the maternal and the paternal al-leles of human GNAS locus. Four exons corresponding to the firstexons of 4 transcripts, NESP55 (NESP), XLas, untranslated exon 1A(1A) and exon 1 (Gsa) splice onto a common exon 2. Transcription-ally active promoters are indicated by horizontal arrows. DNA meth-ylation (Meth) is shown above each image. Paternal NESP antisense(Nespas) transcript is indicated. Paternal expression of Gsa, found insome pituitary adenomas, is indicated by a dashed arrow. (b) Estab-lishment of allele-specific quantitative real time PCR of Gsa. T-Gsaplasmid was serially diluted in an increasing concentration of C-Gsaplasmid. The results are expressed as the percentage of total copynumber. Linear regression was observed between measured andexpected value, r 5 0.96, p < 0.0023 for T-Gsa plasmid and r 50.99, p < 0.0003 for C-Gsa plasmid.
1246 PICARD ET AL.

the GNAS locus was performed in tumoral samples whatever theirgenotype was i.e. homozygous or heterozygous for FokI polymor-phism (see later), and according to available tumoral RNA.
Allele-specific PCR
Allele-specific PCR of NESP55, XLas, exon 1A, and Gsa mes-sengers was performed using the Fok I (NM_000516, c.T393C)polymorphism at exon 5. Two LNA probes were designed to spe-cifically recognize thymine (T-LNA) or cytosine (C-LNA) (Cus-tomer Scientific Support of Eurogentec, Belgium; Table I). The re-porter-specific dye was FAM for T allele and Yakima Yellow forC allele. The darkquencher used was Eclipse DarkQuencher. For-ward and reverse primers were the same as above (Table I). Theannealing extension temperature was 67�C for all genes. To verifythe specificity of each allele-specific PCR, we used plasmids con-taining cDNA of each transcript bearing the T or the C (named T-plasmid or C-plasmid).
To determine the parental origin of each allele, only samplesheterozygous at FokI polymorphism were selected. Because XLasand NESP55 expression are exclusively monoallelic in all pitui-tary tumors (paternally and maternally respectively2), the allele-specific amplifications of Gsa transcripts were compared to thoseof NESP55 and XLas.
Exon 1A DMR methylation analysis
Combined bisulfite restriction analysis (COBRA) consists of astandard bisulfite DNA treatment followed by restriction digestionand quantitation step. During the first step, unmethylated cytosineresidues are converted to thymine, whereas methylated cytosineresidues are retained as cytosine. Restriction digestion by HinfI isused to reveal DNA methylation-dependent differences in PCR-amplified bisulfite-treated genomic DNA: HinfI cleaves the PCRproduct generated from nonconverted methylated DNA.17 Thepercentage of methylated HinfI sites in a genomic DNA sample iscalculated from the ratio of the HinfI-cleaved PCR product rela-tive to the total amount of PCR product.
The methylation status of exon 1A DMR18 was analyzed ingenomic DNA isolated from 11 pituitary adenoma samples andfrom lymphocytes of 3 controls and 3 patients with pseudohypo-parathyro€ıdism type Ib. The parathormone mean of these hypocal-cemic patients was 538 6 191 ng/l. Bisulfite-treated DNA wasobtained by using the EZ DNA methylation-gold KitTM (ZymoResearch, Orange, CA). Then the exon 1A region was amplifiedby PCR using the following primers: forward primer 50TTGTTTTGYGTGTGAGTGTATTTT and reverse primer 50CRCTCCTTAATTTAACTCTTAAACACR. Restriction digestionswere performed using 1 U of HinfI (InVitrogen Carlsbad, CA) in atotal volume of 15 ll at 37�C for 90 min. The PCR reaction gener-ated a 222 bp fragment. When this fragment was generated fromthe methylated DNA strand, 2 HinfI restriction sites were present,leading to the appearance of 3 fragments (131 pb, 71 bp and20 bp). The bisulfite conversion of C to T induced the disappear-ance of these restriction sites in the unmethylated strand.17 The
electrophoresis of the digestion reaction (10 ll) was then per-formed in a 2% agarose gel and quantified by ethidium bromidestaining using the Kodak 1D 3.6.1 software.
Statistics
The results are presented as the mean 6 SEM. Statistical signif-icance between 2 groups was determined by Mann-Whitney test.To measure the strength of association between pairs of variableswithout specifying dependency, Spearman rank order correlationswere run. The multiple pairwise comparisons between XLas,NESP55 and paternal Gsa mRNA levels were performed usingThree Way ANOVA followed by Bonferroni t-test (SPSS soft-ware, SPSS France SA, Paris, France). p < 0.05 was consideredsignificant in all tests.
Results
Establishment of allele-specific quantitative real-time PCR of Gsa
Amplification efficiencies of both Gsa plasmids (T-Gsa and C-Gsa) were identical; the two standard curves had the same slope(23.3 6 0.2 with y-intercept between 38 and 40 Ct (cycle ofthreshold)) and were superimposed, allowing us to compare thelevel of Gsa expression from each allele.
To test the specificity of each LNA-probe, 1 Gsa plasmid wasserially diluted in increasing concentrations of the other, at a totalquantity of 106 plasmid copies. The results were expressed as thepercentage of total copy number. A linear relationship wasobserved between the percentage of measured and expected valuesof both plasmids (Fig. 1b). T- and C-LNA probes were specific upto 1% but the quantification was not accurate and reproduciblebetween 1 and 7.5%. The specificity of LNA probes was con-firmed using dilutions of cDNA from pituitary adenomas homozy-gous for T in cDNA from adenomas homozygous for C (notshown). Moreover, because Gsa expression is biallelic in lympho-cytes,19 3 lymphoblastoid cell lines, RS (4;11), ALL-PO and ACC42, heterozygous at the exon 5 polymorphism, were used to checkthe accuracy of quantitative allele-specific PCR of Gsa. Asexpected, the percentage of expression from each allele variedfrom 45 to 55%.
The percentage of paternal Gsa expression was calculated asfollows: paternal Gsa/(paternal Gsa 1 maternal Gsa)3 100. Gsaimprinting was considered relaxed when paternal transcripts weredetected. However, because of the limits of the method, only thepercentages of paternal Gsa expression �7.5% were quantifiablewith accuracy. For these tumors, the Gsa imprinting relaxationwas considered strong.
Gsa expression levels and clinical data in somatotroph tumors
Gsa mRNA and protein levels were analyzed in 10 somatotrophtumors. In the 8 gsp2 tumors, Gsa mRNA levels were variablebut correlated with Gsa protein levels (Fig. 2a). In the 2 gsp1tumors, the Gsa protein level was low and consistently lower than
TABLE I – PRIMERS AND PROBES USED IN REAL-TIME PCR
Sequence Position
Reverse primer 50-GGAGGGAAGTCAAAGTCAGGC-30 Exon 6Forward primer 50-GCAGGTCTACCGGGCCA-30 Gsa exon 1NESP 55 forward primer 50-CCGGAGTCCCCTTCCAAA-30 NESP55 exon 1XLas forward primer 50-ACGAAAAGATGGGCTACATGTGT-30 XLas exon 1Exon1A forward primer 50-TGCCTTGCGTGTGAGTGC-30 Exon 1AT-LNA probe 50-ATCACACTCAGAATGTAGTCCAC-30 Exon 5C-LNA probe 50-ACACTCAGGATGTAGTCCACTC-30 Exon 5Common probe 50-ACAATGGTTTCAATCGCCTCTTTCAGG-30 Junction exons 5/6Gsa probe 50-ACAAGCAGGTCTACCGGGCCACG-30 Junction exons 1/2Gsa reverse primer 50-GATTCTCCAGCACCCAGCAG-30 Exon 2
1247LOSS OF Gsa IMPRINTING IN PITUITARY TUMORS

in the 2 gsp2 tumors (tumors A6 and A8), which expressed a GsamRNA level equivalent to those of the 2 gsp1 tumors (Table II).
Gsa expression levels were examined with reference to tumoralcharacteristics of somatotroph tumors, excluding gsp1 tumors(gsp oncogene modifies the phenotype11). The Gsa transcriptsnegatively correlated with tumoral size, as measured by maximaldiameter on magnetic resonance images (Fig. 2b). Moreover, GsamRNA expression was significantly higher in the 16 octreotide-sensitive gsp2 tumors (98.6 6 14.9 copy/copy b-Gus) than in the17 partially sensitive ones (55.8 6 5.9 copy/copy b-Gus, p <0.006; Fig. 2c).
Genotype distribution of c.T393C polymorphism andGsa imprinting in human pituitary tissues
The genotype distribution of c.T393C polymorphism in pitui-tary adenomas was not significantly different from that of the Cau-casian population.20 In 23 lactotroph tumors, the percentages oftumors bearing C/C, T/T and T/C genotypes were 13% (n 5 3),22% (n 5 5) and 65% (n 5 15), respectively. In 60 somatotrophadenomas, the percentages were 19% (n 5 10), 31% (n 5 17) and50% (n 5 28), respectively.
Gsa expression derived from maternal allele in 2 human normalpituitary samples and was biallelic in 2 embryonic pituitary tis-sues. Whereas Gsa transcripts were exclusively maternal in all 15heterozygous prolactinomas except 2, a paternal Gsa expressionwas found in 25 of 28 heterozygous somatotroph adenomas. Whenthe percentage of paternal Gsa expression was greater than 7.5%,it corresponded exclusively to the gsp2 tumors (Fig. 3a).
Loss of Gsa imprinting and Gsa mRNA expression
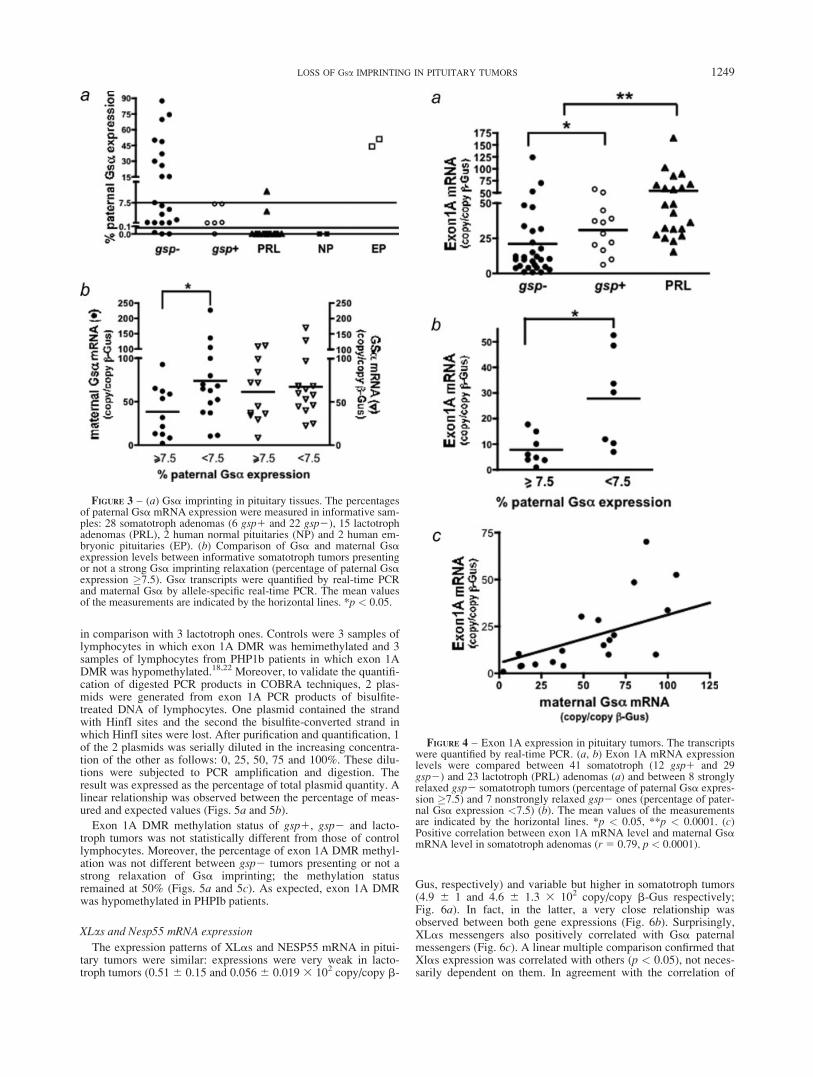
According to the level of Gsa imprinting relaxation, informativesomatotroph tumors were divided into 2 groups: strongly relaxedtumors (percentage of paternal Gsa expression �7.5%) and non-strongly relaxed tumors (percentage of paternal Gsa expression<7.5%). The Gsa mRNA level (expressed from both alleles) andmaternal Gsa level were thus investigated. Unexpectedly, we didnot find any increase in Gsa expression in the strongly relaxedgroup relative to the nonstrongly relaxed one (606 10 vs. 676 12copy/copy b-Gus respectively). In fact, maternal Gsa expressionwas significantly lower in the first group than in the second one (376 8 vs. 756 13 copy/copy b-Gus p < 0.03; Fig. 3b).
Loss of Gsa imprinting and exon 1A mRNA expression
The levels of exon 1A mRNA were measured in tumoral frag-ments, whatever their genotype. In all informative tumors, exon1A transcripts derived exclusively from paternal allele. Theexpression level was significantly lower in somatotroph tumors(22.8 6 3.7 copy/copy b-Gus) than in lactotroph tumors (49.8 67.4 copy/copy b-Gus, p < 0.0001; Fig. 4a) and lower in gsp2tumors than in gsp1 ones (21.1 6 4.9 vs. 30.86 3.7 copy/copy b-Gus, respectively, p < 0.05; Fig. 4a). In fact, in the group of gsp2tumors, exon 1A expression in tumors presenting a strong relaxa-tion of Gsa imprinting was much lower than in those without (7.86 2 vs. 27.36 7 copy/copy b-Gus respectively, p< 0.05; Fig. 4b).Moreover, a positive correlation was observed between maternalGsa and exon 1A transcripts in somatotroph tumors (Fig. 4c).
Exon 1A DMR methylation status
Several data from transgenic mice and human pathologyshowed the crucial role of exon 1A hemimethylation in the main-tenance of Gsa imprinting.8,9,18,21 The exon 1A DMR methylationpattern was analyzed in 2 gsp1 and 6 gsp2 somatotroph tumors
TABLE II – Gsa mRNA AND PROTEINS IN 2 gsp1 AND 8 gsp2SOMATOTROPH ADENOMAS
Gsa mRNA(copy/copy b-Gus)
Gsa protein(AU/AU b-actin3 10)
gsp1A1 46.1 1.744A2 67.8 2.964
gsp2A3 87.7 3.920A4 8.4 1.103A5 113.2 9.910A6 44.5 4.019A8 64.4 4.450A9 85.8 4.258A10 143.44 13.553A11 72.6 5.460
Gsa mRNAs were measured by real-time PCR and Gsa proteins byWestern blot.
FIGURE 2 – Gsa expression in gsp2 somatotroph tumors. GsamRNA was quantified by real-time PCR. (a) Gsa mRNA levels corre-lated with the Gsa protein levels measured by Western blot andreported to b-actin protein level (p < 0.02, r 5 0.8). (b) Negative cor-relation between size, measured by the maximal tumoral diameter andGsa mRNA expression level in 40 tumors (r 5 20.39, p < 0.01). (c)Gsa mRNA expression levels were compared between 16 octreotide-sensitive and 17 octreotide-partially sensitive tumors. The mean val-ues are indicated by the horizontal lines. *p < 0.006.
1248 PICARD ET AL.
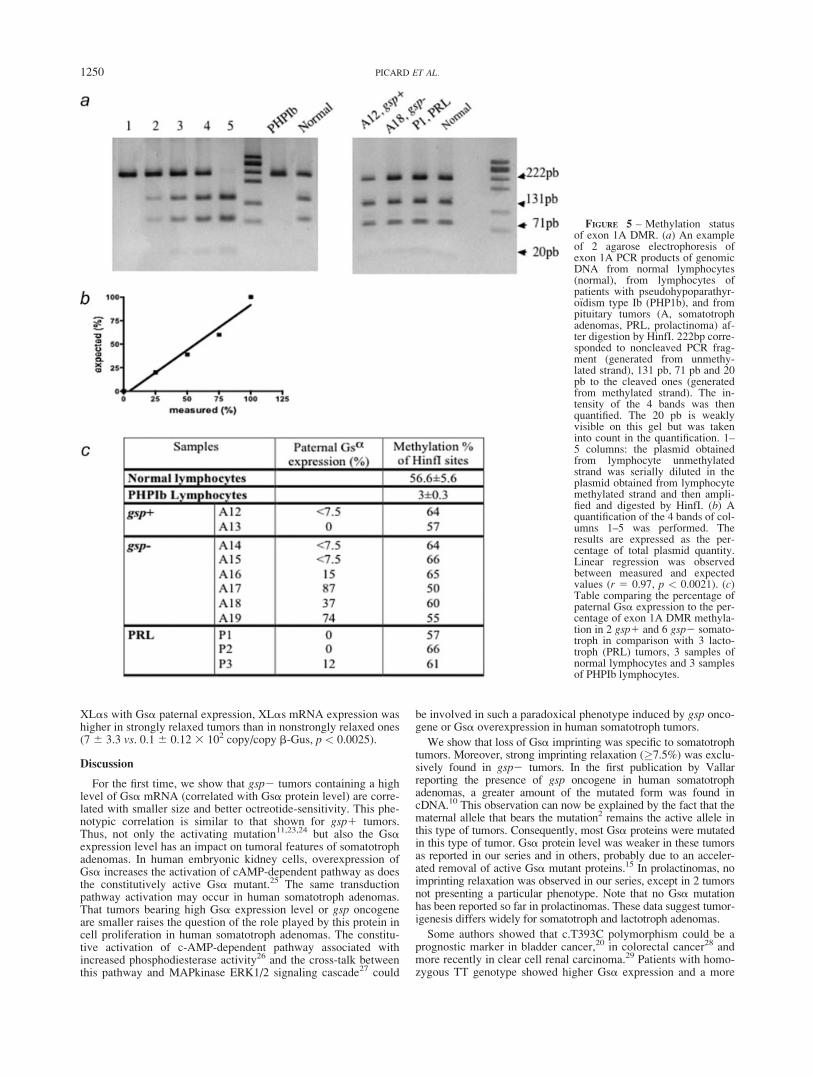
in comparison with 3 lactotroph ones. Controls were 3 samples oflymphocytes in which exon 1A DMR was hemimethylated and 3samples of lymphocytes from PHP1b patients in which exon 1ADMR was hypomethylated.18,22 Moreover, to validate the quantifi-cation of digested PCR products in COBRA techniques, 2 plas-mids were generated from exon 1A PCR products of bisulfite-treated DNA of lymphocytes. One plasmid contained the strandwith HinfI sites and the second the bisulfite-converted strand inwhich HinfI sites were lost. After purification and quantification, 1of the 2 plasmids was serially diluted in the increasing concentra-tion of the other as follows: 0, 25, 50, 75 and 100%. These dilu-tions were subjected to PCR amplification and digestion. Theresult was expressed as the percentage of total plasmid quantity. Alinear relationship was observed between the percentage of meas-ured and expected values (Figs. 5a and 5b).
Exon 1A DMR methylation status of gsp1, gsp2 and lacto-troph tumors was not statistically different from those of controllymphocytes. Moreover, the percentage of exon 1A DMR methyl-ation was not different between gsp2 tumors presenting or not astrong relaxation of Gsa imprinting; the methylation statusremained at 50% (Figs. 5a and 5c). As expected, exon 1A DMRwas hypomethylated in PHPIb patients.
XLas and Nesp55 mRNA expression
The expression patterns of XLas and NESP55 mRNA in pitui-tary tumors were similar: expressions were very weak in lacto-troph tumors (0.51 6 0.15 and 0.056 6 0.019 3 102 copy/copy b-
Gus, respectively) and variable but higher in somatotroph tumors(4.9 6 1 and 4.6 6 1.3 3 102 copy/copy b-Gus respectively;Fig. 6a). In fact, in the latter, a very close relationship wasobserved between both gene expressions (Fig. 6b). Surprisingly,XLas messengers also positively correlated with Gsa paternalmessengers (Fig. 6c). A linear multiple comparison confirmed thatXlas expression was correlated with others (p < 0.05), not neces-sarily dependent on them. In agreement with the correlation of
FIGURE 4 – Exon 1A expression in pituitary tumors. The transcriptswere quantified by real-time PCR. (a, b) Exon 1A mRNA expressionlevels were compared between 41 somatotroph (12 gsp1 and 29gsp2) and 23 lactotroph (PRL) adenomas (a) and between 8 stronglyrelaxed gsp2 somatotroph tumors (percentage of paternal Gsa expres-sion �7.5) and 7 nonstrongly relaxed gsp2 ones (percentage of pater-nal Gsa expression <7.5) (b). The mean values of the measurementsare indicated by the horizontal lines. *p < 0.05, **p < 0.0001. (c)Positive correlation between exon 1A mRNA level and maternal GsamRNA level in somatotroph adenomas (r 5 0.79, p < 0.0001).
FIGURE 3 – (a) Gsa imprinting in pituitary tissues. The percentagesof paternal Gsa mRNA expression were measured in informative sam-ples: 28 somatotroph adenomas (6 gsp1 and 22 gsp2), 15 lactotrophadenomas (PRL), 2 human normal pituitaries (NP) and 2 human em-bryonic pituitaries (EP). (b) Comparison of Gsa and maternal Gsaexpression levels between informative somatotroph tumors presentingor not a strong Gsa imprinting relaxation (percentage of paternal Gsaexpression �7.5). Gsa transcripts were quantified by real-time PCRand maternal Gsa by allele-specific real-time PCR. The mean valuesof the measurements are indicated by the horizontal lines. *p < 0.05.
1249LOSS OF Gsa IMPRINTING IN PITUITARY TUMORS
XLas with Gsa paternal expression, XLas mRNA expression washigher in strongly relaxed tumors than in nonstrongly relaxed ones(76 3.3 vs. 0.16 0.12 3 102 copy/copy b-Gus, p < 0.0025).
Discussion
For the first time, we show that gsp2 tumors containing a highlevel of Gsa mRNA (correlated with Gsa protein level) are corre-lated with smaller size and better octreotide-sensitivity. This phe-notypic correlation is similar to that shown for gsp1 tumors.Thus, not only the activating mutation11,23,24 but also the Gsaexpression level has an impact on tumoral features of somatotrophadenomas. In human embryonic kidney cells, overexpression ofGsa increases the activation of cAMP-dependent pathway as doesthe constitutively active Gsa mutant.25 The same transductionpathway activation may occur in human somatotroph adenomas.That tumors bearing high Gsa expression level or gsp oncogeneare smaller raises the question of the role played by this protein incell proliferation in human somatotroph adenomas. The constitu-tive activation of c-AMP-dependent pathway associated withincreased phosphodiesterase activity26 and the cross-talk betweenthis pathway and MAPkinase ERK1/2 signaling cascade27 could
be involved in such a paradoxical phenotype induced by gsp onco-gene or Gsa overexpression in human somatotroph tumors.
We show that loss of Gsa imprinting was specific to somatotrophtumors. Moreover, strong imprinting relaxation (�7.5%) was exclu-sively found in gsp2 tumors. In the first publication by Vallarreporting the presence of gsp oncogene in human somatotrophadenomas, a greater amount of the mutated form was found incDNA.10 This observation can now be explained by the fact that thematernal allele that bears the mutation2 remains the active allele inthis type of tumors. Consequently, most Gsa proteins were mutatedin this type of tumor. Gsa protein level was weaker in these tumorsas reported in our series and in others, probably due to an acceler-ated removal of active Gsa mutant proteins.15 In prolactinomas, noimprinting relaxation was observed in our series, except in 2 tumorsnot presenting a particular phenotype. Note that no Gsa mutationhas been reported so far in prolactinomas. These data suggest tumor-igenesis differs widely for somatotroph and lactotroph adenomas.
Some authors showed that c.T393C polymorphism could be aprognostic marker in bladder cancer,20 in colorectal cancer28 andmore recently in clear cell renal carcinoma.29 Patients with homo-zygous TT genotype showed higher Gsa expression and a more
FIGURE 5 – Methylation statusof exon 1A DMR. (a) An exampleof 2 agarose electrophoresis ofexon 1A PCR products of genomicDNA from normal lymphocytes(normal), from lymphocytes ofpatients with pseudohypoparathyr-o€ıdism type Ib (PHP1b), and frompituitary tumors (A, somatotrophadenomas, PRL, prolactinoma) af-ter digestion by HinfI. 222bp corre-sponded to noncleaved PCR frag-ment (generated from unmethy-lated strand), 131 pb, 71 pb and 20pb to the cleaved ones (generatedfrom methylated strand). The in-tensity of the 4 bands was thenquantified. The 20 pb is weaklyvisible on this gel but was takeninto count in the quantification. 1–5 columns: the plasmid obtainedfrom lymphocyte unmethylatedstrand was serially diluted in theplasmid obtained from lymphocytemethylated strand and then ampli-fied and digested by HinfI. (b) Aquantification of the 4 bands of col-umns 1–5 was performed. Theresults are expressed as the per-centage of total plasmid quantity.Linear regression was observedbetween measured and expectedvalues (r 5 0.97, p < 0.0021). (c)Table comparing the percentage ofpaternal Gsa expression to the per-centage of exon 1A DMR methyla-tion in 2 gsp1 and 6 gsp2 somato-troph in comparison with 3 lacto-troph (PRL) tumors, 3 samples ofnormal lymphocytes and 3 samplesof PHPIb lymphocytes.
1250 PICARD ET AL.

favorable clinical course than C allele carriers.20 In our series of83 tumors, the distribution of c.T393C polymorphism in pituitarytumors was similar to that in the Caucasian general population.20
Moreover, the presence of C or T on maternal allele did not signif-icantly impact Gsa expression level or Gsa imprinting relaxationof pituitary tumors (data not shown).
Gsa imprinting is under the control of imprinting control region1A DMR7,9 containing exon 1A and its promoter. A tissue-specificrepressor could bind a cis-acting regulatory element on paternal
nonmethylated promoter, leading to the inhibition of Gsa paternalexpression. In most tissues, the repressor would not be present andtherefore Gsa would be expressed biallelically.8 In our series,exon 1A expression pattern followed the Gsa imprinting relaxa-tion: exon 1A expression was lower in somatotroph than in lacto-troph tumors and in gsp- than in gsp1 ones. Moreover, exon 1AmRNA expression was lower in gsp2 tumors presenting a relaxa-tion greater than 7.5% than in ones with a lower relaxation.
It has been reported that pituitary adenomas undergo epigeneticchanges such as hypermethylation of p16, RB1 or DAPK (deathAssociated Protein Kinase).30 New molecular data showed thecritical role of hemimethylated status at exon 1A for appropriateexpression of Gsa.22,31,32 Unexpectedly, the hemimethylated sta-tus of exon 1A DMR was conserved in relaxed tumors from ourseries, suggesting another mechanism is involved in Gsa imprint-ing relaxation and in the decrease in exon 1A mRNA level.
In pseudohypoparathyro€ıdim type Ib, the loss of maternal exon 1Amethylation18,33 leads to the loss of Gsa expression in renal tubules,where Gsa is paternally silenced.18 Conversely, in mice bearing a pa-ternal exon 1A deletion, Gsa expression is increased in renal proxi-mal tubules.8 In pituitary tumors, however, the dysregulation of Gsaimprinting did not induce the expected increase in Gsa mRNAexpression. In fact, loss of exon 1A mRNA was associated notonly with the appearance of paternally derived Gsa transcriptsbut also with a coordinated decrease in maternally derived Gsatranscripts. The correlation between exon 1A and maternal Gsatranscripts suggests a common mechanism of transcriptional reg-ulation in pituitary tissue. This notion is supported by Liu et al.,7
who reported that the expression of Gsa messengers correlatedwith that of exon 1A messengers in most mouse tissues.
Histone methylation is also involved in the GNAS imprinting pro-cess; allele-specific differences in Gsa expression correlate in a tis-sue-specific manner with allele-specific differences in histone meth-ylation.34,35 Determining the methylation patterns of histone mayclarify the molecular mechanisms underlying the Gsa imprintingrelaxation of pituitary tumors, the decrease in exon 1A mRNA leveland the discordances of the present data on pituitary tumors andthose on transgenic mice. Besides the 4 transcripts of GNAS locus,an antisense paternal noncoding transcript (Nespas) that spans theupstream NESP55 region was found in mice36 and in humans (Fig.137). Recently, using transgenic mice, Williamson et al. showedthat Nespas DMR was the principal imprinting control region andfunctioned bidirectionally.21 The deletion of Nespas DMR led topartial methylation of exon 1A DMR and poor expression of exon1A, inducing a higher expression of Gsa. Even if the role of thecorresponding region in humans remains unknown, this ICR couldbe involved in GNAS imprinting relaxation in pituitary.
Unexpectedly, we found positive correlations between severaltranscripts expressed either from the same allele or from the oppo-site allele of GNAS locus. Thus, XLas mRNA, which wasexpressed from paternal allele, correlated with NESP55, which isexclusively maternally expressed. These 2 genes showed the sameexpression pattern: very low in prolactinomas, higher in somato-troph tumors. Note that this correlation was very strong. This ob-servation is consistent with the fact that NESP55 and XLas havesimilar expression profiles in other neuroendocrine tissues.38,39
More surprisingly, Gsa paternal expression also positively corre-lated with XLas mRNA expression. These correlations, whichwere confirmed by multiple analysis, may reflect several coordi-nated regulations of gene expression from GNAS locus.
In conclusion, as for gsp oncogene in gsp1 tumors, high Gsaexpression impacted the tumoral phenotype of gsp2 somatotrophadenomas and was associated with smaller size and better octreo-tide sensitivity. In our selected series of informative gsp2 tumorspresenting a strong relaxation, no features of these tumors showedthe potential involvement of Gsa imprinting relaxation in tumori-genesis: Gsa imprinting relaxation did not impact Gsa mRNAlevel, tumoral size or GH secretion. The coordinated expression ofseveral transcripts in GNAS locus reflected the complexity of the
FIGURE 6 – XLas, NESP55 and paternal Gsa expression in humanpituitary adenomas. The quantifications were performed by real-timePCR and those of paternal Gsa by allele specific real-time PCR. (a)Comparison of XLas and NESP55 mRNA expression between soma-totroph (GH) and lactotroph (PRL) adenomas. The mean values areindicated by the horizontal lines. **p < 0.0005 and *p < 0.003. (b)Positive correlation between NESP55 mRNA and XLas mRNA insomatotroph tumors (r 5 0.91, p < 0.0001). (c) Positive correlationbetween paternal Gsa expression and XLas expression in somato-troph tumors (r 5 0.69, p < 0.0002).
1251LOSS OF Gsa IMPRINTING IN PITUITARY TUMORS

GNAS regulation. The involvement of Gsa imprinting relaxationin pituitary tumorigenesis remains to be clarified.
Acknowledgements
This work was supported by the ‘‘Association pour la Recher-che sur le Cancer’’ 2001, Provence Alpes-Cotes d’Azur Region,
Oncogenetic Network of the French Ministry of Health, CNRSand Assistance Publique des Hopitaux de Marseille.
We thank Dr. JL Steinberg for help with statistical analysisand Nadine Pluchino (Laboratoire de Biochimie BiologieMol�eculaire, Conception AP-HM) for her assistance in DNAsequencing.
References
1. Weinstein LS, Chen M, Liu J. Gs(alpha) mutations and imprintingdefects in human disease. Ann N Y Acad Sci 2002;968:173–97.
2. Hayward BE, Barlier A, Korbonits M, Grossman AB, Jacquet P,Enjalbert A, Bonthron DT. Imprinting of the G(s)alpha gene GNAS1in the pathogenesis of acromegaly. J Clin Invest 2001;107:R31–R36.
3. Mantovani G, Ballare E, Giammona E, Beck-Peccoz P, Spada A. Thegsalpha gene: predominant maternal origin of transcription in humanthyroid gland and gonads. J Clin Endocrinol Metab 2002;87:4736–40.
4. Liu J, Erlichman B, Weinstein LS. The stimulatory G protein alpha-subunit Gs alpha is imprinted in human thyroid glands: implicationsfor thyroid function in pseudohypoparathyroidism types 1A and 1B.J Clin Endocrinol Metab 2003;88:4336–41.
5. Hayward BE, Kamiya M, Strain L, Moran V, Campbell R, Hayashi-zaki Y, Bonthron DT. The human GNAS1 gene is imprinted and en-codes distinct paternally and biallelically expressed G proteins. ProcNatl Acad Sci USA 1998;95:10038–43.
6. Mantovani G, Bondioni S, Locatelli M, Pedroni C, Lania AG, Fer-rante E, Filopanti M, Beck-Peccoz P, Spada A. Biallelic expression ofthe Gsalpha gene in human bone and adipose tissue. J Clin EndocrinolMetab 2004;89:6316–19.
7. Liu J, Yu S, Litman D, Chen W, Weinstein LS. Identification of amethylation imprint mark within the mouse Gnas locus. Mol Cell Biol2000;20:5808–17.
8. Liu J, Chen M, Deng C, Bourc’his D, Nealon JG, Erlichman B, BestorTH, Weinstein LS. Identification of the control region for tissue-spe-cific imprinting of the stimulatory G protein alpha-subunit. Proc NatlAcad Sci USA 2005;102:5513–18.
9. Williamson CM, Ball ST, Nottingham WT, Skinner JA, Plagge A,Turner MD, Powles N, Hough T, Papworth D, Fraser WD, Macono-chie M, Peters J. A cis-acting control region is required exclusivelyfor the tissue-specific imprinting of Gnas. Nat Genet 2004;36:894–9.
10. Landis CA, Masters SB, Spada A, Pace AM, Bourne HR, Vallar L.GTPase inhibiting mutations activate the alpha chain of Gs and stimu-late adenylyl cyclase in human pituitary tumours. Nature 1989;340:692–6.
11. Barlier A, Gunz G, Zamora AJ, Morange-Ramos I, Figarella-BrangerD, Dufour H, Enjalbert A, Jaquet P. Pronostic and therapeutic conse-quences of Gs alpha mutations in somatotroph adenomas. J ClinEndocrinol Metab 1998;83:1604–10.
12. Barlier A, Pellegrini-Bouiller I, Gunz G, Zamora AJ, Jaquet P, Enjal-bert A. Impact of gsp oncogene on the expression of genes coding forGsalpha, Pit-1, Gi2alpha, and somatostatin receptor 2 in human soma-totroph adenomas: involvement in octreotide sensitivity. J Clin Endo-crinol Metab 1999;84:2759–65.
13. Hamacher C, Brocker M, Adams EF, Lei T, Fahlbusch R, BuchfelderM, Derwahl M. Overexpression of stimulatory G protein alpha-subunit isa hallmark of most human somatotrophic pituitary tumours and is associ-ated with resistance to GH-releasing hormone. Pituitary 1998;1:13–23.
14. Farrell WE. Epigenetic mechanisms of tumorigenesis. Horm MetabRes 2005;37:361–8.
15. Ballare E, Mantovani S, Lania A, Di Blasio AM, Vallar L, Spada A.Activating mutations of the Gs alpha gene are associated with lowlevels of Gs alpha protein in growth hormone-secreting tumors. J ClinEndocrinol Metab 1998;83:4386–90.
16. Saveanu A, Lavaque E, Gunz G, Barlier A, Kim S, Taylor JE, CullerMD, Enjalbert A, Jaquet P. Demonstration of enhanced potency of achimeric somatostatin-dopamine molecule, BIM-23A387, in sup-pressing growth hormone and prolactin secretion from human pitui-tary somatotroph adenoma cells. J Clin Endocrinol Metab 2002;87:5545–52.
17. Xiong Z, Laird PW. COBRA: a sensitive and quantitative DNA meth-ylation assay. Nucleic Acids Res 1997;25:2532–4.
18. Liu J, Litman D, Rosenberg MJ, Yu S, Biesecker LG, Weinstein LS.A GNAS1 imprinting defect in pseudohypoparathyroidism type IB.J Clin Invest 2000;106:1167–74.
19. Campbell R, Gosden CM, Bonthron DT. Parental origin of tran-scription from the human GNAS1 gene. J Med Genet 1994;31:607–14.
20. Frey UH, Eisenhardt A, Lummen G, Rubben H, Jockel KH, SchmidKW, Siffert W. The T393C polymorphism of the G alpha s gene(GNAS1) is a novel prognostic marker in bladder cancer. Cancer Epi-demiol Biomarkers Prev 2005;14:871–7.
21. Williamson CM, Turner MD, Ball ST, Nottingham WT, Glenister P,Fray M, Tymowska-Lalanne Z, Plagge A, Powles-Glover N, KelseyG, Maconochie M, Peters J. Identification of an imprinting controlregion affecting the expression of all transcripts in the Gnas cluster.Nat Genet 2006;38:350–5.
22. Bastepe M, Pincus JE, Sugimoto T, Tojo K, Kanatani M, Azuma Y,Kruse K, Rosenbloom AL, Koshiyama H, Juppner H. Positional disso-ciation between the genetic mutation responsible for pseudohypopara-thyroidism type Ib and the associated methylation defect at exon A/B:evidence for a long-range regulatory element within the imprintedGNAS1 locus. Hum Mol Genet 2001;10:1231–41.
23. Adams EF, Brockmeier S, Friedmann E, Roth M, Buchfelder M, Fahl-busch R. Clinical and biochemical characteristics of acromegalicpatients harboring gsp-positive and gsp-negative pituitary tumors.Neurosurgery 1993;33:198–203; discussion 03.
24. Landis CA, Harsh G, Lyons J, Davis RL, McCormick F, Bourne HR.Clinical characteristics of acromegalic patients whose pituitary tumorscontain mutant Gs protein. J Clin Endocrinol Metab 1990;71:1416–20.
25. Yang X, Lee FY, Sr, Wand GS. Increased expression of Gs(alpha)enhances activation of the adenylyl cyclase signal transduction cas-cade. Mol Endocrinol 1997;11:1053–61.
26. Lania A, Persani L, Ballare E, Mantovani S, Losa M, Spada A. Con-stitutively active Gs alpha is associated with an increased phosphodi-esterase activity in human growth hormone-secreting adenomas.J Clin Endocrinol Metab 1998;83:1624–8.
27. Lania AG, Mantovani G, Ferrero S, Pellegrini C, Bondioni S, Pever-elli E, Braidotti P, Locatelli M, Zavanone ML, Ferrante E, Bosari S,Beck-Peccoz P, et al. Proliferation of transformed somatotroph cellsrelated to low or absent expression of protein kinase a regulatory sub-unit 1A protein. Cancer Res 2004;64:9193–8.
28. Frey UH, Alakus H, Wohlschlaeger J, Schmitz KJ, Winde G, vanCalker HG, Jockel KH, Siffert W, Schmid KW. GNAS1 T393C poly-morphism and survival in patients with sporadic colorectal cancer.Clin Cancer Res 2005;11:5071–7.
29. Frey UH, Lummen G, Jager T, Jockel KH, Schmid KW, Rubben H,Muller N, Siffert W, Eisenhardt A. The GNAS1 T393C polymor-phism predicts survival in patients with clear cell renal cell carci-noma. Clin Cancer Res 2006;12:759–63.
30. Farrell WE, Clayton RN. Epigenetic change in pituitary tumorigene-sis. Endocr Relat Cancer 2003;10:323–30.
31. Bastepe M, Frohlich LF, Linglart A, Abu-Zahra HS, Tojo K, WardLM, Juppner H. Deletion of the NESP55 differentially methylatedregion causes loss of maternal GNAS imprints and pseudohypopara-thyroidism type Ib. Nat Genet 2005;37:25–7.
32. Linglart A, Gensure RC, Olney RC, Juppner H, Bastepe M. A novelSTX16 deletion in autosomal dominant pseudohypoparathyroidismtype Ib redefines the boundaries of a cis-acting imprinting control ele-ment of GNAS. Am J Hum Genet 2005;76:804–14.
33. Bastepe M, Frohlich LF, Hendy GN, Indridason OS, Josse RG, Kosh-iyama H, Korkko J, Nakamoto JM, Rosenbloom AL, Slyper AH,Sugimoto T, Tsatsoulis A, et al. Autosomal dominant pseudohypopar-athyroidism type Ib is associated with a heterozygous microdeletionthat likely disrupts a putative imprinting control element of GNAS.J Clin Invest 2003;112:1255–63.
34. Sakamoto A, Liu J, Greene A, Chen M, Weinstein LS. Tissue-specificimprinting of the G protein Gsalpha is associated with tissue-specific dif-ferences in histone methylation. HumMol Genet 2004;13:819–28.
35. Li T, Vu TH, Ulaner GA, Yang Y, Hu JF, Hoffman AR. Activatingand silencing histone modifications form independent allelic switchregions in the imprinted Gnas gene. Hum Mol Genet 2004;13:741–50.
36. Wroe SF, Kelsey G, Skinner JA, Bodle D, Ball ST, Beechey CV,Peters J, Williamson CM. An imprinted transcript, antisense to Nesp,adds complexity to the cluster of imprinted genes at the mouse Gnaslocus. Proc Natl Acad Sci USA 2000;97:3342–6.
37. Hayward BE, Bonthron DT. An imprinted antisense transcript at thehuman GNAS1 locus. Hum Mol Genet 2000;9:835–41.
38. Ischia R, Lovisetti-Scamihorn P, Hogue-Angeletti R, WolkersdorferM, Winkler H, Fischer-Colbrie R. Molecular cloning and characteriza-tion of NESP55, a novel chromogranin-like precursor of a peptide with5-HT1B receptor antagonist activity. J Biol Chem 1997;272: 11657–62.
39. Kehlenbach RH, Matthey J, Huttner WB. XL alpha s is a new type ofG protein. Nature 1994;372:804–9.
1252 PICARD ET AL.