gsp guidelines for sharing national data/information to ... · gsp guidelines for sharing national...
TRANSCRIPT
GSP Guidelines for sharing national
data/information to compile a Global
Soil Organic Carbon (GSOC) map
Pillar 4 Working Group
Version 1
01 February 2017

Table of Contents Summary ................................................................................................................................................. 1
Overview GSOC map specifications ....................................................................................................... 2
Part I: Background and task .............................................................................................................. 3
1. Improving global soil carbon information through the Global Soil Partnership ...................... 3
2. Request for soil carbon mapping ............................................................................................... 3
Part II: Functions of soil carbon and the role of soil carbon mapping .............................................. 4
3. The importance of soil carbon ................................................................................................... 4
4. Improvement of data on SOC ..................................................................................................... 4
5. Objectives for soil carbon mapping ........................................................................................... 5
5.1 Global SOC map ................................................................................................................... 5
5.2 Map components ................................................................................................................ 6
5.3 Compatibility with other specifications and guidelines ...................................................... 7
6. Benefits ....................................................................................................................................... 7
7. Definitions ................................................................................................................................... 8
7.1 Soil Carbon in UNFCCC reporting ........................................................................................ 8
7.2 Generic definition of SOC and SOM from literature ......................................................... 10
Part III: Specifications for soil organic carbon mapping ............................................................... 11
8. Specifications for the global SOC map ...................................................................................... 11
8.1 Generic target specification .............................................................................................. 11
8.2 Country-driven action........................................................................................................ 11
8.3 The GSP community of practice ........................................................................................ 12
8.4 Detailed specifications and metadata ............................................................................... 12
8.5 Data security ...................................................................................................................... 19
8.6 Data sharing procedure ..................................................................................................... 19
9. Procedures, tasks, roadmap ...................................................................................................... 19
9.1 Road map for GSP secretariat activities ............................................................................ 19
Annex 1: Previous SOC mapping ...................................................................................................... 20
A1.1 Global SOC estimates and the Harmonized World Soil Database (FAO/IIASA/ISRIC/JRC/CAS
2006) 20
A1.2 Continental SOC maps based on point measurements ......................................................... 20
Annex 2: Cookbook for soil organic carbon mapping ..................................................................... 23

1
Summary
This document provides definitions and guidance for the global soil carbon mapping activity which the
Global Soil Partnership (GSP) and Intergovernmental Technical Panel on Soils (ITPS) committed to un-
dertake in the framework of its cooperation with the United Nations Convention to Combat Desertifi-
cation (UNCCD) and its Science Policy Interface (SPI).
The GSP partners are engaging in a global soil organic carbon (GSOC) mapping activity, which is pri-
marily based on existing soil carbon maps and measurements. A GSOC map will be produced based on
existing national soil carbon data. This activity is closely linked to the development of the Global Soil
Information System under GSP Pillar 4 to enhance the quantity and quality of soil data and information.
Due to the urgency for action and the envisaged cooperation across United Nations (UN) conventions
as a contribution to the sustainable development goals (SDGs), this activity is pursued with high prior-
ity.
This document provides background and detailed specifications about the required data sources and
methodologies.
2
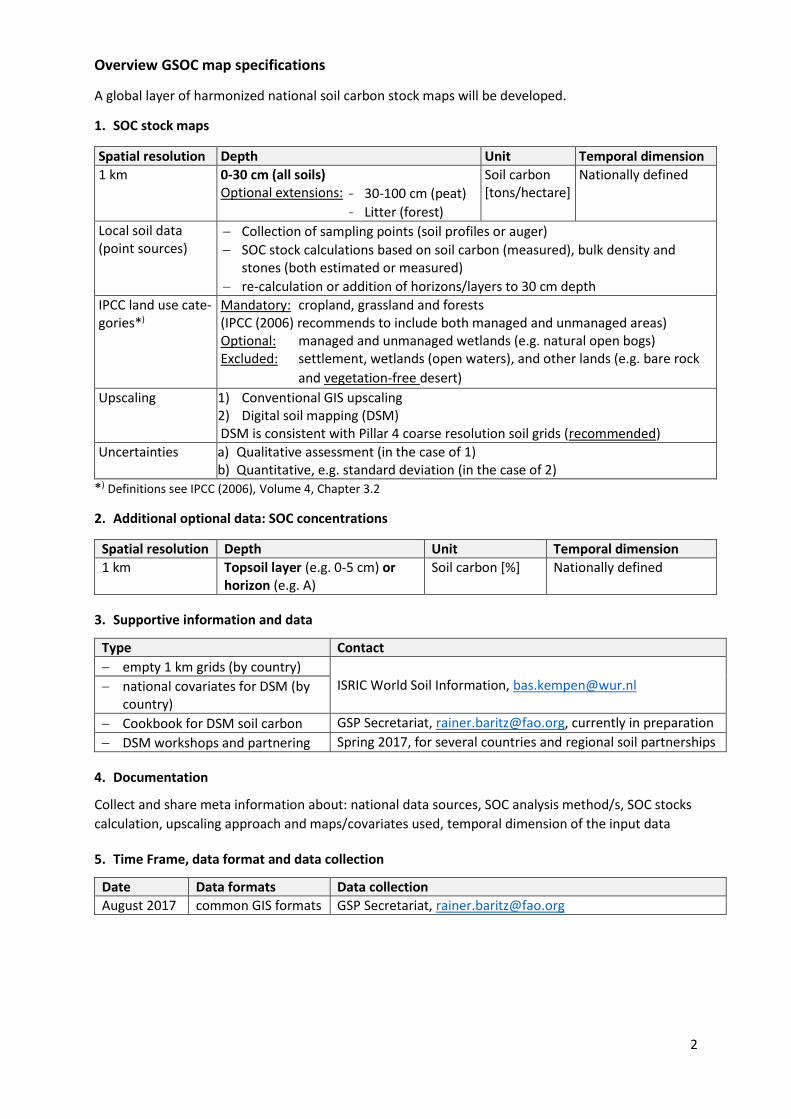
Overview GSOC map specifications
A global layer of harmonized national soil carbon stock maps will be developed.
1. SOC stock maps
Spatial resolution Depth Unit Temporal dimension
1 km 0-30 cm (all soils) Optional extensions:
30-100 cm (peat)
Litter (forest)
Soil carbon [tons/hectare]
Nationally defined
Local soil data (point sources)
Collection of sampling points (soil profiles or auger)
SOC stock calculations based on soil carbon (measured), bulk density and stones (both estimated or measured)
re-calculation or addition of horizons/layers to 30 cm depth
IPCC land use cate-gories*)
Mandatory: cropland, grassland and forests (IPCC (2006) recommends to include both managed and unmanaged areas) Optional: managed and unmanaged wetlands (e.g. natural open bogs) Excluded: settlement, wetlands (open waters), and other lands (e.g. bare rock
and vegetation-free desert)
Upscaling 1) Conventional GIS upscaling 2) Digital soil mapping (DSM) DSM is consistent with Pillar 4 coarse resolution soil grids (recommended)
Uncertainties a) Qualitative assessment (in the case of 1) b) Quantitative, e.g. standard deviation (in the case of 2)
*) Definitions see IPCC (2006), Volume 4, Chapter 3.2
2. Additional optional data: SOC concentrations
Spatial resolution Depth Unit Temporal dimension
1 km Topsoil layer (e.g. 0-5 cm) or horizon (e.g. A)
Soil carbon [%] Nationally defined
3. Supportive information and data
Type Contact
empty 1 km grids (by country) ISRIC World Soil Information, [email protected] national covariates for DSM (by
country)
Cookbook for DSM soil carbon GSP Secretariat, [email protected], currently in preparation
DSM workshops and partnering Spring 2017, for several countries and regional soil partnerships
4. Documentation
Collect and share meta information about: national data sources, SOC analysis method/s, SOC stocks
calculation, upscaling approach and maps/covariates used, temporal dimension of the input data
5. Time Frame, data format and data collection
Date Data formats Data collection
August 2017 common GIS formats GSP Secretariat, [email protected]

3
Part I: Background and task
1. Improving global soil carbon information through the Global Soil Partnership
The Global Soil Partnership (GSP) cooperates very closely with various global mechanisms which ad-
dress soil issues and which require improved information collection and sharing about the status of
soils. This cooperation is important because FAO member countries are involved in various global ac-
tivities through monitoring and reporting on natural resources, including soils, and it is import to align
these activities to improve knowledge and information exchange about soils. The quality of soil carbon
information at global level is still limited because much existing national information has not yet been
shared for global compilation. A precise and reliable global view on soil organic carbon (SOC) is needed
under different UN conventions, such as on climate change and desertification, but especially as part
of the Sustainable Development Goals (SDG). For example, under the Framework Convention on Cli-
mate Change (UNFCCC), countries address soils and soil carbon in their national greenhouse gas inven-
tories. Under the Lima-Paris Action Agenda, the 4 per 1000 Initiative supports the role of carbon stor-
age in soils to mitigate and adapt to climate change. To assess the amount of degraded land under
sustainable development goal (SDG) 15.3.1, soil carbon is an important component under the sub-
indicator on above and below ground carbon.
2. Request for soil carbon mapping
The GSP is currently tasked to provide support on soil carbon issues. FAO and the GSP Secretariat were
recently approached by the United Nations Convention to Combat Desertification (UNCCD) Secretariat
to share information about the GSP and the possible pathways to contribute to improving soil carbon
knowledge and data. During the 5th Session of the GSP’s Intergovernmental Technical Panel on Soils
(ITPS) held during March 2016 (link), collaboration between ITPS and the Science Policy Interface (SPI)
of the UNCCD, the Intergovernmental Platform on Biodiversity and Ecosystem Services (IPBES), and
the Intergovernmental Panel on Climate Change (IPCC) was discussed. GSP/ITPS were requested to
conduct a global SOC assessment based on country-level spatial soil data sets, combined to a new
global SOC map. As an action of the GSP and its members, this task would directly relate to SDG 15.3.1,
and would also support the endorsed metrics for the assessment of land degradation neutrality (LDN).
The issue of soil carbon mapping through the GSP was also discussed and supported during the 4th GSP
Plenary Assembly, May 2016 (link).
The Global Soil Partnership has been requested to develop
a global soil organic carbon map by 2017.

4
Part II: Functions of soil carbon and the role of soil carbon mapping
3. The importance of soil carbon
Soil organic matter (SOM) is composed of about 58% carbon and is a crucial soil component which
affects most of the processes relevant to soil functions and food production. Changing SOM (and hence
SOC) affects the capacity of soils to buffer against environmental change and changes the provision of
ecosystem services required for crop production. SOM therefore regulates the resilience of the agri-
cultural system to climate change.
SOC has received great attention during the development of the greenhouse gas (GHG) reporting pro-
gramme of the IPCC since the mid-nineties. This was done to address the contribution of intensive land
management and the vast amount of degraded land to GHG emissions, since these have caused tre-
mendous historic losses of SOC, resulting in high potentials for future carbon storage. Recently, an
increasing number of authors have stressed the crucial role of healthy soils, with soil carbon being the
most important indicator, for food security and resilience against climate change. Hence, above- and
belowground carbon (SOC) became sub-indicators for SDG target 15.3.1 (degraded land).
The 2015 Status of the World’s Soil Resources (SWRS) report1 highlights that, although more carbon is
stored in soil than in the atmosphere and plant life combined, a large portion (33%) of the world’s soils
are degraded and organic matter has been lost. The reversal of soil degradation through the build-up
of SOM and the sustainable management of soils therefore offers large potential to contribute to cli-
mate change mitigation by sequestering atmospheric carbon into the soil. In addition, this process
would increase the capacity of soils to buffer against climate change which, in turn, would improve the
resilience of agricultural systems to climate change.
4. Improvement of data on SOC
Despite the attention given to SOC, as described above, knowledge about SOC baselines and changes,
and the detection of vulnerable hot spots for SOC losses and gains under climate change and changed
land management is still fairly limited. Accurate baselines are still missing for many countries, and es-
timates about the role of soils in the global carbon cycle are still only based on rough estimates with
large uncertainties. Global SOC estimates exist, but there is high variability in reported values among
authors, caused by the diversity of different data sources and methodologies (Henry et al., 2009)2.
Despite these existing data sources, the size and dynamics of the global SOC pool is still fairly uncertain.
Currently, countries report greenhouse gas (GHG) emissions under the UNFCCC and the Kyoto Proto-
col; it is optional to include reporting on SOC (other C pools are litter, dead organic matter, above- and
belowground biomass) in addition to land-use change and emissions from organic soils. Currently, few
countries report on SOC. In addition to GHG inventories, UNFCCC has prepared guidelines for carbon
accounting in Clean Development Mechanism (CDM) projects. However, due to difficulties in harmo-
nizing sampling, measurements and accounting for SOC change, very often no-change is assumed for
SOC, thus no data are reported. It is likely that, due to the increasing importance of SOC for the global
terrestrial GHG cycle, countries have increased interest (and may reach respective agreements in fu-
ture UNFCCC negotiations) to improve reporting on SOC pools. This is especially true because there
are large carbon storage potentials created by unsustainable management, land-use change and land
degradation; increasing SOC levels also improve the resilience of soils to climate change effects (e.g.
drought; increased SOC improves various soil functions including water holding capacity and nutrient
1 ITPS. 2015. Status of the World’s Soil Resources Report. 2 Henry, M., R. Valentini and M. Bernoux (2009). Soil carbon stocks in ecoregions of Africa. Biogeosciences Dis-cuss. 6: 797–823.

5
availability). Efforts to increase SOC by increasing organic matter levels in soils require baseline data
(location of degraded sites, hot spots for restoration) in order to plan action on the ground, and mon-
itoring in order to verify that the intended effects are achieved. In order to estimate baselines and
changes of SOC per land area, very often in GHG inventories, typical values for soils under certain land
use are used (Tier 1 and Tier 2; see below). However, this is still very coarse, and many scientists warn
that this approach would not provide reliable estimates of SOC changes after land use change. It is
thus recommended to improve the knowledge about SOC through the development of a high-resolu-
tion spatial assessment of SOC as a baseline.
With regard to existing national SOC estimates, Henry et al. (2009) conclude that the quality of spatial
estimates of SOC3 largely depends on number of soil profiles, the quality and resolution of soil maps,
and the quality of data available to derive carbon stocks; besides SOC concentration, it requires the
soil bulk density, and the amount/proportion of coarse fragments [rock/stone content]. They also ad-
vise to use soil maps with the highest resolution possible.
5. Objectives for soil carbon mapping
5.1 Global SOC map
GSP members will jointly develop a global SOC map as a baseline for the amount and distribution of
SOC in soils around the world. This map will be developed following the general GSP principle of being
a country-driven initiative. It will be part of the process to build a Global Soil Information System under
GSP Pillar 4 (Enhance the quantity and quality of soil data and information: data collection [genera-
tion], analysis, validation, reporting, monitoring and integration with other disciplines). The endeavor
will further consider the following aspects:
- Definitions relating to SOC and SOC change elaborated from the IPCC definitions
- GSP data sharing mechanisms
- Quality assured, harmonized and validated data sets, which may become officially shared as
the nationally representative SOC data
This concept builds on official national data sets, therefore, a bottom-up (country-driven) approach is
pursued which offers a new quality to the future global assessment of soil indicators.
3 (amount of C per area, based on a mapping of SOC for a defined area)

6
5.2 Map components The new global soil carbon map will have the following product components:
Product Abbrev. Depth Description (see Part 3, Chapter 8 for details)
Map of global SOC stocks
1 km resolu-tion
SOCstock
0-30 cm depth (man-datory)
Forests (optional): Litter layer
Peat (optional): 30 – peat depth (< 100 cm) (optional)
Depth class 0-30 cm: in addition, sub-divisions in thinner depth slices, or extensions beyond 30 cm depth are acceptable, depending on national sam-pling strategies and available data.
In the case of forests, the litter layer may be in-cluded if national data allow. There are two op-tions: 1. A separate model/map for the forest floor or-
ganic layer (L, F and H) is produced (see also section 7.1 b), and later added to the national SOC stocks 0-30 cm.
2. Forest floor carbon stocks are modelled jointly with the mineral SOC stocks 0-30.
Peat: 0-30 cm is the mandatory mapping depth; a second layer with SOC stocks between 30 cm and up to 1 m depending on peat depth is recom-mended.
Calculation of C stocks requires data about the SOC concentration, bulk density and – for non-or-ganic soils - stone content
Uncertainties SD
c) Qualitative assess-ment
d) Quantitative, e.g. standard deviation
a) Based on reported metadata and documentation.
b) If digital soil mapping is used, the spatial predic-tion error can be quantified depending on the density of soil profiles/samples
The following optional by-product to the national SOCstocks map may be produced:
Product Abbrev. Specifications Description
Map of top-soil SOC con-centrations
SOCconc
Uppermost layer or horizon
1 km resolution
Because SOC concentrations are input data for SOC stock calculations, it may be little additional effort to produce a national SOC concentrations map.
SOC concentrations for the uppermost layer or horizon shall be used (e.g. 0-5 cm, or A horizon, etc.).
The following three procedural steps are foreseen:
1. Countries may share existing national SOC maps
2. Should national SOC maps not exist or not conform to the specifications, countries may produce
national SOC maps initiated by this project
3. Should countries not have the capacity to produce national SOC maps, they may elect to share orig-
inal SOC measurements (point samples such as soil profiles) with the GSP Secretariat which will
organize the production of the national SOC map in close consultation with the country represent-
atives.

7
5.3 Compatibility with other specifications and guidelines
It has to be ensured that the GSP objectives are considered when building a grid-enabled spatial data
infrastructure for soils (Pillar 4, version 0 and version 1 soil grids) and that the product specifications
are compatible with other spatial thematic layers shared under the Global Earth Observation System
of Systems (GEOSS), United Nations Spatial Data Infrastructure (UNSDI), and others such as the new
framework for SDG indicator assessments.
The specifications for this product do not only comply with IPCC specifications (in order to fit national
GHG reporting efforts and thus to use synergistic effects with existing activities), they also consider the
Global Soil Map (GSM) specifications. Under GSM, six standard depth intervals of 0-5 cm, 5-15 cm, 15-
30 cm, 30-60 cm, 60-100 cm and 100-200 cm are recommended. Thus, the 0-30 cm depth class for this
global SOC map could be derived by adding the three uppermost depth classes. If digital soil mapping
is applied for SOC mapping (see also Ch. 8.4.4), the GSM specifications can be directly applied as a
further detailed technical specification for SOC mapping. The GSM specifications are also recom-
mended for use in GSP Pillar 4.
6. Benefits
The development of a global SOC map according to this guideline provides and builds on synergies with
ongoing and new reporting needs and data sharing obligations and therefore benefits activities at na-
tional, regional and global levels to:
Enable training for countries in need of technical support (e.g. regarding the collection, sta-
tistical evaluation and modelling of SOC data)
Develop data to update the SWRS report on SOC through a country-driven baseline, and to
initiate future assessments of SOC change
Support national GHG reporting: develop a valid, measurement-based inventory of reference
SOC stocks for IPCC-Tier 2 assessments (see Chapters 4 and 7)
Further utilize SOC mapping to estimate the soil carbon sequestration potentials (e.g.
through modeling) and the vulnerability of soil functions under climate change (with SOC as
indicator)
Contribute to the Sustainable Development Goals: to develop national SDG-15.3.1 Tier 3
data for the sub-indicator of soil carbon
Conduct harmonized assessments at different levels of action: GSP regional soil partnerships:
FAO regional and country offices, national soil information institutions (GSP Pillar 4 INSII), na-
tional statistics offices (already involved with FAOSTATs), and GEOSS design principles for
global data layers.
8
7. Definitions
7.1 Soil Carbon in UNFCCC reporting
a) Terrestrial carbon pools and reporting methods for UNFCCC greenhouse gas inventories, follow-
ing IPCC guidelines
IPCC (2006)4 defines different terrestrial carbon pools, including carbon stocks in mineral (inorganic)
and organic soils, focusing on carbon stock changes over a reporting period. Thus it has established
definitions to monitor soil carbon as agreed by reporting countries. This framework can provide guiding
principles for global SOC mapping by the GSP because (a) a SOC map allows the derivation of basic
national default values for SOC, and (b) the new global SOC map could serve as a baseline for future
assessments about SOC changes (monitoring, see also: SWRS report).
IPCC (2006) provides methods to estimate greenhouse gas emissions and removals in the Agriculture,
Forestry and Other Land Use (AFOLU) sectors. It includes the reporting of carbon stock changes for five
terrestrial storage pools by land-use category (Forest Land, Cropland, Grassland, Wetlands, Settle-
ments, and Other Land). The carbon pools are: above-ground biomass, below-ground biomass, dead-
wood, litter, and soils. Carbon stock changes are estimated for strata or subdivisions of land area (e.g.,
climate zone, ecotype, soil type, management regime etc.).
Two general approaches for reporting carbon stocks and changes are suggested:
1. Process-based approach: estimates the net balance of additions to and removals from a car-
bon stock (Gain-Loss Method5)
2. Stock-based approach: estimates the difference in carbon stocks at two points in time (Stock-
Difference Method)
The Gain-Loss Method is based on knowledge about a typical carbon stock (baseline) for a certain land
use: the area of land category is multiplied with an annual C-stock gain or loss, or baseline default
values are multiplied with a stock change factor (e.g. emission factor after management change or land
use conversion). The stock-difference method relies on the difference of SOC estimates at two points
in time.
IPCC (2006) distinguishes three Tiers for reporting greenhouse gas emission. The tier structure is hier-
archical, with higher tiers implying increased accuracy of the method and/or emissions factor and other
parameters used in the estimation of the emissions and removals.
Tier-1 methods apply generic default values and emission factors from literature. It includes several
simplifying assumptions, e.g. dead wood and litter are often lumped together as ‘dead organic matter’,
and its net stock change is zero (except for land use change; default values for the dead organic matter
pool for forests are provided). For Tier 1 and 2 methods, soil organic C stocks for mineral soils are
computed to a default depth of 30 cm. Greater depths may be selected and used if data are available
(Tier 2 and Tier 3).
While the above-mentioned approaches are valid for terrestrial carbon pools and its changes, IPCC
guidelines also include non-CO2 greenhouse gases (N2O and CH4). In these cases, emission rates from
a source directly to the atmosphere are used (e.g. N2O from soils after fertilization).
4 IPCC (2006). IPCC Guidelines for National Greenhouse Gas Inventories. Volume 4. Agriculture, Forestry and Other Land Use. Prepared by the National Greenhouse Gas Inventories Programme, Eggleston H.S., Buendia L., Miwa K., Ngara T. and Tanabe K. (eds). Published: IGES, Japan. 5 Gains and losses specify the transfer rate of carbon from one pool to another (e.g. from the above-ground biomass pool top the dead wood and litter pools)

9
b) IPCC definition of SOC
The soil carbon pool includes organic carbon in mineral and organic soils (including peat) to a specified
depth chosen by the country (IPCC 20064). However, the default soil depth is 30 cm, and guidance on
determining country-specific depths is given in Chapter 2.3.3.1 of IPCC (2006)4. However, “it is good
practice to derive reference C stocks to a greater depth if there is sufficient data, and if it is clear that
land-use change and management have a significant impact over the proposed depth increment”.
Litter, which belongs to the dead organic matter pool, “ïncludes all non-living biomass with a size
greater than the limit for soil organic matter (suggested 2 mm) and less than the minimum diameter
chosen for dead wood (e.g. 10 cm), lying dead, in various states of decomposition6 above or within the
mineral or organic soil. This includes the litter layer as usually defined in soil typologies” (IPCC 20064).
Anaerobic soils (organic soils) may have a litter layer on top of peat. However, there, GHG reporting is
not based on SOC stock changes but on emission factors.
The GSOC mapping campaign will – in order to be consistent with national UNFCCC definitions – also
include litter (forest floor organic layer). Metadata provided by the countries need to specify national
definitions of SOC (depth class, mineral soil, litter in the case of forests, organic and inorganic carbon,
shallow peat etc.).
c) Reference carbon stocks
Country-specific reference C stocks can improve GHG inventories (Tier 2) by being more accurate and
representative. According to IPCC (2006), country-specific reference soil C stocks may be derived from
measurements of soils, “for example, as part of a country’s soil survey. It is important that reliable
taxonomic descriptions be used to group soils into categories. There are three additional considerations
in deriving the country-specific values, including possible specification of country-specific soil categories
and climate regions (i.e., instead of using the IPCC default classification), choice of reference condition,
and depth increment over which the stocks are estimated.
It has to be noted that IPCC (2006) reference SOC stocks refer to the natural equilibrium state under
non-degraded, unimproved land under native vegetation. Such data are difficult to generate espe-
cially for land areas with a long land-use history. In the reporting practice, this concept is mixed with
the definition of a baseline based on the reference year of a national soil inventory, or an average
value for the time range involved with a large-scale soil inventory or legacy soil data base7.
The GSOC mapping campaign will generate a spatially-explicit assessment of SOC (and Litter) refer-
ence values, harmonized across the globe according to IPCC definitions. The national maps will be
produced based on the best-available soil analytical data. The spatial assessment will improve not
only the global SOC stock estimate (relevant for the global C cycle), it will also quantify SOC change
spatially-consistent in relation to the matrix of the land-use categories; thus allow to quantify con-
sistent transfer rates of SOC after land-use change.
6 IPCC (2003) has referred to litter, fumic, and humic layers. This is further specified in section 3.2.1.3 (Forest soils): the litter pool of aerobic soils may include L, F, and H horizons (litter, fermentation, humus) of the forest floor organic layer. 7 i.e. soil data base (soil profile descriptions, soil analysis) collected over survey periods which lay in the past.

10
d) Experiences with SOC mapping according to IPCC
The current reporting practice for LULUCF (Land use, Land-Use Change and Forestry) in Europe was
recently evaluated by Blujdea et al. (2016)8. Twelve European Union (EU) member states report on
SOC in forests using a Tier 3 approach, five countries use models (gain-loss), and seven countries use
inventories (stock-based). In most cases, forest SOC maps were very likely produced in order to quan-
tify and project the SOC stock assessment for the whole country. As for grassland/cropland, 20 coun-
tries have been reporting according to Tier 2 specifications.
This project and the corresponding actions at national level will develop improved spatial SOC assess-
ments for all land uses.
7.2 Generic definition of SOC and SOM from literature
SOM definition: Soil organic matter (SOM) is the fraction of the soil that consists of plant or animal
tissue in various stages of decomposition. SOM is made up of different components that can be
grouped into three major types: (1) Plant residues and living microbial biomass, (2) Active soil organic
matter also referred to as detritus, and (3) Stable soil organic matter, often referred to as humus. The
major chemical element present in SOM is carbon bound in various organic compounds which is com-
monly referred to as SOC. If the analytical method determines total carbon, then, for calcareous soils,
the mineral carbon content needs to be determined and subtracted in order to avoid overestimations
of SOC.
Relationship between SOC and SOM: Although the content of carbon in SOM may vary, on average
SOM contains about 58% of carbon (Van Bemmelen factor: 1.724). For organic horizons (forest floor,
peat), values may significantly differ (see also Nelson and Sommers, 19829, who provide ranges of 1.9
– 2.5 for soil horizons rich in SOM). With decreasing levels of humification, the conversion factor ap-
proaches 2 (e.g. F horizons of the forest floor).
A generic definition and description of SOC and SOM is also contained in IPCC, 2006 (Ch. 1.2.1, Sci-
ence Background). The definition provides deeper insight into the processes that lead to gains and
losses of SOC in soils.
8 Blujdea, V.N.B., R. A. Viñas, S. Federici and G. Grassi (2016): The EU greenhouse gas inventory for the LULUCF sector: I. Overview and comparative analysis of methods used by EU member states, Carbon Management, DOI: 10.1080/17583004.2016.1151504 9 Nelson, D. W. & Sommers, L. E. (19821. Total carbon, organic carbon, and organic matter. In Methods" of Soil Analysis, Part 2, ed. A. L. Page. Agronomy No. 9, Monograph Series, American Society of Agronomy, Madison, Wis., pp. 539-79.

11
Part III: Specifications for soil organic carbon mapping
8. Specifications for the global SOC map
8.1 Generic target specification
Grid 1x1 km (generic grid will be provided and higher resolutions are acceptable)
Various SOC analysis methods and measurements are acceptable
0-30 cm depth, including national increments and/or higher (deeper) depths where applica-
ble
SOC stock [t/ha]: bulk density (BD) [kg/m3] and stone content [%] can be estimated or meas-
ured
Mapping/upscaling: various approaches possible (including country-specific stratification and
custom resolution finer than 1x1 km)
8.2 Country-driven action
The following three basic approaches for the voluntary sharing of national SOC data are possible,
based on country data availability and capacity:
1. Compile existing national SOC maps
Should countries already have national SOC maps which meet the specifications of this project,
these may be shared for this global SOC mapping project. If a national SOC map exists, and if
not all requirements are met, adjustments of the existing SOC map may be implemented if this
is possible (e.g. recalculation according to target depth). Any other relevant national infor-
mation about SOC-related evaluations, calculations and reports (e.g. SOC in UNFCCC report-
ing), shall be shared with the GSP secretariat as meta information. This includes methodolog-
ical information (e.g. distribution of soil profiles; upscaling method) in order to allow an un-
certainty assessment.
National SOC map exists
YesNo
GSP specifications are fulfilled
Yes No
recalculate
Product accomplished: deliver to GSP secretariat
Produce new map with own capacity
Compile national SOC measurements
Yes No
Share national SOC data with GSP secretariat to organise
the uscaling to 1 km grid
Yes
1
2
3

12
In countries where national SOC maps are not available or existing SOC maps do not meet
the specifications, refer to approach 2:
2. Countries may develop new or updated SOC maps
Countries which do not yet have a national SOC map, may develop such a map based on the
specifications recommended here (see also Annex 2, Cookbook for SOC mapping, to be sup-
plemented later). As mentioned under Ch. 6 (Benefits), and similar to approach 1, this would
enable countries to derive national IPCC default values for SOC (i.e. typical SOC values for soil
types, soil-climate-land cover types, or other stratification). Where needed, FAO, with the help
of its national and regional offices, will attempt to bilaterally support such national activities.
If the in-country development of a SOC map is not possible (perhaps due to insufficient ca-
pacity), refer to approach 3:
3. Countries are encouraged to share original national SOC measurements (point-locations:
soil profiles or auger sampling) with the GSP secretariat
Typically, the measurement of SOC requires the sampling of soils in the field at a certain loca-
tion (“point data” compared to map data, presented in the form of polygon maps or grids). In
order to allow for a national SOC map, such point data require upscaling. Where no national
capacity exists to conduct such an upscaling exercise, the original SOC measurements may be
shared with the GSP secretariat which would then execute the upscaling in close cooperation
with the national GSP-focal points and/or institutional data providers. Countries may decide
whether shared soil profile data may enter the GSP Pillar 4 Tier 1 and/or Tier 2 soil profile
databases or not.
If there are countries with a complete lack of SOC measurements, a sampling campaign may be con-
ducted in representative soil types under typical land use. Due to the limited time available to produce
the global SOC map, however, this cannot be done in a sufficiently representative manner.
8.3 The GSP community of practice
The GSP represents a wide community of practice10 including 135 official country representatives and
225 members from non-governmental organisations. Well-aligned action in nine regional partnerships
covers a wide variety of soil-related topics across the globe. To build the Global Soil Information System
(GSP Pillar 4), an international network of soil information institutions (INSII) has been established.
This network is still in its starting phase and is continuously growing (currently consisting of 60 coun-
tries/institutions). It will allow the exchange of new, harmonized national data as part of new global
data sets including soil profile data, soil polygon maps, soil property grids and the monitoring of indi-
cators (SoilSTAT). The GSP (Pillar 4) and INSII are the facilities through which the task of a global SOC
map can be developed. The development of the Global Soil Information System, including soil moni-
toring, is accompanied and advised by the ITPS.
8.4 Detailed specifications and metadata
The following specifications provide an overview of the methods to be used to determine SOC stocks
and develop SOC maps. The project will allow for all given national modifications (definitions, methods,
resolutions) even though this may introduce a significant portion of bias for the global assessment.
10 Soil researchers, soil inventory experts, politicians, farmers, agricultural industry, education
13
Data will be shared and extensively documented to enable quality and uncertainty assessments. This
will allow insights into the quality of the SOC maps, remaining gaps and harmonization needs.
The specifications listed below may provide guidance to those countries lacking previous SOC assess-
ments, but also guide the documentation of the national methodologies. A template will be included
in the cookbook for SOC mapping (Annex 2; to be provided later).
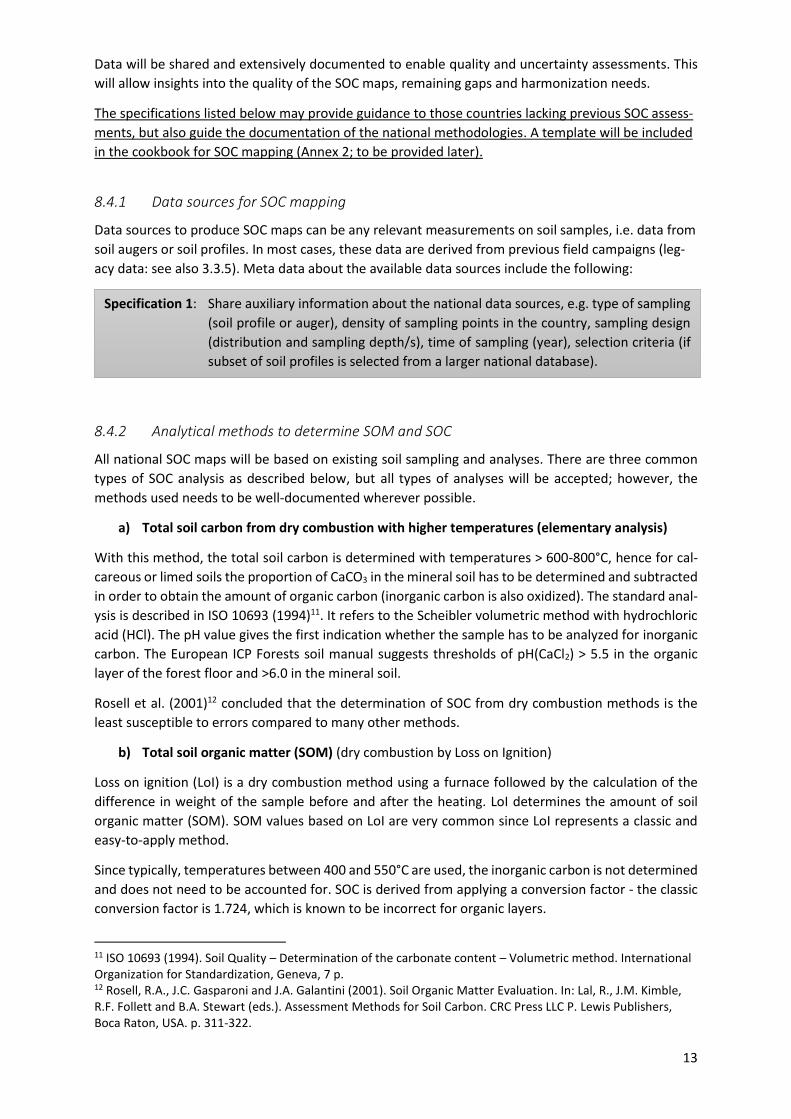
8.4.1 Data sources for SOC mapping
Data sources to produce SOC maps can be any relevant measurements on soil samples, i.e. data from
soil augers or soil profiles. In most cases, these data are derived from previous field campaigns (leg-
acy data: see also 3.3.5). Meta data about the available data sources include the following:
8.4.2 Analytical methods to determine SOM and SOC
All national SOC maps will be based on existing soil sampling and analyses. There are three common
types of SOC analysis as described below, but all types of analyses will be accepted; however, the
methods used needs to be well-documented wherever possible.
a) Total soil carbon from dry combustion with higher temperatures (elementary analysis)
With this method, the total soil carbon is determined with temperatures > 600-800°C, hence for cal-
careous or limed soils the proportion of CaCO3 in the mineral soil has to be determined and subtracted
in order to obtain the amount of organic carbon (inorganic carbon is also oxidized). The standard anal-
ysis is described in ISO 10693 (1994)11. It refers to the Scheibler volumetric method with hydrochloric
acid (HCl). The pH value gives the first indication whether the sample has to be analyzed for inorganic
carbon. The European ICP Forests soil manual suggests thresholds of pH(CaCl2) > 5.5 in the organic
layer of the forest floor and >6.0 in the mineral soil.
Rosell et al. (2001)12 concluded that the determination of SOC from dry combustion methods is the
least susceptible to errors compared to many other methods.
b) Total soil organic matter (SOM) (dry combustion by Loss on Ignition)
Loss on ignition (LoI) is a dry combustion method using a furnace followed by the calculation of the
difference in weight of the sample before and after the heating. LoI determines the amount of soil
organic matter (SOM). SOM values based on LoI are very common since LoI represents a classic and
easy-to-apply method.
Since typically, temperatures between 400 and 550°C are used, the inorganic carbon is not determined
and does not need to be accounted for. SOC is derived from applying a conversion factor - the classic
conversion factor is 1.724, which is known to be incorrect for organic layers.
11 ISO 10693 (1994). Soil Quality – Determination of the carbonate content – Volumetric method. International Organization for Standardization, Geneva, 7 p. 12 Rosell, R.A., J.C. Gasparoni and J.A. Galantini (2001). Soil Organic Matter Evaluation. In: Lal, R., J.M. Kimble, R.F. Follett and B.A. Stewart (eds.). Assessment Methods for Soil Carbon. CRC Press LLC P. Lewis Publishers, Boca Raton, USA. p. 311-322.
Specification 1: Share auxiliary information about the national data sources, e.g. type of sampling
(soil profile or auger), density of sampling points in the country, sampling design
(distribution and sampling depth/s), time of sampling (year), selection criteria (if
subset of soil profiles is selected from a larger national database).
14
c) SOC from wet oxidation
Organic carbon is obtained after oxidation with a dichromate-sulfuric acid mixture. The most important
method is that of Walkley and Black (1934)13, where organic carbon is oxidized only by the dichromate,
heated at 120°C. A correction factor (“oxidation factor”) is needed because oxidation at this tempera-
ture is incomplete. The factors can range from 1.19 to 1.40 depending on the soil and even soil horizon
(Nelson and Sommer, 1982)14. The most important modification of the Walkley and Black method was
done by Tjurin (1931)15.
8.4.3 Calculation of SOC stocks for sampling locations and target soil depth
The amount of fine earth is one of the basic parameters to estimate SOC stocks in the mineral soil as
well as in peat layers. This amount depends on the volume of soil considered (depth x reference area),
the bulk density (BD) of the soil, and the stone content. BD expresses the soil weight per unit volume.
Slight over- or underestimations (in the bulk density and amount of stones, and consequently in the
amount of fine earth) can have a strong impact on the stock estimates. The estimation of stoniness is
difficult and time consuming, and therefore not carried out in many soil inventories, or only estimated
visually in the profile (Vincent and Chadwick, 1994)16. For further literature, see also Grossman et al.
(2001)17 and De Vos et al. (2005)18.
The following approaches may be used to derive bulk density:
a) BD could be measured after sampling (report if stones were present in top soil samples, and
thus in the sampling cylinders, and whether these were considered or not)
13 Walkley, A. and I.A. Black (1934). An examination of the Degtjareff method for determining soil organic mat-ter and a proposed modification of the chromic acid titration method. Soil Science 37: 29-38. 14 Nelson, D.W. and L.E. Sommers (1982). Total carbon, organic carbon and organic matter. p. 539-537. In: Page, A.L. et al. (eds.), Methods for soil analysis. Part 2. Chemical and microbial processes. America Society of Agronomy, Madison, Wisconsin, USA. 15 Tyurin, I.V. (1931). A modification of the volumetric method of determining soil organic matter by means of chromic acid. Pochovovodenye 26: 36-47. 16 Vincent K.R. and O.A. Chadwick (1994). Synthesizing bulk density for soils with abundant rock fragments. Soil Sci. Soc. Am. J. 58: 455-464. 17 Grossman, R.B., D.S. Harms, D.F. Kingsbury, R.K. Shaw and A.B. Jenkins (2001). Assessment of soil organic car-bon using the U.S. soil survey. In: Lal, R., J.M. Kimble, R.F. Follett and B.A. Stewart (eds.). Assessment Methods for Soil Carbon. CRC Press LLC P. Lewis Publishers, Boca Raton, USA. p. 87-104. 18 De Vos, B., M. Van Meirvenne, P. Quataert, J. Deckers and B. Muys (2005). Predictive quality of pedotransfer functions for estimating bulk density of forest soils. Soil Sci. Am. J. 69.
Specification 2: In order to estimate the quality of the global SOC map, as much metadata as
possible are needed, for example about the SOC analysis method/s (for large
data sets, most likely, different variants of soil analysis may apply)
Examples: type of analysis (a, b, c or other); type of apparatus; temperatures
used; in case of wet oxidation: method and variations*); sample treatment
(storage conditions: frozen, air-dried, stored in a moist, cool storage, and
storage length), sample preparation: grinding or cutting (and thresholds for
particle sizes)
For calcareous soils: report whether and how inorganic carbon was analysed. *) heating temperature and length of heating, titration agent and amount, sample weight, CO2 deter-
mination (titrimetric (less accurate), photometric)

15
b) Calculated using appropriate pedo-transfer functions (provide reference to specify which
function or estimation method was used)
c) Use of default values from literature (provide citation, level of disaggregation)
Approaches to derive the stone content include:
a) Direct measurement from soil samples (weight of stones in a sample of known volume; if
used, provide method and thresholds for material sizes)
b) Estimated during field work (if the stone content has been estimated using %-classes, it
would be important to share the class codes)
c) Cited values from literature (e.g. typical values per soil type and depth (provide sources)
Target depth:
The target depth is 30 cm. It represents the topsoil most susceptible to management effects. The
lower depth represents a pragmatic solution for allowing the comparability of data from different
sources although this has been recently re-discussed[1].
If data are available for soil horizons, or according to country-specific depth classes, additional calcu-
lations have to be made to refer values to a soil block of 0-30 cm (see also Batjes, 201019). In order to
allow a user friendly conversion algorithm, existing solutions will be analysed and, if necessary, modi-
fied (e.g. with the statistical R software: Filippa, 2013: A package to consistently represent soil proper-
ties along a soil profile. http://rpackages.ianhowson.com/cran/soilprofile/).
Formula to determine the SOC stock:
The following formulas are used to determine the SOC stock in different soils:
a) Mineral soils
SOC = d * BD * (Ctot – Cmin) * CFst)
where:
SOC = soil organic carbon [kg/m2]
Ctot and Cmin = total and mineral (or inorganic) carbon [g g-1], to be considered for calcareous soils, and if dry combus-
tion is used with typically high temperatures (otherwise: Ctot equals Cmin)
d = depth of horizon/depth class [m]
BD = bulk density [kg/m3]
CFst= correction factor for stoniness and gravel content (1-(%gravel + %stones)/100)
b) Organic layers (forest floor):
SOCforest floor = weightOR * (Ctot – Cmin)
where:
SOCforest floor = soil organic carbon in the forest floor [kg/m2]
weightOR = dry weight of the forest floor material sampled [kg/m2]
Ctot and Cmin = total and mineral (or inorganic) carbon [g g-1], to be considered for calcareous soils, and if dry combus-
tion is used with typically high temperatures (otherwise: Ctot equals Cmin)
Values for a) and b) need to be multiplied by 10 In order to receive [tons/hectare].
[1] Terres, J.-M., T. Toth, A. Wania, A. Hagyo, R. Koeble, L. Nisini (2016). Updated Guidelines for Applying Com-mon Criteria to Identify Agricultural Areas with Natural Constraints; EUR 27950; doi:10.2788/130243 19 Batjes, N.H. (2010). A global framework of soil carbon stocks under natural vegetation for use with the simple assessment option of the Carbon Benefits Project system. Report 2010/10. Carbon Benefits Project (CBP) and ISRIC – World Soil Information, Wageningen.

16
It is important that the national definition of the forest floor is documented. This definition guides the
soil sampling process, i.e. whether litter with little fragmentation (L horizon according to humus type
classifications) is included or excluded from soil inventories. Often, these inventories exclude the L
horizon because of its extremely high spatial and temporal variability. Data are thus only available for
F and H horizons where present. Some nutrient-rich forest soils have only L layers; in such cases, there
would be no data available from soil inventories for the forest floor.
c) Organic soils/peat:
The inventorying of peat is rather difficult. In order to calculate C stocks for peat, it is necessary to
know the extent (area) of peat (and peat types), the depth of peat, %C and bulk density. Values for
typical C concentrations and densities of peat types may be taken from literature. In order to demon-
strate the importance of SOC stocks in peat soils, the option is suggested to apply a depth of 1 m. The
depth 0-30 cm is mandatory.
The mapping of SOC stocks in peat soils requires additional technical steps, building on a clear defini-
tion of peat. These details will be provided in the GSOC cookbook (see Annex 2, to be supplemented
by end of February 2017).
8.4.4 Spatial dimension: upscaling approaches
A SOC map relies on the upscaling of measurements taken from field locations. In GHG reporting under
UNFCCC, changes in the SOC stock as total stock per country is needed. For that, the extent of SOC
stocks per spatial unit needs to be quantified. For that purpose, very often, SOC maps were produced,
referring to 1990 as a baseline (even though measurements originated from different points in time).
a) Basic methodologies
There are many possible upscaling procedures. All procedures will be accepted for the global SOC map
as long as the depth dimension (0-30 cm) and the minimum spatial dimension (grid/raster 1 km) is
fulfilled. However, the preferred upscaling method is digital soil mapping (DSM). In contrast to con-
ventional upscaling, DSM allows the quantification of uncertainties. In addition, DSM-based SOC maps
would conform to Pillar 4 specifications for soil grids (thus also GSM specifications).
Specification 3: Share metadata about SOC stocks calculation in terms of:
a) Describe how SOC stocks for the target depth 0-30 cm have been calculated;
in case there are deviations from this specification, explain.
b) Quantify the amount of carbon stored in litter (organic layer of forest floors)
c) If data allow, stratify the national soil data bases according to organic (peat)
and inorganic soils, and estimate the SOC stock for peat soils to 1 m depth
d) Bulk density: measured and/or estimated, provide method description.
e) Coarse fragments: measured and/or estimated, provide method description.
17
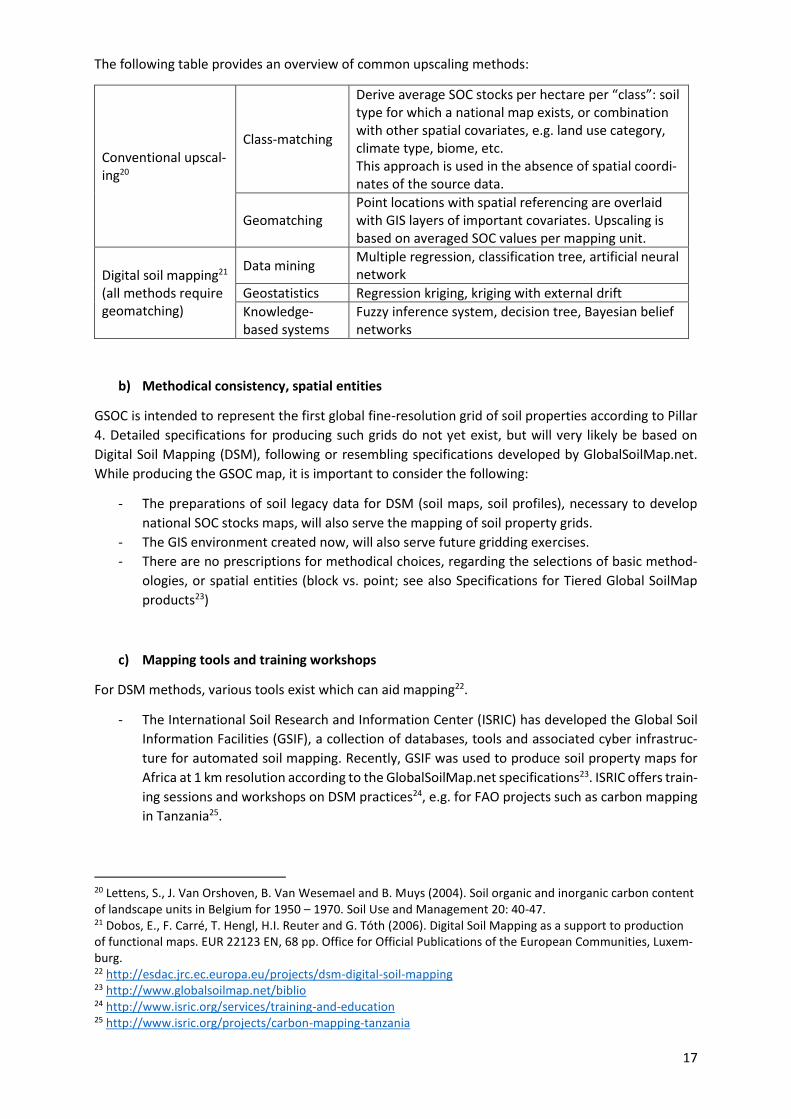
The following table provides an overview of common upscaling methods:
Conventional upscal-ing20
Class-matching
Derive average SOC stocks per hectare per “class”: soil type for which a national map exists, or combination with other spatial covariates, e.g. land use category, climate type, biome, etc. This approach is used in the absence of spatial coordi-nates of the source data.
Geomatching Point locations with spatial referencing are overlaid with GIS layers of important covariates. Upscaling is based on averaged SOC values per mapping unit.
Digital soil mapping21 (all methods require geomatching)
Data mining Multiple regression, classification tree, artificial neural network
Geostatistics Regression kriging, kriging with external drift
Knowledge-based systems
Fuzzy inference system, decision tree, Bayesian belief networks
b) Methodical consistency, spatial entities
GSOC is intended to represent the first global fine-resolution grid of soil properties according to Pillar
4. Detailed specifications for producing such grids do not yet exist, but will very likely be based on
Digital Soil Mapping (DSM), following or resembling specifications developed by GlobalSoilMap.net.
While producing the GSOC map, it is important to consider the following:
- The preparations of soil legacy data for DSM (soil maps, soil profiles), necessary to develop
national SOC stocks maps, will also serve the mapping of soil property grids.
- The GIS environment created now, will also serve future gridding exercises.
- There are no prescriptions for methodical choices, regarding the selections of basic method-
ologies, or spatial entities (block vs. point; see also Specifications for Tiered Global SoilMap
products23)
c) Mapping tools and training workshops
For DSM methods, various tools exist which can aid mapping22.
- The International Soil Research and Information Center (ISRIC) has developed the Global Soil
Information Facilities (GSIF), a collection of databases, tools and associated cyber infrastruc-
ture for automated soil mapping. Recently, GSIF was used to produce soil property maps for
Africa at 1 km resolution according to the GlobalSoilMap.net specifications23. ISRIC offers train-
ing sessions and workshops on DSM practices24, e.g. for FAO projects such as carbon mapping
in Tanzania25.
20 Lettens, S., J. Van Orshoven, B. Van Wesemael and B. Muys (2004). Soil organic and inorganic carbon content of landscape units in Belgium for 1950 – 1970. Soil Use and Management 20: 40-47. 21 Dobos, E., F. Carré, T. Hengl, H.I. Reuter and G. Tóth (2006). Digital Soil Mapping as a support to production of functional maps. EUR 22123 EN, 68 pp. Office for Official Publications of the European Communities, Luxem-burg. 22 http://esdac.jrc.ec.europa.eu/projects/dsm-digital-soil-mapping 23 http://www.globalsoilmap.net/biblio 24 http://www.isric.org/services/training-and-education 25 http://www.isric.org/projects/carbon-mapping-tanzania
18
- FAO/Global Soil Partnership (Pillar 2, GSP Education platform26): several trainings on digital soil
mapping were conducted in support of regional soil partnerships. Training materials were pre-
pared and provided through the GSP portal27.
For this SOC mapping project, GSP Secretariat will collect requests for training, organize collective
workshops and facilitate partnering between experienced and inexperienced institutions.
8.4.5 Temporal dimension: use of existing legacy data, baselines, and future updating
The long-term objective of the Global Soil Partnership is to enable global soil monitoring, and ulti-
mately to update the SWRS report. This objective is fully in line with the needs to update sink/source
assessments under UNFCCC/IPCC and the monitoring of SDG indicators (which also includes SOC).
Therefore, in the design of this new initiative for SOC mapping, the temporal dimension needs to be
considered. The UNFCCC has established 1990 as the reference year/baseline.
It is expected that all data used for this SOC mapping will originate from existing national soil profile
databases or existing soil carbon maps. Based on experiences from published SOC maps, many coun-
tries probably use various national and/or project-related data sources, therefore combining measure-
ments received from different times/intervals. These circumstances make it difficult to determine a
clear baseline for the new global SOC map. While in some countries, recent inventories might be avail-
able, in others, data are derived from soil mapping programmes which may extend over several dec-
ades (especially for large countries). Combinations of project-related and mapping-related data sets
are also likely.
Because the SOC mapping procedures recommended here rely on reproducible methods (spatial
modelling), the SOC map could be reproduced with subsets of soil profiles referring to defined time
intervals.
8.4.6 Documentation
The source data used and the methodologies for SOC mapping should be well-documented. A template
for documentation will be developed and provided separately through the GSP Portal. Specifications 1
to 5 above serve as orientation for the metadata documentation.
26 http://www.fao.org/global-soil-partnership/pillars-action/2-awareness-raising/en/ 27 http://www.fao.org/global-soil-partnership/resources/dsm-modules-nena/en/
Specification 4: Share details about the upscaling approach
1 Upscaling method (description, citation)
2 Input data/covariates, grid, soil maps, etc.
Specification 5: In order to consider the temporal dimension of the SOC map, it is important to
share the sampling date as metadata. If the national data situation allows, pre-
1990 or post-1990 sub data sets might be defined. However, it will be an im-
portant asset of this SOC map to demonstrate the density of existing soil carbon
data sets. The more data points are used, the better the reliability and accuracy
of the global product. Subsequent steps to improve the temporal dimension, will
be considered at a later stage.

19
8.5 Data security
A GSP-Data Policy (Intellectual Property Rights) is currently being prepared by the Pillar 4 Working
Group to ensure that the GSP data sharing principles – as mentioned in the Pillar 4 Plan of Action and
Implementation plan – are fully respected. All national data will remain under the ownership of the
data providers and shared data will only be used for the global SOC map.
8.6 Data sharing procedure
Data shared by countries will be collected by the GSP Secretariat. The GSP data policy (see Ch. 8.5) will
ensure that the national terms of condition are fully respected. The GSP Secretariat, with the help of
experts in DSM applications, will compile a cookbook for SOC mapping, which will be used as training
material and technical guidance for SOC mapping. It will also compile the global SOC map. Data can be
shared using common GIS formats and metadata should be compiled in an excel file (template will be
provided through the cookbook). A generic, empty, global 30 arcseconds grid will be prepared and
shared with all participating countries. Details about the process of data sharing, storage and pro-
cessing will be discussed during the next meeting of the International Soil Information Institutions
(INSII) to be held during the last quarter of 2016.
9. Procedures, tasks, roadmap
9.1 Road map for GSP secretariat activities
Process coordination: GSP Secretariat, supported by voluntary members of ITPS and P4WG prepare guideline for SOC mapping
July 2016
Develop GSP Data policy July 2016 – June 2017
Contact GSP national focal points, GSP partners (especially FAO Member coun-tries) inviting them to develop/share their national SOC maps
August-September 2016
INSII meeting with GSOC workshop November 2016
IPCC/GSP-ITPS conference to scientifically discuss SOC mapping based on in-terim results
March 2017
Global SOC mapping: preparation of national maps, SOC stock evaluations/ modelling, metadata and data sharing
Dec 2016 - Aug 2017
Modification/adjustment of national SOC maps where necessary Sept – Nov 2017
Documentation of methods/publication/data release World Soil Day (5 December) 2017

20
Annex 1: Previous SOC mapping
A1.1 Global SOC estimates and the Harmonized World Soil Database
(FAO/IIASA/ISRIC/JRC/CAS 2006)28
Overview of global soil C databases: http://esdac.jrc.ec.europa.eu/themes/global-data-other-initia-
tives
a) Global SOC Estimates and the Harmonized World Soil Database (HWSD) (Hiederer and Köchy,
2012)29
Content: SOC stocks (t ha-1), topsoil (0 – 30cm) and subsoil (30 – 100cm), a) as raster layer with reso-
lution of 30 arc second (grid size of approx. 1km x 1km) and b) raster layer with resolution of 5 arc
minute (grid size of approx. 9km x 9km). This map had different predecessors (see also Henry et al.
2009)
Data source: raster 1km (HWSD)
Restrictions: HWSD builds on soil mapping units; its content is based on the attributes of dominating
and associated soil groups depending on the source data (SOTER, national polygon maps, Digital Soil
Map of the World). The name of the soil mapping units is based on FAO74/FAO90, later converted to
WRB 2006. The analytical method for detecting SOC in the source data sets is unknown, and no har-
monization has been applied. BD and stone values are derived from coarse estimates. The authors
detected non-plausible data values (especially SOC in organic soils). The density of measured data sets
(national data, soil profiles/point measurements), and the quality of the derived estimates (BD, Stones)
is unknown. Uncertainties cannot be quantified.
b) UNEP WCMC Updated Global Carbon Map (Scharlemann et al. 2011)30
Content: SOC stocks to 1m depth, SOCconc, bulk density from HWSD (FAO/IIASA/ISRIC/ISS-CAS/JRC
2009).
Data source: raster 1km (HWSD), HWSD was adjusted and missing data filled in where possible. It im-
proves an earlier SOC map (IGBP-DIS 2000, used in UNEP-WCMC’s Carbon and biodiversity: Kapos et
al., 2008).
Restrictions: see under a) above
A1.2 Continental SOC maps based on point measurements a) Europe: LUCAS-Soil
SOC concentration (g kg-1) in the top soil (0–20 cm) (De Brogniez et al., 2015) 31
28 Harmonized World Soil Database v 1.2: http://www.fao.org/soils-portal/soil-survey/soil-maps-and-data-bases/harmonized-world-soil-database-v12/en/ 29 Hiederer, R. and M. Köchy (2012) – 79 pp. – EUR 25225 EN – EUR Scientific and Technical Research series – ISSN 1831-9424 (online), ISSN 1018-5593 (print), ISBN 978-92-79-23108-7, doi:10.2788/13267 30 Scharlemann, J.P.W., R. Hiederer, V. Kapos and C. Ravilious (2011) UNEP WCMC Updated Global Carbon Map. United Nations Environment Programme - World Conservation Monitoring Centre. 31 De Brogniez, D., C. Ballabio, A. Stevens, R. J. A. Jones, L. Montanarella and B. van Wesemael (2015). A map of the topsoil organic carbon content of Europe generated by a generalized additive model. European Journal of Soil Science. doi: 10.1111/ejss.12193
21
Source: LUCAS soil database (Toth et al., 2013a32, point data set as input data). Sampled at 15 to 20
cm depth
Approach: Regression kriging; map of the associated uncertainty (standard error of the OC model
predictions [g C kg-1])
Data quality was assessed taking into consideration the main climatic zones, regions, land cover clas-
ses and management practices (Toth et al., 2013b33). It includes 25 European Union Member States
(excluded Romania, Bulgaria, Croatia)
Restriction: not validated by countries; organic C content in most organic soils was under-predicted;
regarded to represent the uppermost 20-30 cm (IPCC depth is 0-30 cm)
b) Europe: EIONET (national) SOC maps 2010 (Panagos et al. 2013)34
- depth range of 0-30cm, mineral soil and organic H horizons
- OC density (t ha-1): N=6 countries provided data with coverage of more than 50% (Bulgaria,
Denmark, Italy, Netherlands, Poland, Slovakia)
- gravimetric SOC content (in %)
Approach: Development of European data sets for soil erosion and SOC, based on a programme be-
tween the European Soil Data Centre (ESDAC) and the Primary Contact Points (PCPs) of EIONET. Coun-
tries were asked to report using a grid of 1km x 1km cells that were assigned to each country. For each
cell, countries had to provide their best estimate of SOC content and soil erosion pertaining to that
cell. EIONET data providers were also requested to include explicit meta-data that would allow the
correct interpretation of the cell values. The information requested in the meta-data include the pe-
riod of the ground survey(s), the method used for a spatial interpolation of point data and the land use
types covered. Less than half of the contacted countries shared data. Data from some countries
needed some further processing in order to be able to deliver according to the established protocol.
Other European assessments for spatial soil C stocks using regression kriging have been conducted
with data from the ICP Forests (forest SOC stock)35 and GEMAS (SOC concentration for grassland and
cropland)36.
32 Tóth, G., Jones, A. and L. Montanarella, eds. (2013a). LUCAS Topsoil Survey. Methodology, data and results. JRC Technical Reports. Luxembourg. Publications Office of the European Union, EUR26102 – Scientific and Technical Research series – ISSN 1831-9424 (online); ISBN 978-92-79-32542-7; doi: 10.2788/97922" 33 Toth G., Jones A. and L. Montanarella (2013b) The LUCAS topsoil database and derived information on the regional variability of cropland topsoil properties in the European Union. Environmental Monitoring and As-sessment, 185 (9), pp. 7409-7425. 34 Panagos, P., Hiederer, R., Van Liedekerke, M., Bampa, F. (2013) Estimating soil organic carbon in Europe based on data collected through an European network, Ecological Indicators 24, pp. 439-450. 35 Baritz, R., D. Zirlewagen, R. Jones, D. Arrouays, R. Hiederer, M. Schrumpf and W. Riek (2011). Carbon in Euro-pean soils. In: Jandl, R., M. Rodeghiero and M. Olsson (eds). Soil carbon in Sensitive European Ecosystems: From Science to Land Management. John Wiley & Sons, Ltd. p 49-84. (ISBN: 9781119970019) 36 Baritz, R., V. Ernstsen and D. Zirlewagen (2014). Carbon Concentrations in European Agricultural and Grazing Land Soil. In: Reiman et al. (eds.). Chemistry of Europe's agricultural soils. Part B. General Background Infor-mation and Further Analysis of the GEMAS Data Set. Geologisches Jahrbuch, Reihe B, Volume B 103. Bundesanstalt für Geowissenschaften und Rohstoffe, Hannover (Hrsg.). Schweizerbart’sche Verlagsbuchhand-lung, Stuttgart. p. 117 – 128 (Chapter 6).

22
c) Africa: AfSIS
AfSIS: Use of point data sources to produce soil property maps (regression-kriging); organic carbon,
pH, sand, silt and clay fractions, coarse fragments, bulk density, cation-exchange capacity, total nitro-
gen, exchangeable acidity, Al content, and exchangeable bases (Ca, K, Mg, Na): two resp. six standard
soil depths, 250 m spatial resolution, whole African continent.
Point data sources (2008–2014): a) Africa Soil Profiles (legacy) database (ISRIC; Leenaars, 2014); b)
AfSIS Sentinel Sites (new soil samples) database (Vagen et al., 2010), jointly consisting of ca. 28 thou-
sand sampling locations.
23
Annex 2: Cookbook for soil organic carbon mapping
This cookbook will contain specific technical guidance about the upscaling of point-level measure-
ments. It is aimed to provide technical support to GIS mappers and modelers. It will be provided as e-
learning material accompanying training of national capacities. The cookbook will be provided as a
standalone document which will accompany these guidelines.