gtp-ras disrupts the intramolecular complex of c1 and ra domains of nore1
TRANSCRIPT

Structure 14, 881–888, May 2006 ª2006 Elsevier Ltd All rights reserved DOI 10.1016/j.str.2006.03.008
GTP-Ras Disrupts the Intramolecular Complexof C1 and RA Domains of Nore1
Elena Harjes,1,3,6,7 Stefan Harjes,1,3,6,7,*
Sabine Wohlgemuth,2 Karl-Heinz Muller,1,3
Elmar Krieger,5 Christian Herrmann,4
and Peter Bayer1,3
1Molecular and Structural Biophysics2Department of Structural BiologyMax-Planck Institute of Molecular PhysiologyOtto-Hahn Strasse 11D-44227 DortmundGermany3Interdisciplinary Center of Magnetic Resonance (IZMR)D-44227 DortmundGermany4Physikalische Chemie 1Ruhr-Universitat BochumD-44780 BochumGermany5Center for Molecular and Biomolecular InformaticsRadboud University NijmegenP.O. Box 91016500 GL NijmegenThe Netherlands
Summary
The novel Ras effector mNore1, capable of inducing
apoptosis, is a multidomain protein. It comprises aC1 domain homologous to PKC and an RA domain
similar to the Ras effectors AF-6 and RalGDS. Here,we determine the affinity of these two domains to the
active forms of Ras and Rap1 using isothermal calori-
metric titration. The interaction of Ras/Rap1-GTP withthe RA domain of mNore1 is weakened significantly by
direct binding of the C1 domain to the RA domain. Inorder to analyze this observation in atomic detail, we
solved the C1 solution structure by NMR. By determin-ing chemical shifts and relaxation rates, we can show
an intramolecular complex of C1-RA. GTP-Ras titrationand binding to RA disrupts this complex and displaces
the C1 domain. Once the C1 domain tumbles freely insolution, a lipid binding interface becomes accessible.
Furthermore, we provide evidence of phosphatidylino-sitol 3-phosphate binding of the free C1 domain.
Introduction
Small GTPases of the Ras family are central regulatorsof cellular signal transduction processes leading to cellproliferation, cell differentiation, and apoptosis (Shieldset al., 2000; Feig and Buchsbaum, 2002; Cox and Der,2003). Ras signaling is mediated by Ras effectors, in-cluding Raf, the RalGEF family member RalGDS, phos-phatidylinositol (PI) 3-kinase, AF-6, and the novel Ras
*Correspondence: [email protected] These authors contributed equally to this work.7 Present address: Greifswald University, Institute of Biochemistry,
Department of Biotechnology, Soldmannstrasse 16, D-17487 Greifs-
wald, Germany.
effector Nore1. These multidomain proteins containa Ras association (RA) domain that tightly binds to ac-tive Ras/Rap-GTP, but not inactive Ras/Rap-GDP. Inaddition, the effectors Raf and RalGDS contain catalyticand signal transducing domains, whereas the effectorsAF-6 and Nore1 more likely function as adaptors, at-tracting other proteins (Radziwill et al., 2003).
Nore1 was first discovered in a yeast two-hybridscreen of a mouse cDNA library by using Ras as thebait (Vavvas et al., 1998). There are two human splice var-iants, Nore1A and Nore1B, which have been assigned tothe Ras association family (RASSF). Within the primarysequence of Nore1, five regions can be assigned: theN-terminal proline-rich region, able to bind RASSF1A(Ortiz-Vega et al., 2002), is followed by a cysteine-richdomain. Next, there is a region of w100 amino acids,which, by using deletions, was implicated in Ras-inde-pendent inhibition of tumor cell growth (Aoyama et al.,2004). Adjacent to this stretch of residues, the RA do-main can be found. The C terminus putatively formsa coiled-coil structure. It has been used to immunopre-cipitate the kinase Mst1, known to be responsible forpromotion of apoptosis (Khokhlatchev et al., 2002).
The cysteine-rich domain shares homology with theC1 domains of PKC and Raf. C1 domains have been im-plicated in intramolecular complexes, which mediateautoinhibition of these kinases (Medkova and Cho, 1999;Cutler et al., 1998). Additionally, C1 domains can interactwith membrane lipids. Typical C1 domains bind diacyl-glycerol or phorbol ester, whereas atypical domainshave other specificity. Residues involved in phorbol es-ter binding of PKCg or PKCd, for example, have beenidentified by using NMR spectroscopy (Xu et al., 1997)and crystallography (Zhang et al., 1995), respectively. Adiacylglycerol binding consensus sequence could bederived (Hurley and Misra, 2000). There has been contro-versy about direct binding of the Raf C1 domain to Ras(Hu et al., 1995; Cutler et al., 1998). A better understand-ing of the role of the C1 domain may shed light on mech-anisms of effector activation and/or translocation.
In this study, we resolve the structure of the C1 do-main of mNore1 by heteronuclear NMR spectroscopy.Further, we investigate its interaction with the RA do-main and with Ras by NMR titration, as well as by iso-thermal titration calorimetry (ITC). We find no directbinding of C1 to Ras; instead, we can demonstrate anintramolecular complex of the C1 and RA domains ofNore1. Titration of Ras disrupts this intramolecular com-plex, allowing the C1 domain to tumble freely in solutionand to bind other interaction partners. Using a protein-lipid overlay assay, we further demonstrate phosphati-dylinositol 3-phosphate and sulfatide binding of thefree C1 domain of Nore1.
Results
Structure DescriptionWe determined the structure of the C1 domain of Nore1(residues Pro95–Arg166) by using high-resolution,heteronuclear, multidimensional NMR spectroscopy.
Structure882Structure882
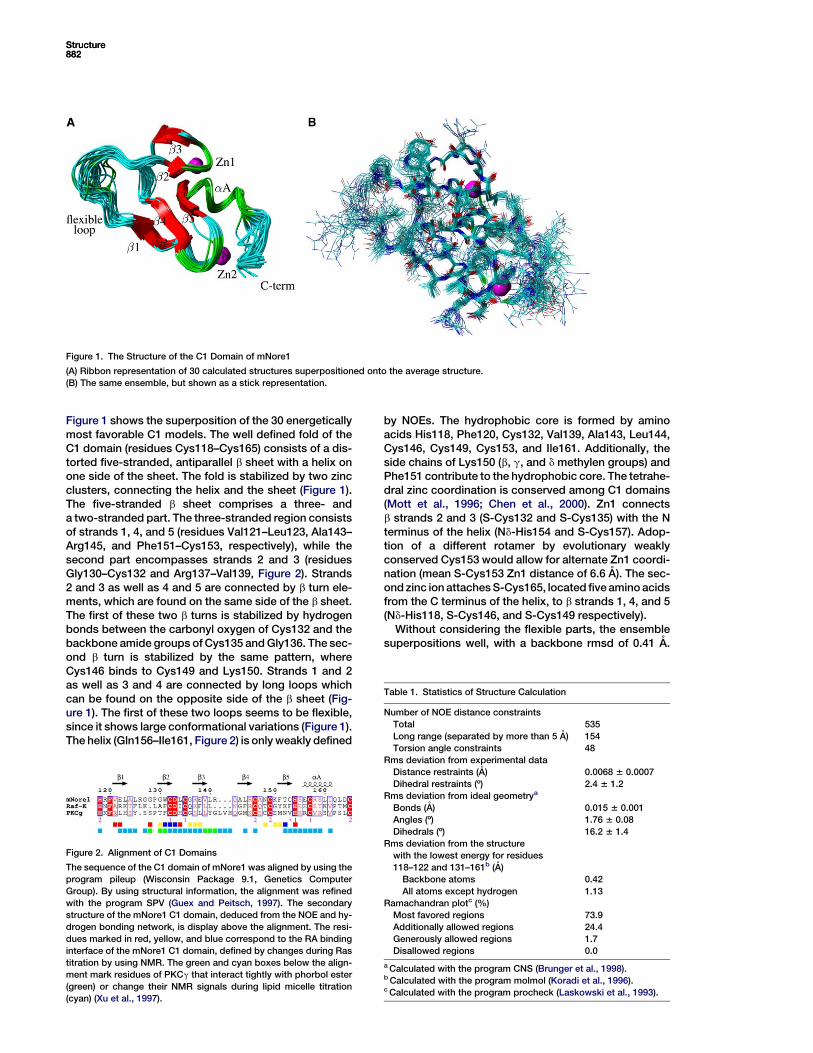
Figure 1. The Structure of the C1 Domain of mNore1
(A) Ribbon representation of 30 calculated structures superpositioned onto the average structure.
(B) The same ensemble, but shown as a stick representation.
Figure 1 shows the superposition of the 30 energeticallymost favorable C1 models. The well defined fold of theC1 domain (residues Cys118–Cys165) consists of a dis-torted five-stranded, antiparallel b sheet with a helix onone side of the sheet. The fold is stabilized by two zincclusters, connecting the helix and the sheet (Figure 1).The five-stranded b sheet comprises a three- anda two-stranded part. The three-stranded region consistsof strands 1, 4, and 5 (residues Val121–Leu123, Ala143–Arg145, and Phe151–Cys153, respectively), while thesecond part encompasses strands 2 and 3 (residuesGly130–Cys132 and Arg137–Val139, Figure 2). Strands2 and 3 as well as 4 and 5 are connected by b turn ele-ments, which are found on the same side of the b sheet.The first of these two b turns is stabilized by hydrogenbonds between the carbonyl oxygen of Cys132 and thebackbone amide groups of Cys135 and Gly136. The sec-ond b turn is stabilized by the same pattern, whereCys146 binds to Cys149 and Lys150. Strands 1 and 2as well as 3 and 4 are connected by long loops whichcan be found on the opposite side of the b sheet (Fig-ure 1). The first of these two loops seems to be flexible,since it shows large conformational variations (Figure 1).The helix (Gln156–Ile161, Figure 2) is only weakly defined
Figure 2. Alignment of C1 Domains
The sequence of the C1 domain of mNore1 was aligned by using the
program pileup (Wisconsin Package 9.1, Genetics Computer
Group). By using structural information, the alignment was refined
with the program SPV (Guex and Peitsch, 1997). The secondary
structure of the mNore1 C1 domain, deduced from the NOE and hy-
drogen bonding network, is display above the alignment. The resi-
dues marked in red, yellow, and blue correspond to the RA binding
interface of the mNore1 C1 domain, defined by changes during Ras
titration by using NMR. The green and cyan boxes below the align-
ment mark residues of PKCg that interact tightly with phorbol ester
(green) or change their NMR signals during lipid micelle titration
(cyan) (Xu et al., 1997).
by NOEs. The hydrophobic core is formed by aminoacids His118, Phe120, Cys132, Val139, Ala143, Leu144,Cys146, Cys149, Cys153, and Ile161. Additionally, theside chains of Lys150 (b, g, and d methylen groups) andPhe151 contribute to the hydrophobic core. The tetrahe-dral zinc coordination is conserved among C1 domains(Mott et al., 1996; Chen et al., 2000). Zn1 connectsb strands 2 and 3 (S-Cys132 and S-Cys135) with the Nterminus of the helix (Nd-His154 and S-Cys157). Adop-tion of a different rotamer by evolutionary weaklyconserved Cys153 would allow for alternate Zn1 coordi-nation (mean S-Cys153 Zn1 distance of 6.6 A). The sec-ond zinc ion attaches S-Cys165, located five amino acidsfrom the C terminus of the helix, to b strands 1, 4, and 5(Nd-His118, S-Cys146, and S-Cys149 respectively).
Without considering the flexible parts, the ensemblesuperpositions well, with a backbone rmsd of 0.41 A.
Table 1. Statistics of Structure Calculation
Number of NOE distance constraints
Total 535
Long range (separated by more than 5 A) 154
Torsion angle constraints 48
Rms deviation from experimental data
Distance restraints (A) 0.0068 6 0.0007
Dihedral restraints (º) 2.4 6 1.2
Rms deviation from ideal geometrya
Bonds (A) 0.015 6 0.001
Angles (º) 1.76 6 0.08
Dihedrals (º) 16.2 6 1.4
Rms deviation from the structure
with the lowest energy for residues
118–122 and 131–161b (A)
Backbone atoms 0.42
All atoms except hydrogen 1.13
Ramachandran plotc (%)
Most favored regions 73.9
Additionally allowed regions 24.4
Generously allowed regions 1.7
Disallowed regions 0.0
a Calculated with the program CNS (Brunger et al., 1998).b Calculated with the program molmol (Koradi et al., 1996).c Calculated with the program procheck (Laskowski et al., 1993).

Ras Disrupts the Intramolecular Complex of Nore1883
Figure 3. Superposition of Three C1 Domains
The C1 domains of mNore1 (blue), Raf kinase
(gray), and PKCg (yellow) were superposi-
tioned (Jung and Lee, 2000). The stereoimage
was calculated by using the programs Yasara
and Povray. The phorbol ester binding site
of PKCg is located at the upper left of the
molecule.
For all atoms, excluding hydrogens, an rmsd of 1.13 Awas calculated (Table 1). A total of 74% of the f and c
torsion angles are within the most favored region ofthe Ramachandran plot, 24% are in the allowed region,and the rest are in the generously allowed region (Las-kowski et al., 1993).
The diacylglycerol consensus sequence (Hurley andMisra, 2000) is not conserved in the C1 domain ofmNore1 (Figure 2). The loop connecting b strands 3 and4 is three amino acids shorter in mNore1 compared toPKCg (Figures 2 and 3). The structurally important gly-cine residue, necessary for diacylglycerol binding (Hur-ley and Misra, 2000), is missing from this loop. Thus,we classify the C1 domain of Nore1 as an atypical C1domain.
Affinity of Ras for mNore1 FragmentsTo examine the function of the C1 domain of mNore1 dur-ing Ras binding, we used isothermal titration calorimetry(ITC). This method allows us to quantify the interactionbetween any partners, if there is a change in enthalpyupon binding. For example, titration of Ras-GppNHp (anonhydrolyzable GTP analog) with the RA domain ofmNore1 sets free a large complex formation enthalpy(Figure 4). Ras and the RA domain bind each other withhigh affinity (Table 2). Using a longer RA construct thatadditionally comprises the C1 domain of mNore1 (C1-RA), decreases the Ras affinity by a factor of two (Fig-ure 4). The attached C1 domain leads to a reduction offree interaction energy (0.5 kcal/mol) between Ras andthe RA domain. A similar observation is made with theclosely related small GTPase Rap, which, like Ras, bindsthe RA domain of mNore1 with high affinity (Table 2).Again, use of the longer C1-RA fragment lowers theRap affinity, in this case by a factor of 3 (Table 2).
C1-induced structural changes of the RA domain canexplain the decreased affinity. Alternatively, competitionbetween the C1 domain and Ras for the RA domain canoccur. Supporting the later explanation, we can show di-rect binding between the separately expressed C1 andRA domains. The titration was carried out in bothways: by adding either RA to C1 or vice versa. Withinan error of 20%, we obtained a KD value of 50 mM, corre-sponding to a free energy difference (DGº) of C1/RAcomplex formation of 25.9 kcal/mol. Since both
domains are contained on one polypeptide chain, thetwo domains can be expected to form an intramolecularcomplex. Upon addition of Ras, this complex is dis-solved, which explains the observed reduction of Rasaffinity.
Ras Disrupts the Intramolecular Complexbetween C1 and RA Domains
Complex formation or dissociation can be followedon the atomic level by using NMR titrations. 15N-HSQCspectra of the C1-RA construct were recorded before,during, and after addition of Ras-GppNHp (Figure 5). Ina spectrum of the C1-RA construct, resonances belong-ing to nuclei of the C1 domain display chemical shiftsclearly different from those of the free C1 domain. Thisis not only due to the higher molecular weight of the con-struct. Addition of Ras-GppNHp shifts the HSQC signals
Figure 4. Isothermal Titration Calorimetry
Ras-GppNHp at 500 mM was placed in the syringe of the ITC appa-
ratus and titrated into the cell containing the C1-RA construct of
Nore1 at 50 mM (upper panel). Changes in heating power were inte-
grated and plotted versus the molar ratio of Ras/Nore1. The lower
panel shows such data for Ras/RA (filled squares) and Ras/C1-RA
(open squares). A fit according to a single site binding model yielded
the thermodynamic data given in Table 2.

Structure884
progressively toward those of the free C1 domain. Duringtitration, 17 signals change their chemical shift, until theyreturn to values observed in the spectrum of the free C1domain (Figure 5). Changes of 0.01–0.2 ppm along the1H and 0.02–1 ppm along the 15N dimensions are mea-sured. With respect to the NMR timescale, slow- andfast-exchanging spins can be distinguished. The signalsof the backbone nitrogen groups of Val121, Glu122,Gly128, Leu134, and His154 display a continuous chem-ical shift change that is proportional to the amount of Rastitrated (fast exchange, Figures 2 and 5). Two signals canbe observed for the amide resonances of Gly130,Gly136, Arg137, Glu138, Lys150, and Phe151 and theNH2 group of Asn148. The relative intensity of the pairs
Table 2. Thermodynamic Data of Complex Formation between
Fragments of Nore1 and GppNHp Bound Small GTPases Ras
and Rap Obtained from Isothermal Titration Calorimetry
mNore1-RA mNore1-C1-RA
Ras
Kd (mM) 0.21 6 0.02 0.4 6 0.04
n 1.0 6 0.1 0.9 6 0.1
DHº (kcal/mol) 29.3 6 0.3 26.4 6 0.3
DGº (kcal/mol) 29.1 6 0.1 28.7 6 0.1
Rap1B
Kd (mM) 2.8 6 0.5 8.2 6 1
n 0.85 6 0.2 1.1 6 0.2
DHº (kcal/mol) 25.7 6 0.5 21.5 6 0.5
DGº (kcal/mol) 27.6 6 0.1 28.7 6 0.1
mNore1-C1
Kd (mM) 50 6 10 nd
n 0.85 6 0.2 nd
DHº (kcal/mol) 20.8 6 0.3 nd
DGº (kcal/mol) 25.9 6 0.2 nd
changes according to the concentration of Ras added(slow exchange, Figures 2 and 5). Five resonances be-longing to Trp131 (backbone and N31), Cys132,Asp133, and Thr152 were not found in the 15N-HSQCspectrum of the C1-RA construct, but the signals reap-peared upon Ras titration (slow exchange, reappearingsignals, Figures 2 and 5). Together, these 16 residues de-fine an almost continuous C1-RA interaction interface onthe surface of the C1 domain (see below).
Complex Disruption Confirmed by RelaxationMeasurements
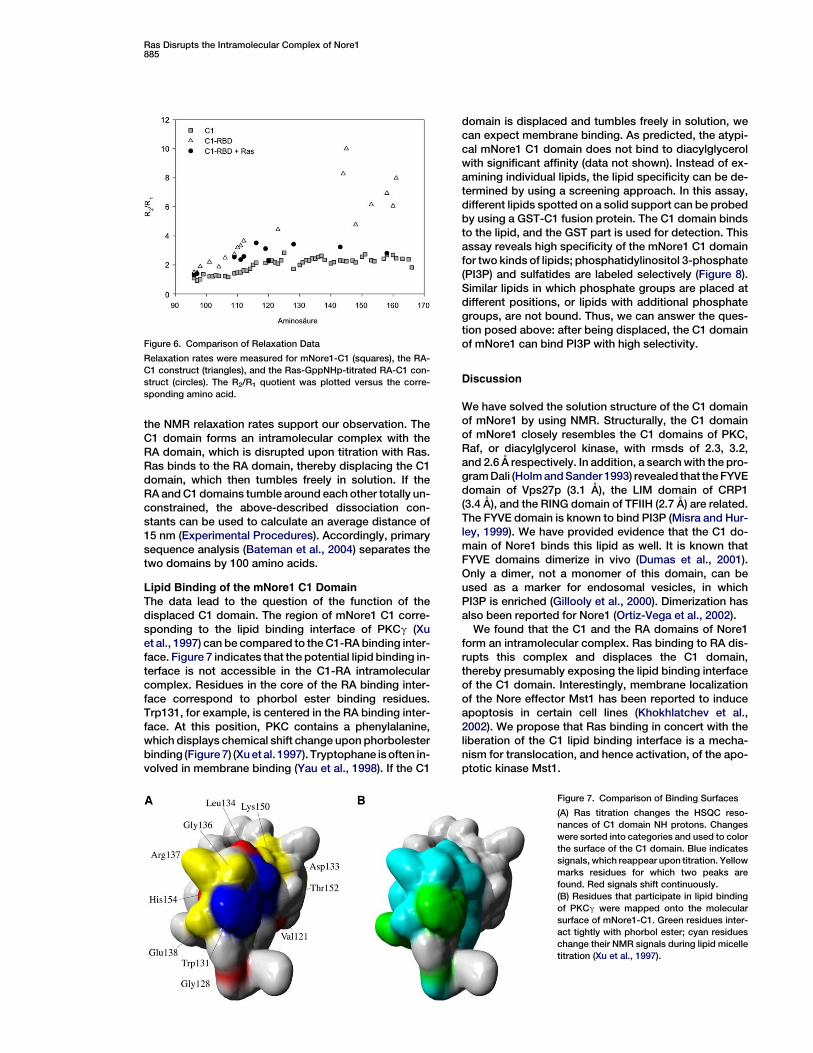
The transverse and longitudinal relaxation rate ratio (R2/R1) depends on the speed of movement, and it is propor-tional to the molecular weight (Kai et al., 1989). A singledomain has a smaller ratio than the same domain fixed ina larger complex. If the intramolecular complex of thetwo domains is disrupted, the relaxation rate ratioshould drop to values resembling those of single do-mains. We measured three sets of 15N relaxation rates:first, for the free, 72 residue C1 domain, a mean R2/R1 ra-tio of 2.2 was calculated (Figure 6). For the C1-RA con-struct, spanning 263 amino acids, the mean R2/R1 ratioincreased to 6.5 (Figure 6). This clearly indicates thatthe C1 domain of the C1-RA construct is part of a largercomplex. The third set of relaxation rates was deter-mined for the C1-RA construct titrated with GppNHpbound Ras. Here, we find values similar to the relaxationrate ratio of the free C1 domain (Figure 6). This findingcan be highlighted by looking at Arg158, which showsan R2/R1 ratio of 2.7 in the free C1 domain (Figure 6). Inthe C1-RA construct, this ratio is increased to 6.9, butit drops to 2.8 after Ras titration. We can conclude that
Figure 5. Changes of NMR Signals during
Titration of the C1-RA Construct with Ras
(A–H) Parts of superpositioned HSQC spectra
are shown for signals where changes were
observed. The signals of the free mNore1-C1
domain are shown in red, the resonances of
the RA-C1 fragment are shown in green, and
the signals of the C1-RA fully titrated with
GppNHp bound Ras are colored in blue. (A)
The proposed model of the domain arrange-
ment is shown in the above-mentioned
colors. (B–H) Parts of the superpositioned
HSQC spectra showing the changes. The rel-
evant amino acids are indicated and under-
lined according to the category of change.
(B)–(D) and (F) are twice as magnified as (E),
(G), and (H).
Ras Disrupts the Intramolecular Complex of Nore1885
the NMR relaxation rates support our observation. TheC1 domain forms an intramolecular complex with theRA domain, which is disrupted upon titration with Ras.Ras binds to the RA domain, thereby displacing the C1domain, which then tumbles freely in solution. If theRA and C1 domains tumble around each other totally un-constrained, the above-described dissociation con-stants can be used to calculate an average distance of15 nm (Experimental Procedures). Accordingly, primarysequence analysis (Bateman et al., 2004) separates thetwo domains by 100 amino acids.
Lipid Binding of the mNore1 C1 Domain
The data lead to the question of the function of thedisplaced C1 domain. The region of mNore1 C1 corre-sponding to the lipid binding interface of PKCg (Xuet al., 1997) can be compared to the C1-RA binding inter-face. Figure 7 indicates that the potential lipid binding in-terface is not accessible in the C1-RA intramolecularcomplex. Residues in the core of the RA binding inter-face correspond to phorbol ester binding residues.Trp131, for example, is centered in the RA binding inter-face. At this position, PKC contains a phenylalanine,which displays chemical shift change upon phorbolesterbinding (Figure 7) (Xu et al. 1997). Tryptophane is often in-volved in membrane binding (Yau et al., 1998). If the C1
Figure 6. Comparison of Relaxation Data
Relaxation rates were measured for mNore1-C1 (squares), the RA-
C1 construct (triangles), and the Ras-GppNHp-titrated RA-C1 con-
struct (circles). The R2/R1 quotient was plotted versus the corre-
sponding amino acid.
domain is displaced and tumbles freely in solution, wecan expect membrane binding. As predicted, the atypi-cal mNore1 C1 domain does not bind to diacylglycerolwith significant affinity (data not shown). Instead of ex-amining individual lipids, the lipid specificity can be de-termined by using a screening approach. In this assay,different lipids spotted on a solid support can be probedby using a GST-C1 fusion protein. The C1 domain bindsto the lipid, and the GST part is used for detection. Thisassay reveals high specificity of the mNore1 C1 domainfor two kinds of lipids; phosphatidylinositol 3-phosphate(PI3P) and sulfatides are labeled selectively (Figure 8).Similar lipids in which phosphate groups are placed atdifferent positions, or lipids with additional phosphategroups, are not bound. Thus, we can answer the ques-tion posed above: after being displaced, the C1 domainof mNore1 can bind PI3P with high selectivity.
Discussion
We have solved the solution structure of the C1 domainof mNore1 by using NMR. Structurally, the C1 domainof mNore1 closely resembles the C1 domains of PKC,Raf, or diacylglycerol kinase, with rmsds of 2.3, 3.2,and 2.6 A respectively. In addition, a search with the pro-gram Dali (Holm and Sander 1993) revealed that the FYVEdomain of Vps27p (3.1 A), the LIM domain of CRP1(3.4 A), and the RING domain of TFIIH (2.7 A) are related.The FYVE domain is known to bind PI3P (Misra and Hur-ley, 1999). We have provided evidence that the C1 do-main of Nore1 binds this lipid as well. It is known thatFYVE domains dimerize in vivo (Dumas et al., 2001).Only a dimer, not a monomer of this domain, can beused as a marker for endosomal vesicles, in whichPI3P is enriched (Gillooly et al., 2000). Dimerization hasalso been reported for Nore1 (Ortiz-Vega et al., 2002).
We found that the C1 and the RA domains of Nore1form an intramolecular complex. Ras binding to RA dis-rupts this complex and displaces the C1 domain,thereby presumably exposing the lipid binding interfaceof the C1 domain. Interestingly, membrane localizationof the Nore effector Mst1 has been reported to induceapoptosis in certain cell lines (Khokhlatchev et al.,2002). We propose that Ras binding in concert with theliberation of the C1 lipid binding interface is a mecha-nism for translocation, and hence activation, of the apo-ptotic kinase Mst1.
Figure 7. Comparison of Binding Surfaces
(A) Ras titration changes the HSQC reso-
nances of C1 domain NH protons. Changes
were sorted into categories and used to color
the surface of the C1 domain. Blue indicates
signals, which reappear upon titration. Yellow
marks residues for which two peaks are
found. Red signals shift continuously.
(B) Residues that participate in lipid binding
of PKCg were mapped onto the molecular
surface of mNore1-C1. Green residues inter-
act tightly with phorbol ester; cyan residues
change their NMR signals during lipid micelle
titration (Xu et al., 1997).

Structure886
Our observations could explain additional details. Ithas been reported that Nore per se inhibits its effectorMst1 (Praskova et al., 2004). Only upon Ras bindingand membrane translocation is this inhibition releaved.We showed that Ras binding induces a prominentchange in the quarternary structure of Nore1. Thischange could be an explanation for the transition frominhibition to stimulation of Mst1.
Experimental Procedures
Protein Production
The C1 domain (aa 95–166) or the C1-RA construct (aa 95–358) was
expressed in pGEX4T3 in E. coli BL21 DE3 by using 0.1 mM iso-
propyl-b-D-thiogalactoside. The cells were ultrasonicated, and the
lysate was cleared by centrifugation. The glutathione-S-transferase
(GST) fusion proteins were purified by using GSH affinity chromato-
graphy (GSH sepharose). GST was cleaved with Thrombin (10 U/ml
overnight at 4ºC), and the protein of interest was purified by using gel
filtration (sephadex G75). For 15N or 13C labeling, minimal medium
(Gronwald et al., 2001) was supplemented with 0.75 g/l 15N ammo-
nium chloride or 2.5 g/l 13C glucose. For double labeling, 1 and 2.5
g/l were used, respectively. For NMR experiments, the proteins
were dissolved in 20 mM KHPO4 (pH 6.9), 0.5 mM NaN3, 4 mM
DTE, and 5% D2O. Ras and Rap were purified and loaded with
GppNHp as described (Herrmann et al., 1996; Lenzen et al., 1995),
and they were dissolved in the same buffer for NMR titration.
Lipid Assay
Several different lipids spotted on solid support are available com-
mercially (PIP strips and Sphingo strips, Invitrogen). The intact
GST-C1 fusion was bound to these membranes and detected by
mouse anti-GST antibody, followed by labeling with horseradish
peroxidase-conjugated anti-mouse antibody and chemiluminescent
detection (ECL, Amersham).
Isothermal Titration Calorimetry
The interactions between the protein fragments and the Ras pro-
teins were quantified by isothermal titration calorimetry (MCS,
MicroCal). All proteins were dissolved in 50 mM Tris buffer (pH 7.4) in-
cluding 5 mM MgCl2, which is important for tight nucleotide binding.
The syringe was filled with the protein solution containing the small
GTPase at 500 mM, while the Nore fragment at 50 mM was placed into
Figure 8. Lipid Binding Specificity of the mNore1-C1 Domain
A total of 26 different lipids on a nitrocellulose membrane were
probed with recombinant GST-mNore1-C1 (GST-95-166), were sub-
sequently labeled with anti-GST-antibody and HRP-coupled anti-
mouse antibody, and were followed by ECL detection.
the cell of the ITC apparatus. The low-affinity interaction between
the C1 and RA fragments of Nore was measured by using C1 at
100 mM in the cell and 1 mM RA in the syringe, as well as by the in-
verse setup. The titration experiments were carried out in duplicate
at 25ºC by stepwise injection of 8 ml at time intervals of 4 min each. In
blank experiments, the respective protein was injected from the sy-
ringe into the buffer solution, yielding small background heats that
were subtracted from the titration experiments prior to curve fitting.
NMR Spectroscopy
NMR samples containing 2 mM protein were prepared in the above-
described buffer. NMR spectra were recorded on a Varian Inova 600
MHz spectrometer at 300 K, by using States for quadrature detec-
tion. The resonance assignments were obtained by standard homo-
nuclear and heteronuclear correlation experiments such as DQF-
COSY, TOCSY, HNCACB, HCCONH, CCONH, and HCCH-COSY.
The spectra were processed with XWIN-NMR (Bruker, Karlsruhe)
by using the cosines square function as the windows function, and
zero filling was applied in both dimensions. Analysis was done
with Aurelia and Auremol (Bruker, Karlsruhe). All backbone reso-
nances, except for Gly127 and Ser155, were assigned (BMRB ac-
cession number 6059).
For the titration experiment, subsequent amounts of a solution
containing 68 mg/ml Ras-GppNHp were added to a solution con-
taining 13 mg/ml C1-RA.
Structure Calculation
The structure calculation was based on 535 distance and 48 dihedral
angle restraints by using a three-step procedure implemented in the
molecular simulation program YASARA ([Krieger, 2003], detailed
protocols are available from www.yasara.org/sd). In each step, the
restraints were enforced with the X-PLOR soft-square potential
(Brunger, 1992) with parameters SqConstant = 1, SqOffset = 0,
SqExponent = 2, rSwitch = 1, SoExponent = 1, and Asymptote = 2.
To fold the initially stretched-out peptide chain to a globular pro-
tein, backbone and side chain dihedral angles were changed ran-
domly, and a Monte Carlo criterion based on the restraint violation
energy was used to accept or reject a move. No additional force field
term was applied.
Next, structures were subjected to 40 cycles of heating (500 K) and
cooling (0 K) by using the NOVA force field (Krieger et al., 2002) with
a 10 A cutoff. At this point, the two zinc ions were added to the sys-
tem. In the first three cycles, intermolecular forces were partly re-
moved to let parts of the peptide chain pass through each other
and resolve incorrect topologies.
In the final step, the protein was embedded in a water box, 10 A
larger than the protein along each axis. Then, a molecular dynamics
simulation was run at 300 K with the YASARA force field, which is an
extension of the YAMBER2 force field (Krieger et al., 2004; Kuszew-
ski and Clore, 2000), with knowledge-based torsion potentials for
more accurate high-resolution refinement. Simulations lasted 2 ps;
an 8 A cutoff for Van der Waals forces and the Particle Mesh Ewald
algorithm (Essman et al., 1995) were used for electrostatic forces. To
make sure that the resulting structures completely matched the ex-
perimental data, the entire solute/solvent system was then energy
minimized (by multiplying atom velocities with 0.9 every 10 simula-
tion steps) while checking for NMR restraint violations. If any were
found, the restraining forces were increased steadily until the viola-
tion energy was marginal (<1 kcal/mol). A total of 30 structures with
the lowest energy were chosen for the ensemble representing the
structure and were analyzed (Table 1).
Average Distance between C1 and RA Domains
Using the ITC dissociation constants (Table 2), the concentration of
the free C1 domain, as it tumbles around the RA domain, can be cal-
culated. To distinguish covalent, noncovalent, and both interactions
from each other, the symbols (_), (#), and (#), respectively, are used in
the following equations.
Ras binding takes place as a two-step process. First, there is an
equilibrium of the C1-RA construct (Equation 1). Ras binds to the
free RA (Equation 2), thereby removing the product of Equation 1:
C1#RA # C1 RA; (1)
C1 RA + Ras # C1 RA#Ras; (2)

Ras Disrupts the Intramolecular Complex of Nore1887
C1# RA + Ras # C1 RA#Ras: (3)
The overall reaction (Equation 3) has been measured directly by
NMR, as well as by ITC. A dissociation constant of K3D = 0.4 mmol/
l has been determined. The main assumption of the model is that
the covalent linker does not influence the equilibrium constants. In
this case, the constant of Equation 2 can be measured by titrating
RA with RAS (Equation 4, K4D = K2D = 0.2 mmol/l):
RA + RAS # RA#Ras: (4)
The binding event of the intramolecular reaction (Equation 1) can
be described by the intermolecular Equation 5, in which a dissocia-
tion constant of K5D = 50 mmol/l has been determined (Table 2):
C1 + RA # C1#RA: (5)
If we define the concentration of RA as being equal to that of
C1_RA, we can determine at which concentration of C1 equal con-
centrations of complexes are found (i.e., how much C1 is needed
such that [C1#RA] = [C1#RA]):
K1D = ½C1 # RA�=½C1 RA�
K5D = ½C1� * ½RA�=½C1#RA�0K1D = ½C1�eff=K5D: (6)
The equilibrium constant of Equation 1 can be calculated from the
overall Equation 3, in which two steps are added. We can calculate
[C1]eff:
K1D * K2D = K3D0K1D = K3D=K2D
= K3D=K4D
0½C1�eff = ðK3D * K5DÞ=K4D = 100 mmol=l: (7)
If we need 100 mmol/l of the C1 domain to achieve the same con-
centration of complex, we can assume that this is the concentration
‘‘sensed’’ by the RA domain in the C1_RA construct.
Hence, we can calculate the volume of the sphere in which the C1
domain tumbles around the RA domain. The radius of this ball cor-
responds to the average distance between the C1 and RA domains
in solution:
r =
ffiffiffiffiffiffiffiffiffiffiffiffiffiffiffiffiffiffiffiffiffiffiffiffiffiffiffiffiffiffiffiffiffiffiffi3 * 102 3
4 * p * NA * ½C1�eff
3
sz16 nm (8)
The same arguments are valid for the binding of the small GTPase
Rap1, in which the dissociation constants have also been deter-
mined (Table 2). Thus, we can calculate an effective C1 concentra-
tion of 150 mM. Accordingly, an average distance of 15 nm between
the C1 domain and the RA domain can be estimated.
Acknowledgments
We thank R. Kinne for general support, P. Harjes for correction of the
manuscript, J. Trankle and M. Farakasovsky for tips and the GST an-
tibody (lipid binding assay), and Bernhardt Griewel for help with the
NMR spectrometer. We gratefully thank the Fonds der chemischen
Industrie Deutschlands eV (P.B.) for financial support.
Received: March 1, 2005
Revised: February 27, 2006
Accepted: March 3, 2006
Published: May 16, 2006
References
Aoyama, Y., Avruch, J., and Zhang, X. (2004). Nore1 inhibits tumor
cell growth independent of Ras or the MST1/2 kinases. Oncogene
23, 3426–3433.
Bateman, A., Coin, L., Durbin, R., Finn, R., Hollich, V., Griffiths-
Jones, S., Khanna, A., Marshall, M., Moxon, S., Sonnhammer, E.,
et al. (2004). The pfam protein families database. Nucleic Acids
Res. 32, D138–D141.
Brunger, A. (1992). X-PLOR version 3.1: a system for X-ray crystal-
lography and NMR (New Haven, CT: Yale University Press).
Brunger, A.T., Adams, P.D., Clore, G.M., DeLano, W.L., Gros, P.,
Grosse-Kunstleve, R.W., Jiang, J.-S., Kuszewski, J., Nilges, M.,
Pannu, N.S., et al. (1998). Crystallography & NMR system: a new
software suite for macromolecular structure determination. Acta
Crystallogr. D Biol. Crystallogr. 54, 905–921.
Chen, H., Legault, P., Glushka, J., Omichinski, G., and Scott, R.
(2000). Structure of a Cys3His zinc ribbon, a ubiquitous motif in
archaeal and eucaryal transription. Protein Sci. 9, 1743–1752.
Cox, A., and Der, C. (2003). The dark side of Ras: regulation of apo-
ptosis. Oncogene 22, 8999–9006.
Cutler, R., Jr., Stephens, R., Saracino, M., and Morrision, D. (1998).
Autoregulation of the Raf-1 serine/threonine kinase. Proc. Natl.
Acad. Sci. USA 95, 9214–9219.
Dumas, J., Merithew, E., Sudharshan, E., Rajamani, D., Hayes, S.,
Lawe, D., Corvera, S., and Lambright, D. (2001). Multivalent endo-
some targeting by homodimeric EEA1. Mol. Cell 8, 947–958.
Essman, U., Perera, L., Berkowitz, M., Darden, T., Lee, H., and Ped-
ersen, L. (1995). A smooth particle mesh ewald method. J. Chem.
Phys. 103, 8577–8593.
Feig, L., and Buchsbaum, R. (2002). Cell signaling: life or death de-
cisions of Ras proteins. Curr. Biol. 12, R259–R261.
Gillooly, D., Morrow, I., Lindsay, M., Gould, R., Bryant, N., Gaullier,
J.-M., Parton, R., and Stenmark, H. (2000). Localization of phospha-
tidylinositol 3-phosphate in yeast and mammalian cells. EMBO J. 19,
4577–4588.
Gronwald, W., Huber, F., Grunewald, P., Sporner, M., Wohlgemuth,
S., Herrmann, C., and Kalbitzer, H. (2001). Solution structure of the
Ras binding domain of the protein kinase Byr2 from Schizosacchar-
omyces pombe. Structure 9, 1029–1041.
Guex, N., and Peitsch, M. (1997). SWISS-MODEL and the Swiss-
PdbViewer: an environment for comparative protein modeling. Elec-
trophoresis 18, 2714–2723.
Herrmann, C., Horn, G., Spaargaren, M., and Wittinghofer, A. (1996).
Differential interaction of the Ras family GTP-binding proteins
H-Ras, Rap1A, and R-Ras with the putative effector molecules Ras
kinase and Ral-guanine nucleotide exchange factor. J. Biol. Chem.
271, 6794–6800.
Holm, L., and Sander, C. (1993). Protein structure comparison by
alignment of distance matices. J. Mol. Biol. 233, 123–138.
Hu, C.-D., Kariya, K.-I., Tamada, M., Akasaka, K., Shirouzu, M.,
Yokoyama, S., and Kataoka, T. (1995). Cysteine-rich region of
Raf-1 interacts with activator domain of posttranslationnally mod-
ified Ha-Ras. J. Biol. Chem. 270, 30274–30277.
Hurley, J., and Misra, S. (2000). Signaling and subcellular targeting
by membrane-binding domain. Annu. Rev. Biophys. Biomol. Struct.
29, 50–79.
Jung, J., and Lee, B. (2000). Protein structure alignment using envi-
ronmental profiles. Protein Eng. 13, 535–543.
Kai, L., Torchia, D., and Bax, A. (1989). Backbone dynamics of pro-
teins as studied by 15N inverse detected heteronuclear NMR spec-
troscopy: application to staphyloccal nuclase. Biochemistry 28,
8972–8979.
Khokhlatchev, A., Rabizadeh, S., Xavier, R., Nedwidek, M., Chen, T.,
Zhang, X., Seed, B., and Avruch, J. (2002). Identification of a novel
Ras-regulated proapoptotic pathway. Curr. Biol. 12, 253–265.
Koradi, R., Billeter, M., and Wuthrich, K. (1996). MOLMOL: a program
for display and analysis of macromolecular structures. J. Mol.
Graph. 14, 51–55.
Krieger, E. (2003). YASARA (www.yasara.org/sd).
Krieger, E., Koraimann, G., and Vriend, G. (2002). Increasing the pre-
cision of comparative models with YASARA NOVA -a self-parame-
terizing force field. Proteins 47, 393–402.
Krieger, E., Darden, T., Nabuurs, S., Finkelstein, A., and Vriend, G.
(2004). Making optimal use of empirical energy functions: force field
parameterization in crystal space. Proteins 57, 678–683.

Structure888
Kuszewski, J., and Clore, G. (2000). Source of and solutions to prob-
lems in the refinement of protein NMR structures against torsion an-
gle potentials of mean force. J. Magn. Reson. 146, 249–254.
Laskowski, R., MacArthur, M., and Thornton, D.M.J. (1993). Pro-
check: a program to check the stereochemical quality of protein
structures. J. Appl. Crystallogr. 26, 283–291.
Lenzen, C., Cool, R., and Wittinghofer, A. (1995). Analysis of intrinsic
and CDC25-stimulated guanine nucleotide exchange of p21ras-
nucleotide complex by fluorescence measurements. Methods Enzy-
mol. 255, 95–105.
Medkova, M., and Cho, W. (1999). Interplay of C1 and C2 domains of
protein kinase C-a in its membrane binding and activation. J. Biol.
Chem. 274, 19852–19861.
Misra, S., and Hurley, J. (1999). Crystal structure of a phosphatidy-
linositol 3-phosphatespecific membrane-targeting motif, the FYVE
domain of Vsp27p. Cell 97, 657–666.
Mott, H., Carpenter, J., Zhong, S., Ghosh, S., Bell, M., and Campbell,
S. (1996). The solution structure of the Raf-1 cysteine-rich domain:
a novel Ras and phospholipid binding site. Proc. Natl. Acad. Sci.
USA 93, 8312–8317.
Ortiz-Vega, S., Khokhlatchev, A., Nedwidek, M., Zhang, X., Dam-
mann, R., Pfeifer, G., and Avruch, J. (2002). The putative tumor su-
pressor RASSF1A homodimerizes and heterodimerizes with the
Ras-GTP binding protein Nore1. Oncogene 21, 1381–1390.
Praskova, M., Khoklatchev, A., Ortiz-Vega, S., and Avruch, J. (2004).
Regulation of the MST1 kinase by autophosphorylation, by the inhib-
itory proteins, RASSF1 and NORE1, and by ras. Biochem. J. 381,
453–462.
Radziwill, G., Erdmann, R.A., Margelisch, U., and Moelling, K. (2003).
The Bcr kinase downregulates Ras signaling by phosphorylating AF-
6 and binding to its PDZ domain. Mol. Cell. Biol. 23, 4663–4672.
Shields, J., Pruitt, K., McFall, A., Shaub, A., and Der, C. (2000). Un-
derstanding Ras: ‘it ain’t over ‘til it’s over.’ Trends Cell Biol. 10,
147–154.
Vavvas, D., Li, X., Avruch, J., and Zhang, X. (1998). Identification of
Nore1 as a potential Ras effector. J. Biol. Chem. 273, 5439–5442.
Xu, R., Pawelczyk, T., Xia, T.-H., and Brown, S. (1997). NMR struc-
ture of a protein kinase c-phorbol-binding domain and study of pro-
tein-lipid micelle interactions. Biochemistry 36, 10709–10717.
Yau, W.-M., Wimley, W., Gawrisch, K., and White, S. (1998). The pref-
erence of tryptophan for membrane interfaces. Biochemistry 37,
14713–14718.
Zhang, G., Kayanietz, M., Blumberg, P., and Hurley, J. (1995). Crystal
structure of the Cys2 activator-binding domain of protein kinase Cd
in complex with phorbol ester. Cell 81, 917–924.
Accession Numbers
The corresponding coordinates have been deposited in the
Research Collaboration for Structural Bioinformatics Protein Data
Bank with accession code 2FNF.