guidance for standardising quantitative indicators …...iv guidance for standardising quantitative...
TRANSCRIPT
Guidance for standardising quantitative indicators of impact within REF case studiesSarah Parks, Becky Ioppolo, Martin Stepanek, Salil Gunashekar
For more information on this publication, visit www.rand.org/t/RR2463
© Copyright 2018 Research England
This report was commissioned by the research and knowledge exchange directorate of the former HEFCE, whose research and knowledge exchange staff and functions transferred to the newly created Research England. Research England is one of the nine councils of UK Research and Innovation (UKRI).
Published by the RAND Corporation, Santa Monica, Calif., and Cambridge, UK
R® is a registered trademark.
RAND Europe is a not-for-profit research organisation that helps to improve policy and decision making through research and analysis. RAND’s publications do not necessarily reflect the opinions of its research clients and sponsors.
All rights reserved. No part of this book may be reproduced in any form by any electronic or mechanical means (including photocopying, recording, or information storage and retrieval) without permission in writing from the sponsor.
Support RAND Make a tax-deductible charitable contribution at www.rand.org/giving/contribute
www.rand.org
www.randeurope.org
i
The Higher Education Funding Council for England (HEFCE),1 on behalf of the four UK higher education funding bodies, asked RAND Europe to (i) identify quantitative indicators used as evidence of impact in the case studies submitted to the Research Excellence Framework (REF) 2014; and (ii) develop guidance for how these indicators could be standardised for potential use in REF 2021. This report articulates ways in which the use of quantitative indicators of impact can be standardised to contribute to the guidance for the preparation of impact case studies for REF 2021. A more standardised ‘reporting structure’ of quantitative impact indicators will increase the ease of conducting any post-REF analysis of the data. This would enable more detailed analyses of the data to demonstrate evidence of the impact of academic research in the UK to a broad range of stakeholders.
In particular, the report proposes guidance for two broad categories of standards. First, a ‘style guide’ is proposed containing general stylistic items that could be standardised in order to make quantitative indicators of impact – and specific formulations of them – more discoverable in general. Second, ‘specific guidance’ is presented which addresses more specific and commonly occurring quantitative indicators that have been used as evidence of impact in the REF 2014 case studies. It is important to note that this study does not judge the validity or relative value of the quantitative impact indicators presented in the REF 2014 case studies.
Both sets of guidance presented in this report are intended to inform the development of the guidance and criteria for the preparation of impact case studies in REF 2021. In addition, the analysis may be of interest to other stakeholders seeking to better understand how to articulate the impact of research and, more broadly, to anyone interested in research assessment, the REF, and the wider impact of university research.
The guidance presented in this report is primarily based on an analysis of the non-redacted impact case studies that were submitted by UK higher education institutions to REF 2014. The analysis was carried out over a nine-week period using a mixed-methods approach that involved a blend of text mining and qualitative methods.
1 HEFCE’s research and knowledge exchange staff and functions have now transferred to the newly created Research England. Research England is one of the nine councils of UK Research and Innovation (UKRI).
Preface
ii Guidance for standardising quantitative indicators of impact within REF case studies
RAND Europe is a not-for-profit policy research organisation that helps to improve policy and decision making in the public interest, through research and analysis.2 RAND Europe’s clients include European governments, institutions, NGOs and firms with a need for rigorous, independent, multi-disciplinary analysis.
For more information about this report or RAND Europe, please contact:
Dr Sarah Parks and Dr Salil Gunashekar RAND Europe Westbrook Centre, Milton Road Cambridge CB4 1YG United Kingdom Telephone: +44 (1223) 353 329 E-mail: [email protected], [email protected]
2 For more information on RAND Europe, please see http://www.randeurope.org.
iii
Executive Summary
Background and contextThe Research Excellence Framework (REF), first conducted in 2014, is a system for assessing the quality of research in UK higher education institutions (HEIs). REF 2014 demonstrated that research conducted by universities can lead to impact beyond academia – for example, on society, the economy, public policy, and health – both for individuals and organisations, within the UK and beyond. In REF 2014, HEIs were invited to submit illustrations of impact as case studies. The combination of a compelling narrative to describe the impact, the underpinning research, and citations of evidence to corroborate the impact was seen as a ‘workable approach’ to describe these nuanced relationships (Manville et al. 2015). Accordingly, in REF 2021, impact will continue to be assessed through the use of case studies (REF 2017).3
Aims of the studyIn September 2017, a document was published outlining initial decisions taken on several aspects of REF 2021, including the impact element of the exercise (REF 2017). It was noted that guidance will be developed for standardising the use of quantitative data as evidence of impact within REF 2021 case studies. Against this backdrop, RAND Europe was commissioned by HEFCE,4 on behalf of the four UK higher education funding bodies,5 to (i) identify quantitative indicators of impact in the case studies submitted to REF 2014; and (ii) develop guidance for how these indicators could be standardised for potential use in REF 2021. A more standardised ‘reporting structure’ of quantitative impact indicators will increase the ease of conducting any post-REF analysis of the data. This would enable more detailed analyses of the data to demonstrate evidence of the impact of academic research in the UK to a broad range of stakeholders.
3 Impact(specificallytheimpacttemplate)willalsobeincludedintheenvironmentelementoftheassessment (REF 2017).
4 HEFCE’s research and knowledge exchange staff and functions have now transferred to the newly created Research England. Research England is one of the nine councils of UK Research and Innovation (UKRI).
5 ThefourUKhighereducationfundingbodiesareResearchEngland(formerlyHEFCE),theScottishFundingCouncil,the Higher Education Funding Council for Wales, and the Department for the Economy, Northern Ireland.
iv Guidance for standardising quantitative indicators of impact within REF case studies
Research approachWe adopted a mixed-methods approach to address the study objectives. This involved a blend of text mining and qualitative techniques. The study was conducted over a nine-week period through five main tasks, as follows:
• A rapid review of the literature to understand the different types of quantitative indicators that might be used in case studies to help inform our search of the REF 2014 case studies.
• Construction of a data set consisting of all sentences from the REF 2014 impact case studies that might contain quantitative indicators of impact6 and analysis of this data set to identify different types of impact indicators and the variety of formulations used when describing them.
• An internal workshop to identify areas for potential standardisation and the corresponding standards themselves, both for particular quantitative indicators of impact, and those that would apply across indicators.
• Testing of the proposed guidance through a presentation and discussion with the REF Environment Working Group of the Forum for Responsible Research Metrics7 and interviews with senior individuals working within the higher education sector.
• Synthesis of the evidence and reporting.
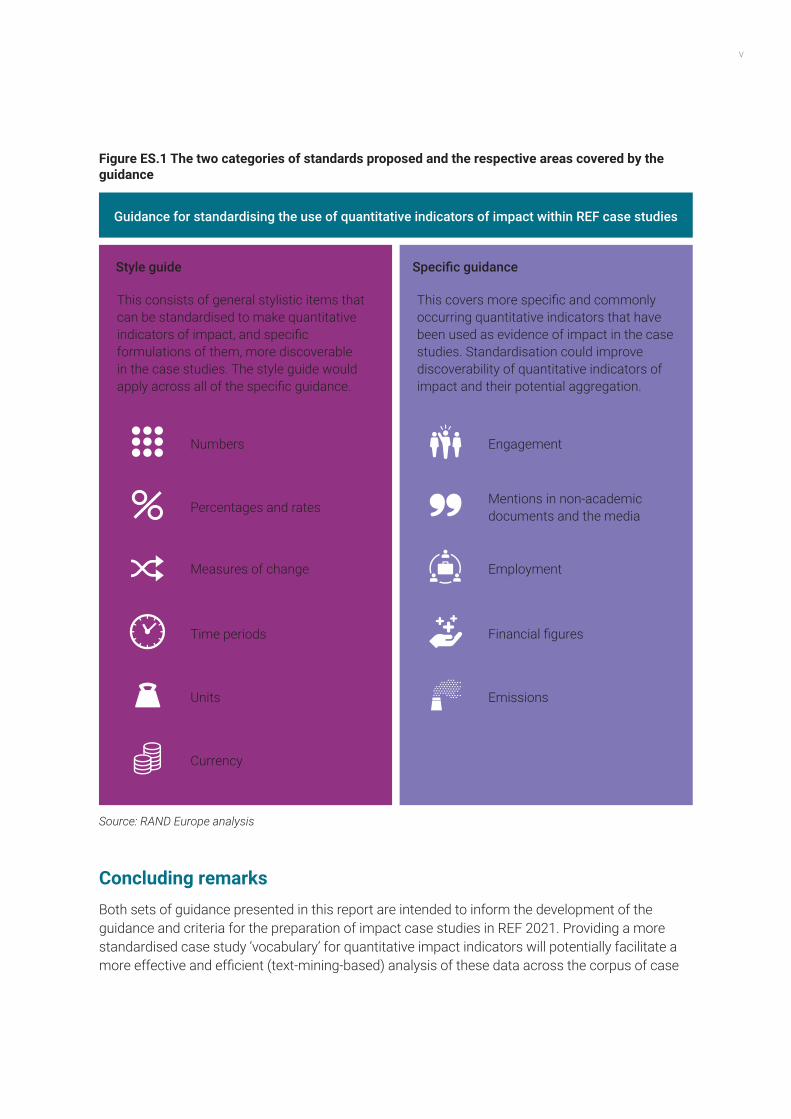
Guidance for standardisationWe propose guidance for two broad categories of standards. First, we outline a ‘style guide’ that contains general stylistic items that could be standardised in order to make quantitative indicators of impact, and specific formulations of them, more discoverable in the case studies in general. Second, we detail ‘specific guidance’ that addresses more specific and commonly occurring quantitative indicators that have been used as evidence of impact in the REF 2014 case studies. In Figure ES.1, we show a high-level illustration of these two categories of standards and the respective areas covered by the guidance. The guidance covered by the ‘style guide’ and the ‘specific guidance’ are discussed in detail in Chapters 2 and 3 of the report, respectively.
6 To construct this data set, we downloaded the full text of the ‘Details of Impact’ sections of the case studies from the onlineimpactcasestudydatabase(HEFCE2018).Thedataweredownloadedon8January2018.
7 TheForumforResponsibleResearchMetricswassetupin2016asa‘groupofresearchfunders,sectorbodiesandinfrastructureexperts[…]workinginpartnershiptopromotetheresponsibleuseofresearchmetrics’acrosstheUKresearch community (HEFCE 2016).
v
Figure ES.1 The two categories of standards proposed and the respective areas covered by the guidance
Source: RAND Europe analysis
Concluding remarksBoth sets of guidance presented in this report are intended to inform the development of the guidance and criteria for the preparation of impact case studies in REF 2021. Providing a more standardised case study ‘vocabulary’ for quantitative impact indicators will potentially facilitate a more effective and efficient (text-mining-based) analysis of these data across the corpus of case
Guidance for standardising the use of quantitative indicators of impact within REF case studies
Style guide
Numbers
Currency
Percentages and rates
Engagement
This consists of general stylistic items that can be standardised to make quantitative indicators of impact, and specific formulations of them, more discoverable in the case studies. The style guide would apply across all of the specific guidance.
This covers more specific and commonly occurring quantitative indicators that have been used as evidence of impact in the case studies. Standardisation could improve discoverability of quantitative indicators of impact and their potential aggregation.
Specific guidance
Measures of change
Time periods
Units
Mentions in non-academic documents and the media
Employment
Financial figures
Emissions
vi Guidance for standardising quantitative indicators of impact within REF case studies
studies that are submitted by UK HEIs in REF 2021 (e.g. in terms of making certain quantitative indicators of impact more easily discoverable). This would permit more efficient and detailed analyses of the data to demonstrate evidence of the wider impact of academic research in the UK.
It is important to bear in mind that this study does not judge the validity or relative value of the quantitative impact indicators presented in the REF 2014 case studies. Furthermore, the guidance we have proposed is not intended to be a comprehensive or definitive list of topics. When developing impact case studies for REF 2021, these standards should not be treated as exacting requirements or restrictions on what can be written per se. We recognise that the standards might not work in all instances and could, at times, result in the case study vocabulary becoming somewhat unwieldy. Finally, while the guidance helps to make quantitative indicators more discoverable within case studies, quantitative indicators should be used responsibly, taking into account the context as well as the numerical value, in line with the principles of use of metrics outlined in The Metric Tide (Wilsdon et al. 2015).
vii
Preface iBackground and context iiiAims of the study iii
Executive Summary iiiResearch approach ivGuidance for standardisation ivConcluding remarks v
Table of contents vii
List of figures ix
List of tables x
List of boxes x
List of abbreviations and acronyms xi
Acknowledgements xii
1. Introduction 11.1. Study context 11.2. Aims and scope of the study 21.3. Overview of research approach 21.4. Limitations of the approach 41.5. Analysis 41.6. Structure of this report 8
2. Using a ‘style guide’ to standardise quantitative indicators of impact 92.1. Numbers 102.2. Percentages and rates 112.3. Measures of change 112.4. Time periods 122.5. Units 132.6. Currency 14
3. Using ‘specific guidance’ to standardise quantitative indicators of impact 153.1. Engagement 16
Table of contents
viii Guidance for standardising quantitative indicators of impact within REF case studies
3.2. Mentions in non-academic documents and the media 173.3. Employment 183.4. Financial figures 183.5. Emissions 19
4. Concluding remarks 21
References 23
Appendix A. Detailed methodology 25A.1. Rapid review of the literature 26A.2. Construction and analysis of the quantitative impact indicator data set 26A.3. Internal workshop to identify areas for potential standardisation 36A.4. Testing of the proposed standards 39A.5. Synthesis of evidence and reporting 40
ix
Figure ES.1 The two categories of standards proposed and the respective areas covered by the guidance v
Figure 1.1 Schema illustrating the research approach 3
Figure 1.2 Schema illustrating steps involved in constructing and analysing the data set 5
Figure 1.3 The two categories of standards proposed and the respective areas covered by the guidance 7
Figure A.1 Schema illustrating the research approach 25
Figure A.2 Schema illustrating steps involved in constructing and analysing the data set 27
List of figures
x Guidance for standardising quantitative indicators of impact within REF case studies
List of tables
List of boxes
Table 1.1 Rationale for standardisation 6
Table 1.2 Key rationales used for selecting the areas of standardisation and developing the standards themselves 8
Table A.1 Distribution of REF impact case studies across the individual UOAs 28
Table A.2 Number of sentences containing numerical data by main panel 30
Table A.3 Number of sentences containing numerical data by UOA 30
Table A.4 Classification of reviewed sentences by main panel 31
Table A.5 Classification of reviewed sentences by UOA 32
Table A.6 Breakdown of indicators identified in each category 33
Table A.7 Breakdown of indicators identified in each category by main panel 34
Table A.8 Breakdown of indicators identified in each category by UOA 35
Table A.9 Rationale for standardisation 36
Table A.10 Key rationales used for selecting the areas of standardisation and developing the standards themselves 37
Table A.11 Detailed exemplary rationale for selected areas of proposed guidance 38
Box 1 Areas of standardisation covered by the ‘style guide’ 9
Box 2 Areas of standardisation covered by the ‘specific guidance’ 15
xi
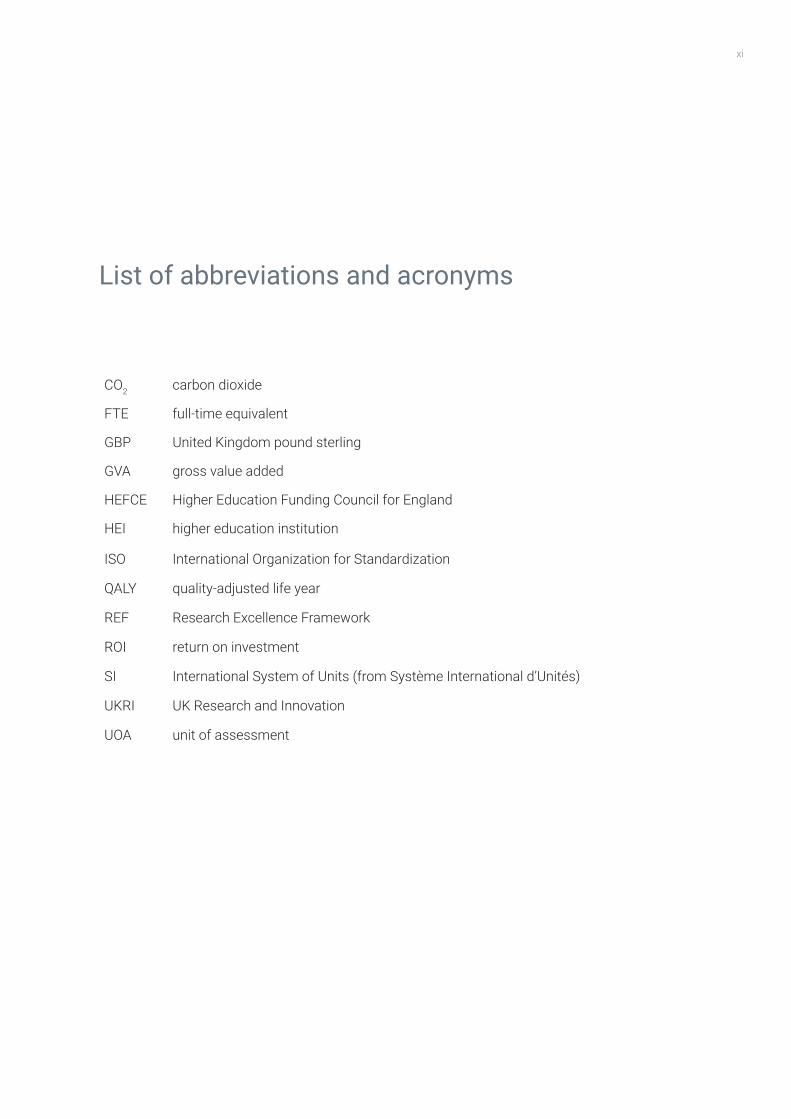
List of abbreviations and acronyms
CO2 carbon dioxide
FTE full-time equivalent
GBP United Kingdom pound sterling
GVA gross value added
HEFCE Higher Education Funding Council for England
HEI higher education institution
ISO International Organization for Standardization
QALY quality-adjusted life year
REF Research Excellence Framework
ROI return on investment
SI International System of Units (from Système International d’Unités)
UKRI UK Research and Innovation
UOA unit of assessment
xii Guidance for standardising quantitative indicators of impact within REF case studies
We have been able to carry out this study because of the support of a number of individuals. First, we would like to thank HEFCE, in particular Catriona Firth, Kim Hackett, Geoff Hill and Steven Hill, for their helpful advice and guidance throughout the project. We would also like to acknowledge the useful insights and feedback provided by members of the REF Environment Working Group of the Forum for Responsible Research Metrics. They helped to ‘stress test’ many of our findings. We are grateful to the following individuals who gave us their time and kindly agreed to be consulted as part of this study: Maria Delgado (The Royal Central School of Speech and Drama, University of London), Elizabeth Gadd (Loughborough University), Anna Grey (University of York), Jon Freeman (RAND Europe), Jon Sussex (RAND Europe), Ludo Waltman (Centre for Science and Technology Studies (CWTS), Leiden University), and Evelyn Welch (King’s College London). We particularly appreciate the valuable input and support provided by our Quality Assurance reviewers at RAND Europe, Dr Advait Deshpande and Dr Susan Guthrie. In addition, we would like to thank Jessica Plumridge (RAND Europe) for helping to lay out the report. Finally, we would like to thank Suzanne Needs for copy-editing the report.
Acknowledgements
1
1.1. Study contextThe Research Excellence Framework (REF), first conducted in 2014, is a system for assessing the quality of research in UK higher education institutions (HEIs). REF 2014 demonstrated that research conducted by universities can lead to impact beyond academia – for example, on society, the economy, public policy, and health – both for individuals and organisations, within the UK and beyond. The benefits of assessing wider impact can be usefully summarised around four ‘A’s’, namely, accountability, advocacy, analysis and allocation (Morgan Jones & Grant 2013). Assessing impact provides evidence that academic research should continue to be funded and is directly benefitting the taxpayers who fund it. Once impacts are captured, they can be further analysed to discover best practice and efficiencies in research funding.
In REF 2014, HEIs were asked to submit illustrations of impact as case studies. The combination of a compelling narrative to describe the impact, the underpinning research, and citations of evidence to corroborate the impact was seen as a ‘workable approach’ to describe these nuanced relationships (Manville et al. 2015). Accordingly, in REF 2021, impact will continue to be assessed through the use of case studies (REF 2017).8
The case study exercise in REF 2014 also provided an opportunity for a preliminary assessment of the overall impact of UK HEIs’ research. Following REF 2014, a text-mining analysis was carried out on the body of impact case studies (King’s College London and Digital Science 2015). The study demonstrated that there were about 70,000 instances of quantitative data (excluding dates) mentioned in the impact case studies.9 However, analyses across the case studies were challenging because data were not presented in a systematic or standardised format. Measurements were described using a variety of units (such as different currencies), and not all uses of quantitative information were related to impact (such as reporting on the size of a population with a disease), thus making return-on-investment-type estimates (for example) via text mining unfeasible (King’s College London and Digital Science 2015).
8 Impact(specificallytheimpacttemplate)willalsobeincludedintheenvironmentelementoftheassessment(REF2017).
9 AsearchableonlinedatabasewascreatedfollowingREF2014tomaketheimpactcasestudiespubliclyavailable(HEFCE2018).
Introduction1
2 Guidance for standardising quantitative indicators of impact within REF case studies
In September 2017, HEFCE,10 on behalf of the four UK higher education funding bodies,11 published a document outlining initial decisions taken on various high-level aspects of REF 2021, including the impact element of the exercise (REF 2017). The document noted that guidelines would be developed for standardising the use of quantitative data as evidence of impact within REF 2021 case studies. A more standardised ‘reporting structure’ of quantitative impact indicators could increase the ease of conducting any post-REF analysis of the data (e.g. in terms of aggregating quantitative information across case studies). This would enable demonstration of evidence of the impact of academic research in the UK to a broad range of stakeholders.
1.2. Aims and scope of the studyThis study, commissioned by the Higher Education Funding Council for England (HEFCE) on behalf of the four UK higher education funding bodies, had two specific aims:
• To identify quantitative indicators used as evidence of impact in the case studies submitted to the Research Excellence Framework (REF) 2014; and
• To develop guidance for how these indicators could be standardised for potential use in REF 2021.
The guidance presented in this report is intended to inform the development of the guidance and criteria for the preparation of impact case studies in REF 2021. However, the analysis may also be of interest to other stakeholders associated with the higher education sector seeking to better understand how to articulate the impact of research and, more broadly, to anyone interested in research assessment, the REF, and the wider impact of research beyond academia.
We focus on a specific subset of quantitative indicators of impact used in the REF 2014 case studies. However, it is important to note that the study does not judge the validity or relative value of these quantitative impact indicators. In addition, the study does not attempt to propose standards for the use of qualitative data related to impact.
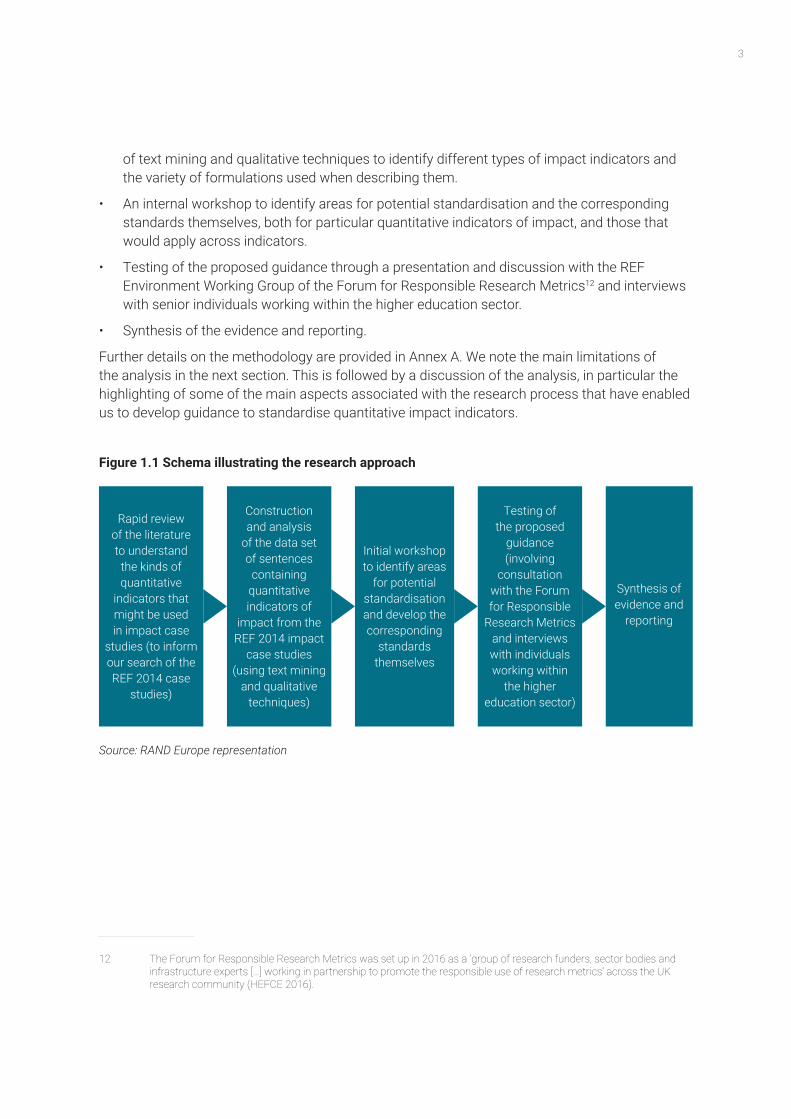
1.3. Overview of research approachThe study was conducted over a nine-week period through five primary tasks, as illustrated in Figure 1.1. We adopted a mixed-methods approach that involved a blend of text mining and qualitative techniques. The main tasks involved in the work were:
• A rapid review of the literature to develop an understanding of the kinds of quantitative indicators that might be used in impact case studies to inform our search of the REF 2014 case studies.
• Construction of a data set containing all sentences from the REF 2014 impact case studies that might contain quantitative indicators of impact and analysis of this data set using a mix
10 HEFCE’s research and knowledge exchange staff and functions have now transferred to the newly created Research England. Research England is one of the nine councils of UK Research and Innovation (UKRI).
11 ThefourUKhighereducationfundingbodiesareResearchEngland(formerlyHEFCE),theScottishFundingCouncil,the Higher Education Funding Council for Wales, and the Department for the Economy, Northern Ireland.
3
of text mining and qualitative techniques to identify different types of impact indicators and the variety of formulations used when describing them.
• An internal workshop to identify areas for potential standardisation and the corresponding standards themselves, both for particular quantitative indicators of impact, and those that would apply across indicators.
• Testing of the proposed guidance through a presentation and discussion with the REF Environment Working Group of the Forum for Responsible Research Metrics12 and interviews with senior individuals working within the higher education sector.
• Synthesis of the evidence and reporting.
Further details on the methodology are provided in Annex A. We note the main limitations of the analysis in the next section. This is followed by a discussion of the analysis, in particular the highlighting of some of the main aspects associated with the research process that have enabled us to develop guidance to standardise quantitative impact indicators.
12 TheForumforResponsibleResearchMetricswassetupin2016asa‘groupofresearchfunders,sectorbodiesandinfrastructureexperts[…]workinginpartnershiptopromotetheresponsibleuseofresearchmetrics’acrosstheUKresearch community (HEFCE 2016).
Figure 1.1 Schema illustrating the research approach
Source: RAND Europe representation
Rapid review of the literature to understand
the kinds of quantitative
indicators that might be used in impact case
studies (to inform our search of the REF 2014 case
studies)
Construction and analysis
of the data set of sentences
containing quantitative indicators of
impact from the REF 2014 impact
case studies (using text mining
and qualitative techniques)
Initial workshop to identify areas
for potential standardisation and develop the corresponding
standards themselves
Testing of the proposed
guidance (involving
consultation with the Forum for Responsible
Research Metrics and interviews with individuals working within
the higher education sector)
Synthesis of evidence and
reporting
4 Guidance for standardising quantitative indicators of impact within REF case studies
1.4. Limitations of the approachThere are some important caveats to our approach that should be borne in mind when interpreting the analysis presented in this report. First, the study is not intended to define what impact is, nor how it should be evidenced. We focus exclusively on quantitative indicators that were used as evidence of impact in the case studies submitted to REF 2014, and we do not propose standards for the use of qualitative data related to impact. Furthermore, the analysis is based on quantitative indicators of impact that have been written out in numerical format in the case studies; impact indicators that have been written out in words but which could imply quantitative impact in terms of reach and/or significance are not captured in our analysis (e.g. ‘seven schools’; ‘all countries in Europe’).
The guidance that we have developed is not intended to be exhaustive or definitive. It does not cover all possible types of quantitative indicators of impact; the areas of standardisation and the corresponding standards are primarily based on the most commonly occurring quantitative impact indicators identified across the non-redacted REF 2014 case studies. The research approach had to be designed and implemented within a very short period of time (nine weeks). We relied on a mix of text mining and qualitative techniques to identify and analyse sentences containing quantitative impact indicators. By necessity, during the analysis phase, we manually examined a subset of these sentences. With more time available, we would have been able to inspect more sentences and therefore, potentially, propose additional areas for standardisation. However, we mitigated against ‘missing’ important standardisation topics to some extent by testing the proposed standards through consultation and interviews with experts.
Finally, even when using the proposed guidance, there may still be challenges in identifying impact-related data, as some of the data may relate to context instead of evidence of impact. For example, a sentence containing sales data could either describe a particular market (e.g. ‘porridge sales are £40 million putting the UK market for hot oat cereals at over £160 million’) or directly refer to the money made from sales due to a particular product impacted on by the underpinning research (e.g. ‘this amounts to more than $137million in sales for Medtronic since 2008’).
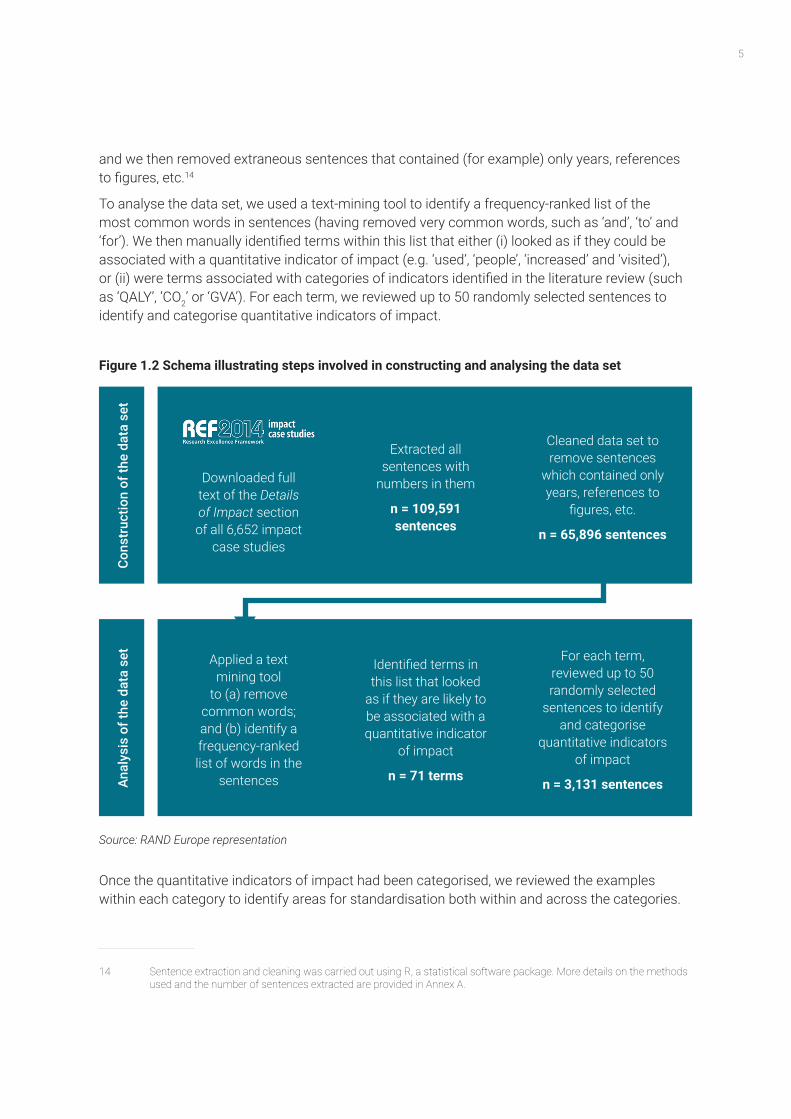
1.5. AnalysisThis section describes some of the key aspects related to the process involved in carrying out the analysis. Where appropriate, we have highlighted the main results associated with the analysis that have helped to inform the development of the proposed standards.
A schematic diagram illustrating the main steps involved in constructing and analysing the data set is shown in Figure 1.2 (more detailed information on the methods involved in this process is provided in Annex A). To construct a data set of sentences containing quantitative indicators of impact, we downloaded the full text of the ‘Details of Impact’ sections of the case studies from the online impact case study database.13 We extracted all of the sentences with numbers in them,
13 Thedataweredownloadedfromtheimpactcasestudydatabase(HEFCE2018)on8January2018.
5
and we then removed extraneous sentences that contained (for example) only years, references to figures, etc.14
To analyse the data set, we used a text-mining tool to identify a frequency-ranked list of the most common words in sentences (having removed very common words, such as ‘and’, ‘to’ and ‘for’). We then manually identified terms within this list that either (i) looked as if they could be associated with a quantitative indicator of impact (e.g. ‘used’, ‘people’, ‘increased’ and ‘visited’), or (ii) were terms associated with categories of indicators identified in the literature review (such as ‘QALY’, ‘CO2’ or ‘GVA’). For each term, we reviewed up to 50 randomly selected sentences to identify and categorise quantitative indicators of impact.
14 Sentence extraction and cleaning was carried out using R, a statistical software package. More details on the methods usedandthenumberofsentencesextractedareprovidedinAnnexA.
Figure 1.2 Schema illustrating steps involved in constructing and analysing the data set
Source: RAND Europe representation
Once the quantitative indicators of impact had been categorised, we reviewed the examples within each category to identify areas for standardisation both within and across the categories.
Cons
truc
tion
of th
e da
ta s
etAn
alys
is o
f the
dat
a se
t
Extracted all sentences with
numbers in them
n = 109,591 sentences
Identified terms in this list that looked
as if they are likely to be associated with a quantitative indicator
of impact
n = 71 terms
Cleaned data set to remove sentences
which contained only years, references to
figures, etc.
n = 65,896 sentences
For each term, reviewed up to 50 randomly selected
sentences to identify and categorise
quantitative indicators of impact
n = 3,131 sentences
Downloaded full text of the Details of Impact section of all 6,652 impact
case studies
Applied a text mining tool
to (a) remove common words; and (b) identify a frequency-ranked list of words in the
sentences

6 Guidance for standardising quantitative indicators of impact within REF case studies
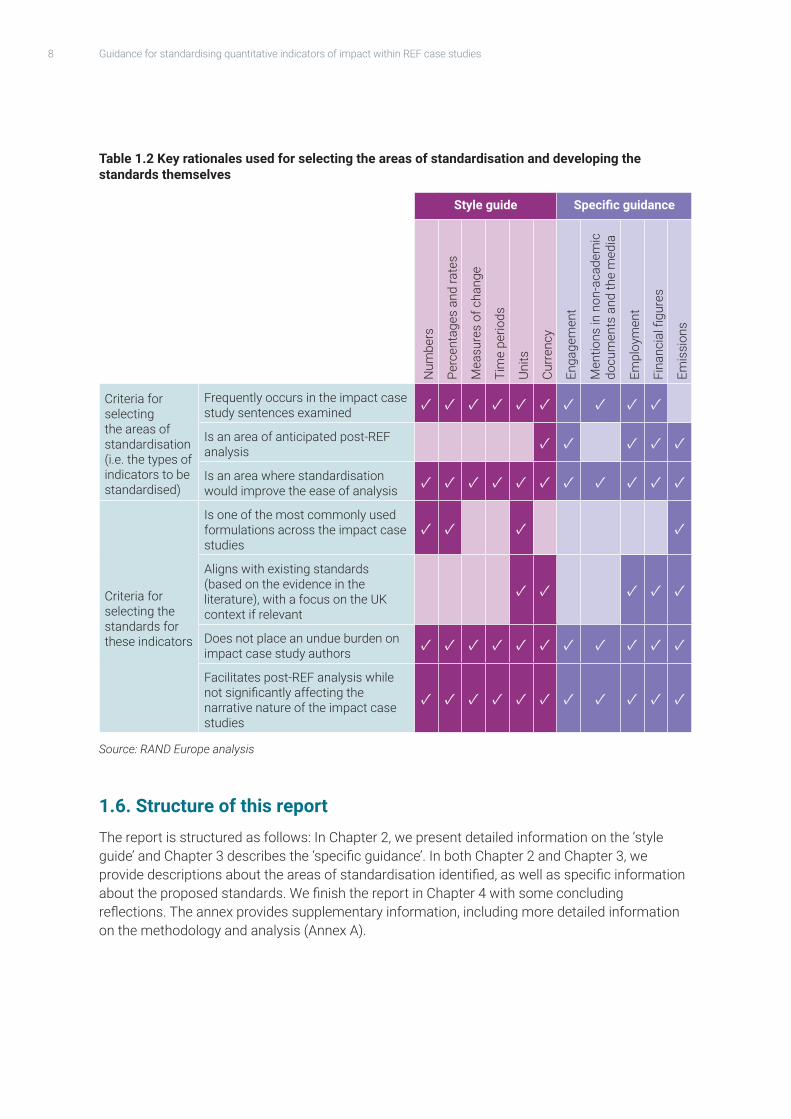
We used a specific set of criteria to select the areas of standardisation and to develop the standards themselves (Table 1.1).
Table 1.1 Rationale for standardisation
Criteria for selecting the areas of standardisation (i.e. the types of indicators to be standardised)
Frequently occurs in the impact case study sentences examined
Is an area of anticipated post-REF analysis
Is an area where standardisation would improve the ease of analysis
Criteria for selecting the standards for these indicators
Is one of the most commonly used formulations across the impact case studies
Aligns with existing standards (based on evidence in the literature), with a focus on the UK context if relevant
Does not place an undue burden on impact case study authors
Facilitates post-REF analysis while not significantly affecting the narrative nature of the impact case studies
Source: RAND Europe analysis
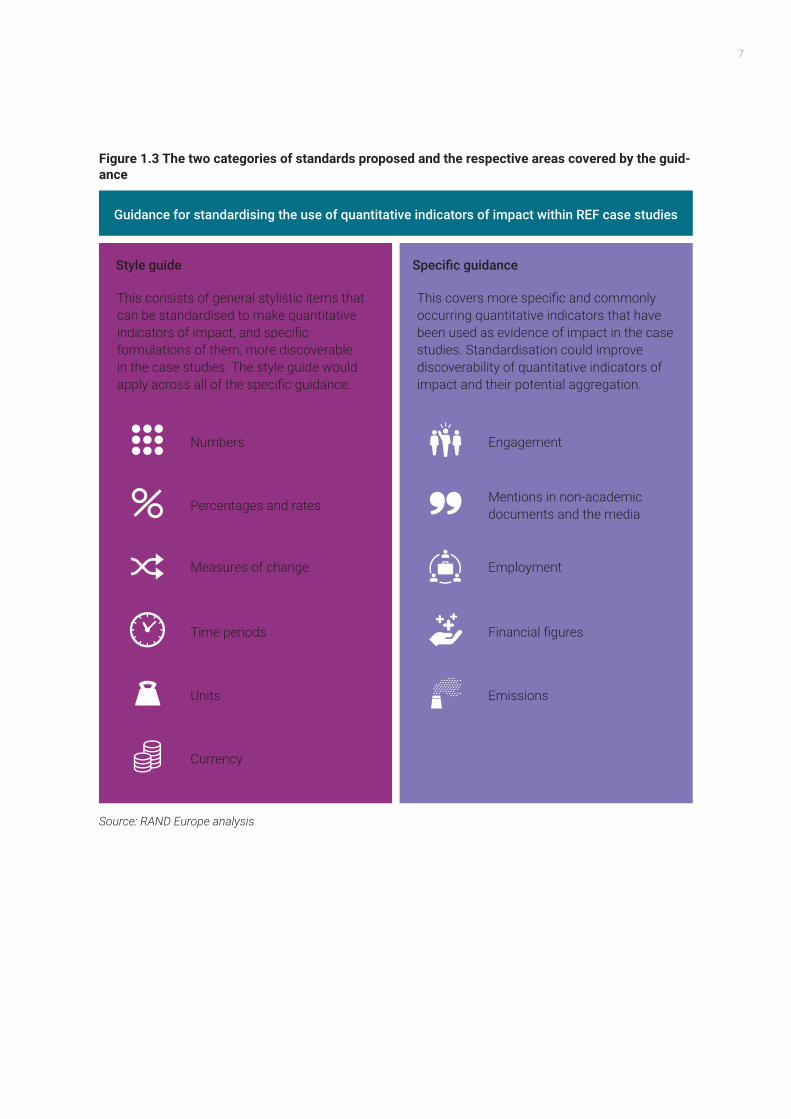
Finally, we tested the proposed guidance through a presentation and discussion with the REF Environment Working Group of the Forum for Responsible Research Metrics and interviews with senior individuals working within the higher education sector. Key points raised during these consultations are discussed in Annex A.4. On the basis of our analysis, we have proposed guidance for two broad categories of standards. In Figure 1.3, we show a high-level illustration of these two categories of standards and the respective areas covered by the guidance. First, we have developed a ‘style guide’ that contains stylistic items that could be standardised to make quantitative indicators of impact – and specific formulations of them – more discoverable across the case studies in general. Second, we have proposed some ‘specific guidance’ that addresses more specific and commonly occurring quantitative indicators that have been used as evidence of impact in the case studies. Table 1.2 sets out the key rationales for selecting the areas of standardisation and the specific standards themselves. The guidance for these two categories of standards (comprising the areas for standardisation and the corresponding standards themselves) are described in detail in Chapters 2 and 3, respectively.
7
Figure 1.3 The two categories of standards proposed and the respective areas covered by the guid-ance
Source: RAND Europe analysis
Guidance for standardising the use of quantitative indicators of impact within REF case studies
Style guide
Numbers
Currency
Percentages and rates
Engagement
This consists of general stylistic items that can be standardised to make quantitative indicators of impact, and specific formulations of them, more discoverable in the case studies. The style guide would apply across all of the specific guidance.
This covers more specific and commonly occurring quantitative indicators that have been used as evidence of impact in the case studies. Standardisation could improve discoverability of quantitative indicators of impact and their potential aggregation.
Specific guidance
Measures of change
Time periods
Units
Mentions in non-academic documents and the media
Employment
Financial figures
Emissions
8 Guidance for standardising quantitative indicators of impact within REF case studies
Table 1.2 Key rationales used for selecting the areas of standardisation and developing the standards themselves
Style guide Specific guidance
Num
bers
Perc
enta
ges
and
rate
s
Mea
sure
s of
cha
nge
Tim
e pe
riods
Units
Curr
ency
Enga
gem
ent
Men
tions
in n
on-a
cade
mic
do
cum
ents
and
the
med
ia
Empl
oym
ent
Fina
ncia
l figu
res
Emis
sion
s
Criteria for selecting the areas of standardisation (i.e. the types of indicators to be standardised)
Frequently occurs in the impact case study sentences examined
✓ ✓ ✓ ✓ ✓ ✓ ✓ ✓ ✓ ✓
Is an area of anticipated post-REF analysis
✓ ✓ ✓ ✓ ✓
Is an area where standardisation would improve the ease of analysis
✓ ✓ ✓ ✓ ✓ ✓ ✓ ✓ ✓ ✓ ✓
Criteria for selecting the standards for these indicators
Is one of the most commonly used formulations across the impact case studies
✓ ✓ ✓ ✓
Aligns with existing standards (based on the evidence in the literature), with a focus on the UK context if relevant
✓ ✓ ✓ ✓ ✓
Does not place an undue burden on impact case study authors
✓ ✓ ✓ ✓ ✓ ✓ ✓ ✓ ✓ ✓ ✓
Facilitates post-REF analysis while not significantly affecting the narrative nature of the impact case studies
✓ ✓ ✓ ✓ ✓ ✓ ✓ ✓ ✓ ✓ ✓
Source: RAND Europe analysis
1.6. Structure of this reportThe report is structured as follows: In Chapter 2, we present detailed information on the ‘style guide’ and Chapter 3 describes the ‘specific guidance’. In both Chapter 2 and Chapter 3, we provide descriptions about the areas of standardisation identified, as well as specific information about the proposed standards. We finish the report in Chapter 4 with some concluding reflections. The annex provides supplementary information, including more detailed information on the methodology and analysis (Annex A).
9
Using a ‘style guide’ to standardise quantitative indicators of impact
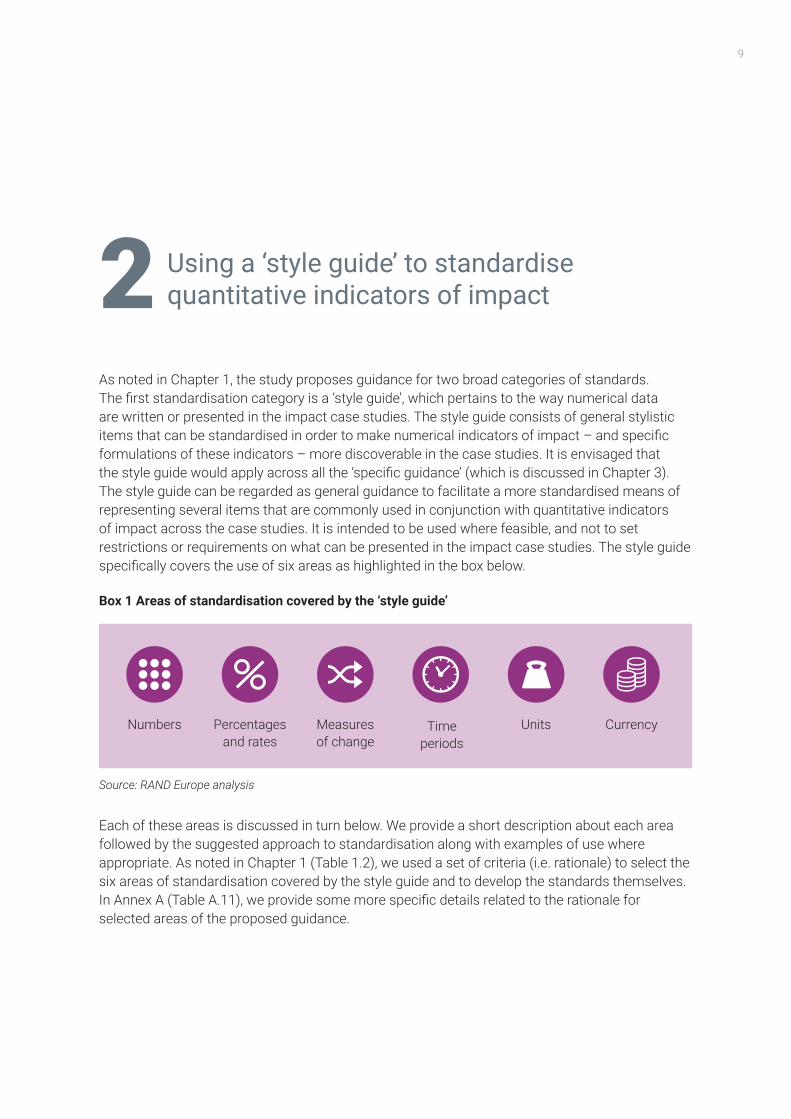
As noted in Chapter 1, the study proposes guidance for two broad categories of standards. The first standardisation category is a ‘style guide’, which pertains to the way numerical data are written or presented in the impact case studies. The style guide consists of general stylistic items that can be standardised in order to make numerical indicators of impact – and specific formulations of these indicators – more discoverable in the case studies. It is envisaged that the style guide would apply across all the ‘specific guidance’ (which is discussed in Chapter 3). The style guide can be regarded as general guidance to facilitate a more standardised means of representing several items that are commonly used in conjunction with quantitative indicators of impact across the case studies. It is intended to be used where feasible, and not to set restrictions or requirements on what can be presented in the impact case studies. The style guide specifically covers the use of six areas as highlighted in the box below.
Box 1 Areas of standardisation covered by the ‘style guide’
Source: RAND Europe analysis
Each of these areas is discussed in turn below. We provide a short description about each area followed by the suggested approach to standardisation along with examples of use where appropriate. As noted in Chapter 1 (Table 1.2), we used a set of criteria (i.e. rationale) to select the six areas of standardisation covered by the style guide and to develop the standards themselves. In Annex A (Table A.11), we provide some more specific details related to the rationale for selected areas of the proposed guidance.
2
Numbers CurrencyPercentages and rates
Measures of change
Time periods
Units
10 Guidance for standardising quantitative indicators of impact within REF case studies
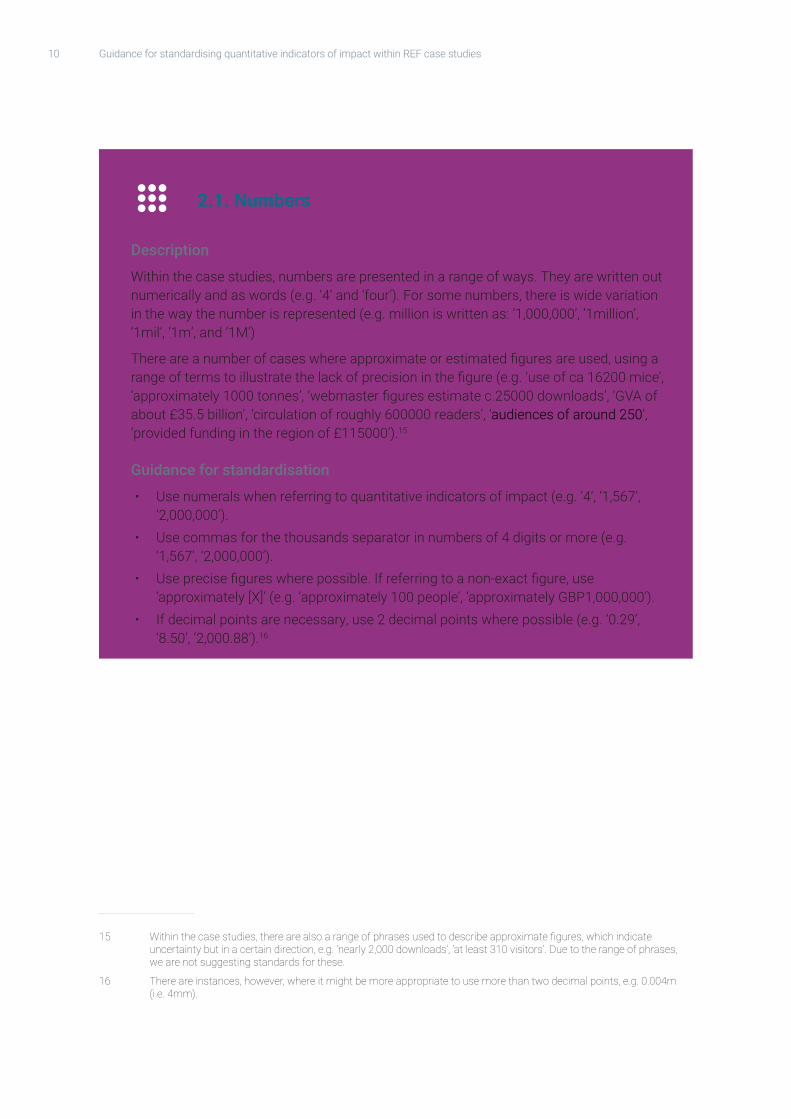
2.1. Numbers
Description
Within the case studies, numbers are presented in a range of ways. They are written out numerically and as words (e.g. ‘4’ and ‘four’). For some numbers, there is wide variation in the way the number is represented (e.g. million is written as: ‘1,000,000’, ‘1million’, ‘1mil’, ‘1m’, and ‘1M’)
There are a number of cases where approximate or estimated figures are used, using a range of terms to illustrate the lack of precision in the figure (e.g. ‘use of ca 16200 mice’, ‘approximately 1000 tonnes’, ‘webmaster figures estimate c.25000 downloads’, ‘GVA of about £35.5 billion’, ‘circulation of roughly 600000 readers’, ‘audiences of around 250’, ‘provided funding in the region of £115000’).15
Guidance for standardisation
• Use numerals when referring to quantitative indicators of impact (e.g. ‘4’, ‘1,567’, ‘2,000,000’).
• Use commas for the thousands separator in numbers of 4 digits or more (e.g. ‘1,567’, ‘2,000,000’).
• Use precise figures where possible. If referring to a non-exact figure, use ‘approximately [X]’ (e.g. ‘approximately 100 people’, ‘approximately GBP1,000,000’).
• If decimal points are necessary, use 2 decimal points where possible (e.g. ‘0.29’, ‘8.50’, ‘2,000.88’).16
15 Withinthecasestudies,therearealsoarangeofphrasesusedtodescribeapproximatefigures,whichindicateuncertaintybutinacertaindirection,e.g.‘nearly2,000downloads’,‘atleast310visitors’.Duetotherangeofphrases,we are not suggesting standards for these.
16 Thereareinstances,however,whereitmightbemoreappropriatetousemorethantwodecimalpoints,e.g.0.004m(i.e. 4mm).
11
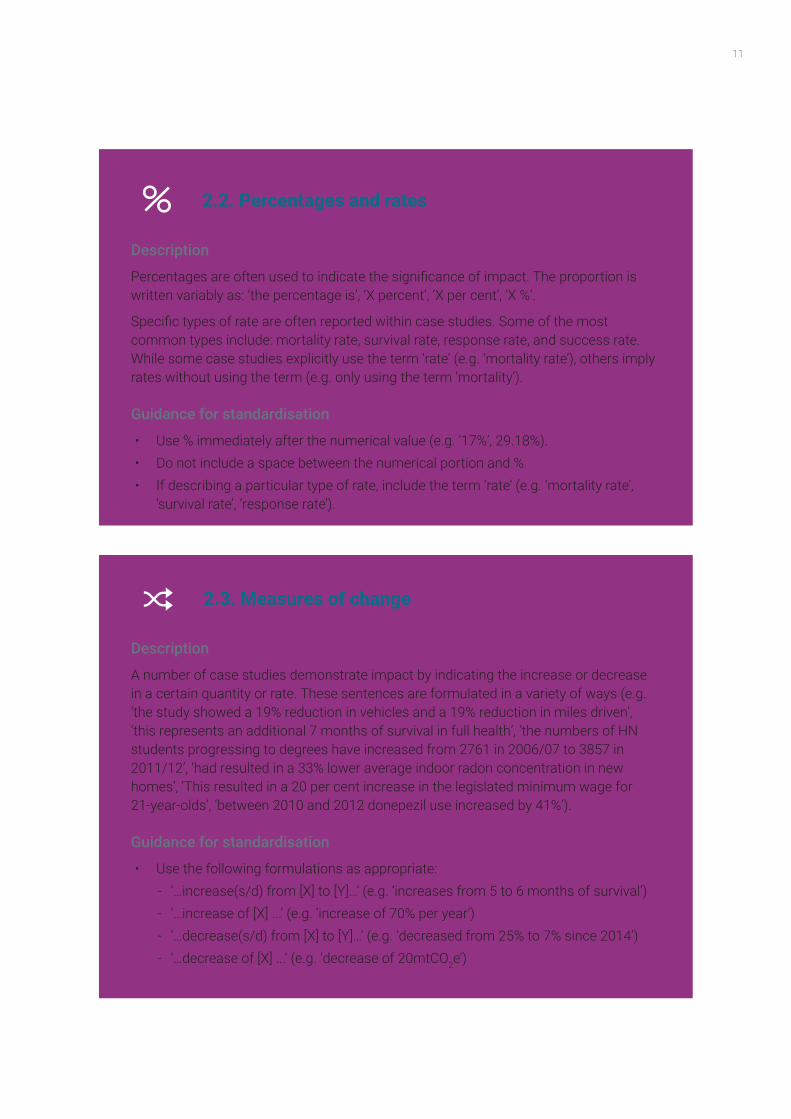
2.2. Percentages and rates
Description
Percentages are often used to indicate the significance of impact. The proportion is written variably as: ‘the percentage is’, ‘X percent’, ‘X per cent’, ‘X %’.
Specific types of rate are often reported within case studies. Some of the most common types include: mortality rate, survival rate, response rate, and success rate. While some case studies explicitly use the term ‘rate’ (e.g. ‘mortality rate’), others imply rates without using the term (e.g. only using the term ‘mortality’).
Guidance for standardisation
• Use % immediately after the numerical value (e.g. ‘17%’, 29.18%).• Do not include a space between the numerical portion and %.• If describing a particular type of rate, include the term ‘rate’ (e.g. ‘mortality rate’,
‘survival rate’, ‘response rate’).
2.3. Measures of change
Description
A number of case studies demonstrate impact by indicating the increase or decrease in a certain quantity or rate. These sentences are formulated in a variety of ways (e.g. ‘the study showed a 19% reduction in vehicles and a 19% reduction in miles driven’, ‘this represents an additional 7 months of survival in full health’, ‘the numbers of HN students progressing to degrees have increased from 2761 in 2006/07 to 3857 in 2011/12’, ‘had resulted in a 33% lower average indoor radon concentration in new homes’, ‘This resulted in a 20 per cent increase in the legislated minimum wage for 21-year-olds’, ‘between 2010 and 2012 donepezil use increased by 41%’).
Guidance for standardisation
• Use the following formulations as appropriate:- ‘…increase(s/d) from [X] to [Y]…’ (e.g. ‘increases from 5 to 6 months of survival’)- ‘…increase of [X] ...’ (e.g. ‘increase of 70% per year’)- ‘…decrease(s/d) from [X] to [Y]…’ (e.g. ‘decreased from 25% to 7% since 2014’)- ‘…decrease of [X] ...’ (e.g. ‘decrease of 20mtCO2e’)
12 Guidance for standardising quantitative indicators of impact within REF case studies
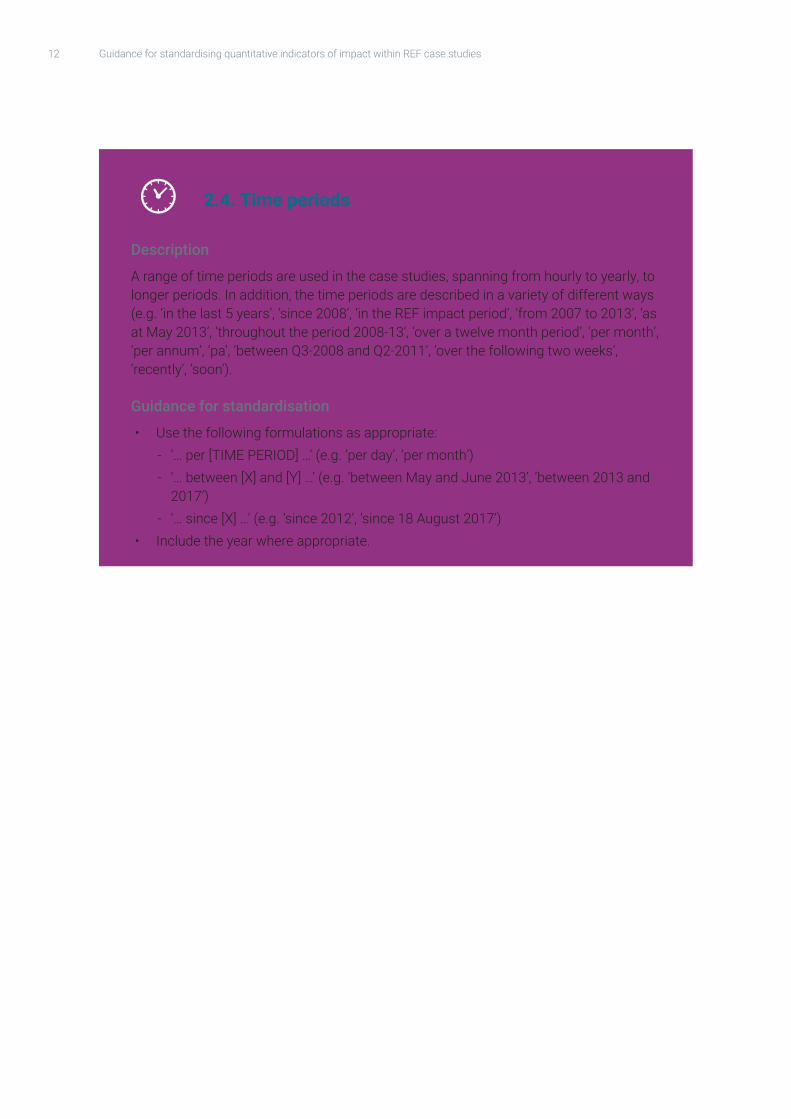
2.4. Time periods
Description
A range of time periods are used in the case studies, spanning from hourly to yearly, to longer periods. In addition, the time periods are described in a variety of different ways (e.g. ‘in the last 5 years’, ‘since 2008’, ‘in the REF impact period’, ‘from 2007 to 2013’, ‘as at May 2013’, ‘throughout the period 2008-13’, ‘over a twelve month period’, ‘per month’, ‘per annum’, ‘pa’, ‘between Q3-2008 and Q2-2011’, ‘over the following two weeks’, ‘recently’, ‘soon’).
Guidance for standardisation
• Use the following formulations as appropriate: - ‘… per [TIME PERIOD] …’ (e.g. ‘per day’, ‘per month’)- ‘… between [X] and [Y] …’ (e.g. ‘between May and June 2013’, ‘between 2013 and
2017’)- ‘… since [X] …’ (e.g. ‘since 2012’, ‘since 18 August 2017’)
• Include the year where appropriate.

13
2.5. Units
Description
A range of metric and imperial units are used within the case studies (e.g. ‘gram’, ‘g’, ‘pound’, ‘lb’, ‘tonne’, ‘ton’, ‘t’, ‘mile’, ‘mi’, ‘km’, ‘kilometre’, ‘metre’, ‘cm’, ‘ha’, ‘hectare’, ‘millilitres’, ‘ml’, ‘litres’, ‘liters’, ‘L’).
Guidance for standardisation
• Where possible, to express the values of quantities, use SI units,17 or non-SI units that are accepted for use with the International System of Units.
• When used with a numerical value, position the value before the appropriate symbol (e.g. ‘10km’, ‘50t’).- For weight, use, for example, the following symbols: g (for gram), kg (for
kilogram), t (for tonne)- For distance, use, for example, the following symbols: mm (for millimetre), cm
(for centimetre), m (for metre), km (for kilometre) - For volume, use, for example, the following symbol: ml (for millilitre), l (for litre) - For area, use, for example, the following symbol: ha (for hectare)
• Do not include a space between the numerical portion of the measurement and the symbol.
17 SIstandsfortheInternationalSystemofUnits(theacronymincorporatesthefirstpartoftheoriginalFrenchname,SystèmeInternationald’Unités).FurtherinformationaboutSIunitsisavailableonline(NPL2018).
14 Guidance for standardising quantitative indicators of impact within REF case studies
2.6. Currency
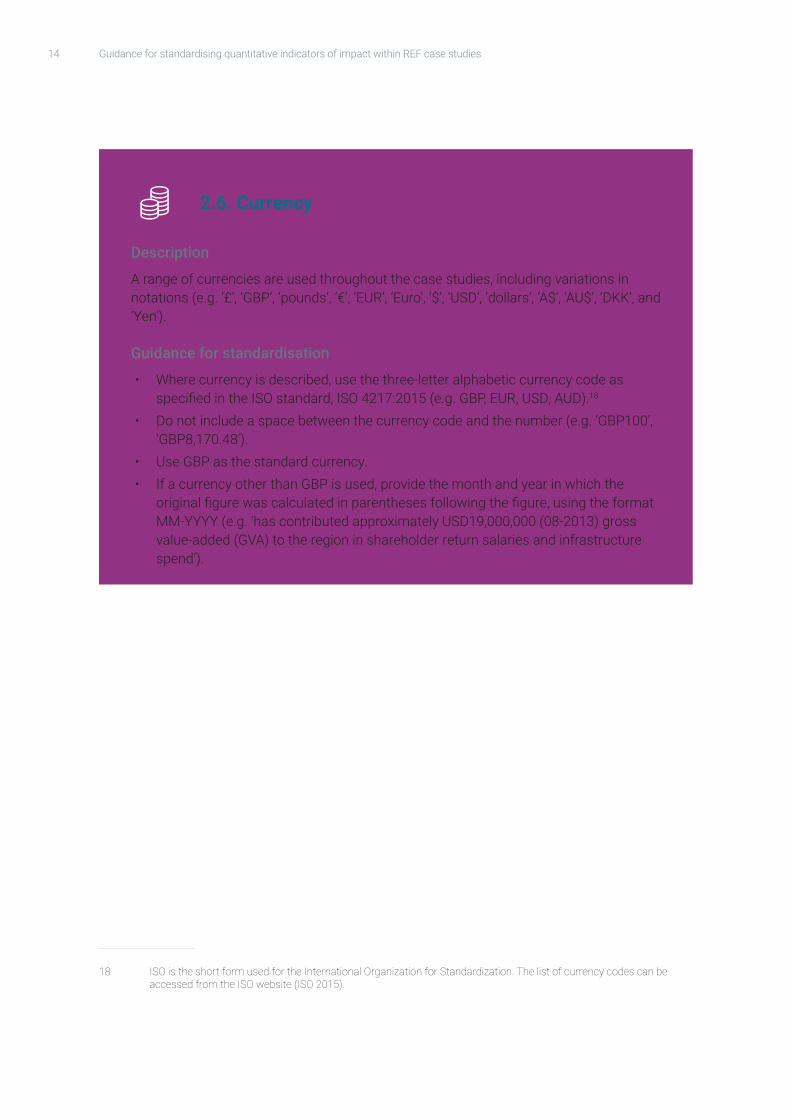
Description
A range of currencies are used throughout the case studies, including variations in notations (e.g. ‘£’, ‘GBP’, ‘pounds’, ‘€’, ‘EUR’, ‘Euro’, ‘$’, ‘USD’, ‘dollars’, ‘A$’, ‘AU$’, ‘DKK’, and ‘Yen’).
Guidance for standardisation
• Where currency is described, use the three-letter alphabetic currency code as specified in the ISO standard, ISO 4217:2015 (e.g. GBP, EUR, USD, AUD).18
• Do not include a space between the currency code and the number (e.g. ‘GBP100’, ‘GBP8,170.48’).
• Use GBP as the standard currency.• If a currency other than GBP is used, provide the month and year in which the
original figure was calculated in parentheses following the figure, using the format MM-YYYY (e.g. ‘has contributed approximately USD19,000,000 (08-2013) gross value-added (GVA) to the region in shareholder return salaries and infrastructure spend’).
18 ISOistheshortformusedfortheInternationalOrganizationforStandardization.ThelistofcurrencycodescanbeaccessedfromtheISOwebsite(ISO2015).
15
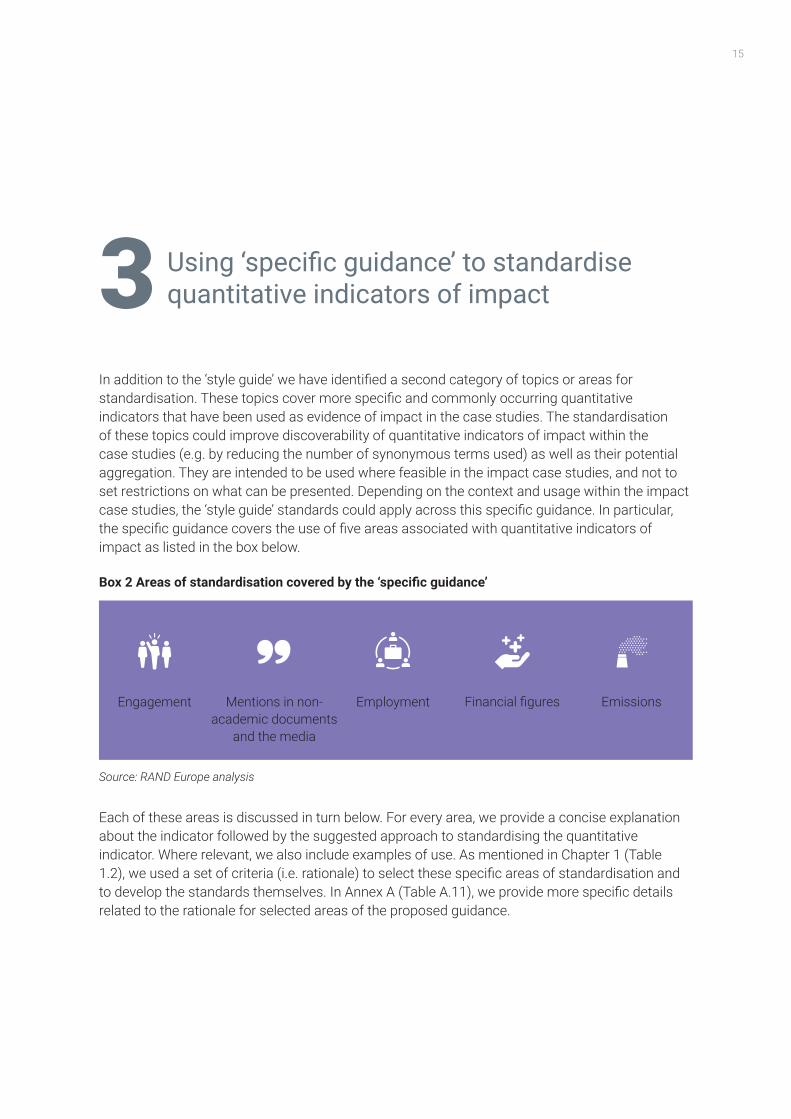
In addition to the ‘style guide’ we have identified a second category of topics or areas for standardisation. These topics cover more specific and commonly occurring quantitative indicators that have been used as evidence of impact in the case studies. The standardisation of these topics could improve discoverability of quantitative indicators of impact within the case studies (e.g. by reducing the number of synonymous terms used) as well as their potential aggregation. They are intended to be used where feasible in the impact case studies, and not to set restrictions on what can be presented. Depending on the context and usage within the impact case studies, the ‘style guide’ standards could apply across this specific guidance. In particular, the specific guidance covers the use of five areas associated with quantitative indicators of impact as listed in the box below.
Box 2 Areas of standardisation covered by the ‘specific guidance’
Source: RAND Europe analysis
Each of these areas is discussed in turn below. For every area, we provide a concise explanation about the indicator followed by the suggested approach to standardising the quantitative indicator. Where relevant, we also include examples of use. As mentioned in Chapter 1 (Table 1.2), we used a set of criteria (i.e. rationale) to select these specific areas of standardisation and to develop the standards themselves. In Annex A (Table A.11), we provide more specific details related to the rationale for selected areas of the proposed guidance.
Using ‘specific guidance’ to standardise quantitative indicators of impact3
Engagement Mentions in non-academic documents
and the media
Employment Financial figures Emissions
16 Guidance for standardising quantitative indicators of impact within REF case studies
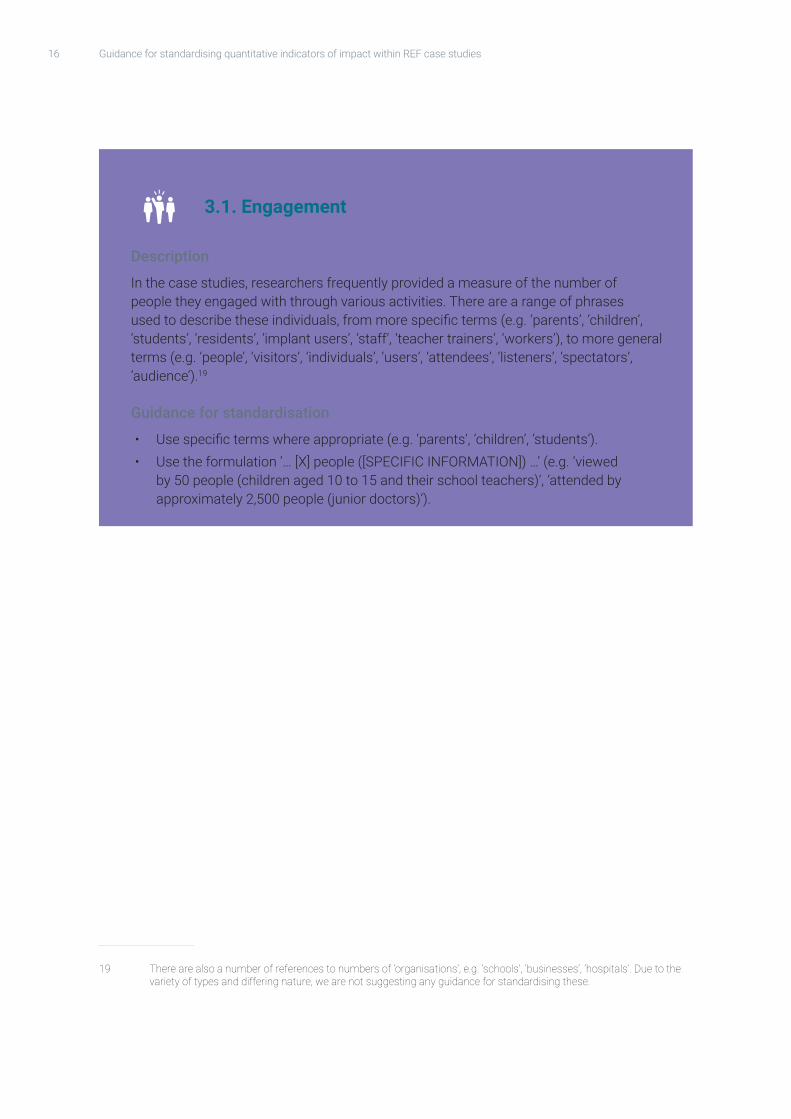
3.1. Engagement
Description
In the case studies, researchers frequently provided a measure of the number of people they engaged with through various activities. There are a range of phrases used to describe these individuals, from more specific terms (e.g. ‘parents’, ‘children’, ‘students’, ‘residents’, ‘implant users’, ‘staff’, ‘teacher trainers’, ‘workers’), to more general terms (e.g. ‘people’, ‘visitors’, ‘individuals’, ‘users’, ‘attendees’, ‘listeners’, ‘spectators’, ‘audience’).19
Guidance for standardisation
• Use specific terms where appropriate (e.g. ‘parents’, ‘children’, ‘students’). • Use the formulation ‘… [X] people ([SPECIFIC INFORMATION]) …’ (e.g. ‘viewed
by 50 people (children aged 10 to 15 and their school teachers)’, ‘attended by approximately 2,500 people (junior doctors)’).
19 Therearealsoanumberofreferencestonumbersof‘organisations’,e.g.‘schools’,‘businesses’,‘hospitals’.Duetothevariety of types and differing nature, we are not suggesting any guidance for standardising these.
17
3.2. Mentions in non-academic documents and the media
Description
Across a number of case studies, numerical impact information is presented to signify the number of mentions or references of the underpinning research in non-academic documents and the media (including, for example, guidelines, policy documents, court judgements, case documents, strategy documents, magazines, newspapers). A range of synonymous terms were used to indicate citations in non-academic documents/the media (e.g. ‘cited by’, ‘cited in’, ‘cited’, ‘cited at’, ‘mentioned’, ‘used in’, ‘featured’).
In addition to mentions in non-academic documents and the media, impact case studies also included information on the circulation and readership of the publication.
Guidance for standardisation
• For mentions of non-academic documents, use: ‘… cited [X] times in …’ (e.g. ‘cited 50 times in national policy documents’).20
• For mentions of the media (print and online), use: ‘… referenced [X] times in …’ (e.g. ‘referenced 50 times in the media across 10 countries’).
• When a specific publication is mentioned, where available, provide relevant readership and circulation figures from an appropriate date21 (e.g. ‘the Guardian (print readership: 867,000; circulation: 152,714))’.
20 Rawcitationcountsshouldbetreatedwithcaution,takingintoaccountthatdifferentfieldshavedifferentdistributionsof citation.
21 Circulationis‘acountofhowmanycopiesofaparticularpublicationaredistributed’,andreadershipis‘anestimateofhowmanyreadersapublicationhas’(NationalReadershipSurvey2018).
18 Guidance for standardising quantitative indicators of impact within REF case studies
3.3. Employment
Description
Case studies provided evidence of economic impact by citing the number of jobs created or the number of employees. There were a variety of synonymous terms and sentence structures used to quantify the number of people impacted by job creation (e.g. ‘employs a total of 19 staff’, ‘generated 250 jobs’, ‘provided employment for high quality chemists (>60 FTE)’).
Guidance for standardisation
• When referring to increasing employment as an outcome of research, where possible include both the headcount and the number of FTEs (where FTE is full-time equivalent) (e.g. ‘generated 10 jobs (headcount: 10; FTEs: 10), ‘this created 50 part-time jobs (headcount: 50; FTEs: 25)’).
3.4. Financial figures
Description
A range of financial indicator-related terms were used within the case studies (e.g. ‘value’, ‘sales’, ‘revenue’, ‘turnover’, ‘cost savings’, ‘profit’, ‘return on investment (ROI)’, ‘gross value added (GVA)’, ‘income’, ‘royalties’, ‘expenditure’, ‘assets’, ‘quality-adjusted life years (QALYs)’).
Guidance for standardisation
• Where possible, use the following formulation: ‘… [TERM(S)] of … [ALPHABETIC CURRENCY CODE][CURRENCY VALUE] …’ (e.g. ‘profit of GBP1,000’, ‘turnover of approximately GBP80,000,000’, ‘gross value added of GBP1,400,000 per year’).22
• Where possible, use more specific terms to express the financial indicator terms in the above formulation. Thus, if describing ‘profit’, specify the type of profit (e.g. ‘gross profit’, ‘post-tax profit’, ‘pre-tax profit’, ‘net profit’, etc.); if describing ‘expenditure’, specify the type of expenditure (e.g. ‘capital expenditure’, ‘health expenditure’, ‘public expenditure’, ‘total expenditure’, etc.).
• For ‘return on investment’, use ‘ROI’; for ‘gross value added’, use ‘GVA’; for ‘quality-adjusted life years’, use ‘QALYs’.
22 Refer to Section 2.6 of the ‘style guide’ for guidance on how to present currencies.
19
3.5. Emissions
Description
A number of case studies refer to changes in emissions, referencing greenhouse gases in general, and also more specifically, carbon dioxide, methane and nitrogen oxides. These terms are written out in a variety of ways (e.g. ‘kg CO2 of emissions reduction per day’, ‘tonnes of CO2’, ‘Mt CO2e in greenhouse gas emissions’, ‘479.1 megatons of CO2 equivalent’, ‘CO2e (carbon dioxide equivalent) savings of over 9kg per unit’).
Guidance for standardisation
• Use the following abbreviations for carbon dioxide, carbon dioxide equivalent and nitrogen oxides respectively: ‘CO2’, ‘CO2e’, and ‘NOx’.
• Use SI units for all compound units (e.g. ‘MtCO2e/year’, ‘gCO2/km’).

21
In this report, we have articulated guidance to standardise the use of quantitative indicators that are used as evidence of impact in the case studies submitted to the REF. The intention is for this document to help inform the guidance for the preparation of impact case studies for REF 2021. Providing a more standardised case study ‘vocabulary’ and ‘reporting structure’ of quantitative impact indicators could potentially facilitate a more effective and efficient (text-mining-based) analysis of these data across the body of case studies that are submitted by UK HEIs in REF 2021 (e.g. in terms of making certain quantitative indicators of impact more easily discoverable). This, in turn, could permit more detailed analyses of the data to demonstrate evidence of the wider impact of academic research in the UK.
To carry out the study, we relied on a mixed-methods approach that comprised a combination of text mining and qualitative techniques applied to the impact case studies that were submitted by UK HEIs to REF 2014. Based on our analysis, we have proposed two broad categories of standards. First, we have proposed a ‘style guide’ that contains common stylistic conventions that could be standardised to make quantitative indicators of impact more discoverable in the case studies. Second, we have suggested the use of some ‘specific guidance’ that addresses more specific and commonly occurring quantitative impact indicators.
It is important to reiterate that the specific standards we have identified are not intended to be comprehensive or definitive. Furthermore, these standards should be treated more as a set of guidance to consider while developing impact case studies for REF 2021, rather than exacting standards or restrictions on what can be written per se. The standards might not work in all instances and could, at times, result in the case study vocabulary becoming somewhat unwieldy. The case studies for REF 2014 paint a rich and diverse picture of the wider impact of UK universities’ research on society and the economy; the guidance is not meant to overly reduce the diversity of what can be written, nor to impact the narrative nature of the case studies.
As highlighted in Chapter 1, the guidance across both categories of standards is predominantly based on the quantitative impact indicators that we identified as being the most commonly occurring across the REF 2014 case studies; they do not encompass all types of quantitative indicators of impact. While the guidance helps to make quantitative indicators more discoverable within cases studies, all quantitative indicators should be used responsibly, taking into account the context as well as the numerical value, in line with the principles of use of metrics outlined in The Metric Tide (Wilsdon et al. 2015). Furthermore, the guidance may allow for cross-case study
Concluding remarks4
22 Guidance for standardising quantitative indicators of impact within REF case studies
comparison during assessment. If such a comparison is carried out, care should be taken to ensure that it is carried out responsibly.
Finally, although the primary aim of this study is to help inform the guidance for impact case study submission for REF 2021, we believe that the analyses may also be of interest to other stakeholders. These include individuals and organisations seeking to better understand how to demonstrate and articulate the impact of research and, more broadly, to anyone interested in the assessment of research and the wider impact of university research.
23
References
Chowdhury, G., K. Koya & P. Philipson. 2016. ‘Measuring the Impact of Research: Lessons from the UK’s Research Excellence Framework 2014.’ PLoS ONE 11(6): e0156978. doi:10.1371/journal.pone.0156978
HEFCE (Higher Education Funding Council for England). 2018. ‘Impact Case Studies.’ Case studies downloaded on 8 January 2018. As of 27 February 2018: http://impact.ref.ac.uk/CaseStudies/Search1.aspx
HEFCE (Higher Education Funding Council for England). 2016. ‘New Forum for Responsible Research Metrics Launched.’ Higher Education Funding Council for England, September 15. As of 27 February 2018: http://www.hefce.ac.uk/news/newsarchive/2016/Name,109662,en.html
ISO (International Organization for Standardization). 2015. ‘Currency Codes – ISO 4217’. As of 27 February 2018: https://www.iso.org/iso-4217-currency-codes.html
King’s College London and Digital Science. 2015. The Nature, Scale and Beneficiaries of Research Impact: An Initial Analysis of Research Excellence Framework (REF) 2014 Impact Case Studies. Bristol: HEFCE. As of 27 February 2018: http://www.hefce.ac.uk/pubs/rereports/Year/2015/analysisREFimpact/
Manville, C., M. Morgan Jones, M. Frearson, S. Castle-Clarke, M.L. Henham, S. Gunashekar & J. Grant. 2015. Preparing Impact Submissions for REF 2014: An Evaluation – Findings and Observations. Santa Monica, Calif.: RAND Corporation. RR-727-HEFCE. As of 27 February 2018: https://www.rand.org/pubs/research_reports/RR727.html
Morgan Jones, M. & J. Grant. 2013. ‘Making the Grade: Methodologies for Assessing and Evidencing Research Impact’. In 7 Essays on Impact, edited by A. Dean, M. Wykes & H. Stevens, 25–43. DESCRIBE Project Report for Jisc. University of Exeter. Exeter: University of Exeter. As of 27 February 2018: https://www.rand.org/pubs/external_publications/EP50298.html
National Readership Survey. 2018. ‘What’s the Difference between Readership and Circulation?’ As of 27 February 2018: http://www.nrs.co.uk/nrs-print/readership-and-circulation-trends/readership-vs-circulation/
NPL (National Physical Laboratory). 2018. ‘Measurement Units’. As of 27 February 2018: http://www.npl.co.uk/reference/measurement-units/
24 Guidance for standardising quantitative indicators of impact within REF case studies
REF (Research Excellence Framework). 2017. ‘Initial decisions on the Research Excellence Framework 2021’. Bristol: HEFCE. As of 27 February 2018: http://www.ref.ac.uk/media/ref,2021/downloads/REF2017_01.pdf
The R Project for Statistical Computing (homepage). 2018. As of 27 February 2018: https://www.r-project.org/
———. 2016. ‘Apache OpenNLP Tools Interface.’ As of 27 February 2018: https://cran.r-project.org/web/packages/openNLP/openNLP.pdf
Wilsdon, J., L. Allen, E. Belfiore, P. Campbell, S. Curry, S. Hill, R. Jones, R. Kain, S. Kerridge, M. Thelwall, J. Tinkler, I. Viney, P. Wouters, J. Hill & B. Johnson. 2015. The Metric Tide: Report of the Independent Review of the Role of Metrics in Research Assessment and Management. Bristol: HEFCE. doi:10.13140/RG.2.1.4929.1363
25
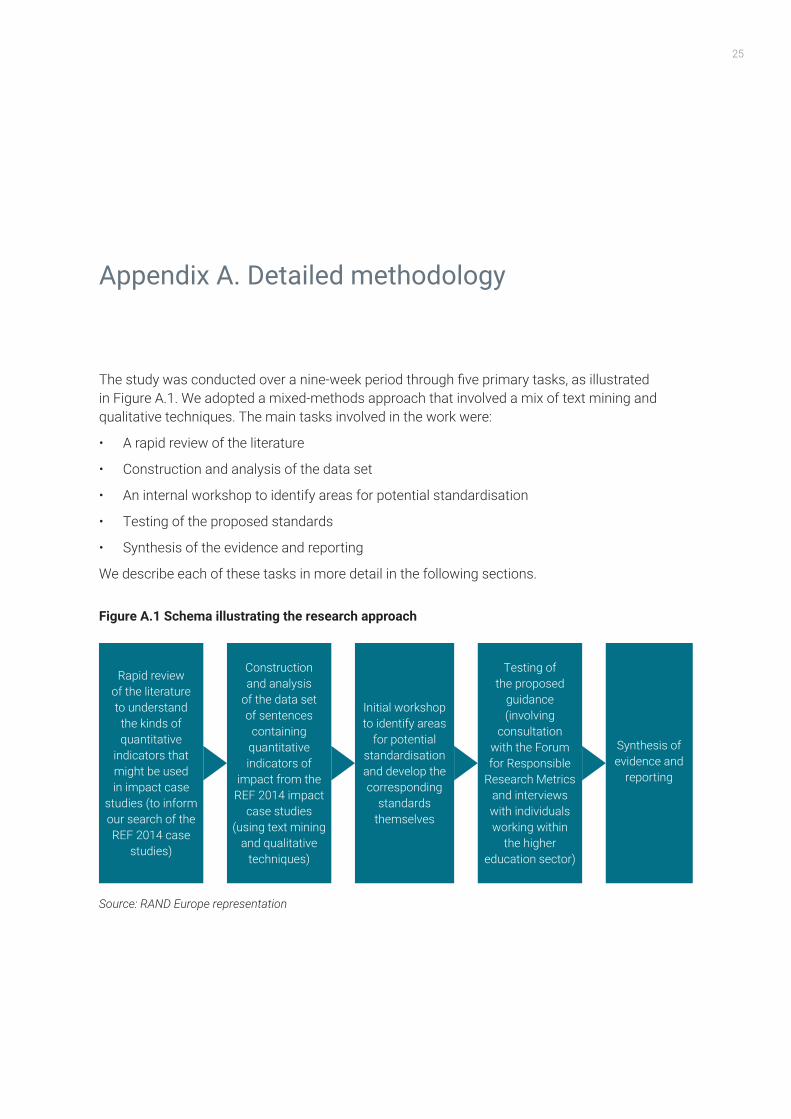
Appendix A. Detailed methodology
The study was conducted over a nine-week period through five primary tasks, as illustrated in Figure A.1. We adopted a mixed-methods approach that involved a mix of text mining and qualitative techniques. The main tasks involved in the work were:
• A rapid review of the literature
• Construction and analysis of the data set
• An internal workshop to identify areas for potential standardisation
• Testing of the proposed standards
• Synthesis of the evidence and reporting
We describe each of these tasks in more detail in the following sections.
Figure A.1 Schema illustrating the research approach
Source: RAND Europe representation
Rapid review of the literature to understand
the kinds of quantitative
indicators that might be used in impact case
studies (to inform our search of the REF 2014 case
studies)
Construction and analysis
of the data set of sentences
containing quantitative indicators of
impact from the REF 2014 impact
case studies (using text mining
and qualitative techniques)
Initial workshop to identify areas
for potential standardisation and develop the corresponding
standards themselves
Testing of the proposed
guidance (involving
consultation with the Forum for Responsible
Research Metrics and interviews with individuals working within
the higher education sector)
Synthesis of evidence and
reporting
26 Guidance for standardising quantitative indicators of impact within REF case studies
A.1. Rapid review of the literatureTo focus our search of the REF 2014 case studies, we reviewed a few key documents to understand the different kinds of quantitative indicators that might be used in impact case studies. Notable documents included The Metric Tide (Wilsdon et al. 2015) and analyses conducted by King’s College London and Digital Science (King’s College London and Digital Science 2015) and Northumbria University (Chowdhury et al. 2016). The quantitative indicators most commonly referred to related to public engagement, economic activity and training,23 all of which could be considered widely applicable to most units of assessment (UOAs) in the REF. We then undertook some targeted searches to consider a few specific disciplines that have key performance indicators that could have been used in impact case studies, such as changes in environmental quality, impact related to education and student achievement, impact related to criminal justice and public services, and indicators of enhanced quality of life. The long list of indicators we derived from these sources gave us a wide range of specific terms and figures that we could reasonably expect to find in the impact case study data set.
A.2. Construction and analysis of the quantitative impact indicator data setThe second step in our approach involved the construction and analysis of a data set that contained all of the sentences from the REF 2014 impact case studies that might comprise quantitative indicators of impact. A diagram showing the main steps involved in this process is shown in Figure A.2.
23 Forexample,thenumberofcitationsinapolicyorpractitionerdocument,numberofvisitorstoagallery/exhibition,numberofpatents/licensescreated,numberofjobscreated,amountofrevenuegenerated,numberoftrainingresources created.

27
Figure A.2 Schema illustrating steps involved in constructing and analysing the data set
Source: RAND Europe representation
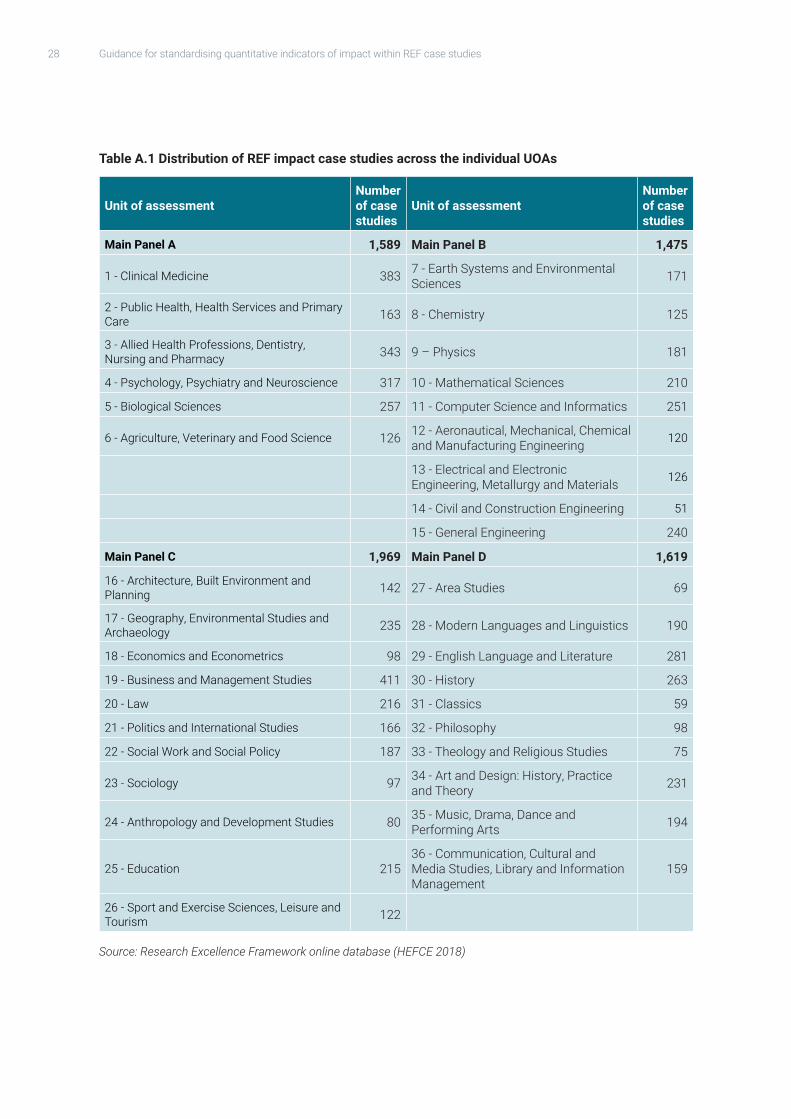
24 ForREF2014,HEIsmadesubmissionsin36UOAsthatweredistributedacrossfourmainpanels:MainPanelAbroadlyfocussedonmedicine,healthandlifesciences;MainPanelBbroadlyfocussedonphysicalsciences,engineeringandmathematics;MainPanelCbroadlyfocussedonsocialsciences;andMainPanelDbroadlyfocussedonartsandhumanities.
A.2.1. Construction of the data set
We downloaded the full text of the impact case studies from all 36 UOAs from the Research Excellence Framework online case study database (HEFCE 2018). This covered a total of 6,652 case studies, which were relatively evenly distributed across the four main panels,24 as shown in Table A.1.
Cons
truc
tion
of th
e da
ta s
etAn
alys
is o
f the
dat
a se
t
Extracted all sentences with
numbers in them
n = 109,591 sentences
Identified terms in this list that looked
as if they are likely to be associated with a quantitative indicator
of impact
n = 71 terms
Cleaned data set to remove sentences
which contained only years, references to
figures, etc.
n = 65,896 sentences
For each term, reviewed up to 50 randomly selected
sentences to identify and categorise
quantitative indicators of impact
n = 3,131 sentences
Downloaded full text of the Details of Impact section of all 6,652 impact
case studies
Applied a text mining tool
to (a) remove common words; and (b) identify a frequency-ranked list of words in the
sentences
28 Guidance for standardising quantitative indicators of impact within REF case studies
Table A.1 Distribution of REF impact case studies across the individual UOAs
Unit of assessmentNumber of case studies
Unit of assessmentNumber of case studies
Main Panel A 1,589 Main Panel B 1,475
1 - Clinical Medicine 383 7 - Earth Systems and Environmental Sciences 171
2 - Public Health, Health Services and Primary Care 163 8 - Chemistry 125
3 - Allied Health Professions, Dentistry, Nursing and Pharmacy 343 9 – Physics 181
4 - Psychology, Psychiatry and Neuroscience 317 10 - Mathematical Sciences 210
5 - Biological Sciences 257 11 - Computer Science and Informatics 251
6 - Agriculture, Veterinary and Food Science 126 12 - Aeronautical, Mechanical, Chemical and Manufacturing Engineering 120
13 - Electrical and Electronic Engineering, Metallurgy and Materials 126
14 - Civil and Construction Engineering 51
15 - General Engineering 240
Main Panel C 1,969 Main Panel D 1,619
16 - Architecture, Built Environment and Planning 142 27 - Area Studies 69
17 - Geography, Environmental Studies and Archaeology 235 28 - Modern Languages and Linguistics 190
18 - Economics and Econometrics 98 29 - English Language and Literature 281
19 - Business and Management Studies 411 30 - History 263
20 - Law 216 31 - Classics 59
21 - Politics and International Studies 166 32 - Philosophy 98
22 - Social Work and Social Policy 187 33 - Theology and Religious Studies 75
23 - Sociology 97 34 - Art and Design: History, Practice and Theory 231
24 - Anthropology and Development Studies 80 35 - Music, Drama, Dance and Performing Arts 194
25 - Education 21536 - Communication, Cultural and Media Studies, Library and Information Management
159
26 - Sport and Exercise Sciences, Leisure and Tourism 122
Source: Research Excellence Framework online database (HEFCE 2018)
29
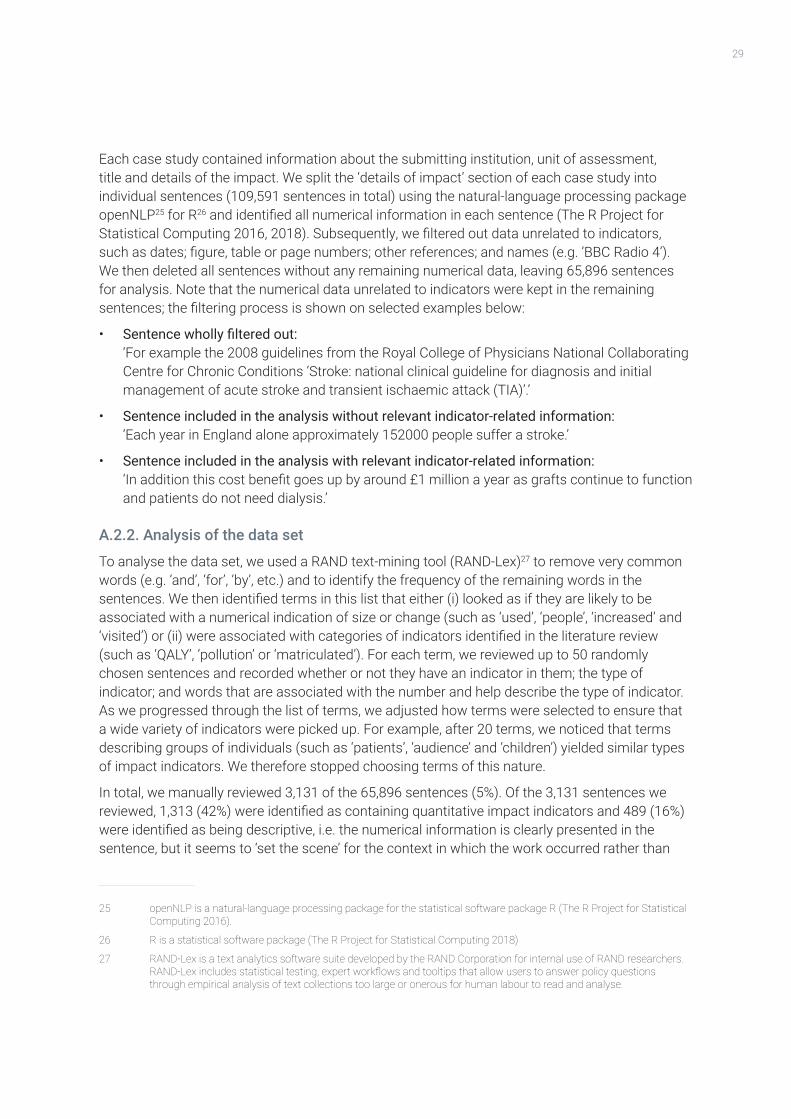
Each case study contained information about the submitting institution, unit of assessment, title and details of the impact. We split the ‘details of impact’ section of each case study into individual sentences (109,591 sentences in total) using the natural-language processing package openNLP25 for R26 and identified all numerical information in each sentence (The R Project for Statistical Computing 2016, 2018). Subsequently, we filtered out data unrelated to indicators, such as dates; figure, table or page numbers; other references; and names (e.g. ‘BBC Radio 4’). We then deleted all sentences without any remaining numerical data, leaving 65,896 sentences for analysis. Note that the numerical data unrelated to indicators were kept in the remaining sentences; the filtering process is shown on selected examples below:
• Sentence wholly filtered out: ‘For example the 2008 guidelines from the Royal College of Physicians National Collaborating Centre for Chronic Conditions ‘Stroke: national clinical guideline for diagnosis and initial management of acute stroke and transient ischaemic attack (TIA)’.’
• Sentence included in the analysis without relevant indicator-related information: ‘Each year in England alone approximately 152000 people suffer a stroke.’
• Sentence included in the analysis with relevant indicator-related information: ‘In addition this cost benefit goes up by around £1 million a year as grafts continue to function and patients do not need dialysis.’
A.2.2. Analysis of the data set
To analyse the data set, we used a RAND text-mining tool (RAND-Lex)27 to remove very common words (e.g. ‘and’, ‘for’, ‘by’, etc.) and to identify the frequency of the remaining words in the sentences. We then identified terms in this list that either (i) looked as if they are likely to be associated with a numerical indication of size or change (such as ‘used’, ‘people’, ‘increased’ and ‘visited’) or (ii) were associated with categories of indicators identified in the literature review (such as ‘QALY’, ‘pollution’ or ‘matriculated’). For each term, we reviewed up to 50 randomly chosen sentences and recorded whether or not they have an indicator in them; the type of indicator; and words that are associated with the number and help describe the type of indicator. As we progressed through the list of terms, we adjusted how terms were selected to ensure that a wide variety of indicators were picked up. For example, after 20 terms, we noticed that terms describing groups of individuals (such as ‘patients’, ‘audience’ and ‘children’) yielded similar types of impact indicators. We therefore stopped choosing terms of this nature.
In total, we manually reviewed 3,131 of the 65,896 sentences (5%). Of the 3,131 sentences we reviewed, 1,313 (42%) were identified as containing quantitative impact indicators and 489 (16%) were identified as being descriptive, i.e. the numerical information is clearly presented in the sentence, but it seems to ‘set the scene’ for the context in which the work occurred rather than
25 openNLPisanatural-languageprocessingpackageforthestatisticalsoftwarepackageR(TheRProjectforStatisticalComputing 2016).
26 Risastatisticalsoftwarepackage(TheRProjectforStatisticalComputing2018)
27 RAND-LexisatextanalyticssoftwaresuitedevelopedbytheRANDCorporationforinternaluseofRANDresearchers.RAND-Lexincludesstatisticaltesting,expertworkflowsandtooltipsthatallowuserstoanswerpolicyquestionsthroughempiricalanalysisoftextcollectionstoolargeoronerousforhumanlabourtoreadandanalyse.
30 Guidance for standardising quantitative indicators of impact within REF case studies
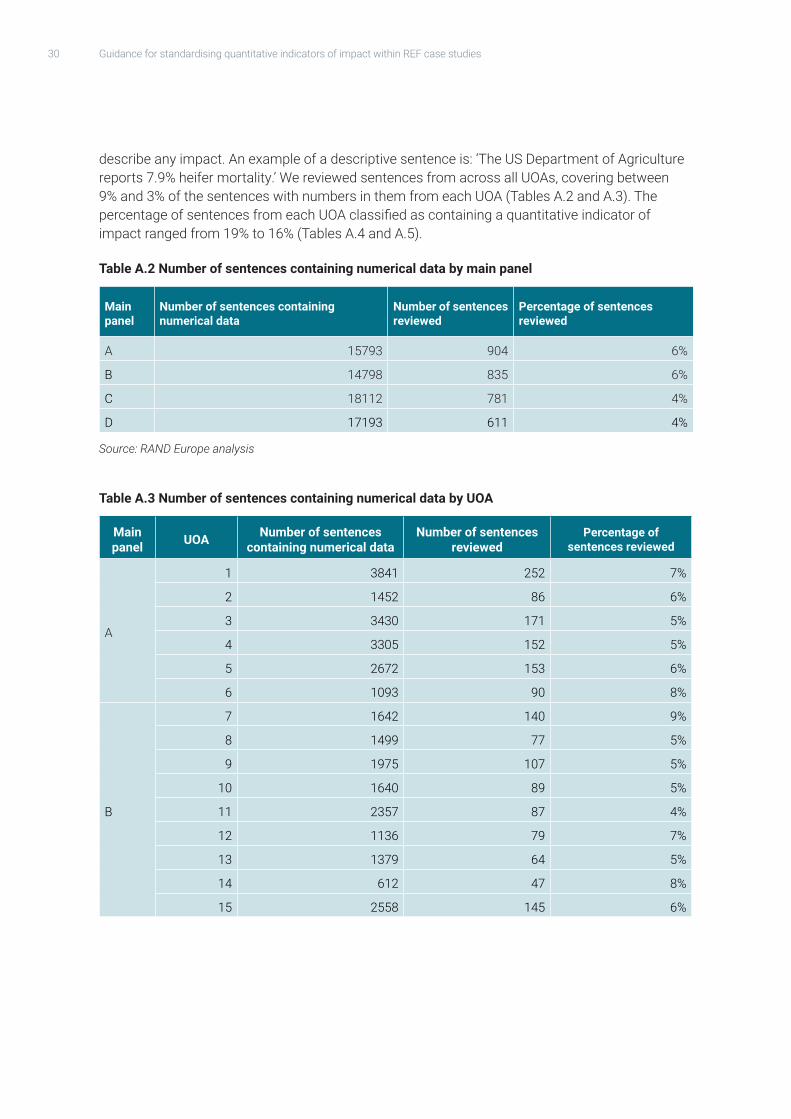
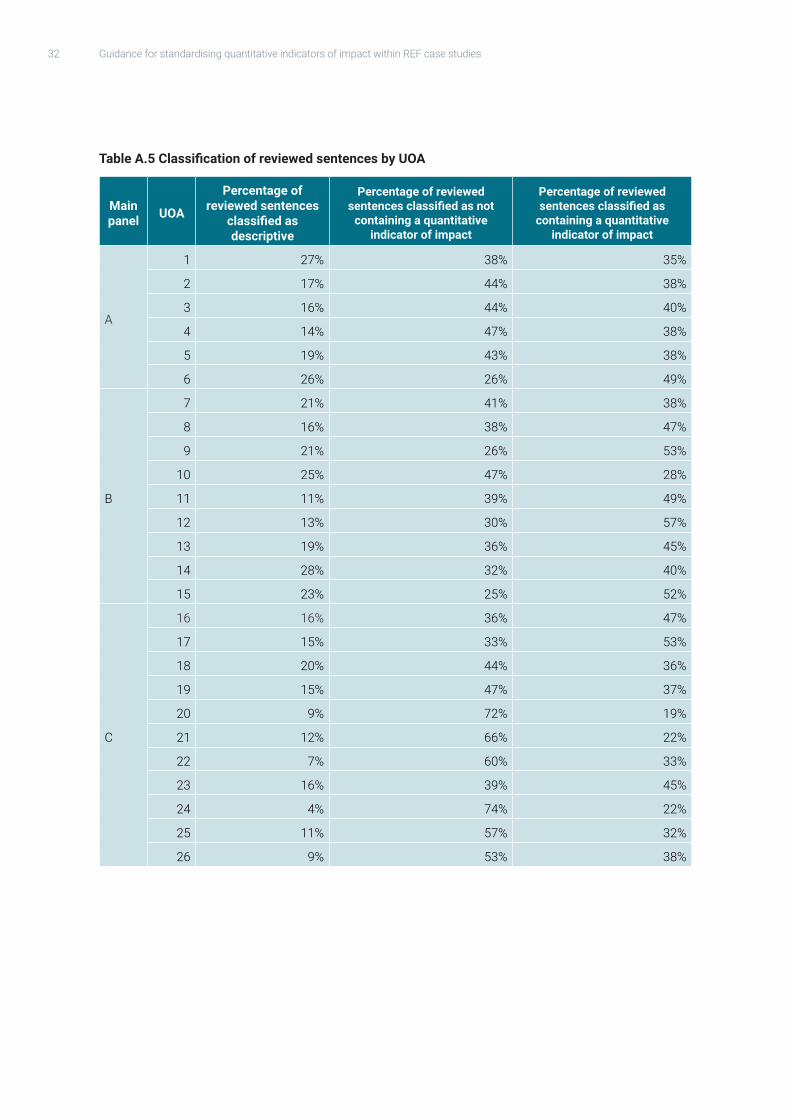
describe any impact. An example of a descriptive sentence is: ‘The US Department of Agriculture reports 7.9% heifer mortality.’ We reviewed sentences from across all UOAs, covering between 9% and 3% of the sentences with numbers in them from each UOA (Tables A.2 and A.3). The percentage of sentences from each UOA classified as containing a quantitative indicator of impact ranged from 19% to 16% (Tables A.4 and A.5).
Table A.2 Number of sentences containing numerical data by main panel
Main panel
Number of sentences containing numerical data
Number of sentences reviewed
Percentage of sentences reviewed
A 15793 904 6%
B 14798 835 6%
C 18112 781 4%
D 17193 611 4%
Source: RAND Europe analysis
Table A.3 Number of sentences containing numerical data by UOA
Main panel UOA Number of sentences
containing numerical data Number of sentences
reviewedPercentage of
sentences reviewed
A
1 3841 252 7%
2 1452 86 6%
3 3430 171 5%
4 3305 152 5%
5 2672 153 6%
6 1093 90 8%
B
7 1642 140 9%
8 1499 77 5%
9 1975 107 5%
10 1640 89 5%
11 2357 87 4%
12 1136 79 7%
13 1379 64 5%
14 612 47 8%
15 2558 145 6%
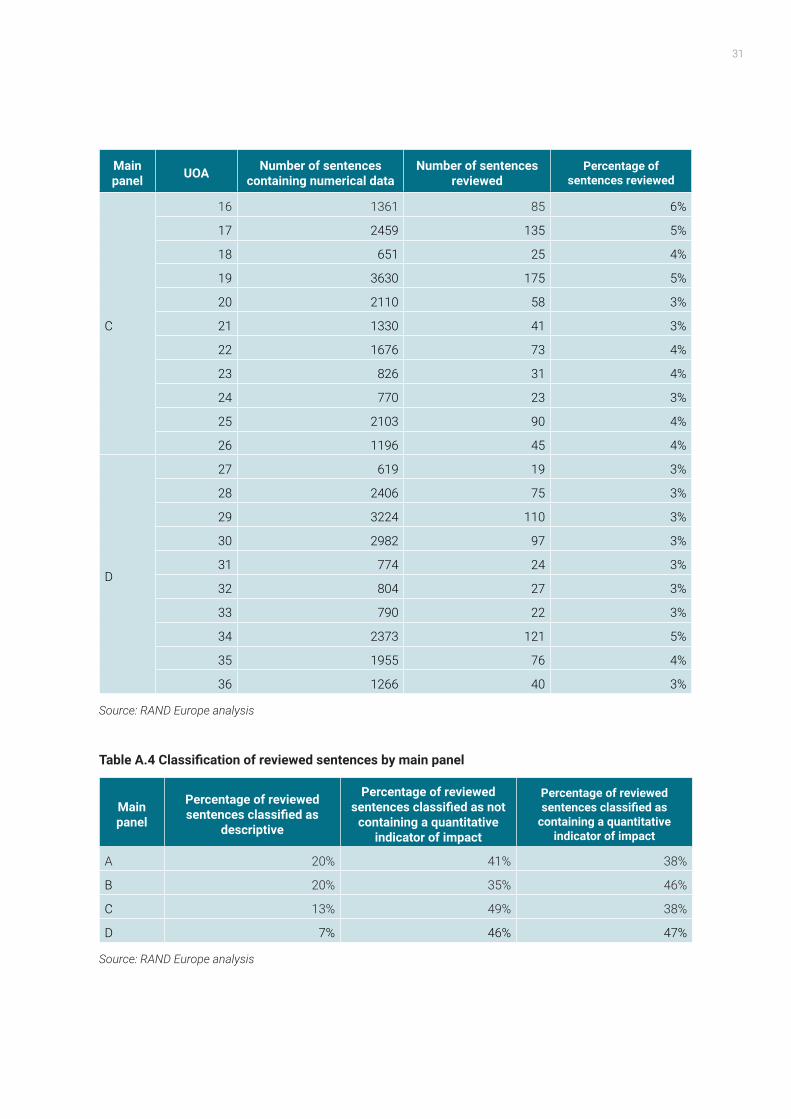
31
Main panel UOA Number of sentences
containing numerical data Number of sentences
reviewedPercentage of
sentences reviewed
C
16 1361 85 6%
17 2459 135 5%
18 651 25 4%
19 3630 175 5%
20 2110 58 3%
21 1330 41 3%
22 1676 73 4%
23 826 31 4%
24 770 23 3%
25 2103 90 4%
26 1196 45 4%
D
27 619 19 3%
28 2406 75 3%
29 3224 110 3%
30 2982 97 3%
31 774 24 3%
32 804 27 3%
33 790 22 3%
34 2373 121 5%
35 1955 76 4%
36 1266 40 3%
Source: RAND Europe analysis
Table A.4 Classification of reviewed sentences by main panel
Main panel
Percentage of reviewed sentences classified as
descriptive
Percentage of reviewed sentences classified as not
containing a quantitative indicator of impact
Percentage of reviewed sentences classified as
containing a quantitative indicator of impact
A 20% 41% 38%
B 20% 35% 46%
C 13% 49% 38%
D 7% 46% 47%
Source: RAND Europe analysis
32 Guidance for standardising quantitative indicators of impact within REF case studies
Table A.5 Classification of reviewed sentences by UOA
Main panel UOA
Percentage of reviewed sentences
classified as descriptive
Percentage of reviewed sentences classified as not
containing a quantitative indicator of impact
Percentage of reviewed sentences classified as
containing a quantitative indicator of impact
A
1 27% 38% 35%
2 17% 44% 38%
3 16% 44% 40%
4 14% 47% 38%
5 19% 43% 38%
6 26% 26% 49%
B
7 21% 41% 38%
8 16% 38% 47%
9 21% 26% 53%
10 25% 47% 28%
11 11% 39% 49%
12 13% 30% 57%
13 19% 36% 45%
14 28% 32% 40%
15 23% 25% 52%
C
16 16% 36% 47%
17 15% 33% 53%
18 20% 44% 36%
19 15% 47% 37%
20 9% 72% 19%
21 12% 66% 22%
22 7% 60% 33%
23 16% 39% 45%
24 4% 74% 22%
25 11% 57% 32%
26 9% 53% 38%
33
Main panel UOA
Percentage of reviewed sentences
classified as descriptive
Percentage of reviewed sentences classified as not
containing a quantitative indicator of impact
Percentage of reviewed sentences classified as
containing a quantitative indicator of impact
D
27 26% 42% 32%
28 4% 64% 31%
29 5% 41% 54%
30 6% 41% 52%
31 4% 38% 58%
32 4% 44% 52%
33 14% 45% 41%
34 7% 42% 51%
35 7% 50% 43%
36 5% 55% 40%
Source: RAND Europe analysis
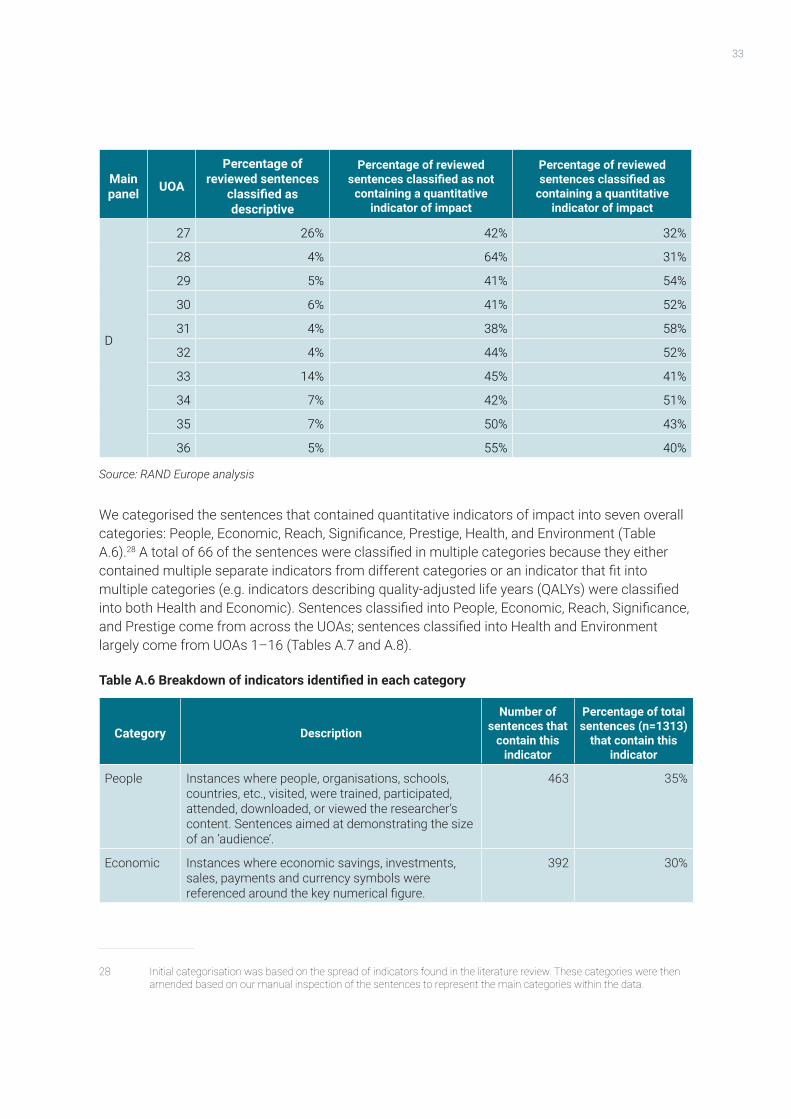
28 Initialcategorisationwasbasedonthespreadofindicatorsfoundintheliteraturereview.Thesecategorieswerethenamendedbasedonourmanualinspectionofthesentencestorepresentthemaincategorieswithinthedata.
We categorised the sentences that contained quantitative indicators of impact into seven overall categories: People, Economic, Reach, Significance, Prestige, Health, and Environment (Table A.6).28 A total of 66 of the sentences were classified in multiple categories because they either contained multiple separate indicators from different categories or an indicator that fit into multiple categories (e.g. indicators describing quality-adjusted life years (QALYs) were classified into both Health and Economic). Sentences classified into People, Economic, Reach, Significance, and Prestige come from across the UOAs; sentences classified into Health and Environment largely come from UOAs 1–16 (Tables A.7 and A.8).
Table A.6 Breakdown of indicators identified in each category
Category Description
Number of sentences that
contain this indicator
Percentage of total sentences (n=1313)
that contain this indicator
People Instances where people, organisations, schools, countries, etc., visited, were trained, participated, attended, downloaded, or viewed the researcher’s content. Sentences aimed at demonstrating the size of an ‘audience’.
463 35%
Economic Instances where economic savings, investments, sales, payments and currency symbols were referenced around the key numerical figure.
392 30%
34 Guidance for standardising quantitative indicators of impact within REF case studies
Category Description
Number of sentences that
contain this indicator
Percentage of total sentences (n=1313)
that contain this indicator
Reach Instances where there was a definitive quantitative figure that aimed to convey reach, but did not define the size of the audience in any way.
68 5%
Significance Use of results from a visitor satisfaction survey or other form of project evaluation to validate the success/significance of a researcher’s work.
148 11%
Prestige Numerical evidence that aims to convey the researcher’s prominence in the field, such as rankings in bestseller lists, ‘citations’, ‘top 10’, ‘provided evidence’.
54 4%
Health Instances of improving health outcomes, saving lives, accident rates, etc.
63 5%
Environment Instances of improving environmental outcomes. 59 4%
Combination Instances where single sentences contained quantitative impact information that fell in more than one category.
66 5%
Source: RAND Europe analysis
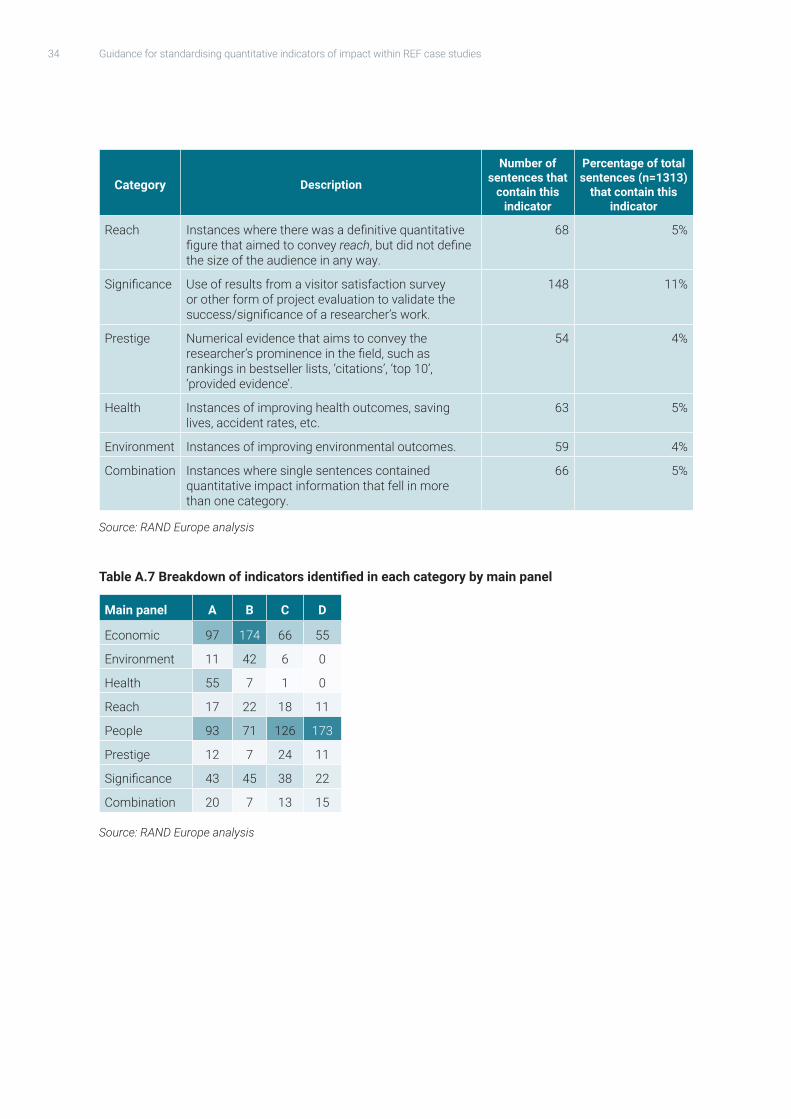
Table A.7 Breakdown of indicators identified in each category by main panel
Main panel A B C D
Economic 97 174 66 55
Environment 11 42 6 0
Health 55 7 1 0
Reach 17 22 18 11
People 93 71 126 173
Prestige 12 7 24 11
Significance 43 45 38 22
Combination 20 7 13 15
Source: RAND Europe analysis
35
Tabl
e A
.8 B
reak
dow
n of
indi
cato
rs id
entifi
ed in
eac
h ca
tego
ry b
y UO
A
Mai
n pa
nel
AB
CD
UOA
12
34
56
78
910
1112
1314
1516
1718
1920
2122
2324
2526
2728
2930
3132
3334
3536
Econ
omic
214
2111
2416
2016
2311
2421
196
347
164
230
02
40
46
11
147
44
013
74
Envi
ronm
ent
00
00
65
73
01
210
52
126
00
00
00
00
00
00
00
00
00
00
Hea
lth27
137
53
01
21
11
00
01
00
01
00
00
00
00
00
00
00
00
0
Reac
h3
15
12
55
32
13
02
06
44
01
11
20
13
11
11
11
00
41
1
Peop
le15
720
3111
99
717
511
23
512
1236
123
44
149
215
62
1932
318
89
3024
10
Pres
tige
52
20
12
23
20
00
00
03
51
34
13
10
30
02
31
01
03
01
Sign
ifica
nce
93
98
95
62
85
28
05
94
82
122
22
01
23
21
55
11
07
00
Com
bina
tion
73
42
22
10
31
00
00
22
21
20
11
01
21
00
46
00
04
10
Sour
ce: R
AND
Euro
pe a
naly
sis
36 Guidance for standardising quantitative indicators of impact within REF case studies
A.3. Internal workshop to identify areas for potential standardisationAfter we categorised the sentences from the impact case studies containing quantitative information, we conducted an internal workshop to draw together the evidence from the previous tasks, with the aim of (i) selecting particular areas for potential standardisation; and (ii) proposing a set of concrete standards for each of these areas. We reviewed the sentences within and across the categories identified in the previous task (Table A.6) and used a set of criteria to select the provisional areas of standardisation and to develop the standards themselves. These criteria (listed in Table A.9) were applied informally during the workshop to help inform our decisions. Not all categories contained areas that were standardisable.
Table A.9 Rationale for standardisation
Criteria for selecting the areas of standardisation (i.e. the types of indicators to be standardised)
Frequently occurs in the impact case study sentences examined
Is an area of anticipated post-REF analysis
Is an area where standardisation would improve the ease of analysis
Criteria for selecting the standards for these indicators
Is one of the most commonly used formulations across the impact case studies
Aligns with existing standards (based on evidence in the literature), with a focus on the UK context if relevant
Does not place an undue burden on impact case study authors
Facilitates post-REF analysis while not significantly affecting the narrative nature of the impact case studies
Source: RAND Europe analysis
At this stage, we proposed two high-level categories of standards. We proposed the use of a ‘style guide’ that contains stylistic items that could be standardised to make quantitative indicators of impact, and specific formulations of them, more discoverable across the impact case studies. The topics to be covered by the style guide included numbers, percentages and rates, measures of change, time periods, units and currency. In addition, we developed ‘specific guidance’ that addresses more specific and commonly occurring quantitative indicators of impact in the case studies. The areas covered by the specific guidance included engagement, mentions in non-academic documents and the media, employment, financial figures and emissions. Table A.10 sets out the key rationales that we used to select the areas of standardisation and to develop the specific standards themselves. Table A.11 provides more detailed rationales for four of the sets of guidance (related to numbers, currency, engagement and employment). This table is intended to illustrate the types of decisions that were taken to develop the guidance. This table incorporates the views from the standards-testing phase, described in more detail in the next section.

37
Table A.10 Key rationales used for selecting the areas of standardisation and developing the standards themselves
Style guide Specific guidance
Num
bers
Perc
enta
ges
and
rate
s
Mea
sure
s of
cha
nge
Tim
e pe
riods
Units
Curr
ency
Enga
gem
ent
Men
tions
in n
on-a
cade
mic
do
cum
ents
and
the
med
ia
Empl
oym
ent
Fina
ncia
l figu
res
Emis
sion
s
Criteria for selecting the areas of standardisation (i.e. the types of indicators to be standardised)
Frequently occurs in the impact case study sentences examined
✓ ✓ ✓ ✓ ✓ ✓ ✓ ✓ ✓ ✓
Is an area of anticipated post-REF analysis
✓ ✓ ✓ ✓ ✓
Is an area where standardisation would improve the ease of analysis
✓ ✓ ✓ ✓ ✓ ✓ ✓ ✓ ✓ ✓ ✓
Criteria for selecting the standards for these indicators
Is one of the most commonly used formulations across the impact case studies
✓ ✓ ✓ ✓
Aligns with existing standards (based on the evidence in the literature), with a focus on the UK context if relevant
✓ ✓ ✓ ✓ ✓
Does not place an undue burden on impact case study authors
✓ ✓ ✓ ✓ ✓ ✓ ✓ ✓ ✓ ✓ ✓
Facilitates post-REF analysis while not significantly affecting the narrative nature of the impact case studies
✓ ✓ ✓ ✓ ✓ ✓ ✓ ✓ ✓ ✓ ✓
Source: RAND Europe analysis
38 Guidance for standardising quantitative indicators of impact within REF case studies
Table A.11 Detailed exemplary rationale for selected areas of proposed guidance
Area of standardisation Guidance for standardisation Rationale
Numbers
We proposed guidance for numbers to improve discoverability, so that all numbers are written in the same way.
Use numerals when referring to quantitative indicators of impact (e.g. ‘4’, ‘1,567’, ‘2,000,000’).
Numbers are most commonly written out using numerals; therefore we propose this as the standard way of writing them, including small numbers, which, according to many style guides, would be written out.
Use commas for the thousands separator in numbers of 4 digits or more (e.g. ‘1,567’, ‘2,000,000’).
There are a variety of ways numbers could be written out, many of which are discoverable using text mining provided they are all written the same way. We have proposed for them to be written out using comma separation, as this maintains readability.
Use precise figures where possible. If using a non-exact figure, use ‘approximately [X]’ (e.g. ‘approximately 100 people’, ‘approximately GBP1,000,000’).
We have proposed the use of just one term to indicate lack of certainty in relation to a number. ‘Approximately’ was the most commonly used way of indicating lack of certainty in the REF 2014 case studies.
If decimal points are necessary, use 2 decimal points where possible (e.g. ‘0.29’, ‘8.17’, ‘2,000.88’).
In order to provide consistency across the case studies, we have also proposed the number of decimal points to use where appropriate (the chosen number is 2).
Currency
We proposed guidance for currency to improve discoverability, so that all currency amounts are written in a consistent manner and so that enough information is provided that figures not in GBP are convertible to GBP.
Where currency is described, use the three-letter alphabetic currency code as specified in the ISO standard, ISO 4217:2015 (e.g. GBP, EUR, USD, AUD).
Three-letter alphabetic currency codes were chosen because they are unique, while symbols (which were more commonly used in the case studies) are not (e.g. $ can be used to refer to USD, AUD, etc.)
Do not include a space between the currency code and the number (e.g. ‘GBP100’, ‘GBP8,170.48’).
We have proposed a specific way to use the alphabetic currency codes, to ensure ease of discoverability.
Use GBP as the standard currency. GBP was chosen as the standard currency because it is the currency in the UK.
If a currency other than GBP is used, provide the month and year in which the original figure was calculated in parentheses following the figure (e.g. ‘has contributed approximately USD19,000,000 (August 2013) gross value-added (GVA) to the region in shareholder return salaries and infrastructure spend’).
We have proposed that, if the currency is not in GBP, the month of the currency figure be provided to ensure that conversion to GBP is possible when post-REF analysis is carried out.
39
Area of standardisation Guidance for standardisation Rationale
Engagement
Sentences describing engagement are common within the case studies and are of interest for post-REF analysis.
Use specific terms where appropriate (e.g. ‘parents’, ‘children’, ‘students’).
We chose to keep and encourage such specific terms because interviewees felt that they were very important for the analysis of the case studies during the REF exercise.
Use the formulation ‘… [X] people ([SPECIFIC INFORMATION]) …’ (e.g. ‘viewed by 50 people (children aged 10 to 15 and their school teachers)’, ‘attended by approximately 2,500 people (junior doctors)’).
To allow for discoverability, we propose that, as well as the specific information, the number of people is also provided. For readability, we suggest that the number of people be placed before the more specific details.
Employment
Descriptions of numbers of staff were common in the case studies, but the ways in which they were described varied.
When referring to increasing employment as an outcome of research, where possible include both the headcount and the number of FTEs (where FTE is full-time equivalent) (e.g. ‘generated 10 jobs (headcount: 10; FTEs: 10), ‘this created 50 part-time jobs (headcount: 50; FTEs: 25)’).
FTE and headcount were chosen as two ways to standardise descriptions of employment, as they each have specific definitions. We chose two ways for describing employment instead of one because interviewees raised the importance of being able to retain the key details for the analysis of the case studies during the REF exercise.
Source: RAND Europe analysis
A.4. Testing of the proposed standardsThe different indicators that were identified for potential standardisation, as well as the corresponding proposed standards themselves, were tested, validated and refined through a process of iterative consultation with experts. We first consulted the REF Environment Working Group of the Forum for Responsible Research Metrics (FFRRM) at a workshop organised by HEFCE on 5 February 2018. In addition, between 15 and 20 February 2018, we conducted 5 targeted semi-structured interviews with different stakeholders that included senior experts working in the higher education sector. The interviewees spanned multiple disciplines, including research management, the sciences, the arts and humanities, and scientometrics.
The FFRRM Working Group members and the interviewees were provided with a summary of the findings in advance of the presentation and interviews, respectively. Through these consultations, we sought to obtain feedback on the indicators and the proposed standards. Some of the main questions we asked included the following:
• What indicators are missing that could potentially be standardised?
• What observations do you have in relation to the appropriateness of the suggested standards?
40 Guidance for standardising quantitative indicators of impact within REF case studies
• Is the disciplinary spread of indicators described appropriate?
• What are some of the challenges that the suggested standards could pose for implementation (e.g. with respect to specific disciplines)?29
The Working Group members and interviewees were all largely supportive of the approach taken by us to produce guidance for standardisation. The list of areas for standardisation was felt to be generally appropriate, and there was no indication that there were major gaps. At the FFRRM Working Group meeting, there was a discussion about whether digital engagement, such as website views, downloads and social media engagement, should be standardised. On the whole, it was felt that, as there are so many different indicators in this area, standardising them would not be appropriate. Two interviewees also felt that digital engagement was the one area where there may be a gap, but they appreciated why standardising this area might be challenging.
At the FFRRM Working Group meeting and during the interviews, we discussed the details of some of the specific guidance for standardisation that we had proposed. In particular in relation to the area of engagement, concerns were raised that moving towards standardisation could potentially lead to loss of key details of interest during the analysis of the case studies themselves. Interviewees also commented on some of the specific terminology we had used, and they asked about specific cases that did not fit within our preliminary guidance for standardisation. These details were used to refine the guidance for standardisation. The discussions also touched on the underlying purpose of the standardisation and on potential issues that improving ease of analysis could raise for the use of responsible metrics, thus highlighting the need for REF guidance to be clear about how the data should and should not be used.
A.5. Synthesis of evidence and reportingIn the final task, we triangulated and synthesised evidence from the previous tasks to produce a final report that addressed the core objectives of the study. The report highlights two categories of standardisation: (i) a ‘style guide’ that addresses the way quantitative data are presented in impact case studies; and (ii) ‘specific guidance’ that covers more specific and frequently occurring quantitative indicators that have been used as evidence of impact in the case studies. For each topic that we identified within these two categories, we provide a concise explanation about the indicator, followed by a proposed approach to standardising the indicator. We also include examples of use of the suggested guidance.
29 `Inrelationtothisquestion,oneoftheconsiderationswasthepotentialintroductionofadditionalburdenonHEIspreparing impact case studies for REF 2021.