guidance on determining asset deterioration and the … · essential to use engineering judgement...
TRANSCRIPT

Product Code: SCHO0509BQAT-E-P
Guidance on determining asset deterioration and the use of condition grade deterioration curves

ii Science Report – Guidance on determining asset deterioration
The Environment Agency is the leading public body protecting and improving the environment in England and Wales.
It’s our job to make sure that air, land and water are looked after by everyone in today’s society, so that tomorrow’s generations inherit a cleaner, healthier world.
Our work includes tackling flooding and pollution incidents, reducing industry’s impacts on the environment, cleaning up rivers, coastal waters and contaminated land, and improving wildlife habitats.
This report is the result of research commissioned and funded by the Environment Agency’s Science Programme.
Published by: Environment Agency, Rio House, Waterside Drive, Aztec West, Almondsbury, Bristol, BS32 4UD Tel: 01454 624400 Fax: 01454 624409 www.environment-agency.gov.uk ISBN: 978-1-84911-056-3 © Environment Agency May 2009 All rights reserved. This document may be reproduced with prior permission of the Environment Agency. The views and statements expressed in this report are those of the author alone. The views or statements expressed in this publication do not necessarily represent the views of the Environment Agency and the Environment Agency cannot accept any responsibility for such views or statements. This report is printed on Cyclus Print, a 100% recycled stock, which is 100% post consumer waste and is totally chlorine free. Water used is treated and in most cases returned to source in better condition than removed. Further copies of this report are available from: The Environment Agency’s National Customer Contact Centre by emailing: [email protected] or by telephoning 08708 506506.
Author(s): Jaap Flikweert (Royal Haskoning) Peter Lawton (Consulting Engineer) Marta Roca Collell (HR Wallingford) Jonathan Simm (HR Wallingford) Dissemination Status: Publicly available / Released to all regions Keywords: deterioration rate, asset management, flood defences, maintenance Research Contractor: Consortium led by HR Wallingford Ltd Howbery Park, Wallingford, Oxon, OX108BA Tel: +44(0)1491 835381 Consortium members: Royal Haskoning Peter Lawton (Consulting Engineer) Environment Agency’s Project Manager: Tim Hopkins/Stefan Laeger Science Project Number: SC060078/SR1 Product Code: SCHO0509BQAT-E-P

Science Report – Guidance on determining asset deterioration iii
Science at the Environment Agency Science underpins the work of the Environment Agency. It provides an up-to-date understanding of the world about us and helps us to develop monitoring tools and techniques to manage our environment as efficiently and effectively as possible.
The work of the Environment Agency’s Science Department is a key ingredient in the partnership between research, policy and operations that enables the Environment Agency to protect and restore our environment.
The science programme focuses on five main areas of activity:
• Setting the agenda, by identifying where strategic science can inform our evidence-based policies, advisory and regulatory roles;
• Funding science, by supporting programmes, projects and people in response to long-term strategic needs, medium-term policy priorities and shorter-term operational requirements;
• Managing science, by ensuring that our programmes and projects are fit for purpose and executed according to international scientific standards;
• Carrying out science, by undertaking research – either by contracting it out to research organisations and consultancies or by doing it ourselves;
• Delivering information, advice, tools and techniques, by making appropriate products available to our policy and operations staff.
Steve Killeen
Head of Science

iv Science Report – Guidance on determining asset deterioration
Executive summary
This guide provides asset deterioration curves and explains how to use them to establish the residual life of different types of flood defence assets. Vertical walls, embankments, culverts, dunes and shingle beaches are covered.
The curves are based on the condition grades defined in the Condition Assessment Manual (Environment Agency, 2006). The deterioration curves consider the type of environment (fluvial or coastal), type of material, width of the asset, whether maintenance is carried out and whether there is rear protection.
A table with deterioration rates for different condition grades and different asset types that summarises information from deterioration curves is also provided. The time (in years) to move between different condition grades is obtained from the difference between figures corresponding to those conditions grades.
A step-by-step guide supported with two examples of composite structures is provided.

Science Report – Guidance on determining asset deterioration v
Contents 1 Introduction 1
2 Using the deterioration table 3
3 Step-by-step guide 5 3.1 Steps to follow 5 3.2 Examples of application 7
4 Deterioration curves – supporting explanations of curves provided for different asset types 11
4.1 Vertical walls 11 4.2 Embankments 16 4.3 Culverts 21 4.4 Dunes and shingle beaches 22
5 Structure-specific assessments 23
6 Conclusions 25
References 26
Glossary 27
Annex: Links with the NFCDD Defence Class Code 28 Table 1.1 Condition grades 1 Table 2.1 Deterioration times (years) to different condition grades for different asset types and exposures 4 Figure 4.1 Vertical brick, masonry or concrete wall 11 Figure 4.2 Vertical sheet wall structure 13 Figure 4.3 Embankment with turfed surface protection 16 Figure 4.4 Embankment with hard surface protection 17


Science Report – Guidance on determining asset deterioration 1
1 Introduction Condition grade deterioration curves offer a standardised approach to assess and quantify the deterioration of flood defence assets.
Condition grades are based on the Condition Assessment Manual, CAM, (Environment Agency 2006) definitions of condition grades per asset type (as described in text and illustrations in CAM). Five condition grades are used, with their general descriptions given in Table 1.1 and with key features specific to asset types also given in the CAM.
Table 1.1 Condition grades
Grade Description of condition Extent of defects
1 Very good Cosmetic defects that will have no effect on performance.
2 Good Minor defects that will not reduce overall performance of asset.
3 Fair Defects that could reduce performance of asset.
4 Poor Defects that would significantly reduce performance of asset.
5 Very poor Severe defects resulting in complete performance failure. Source: Condition Assessment Manual, Environment Agency, 2006
Deterioration curves quantify the residual life of some type of assets and for different condition grades with and without maintenance, allowing the user to evaluate their deterioration over time (years).
Deterioration rates in these curves are based on the experiences of a range of practitioners, asset managers and consulting engineers, with regard to deterioration of flood defence assets in both coastal and fluvial environments.
Deterioration curves presented in this guidance used as a starting point the work developed in the Performance Based Asset Management System (PAMS) project, described in the note entitled Guidance on asset deterioration and the use of condition grade deterioration curves (Defra/ Environment Agency 2009). Curves were modified here to take account of the experience gathered through 20 interviews conducted with Environment Agency area staff in operations delivery and asset systems management and enforcement and with local authority coastal protection engineers. The revised curves were established using feedback from a meeting involving the following experts: Jonathan Simm (HR Wallingford), Jaap Flikweert (Royal Haskoning) Peter Lawton (independent consultant) and Tim Hopkins from the Environment Agency (National Capital Programme Management Service). Assumptions were made when categorising condition grades and deterioration time estimates.
This report presents these deterioration curves and explains how to use them with an accompanying table to determine the residual life of a flood defence asset. It is essential to use engineering judgement and practical experience alongside this guidance to apply and adapt the deterioration curves appropriately.
Envisaged users are asset managers from the Environment Agency or any other asset management organization, such as local authorities and in particular staff making decisions about long-term asset management such as SAMPs (System Asset Management Plans).

2 Science Report – Guidance on determining asset deterioration
The deterioration table is presented in Chapter 2. Chapter 3 gives a step-by-step guide to forecasting the expected deterioration time to another condition grade, with two examples. Chapter 4 describes the different asset types and defence classes, highlighting the assumptions made in developing the deterioration table. It also indicates important considerations when assessing deterioration for different kinds of structures. Chapter 5 describes the factors to consider when assessing specific deterioration rates.

Science Report – Guidance on determining asset deterioration 3
2 Using the deterioration table The types of assets analysed in this guide are:
• vertical walls • embankments • culverts • dunes and shingle beaches.
These assets are further classified depending on the type of environment (fluvial or coastal), type of material, width of the asset (narrow or wide), whether maintenance is being carried out and whether there is any crest or rear protection.
For each classification three categories of deterioration rates are provided in Table 2.1, reflecting estimates of the most likely (best estimate), fastest and slowest deterioration rates. In choosing the most appropriate rate category, account should be taken of:
• the loading and environmental conditions acting upon the asset; • the degree of difference from the assumed ‘standard’ conditions (which the
asset was designed for). The ‘best estimate’ in the table assumes ‘standard’ conditions. If the loading on, or aggressiveness of environmental conditions around, an asset is likely to be higher or lower than typical design conditions, a faster or slower rate of deterioration should be chosen depending on the severity of this shift. Engineering knowledge and local experience should be used in making any shift from average conditions.
In most cases, it was not possible to distinguish the effects of crest and rear protection on deterioration rates compared with assets with only front face protection.
Foundation deterioration is not taken into account in these discussions unless mentioned explicitly.
Professional judgement is needed to classify flood defence assets as they are unique structures, often made up of more than one basic type. In such cases, to develop an overall deterioration curve, it may be necessary to consider the deterioration curves associated with these component asset types in parallel and to choose the points on the curves which provide the limiting values for the overall asset being considered. For assets with revetments, this principle was also followed in the development of deterioration rates in this guide.
Figures in the deterioration table (Table 2.1) indicate the years to move from Condition Grade 1 to the condition grade (CG) of interest. For example, for a vertical wall of gabions in a fluvial environment, the best estimate for Condition Grade 4 is 22. This indicates that the years to move from CG1 to CG4 are 22. The time to move from any CG to a worst CG is the difference between both figures. In the same example, the time to move from CG3 to CG4 is the difference between 22 (CG4) and 10 (CG3), hence 12 years.
Only a generalised or “usual” maintenance regime has been considered for the ‘with maintenance’ curves; no distinction has been made between proactive and reactive types of maintenance, though deterioration rates are likely to be different for different maintenance types. The type of maintenance is therefore another factor that needs to be taken into account when choosing between slow, best estimate and fast rates (as well as exposure to deterioration agents).

4 Science Report – Guidance on determining asset deterioration
Table 2.1 Deterioration times (years) to different condition grades for different asset types and exposures

Science Report – Guidance on determining asset deterioration 5
3 Step-by-step guide
3.1 Steps to follow • Step 1: Identify the type of asset: vertical walls, embankments, culverts,
dunes and shingle beaches. If the asset is of composite construction, identify all significant asset types present. Complete the selection of the type of asset by identifying:
- The type of material that the asset is made of:
for vertical walls: gabion, brick and masonry, concrete or sheet piles
for embankments, the type of revetment: turf, rigid, riprap, flexible, permeable, impermeable
- If the asset is an embankment in a fluvial environment: define if it is narrow or wide and whether there is crest or rear slope protection; coastal embankments are most vulnerable to front face damage and hence these factors are not critical in this case.
• Step 2: Identify the factors influencing the asset life:
- The environment which influences the asset: fluvial or coastal. For this purpose, coastal defences are those which are predominantly affected by a combination of wave action and saline conditions.
- Whether there is normal or no maintenance.
• Step 3: Identify the appropriate deterioration curves:
Select the relevant deterioration curves or figures in the deterioration table for that asset. Where the asset is made up of more than one basic type, it may be necessary to consider deterioration curves from the component structure types in parallel and to choose the points on the curves which provide the limiting values for the overall asset being considered.
• Step 4: Determine the deterioration curve
Using engineering judgement and local experience, determine the deterioration curve/profile by selecting or interpolating between best estimate, fastest and slowest deterioration curves/profiles taking account of:
- The loading and environmental conditions acting upon the asset compared with the assumed ‘standard’ or design conditions.
- In case of maintenance, the level of maintenance or approach (reactive/proactive).
• Step 5: Assess the current condition grade
Use the Environment Agency’s Condition Assessment Manual to assess the current condition grade (see Table 2.1).

6 Science Report – Guidance on determining asset deterioration
• Step 6: Forecast the expected deterioration time
Forecast the expected deterioration time(s) to the next condition grade(s) using the selected or interpolated deterioration curve. It is assumed that it takes the full period to get to the next condition grade; hence, there are no intermediate states between condition grades. For example, to move from CG2 to CG5 it takes the difference between both figures. For a vertical wall of gabions in a fluvial environment, the fastest estimate to move from CG2 to CG5 is 16 years (20 - 4 = 16).

Science Report – Guidance on determining asset deterioration 7
3.2 Examples of application This section presents two examples of application of the step-by-step guide.
3.2.1 Example 1
Extracted from the Thames Estuary 2100 project (Topic 4.7 – Develop Recommendations for Maintenance versus Replacement)
Site Description
This asset is located on Eastern Esplanade on the south side of Canvey Island between Marine Road and Gazelle Drive adjacent to the St Anne’s pumping station.
The current defence comprises a 2.45 m high reinforced concrete wall with wave return constructed as a cap around the top of a 10 m long steel sheet pile. The average crest height of the wall is 6.85 m AOD. A public access area/walkway is located on the landward side of the wall, on the crest of a sand fill embankment approximately 1.3 m below the top of the wall. At the toe of this embankment is the busy Eastern Esplanade road. On the riverward side of the flood wall the embankment slope is protected by a bitumen-grouted stone revetment, which is subject to wave action and tidal influence. It is understood that the construction date of these defences was roughly 1984.
The defence at this location has a Condition Grade of 1.
There are flood gates and public access steps provided at regular intervals along the length of the flood wall.
From the British Geological Survey borehole information adjacent to the site (long section ref: N20 and borehole ref: BH01C) the immediate underlying ground strata are shown to be soft alluvial silts.

8 Science Report – Guidance on determining asset deterioration
Step 1: Identify the type of asset
This is a composite structure with three different types of assets:
concrete wall
sheet pile
impermeable (bitumen-grouted stone) revetment
Step 2: Identify the factors influencing the asset life
Coastal environment
Normal maintenance in concrete wall and revetment
No maintenance in sheet piles
Step 3: Identify the appropriate deterioration curves
Three deterioration rates are extracted from Table 2.1 considering the options:
Vertical wall / Coastal / Concrete / Both / Normal
Vertical wall / Coastal / Sheet piles / Both / No
Embankment / Coastal / Impermeable / Both / Normal
Best estimate (m) Fastest estimate (m) Slowest estimate (m) 1 2 3 4 5 1 2 3 4 5 1 2 3 4 5 Concrete wall 0 10 30 65 80 0 5 15 30 35 0 20 60 120 150
Sheet piles 0 8 30 43 50 0 4 12 25 30 0 10 44 60 70 Impermeable revetment 0 13 25 42 50 0 5 15 25 30 0 20 60 120 150
The deterioration curve for the composite structure is obtained from the limiting values of the three curves above
Best estimate (m) Fastest estimate (m) Slowest estimate (m) 1 2 3 4 5 1 2 3 4 5 1 2 3 4 5 Composite structure 0 8 25 42 50 0 4 12 25 30 0 10 44 60 70
Step 4: Determine the deterioration curve
The best estimate is chosen as it is assumed that the asset is under standard conditions.
Best estimate (m) 1 2 3 4 5 Composite structure 0 8 25 42 50
Step 5: Asses the current condition grade
Condition Grade 1 is the actual CG of the asset, given the information provided.
Step 6: Forecast the expected deterioration time
The time for the asset to deteriorate from its current condition grade (CG1) to Condition Grade 3, which is considered the minimum condition grade acceptable for that structure, is 25 years.
Science Report – Guidance on determining asset deterioration 9
3.2.2 Example 2
Site Description
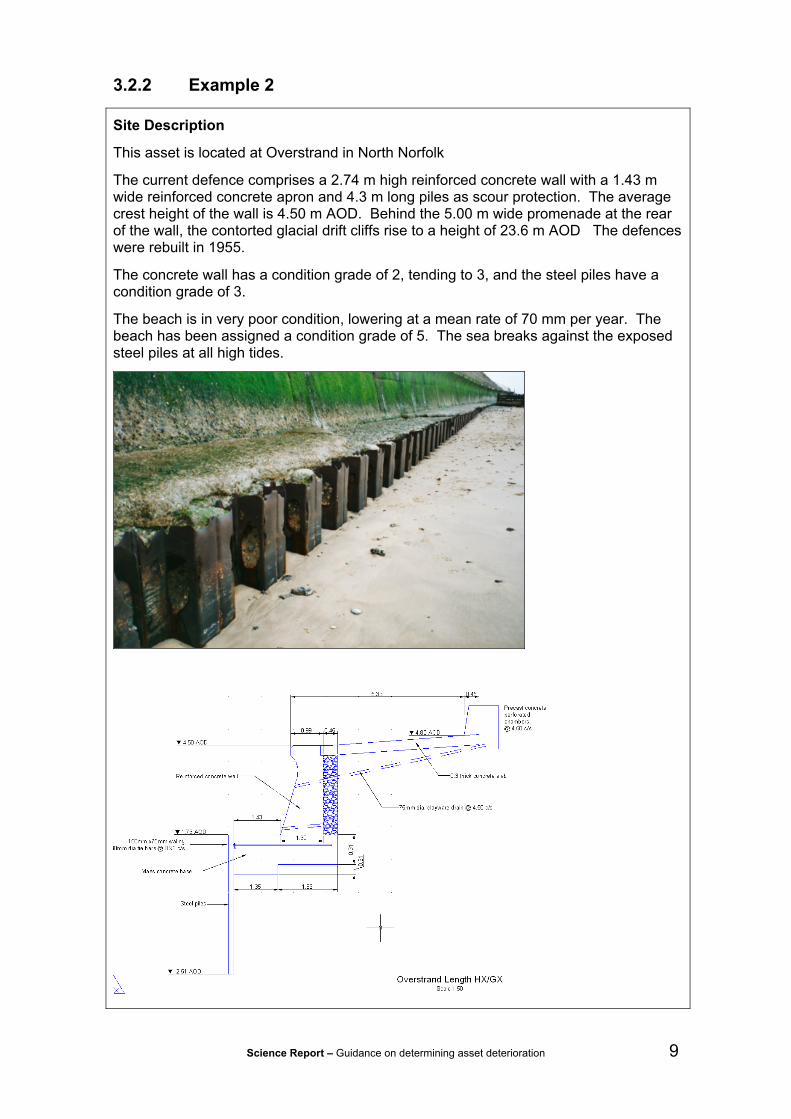
This asset is located at Overstrand in North Norfolk
The current defence comprises a 2.74 m high reinforced concrete wall with a 1.43 m wide reinforced concrete apron and 4.3 m long piles as scour protection. The average crest height of the wall is 4.50 m AOD. Behind the 5.00 m wide promenade at the rear of the wall, the contorted glacial drift cliffs rise to a height of 23.6 m AOD The defences were rebuilt in 1955.
The concrete wall has a condition grade of 2, tending to 3, and the steel piles have a condition grade of 3.
The beach is in very poor condition, lowering at a mean rate of 70 mm per year. The beach has been assigned a condition grade of 5. The sea breaks against the exposed steel piles at all high tides.
10 Science Report – Guidance on determining asset deterioration
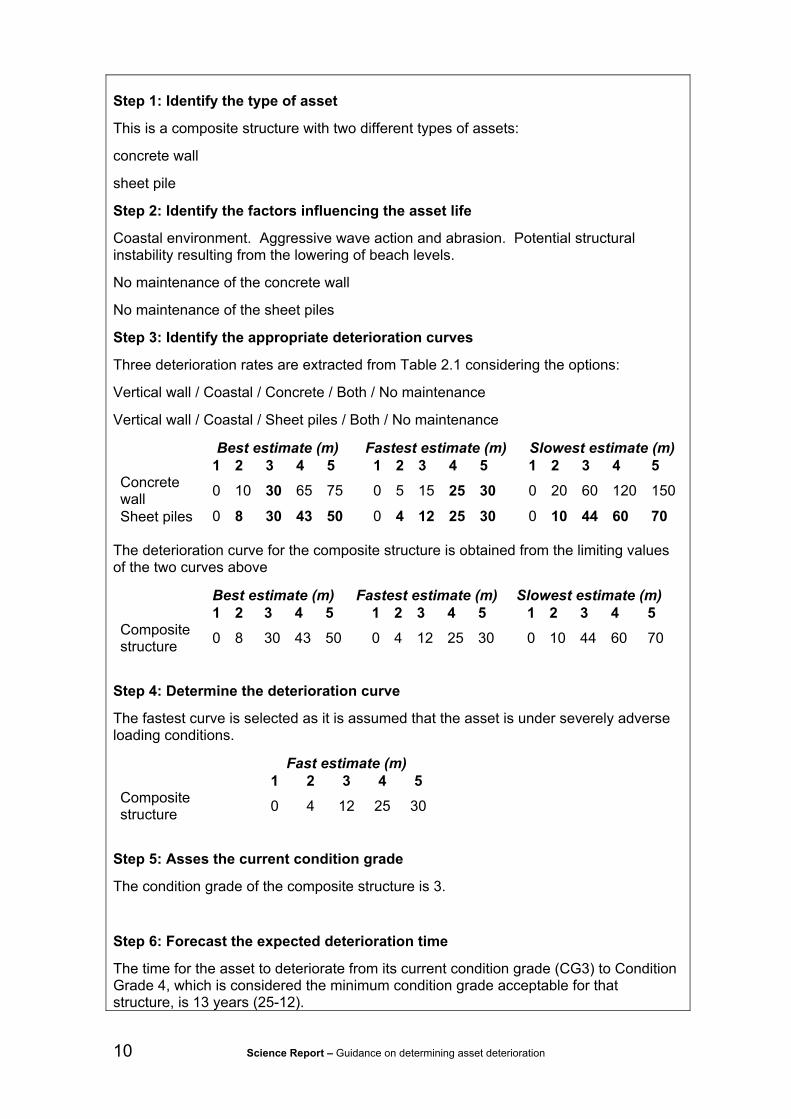
Step 1: Identify the type of asset
This is a composite structure with two different types of assets:
concrete wall
sheet pile
Step 2: Identify the factors influencing the asset life
Coastal environment. Aggressive wave action and abrasion. Potential structural instability resulting from the lowering of beach levels.
No maintenance of the concrete wall
No maintenance of the sheet piles
Step 3: Identify the appropriate deterioration curves
Three deterioration rates are extracted from Table 2.1 considering the options:
Vertical wall / Coastal / Concrete / Both / No maintenance
Vertical wall / Coastal / Sheet piles / Both / No maintenance
Best estimate (m) Fastest estimate (m) Slowest estimate (m) 1 2 3 4 5 1 2 3 4 5 1 2 3 4 5 Concrete wall 0 10 30 65 75 0 5 15 25 30 0 20 60 120 150
Sheet piles 0 8 30 43 50 0 4 12 25 30 0 10 44 60 70 The deterioration curve for the composite structure is obtained from the limiting values of the two curves above
Best estimate (m) Fastest estimate (m) Slowest estimate (m) 1 2 3 4 5 1 2 3 4 5 1 2 3 4 5 Composite structure 0 8 30 43 50 0 4 12 25 30 0 10 44 60 70
Step 4: Determine the deterioration curve
The fastest curve is selected as it is assumed that the asset is under severely adverse loading conditions.
Fast estimate (m) 1 2 3 4 5 Composite structure 0 4 12 25 30
Step 5: Asses the current condition grade
The condition grade of the composite structure is 3.
Step 6: Forecast the expected deterioration time
The time for the asset to deteriorate from its current condition grade (CG3) to Condition Grade 4, which is considered the minimum condition grade acceptable for that structure, is 13 years (25-12).

Science Report – Guidance on determining asset deterioration 11
4 Deterioration curves – supporting explanations of curves provided for different asset types
4.1 Vertical walls Figure 4.1 shows a basic line sketch of this type of asset.
Figure 4.1 Vertical brick, masonry or concrete wall
In fluvial environments the crest width is not considered to have an impact on material-driven deterioration, but might affect geotechnic-driven deterioration (less vulnerability for wider crests). On the other hand, a wider structure will make the wall more accessible and hence more vulnerable to human-induced deterioration. On balance, the same deterioration rates are applicable for both narrow and wide walls.
No distinction can be made between: front-only protected, front and crest protected and front, crest and rear protected assets.
For coastal vertical walls the main processes happen at the front face of the wall, hence the crest width has no influence on deterioration processes. The same curve is therefore applicable to narrow and wide walls in this case.
The foundations of the walls are assumed to be stable.
4.1.1 Fluvial environment
Gabion
The factors that determine variability of deterioration rates are:
• Quality of materials and construction processes; for example, packing quality for the gabion stone is very important.
• Acidity and salinity of the water, which affect the corrosion rate of the wire baskets, though gabions are rarely used in saline water.
• Morphological activity, which can cause distortion of baskets, for example abrasion of plastic coatings by sand transport.

12 Science Report – Guidance on determining asset deterioration
As it is difficult to carry out any effective maintenance, the curve for the with-maintenance scenario is not distinguished from the no-maintenance scenario.
Evolution to CG3 occurs rapidly because of settling of stones and corrosion. As indicated by the fastest curve, the initial quality of construction can speed up deterioration.
Values for fastest and slowest deterioration are about 75 and 125 per cent of the best estimate.
Vertical wall - Fluvial Environment - Gabions
1
2
3
4
50 5 10 15 20 25 30 35
Time (years)
Con
ditio
n gr
ade
Best Fast Slow
Brick and masonry
Mortar loss from joints by the action of water, animals or plants is the main factor in deterioration. The action of vessels travelling along or mooring alongside walls can also be significant for deterioration from damage or abrasion.
Lifetimes of over 100 years for such structures are considered reasonable in some cases due to experience in such locations as Manchester; there, structures dating from the industrial revolution are still performing well, though the degree of maintenance carried out is unclear. Masonry structures are rarely constructed now.
Simple basic maintenance (such as repointing of brickwork) can have a big impact on deterioration rates. With maintenance, the best deterioration rates are close to the slowest estimate.
The lack of maintenance mainly affects later stages of deterioration (after CG3).
For the slowest estimate, the transition to CG2 is related to cracking and the transition to CG3 to loss of mortar. Evolution from CG4 to CG5 will be very quick.
Quality of construction or design is the main factor influencing the fast deterioration estimate.
Vertical wall - Fluvial Environment - Brick&Masonry/Concrete
1
2
3
4
50 20 40 60 80 100 120 140 160
Time (years)
Con
ditio
n gr
ade
Best -No maintenanceFast -No maintenanceSlow -No maintenanceBest -MaintenanceFast -MaintenanceSlow -Maintenance

Science Report – Guidance on determining asset deterioration 13
Concrete
The material often used in fluvial environments is mass concrete. In this case, deterioration rates can be considered the same as brick and masonry.
For reinforced concrete, though its deterioration rates are generally covered by the brick and masonry curves, some small differences (more rapid deterioration) from the brick and masonry curves might appear at the end of the curves. On balance, the same curves as for brick and masonry structures are adopted.
Sheetpiles
The main deterioration process of sheetpiles (Figure 4.2) is corrosion and includes:
• corrosion of the pans of piles which creates loss of bending capacity;
• corrosion of the thinner webs of piles that then allow loss of material through the wall;
• corrosion of any tie anchors which lead to the anchors failing and the wall collapsing.
Figure 4.2 Vertical sheet wall structure
Whilst corrosion is a uniform process, because the differences between condition grades are not equal, the time steps in the deterioration curves are not equal.
Information provided by interviewees suggested that sheetpiles 100-120 years old could still be performing in non-aggressive environments (in the Thames region), or 50-years old sheetpiles in good condition with limited maintenance in Nottingham, Ipswich and Feering.
Maintenance activities such as painting will prolong structural life, although surface preparation and correct paint application are often difficult to achieve. Hence, differences between maintenance and non-maintenance are insignificant.
The quality of the paint system defines the form of degradation from CG1 to CG2; in the best and slowest estimates, it takes about 20 years before the paint starts to break down. The subsequent time to CG3 takes longer as corrosion only sets in when the paint has gone.
Fastest estimates are related to geotechnical processes (slip, erosion). In this case, deterioration rates are more likely to be in line with those for brick and masonry material. This is because the causes of failure for both types of structure will be similar, not driven by the materials themselves but by the ground conditions.
It is assumed that no cathodic protection is provided.
14 Science Report – Guidance on determining asset deterioration
Vertical wall - Fluvial Environment - Sheet piles
1
2
3
4
50 20 40 60 80 100 120 140 160 180
Time (years)
Con
ditio
n gr
ade
Best Fast Slow
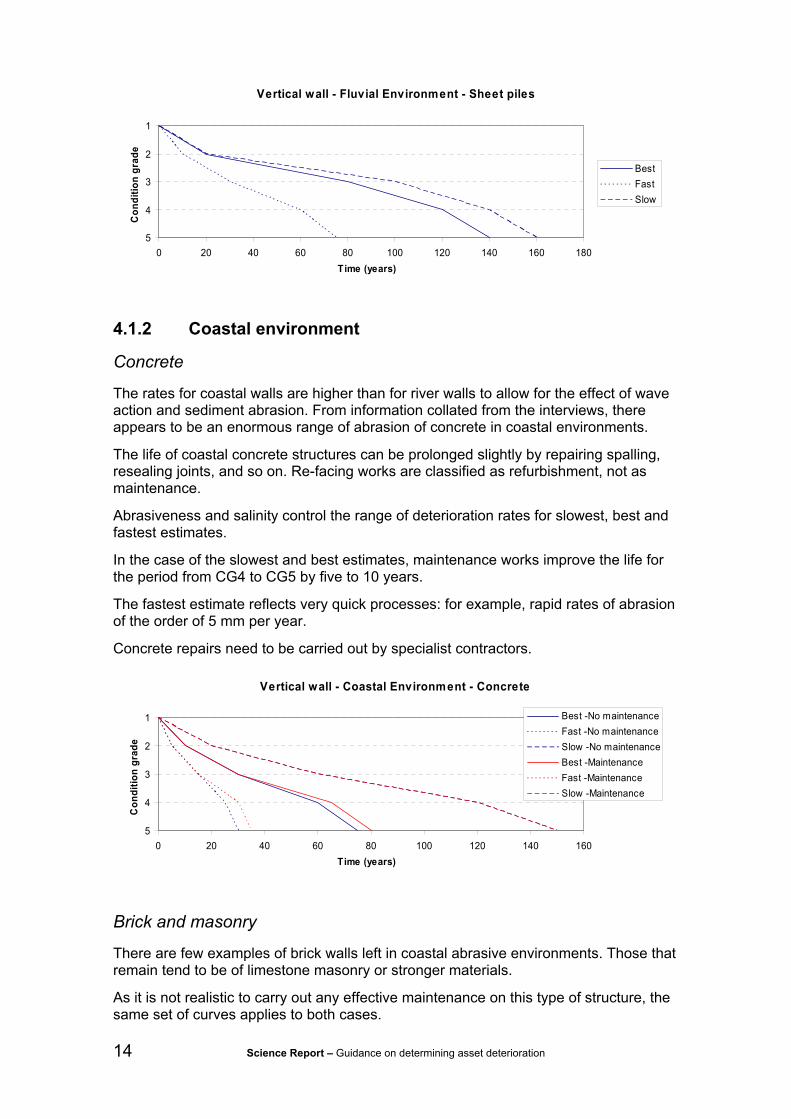
4.1.2 Coastal environment
Concrete
The rates for coastal walls are higher than for river walls to allow for the effect of wave action and sediment abrasion. From information collated from the interviews, there appears to be an enormous range of abrasion of concrete in coastal environments.
The life of coastal concrete structures can be prolonged slightly by repairing spalling, resealing joints, and so on. Re-facing works are classified as refurbishment, not as maintenance.
Abrasiveness and salinity control the range of deterioration rates for slowest, best and fastest estimates.
In the case of the slowest and best estimates, maintenance works improve the life for the period from CG4 to CG5 by five to 10 years.
The fastest estimate reflects very quick processes: for example, rapid rates of abrasion of the order of 5 mm per year.
Concrete repairs need to be carried out by specialist contractors.
Vertical wall - Coastal Environment - Concrete
1
2
3
4
50 20 40 60 80 100 120 140 160
Time (years)
Con
ditio
n gr
ade
Best -No maintenanceFast -No maintenanceSlow -No maintenanceBest -MaintenanceFast -MaintenanceSlow -Maintenance
Brick and masonry
There are few examples of brick walls left in coastal abrasive environments. Those that remain tend to be of limestone masonry or stronger materials.
As it is not realistic to carry out any effective maintenance on this type of structure, the same set of curves applies to both cases.

Science Report – Guidance on determining asset deterioration 15
For the slowest deterioration estimates, the same curves as those adopted for concrete coastal walls apply.
The fastest rates are slower than those for comparable concrete structures because materials are likely to be tougher.
Vertical wall - Coastal Environment - Brick&Masonry
1
2
3
4
50 20 40 60 80 100 120 140 160
Time (years)
Con
ditio
n gr
ade
Best Fast Slow
Sheetpiles
Compared with fluvial sheetpiled walls, coastal sheetpiles have a significantly shorter life due to the saline environment and constant abrasion.
The general shape of the curves remains the same as for fluvial piles but with new ratios compared to CG5.
Plating is the most likely form of maintenance work that improves the asset life. It is relevant for slowest and best estimates and once CG3 is achieved.
The slowest estimate is based on buried walls in the beach that are out of the abrasion and splash zone.
Vertical wall - Coastal Environment - Sheet piles
1
2
3
4
50 10 20 30 40 50 60 70 80 90
Time (years)
Con
ditio
n gr
ade
Best -No maintenanceFast -No maintenanceSlow -No maintenanceBest -MaintenanceFast -MaintenanceSlow -Maintenance

16 Science Report – Guidance on determining asset deterioration
4.2 Embankments
4.2.1 Fluvial environment
Turf protection
The deterioration processes for this structure type (Figure 4.3) are based on turf quality (loss of grass cover), rutting, eventual loss of soil, settlement, vermin infestation and geotechnical problems.
Figure 4.3 Embankment with turfed surface protection
The condition grade of embankments may improve immediately after construction as turf quality improves following seeding.
Maintenance works are assumed to maintain grass cover to an average standard, whereas doing nothing will allow it to become poor rather quickly.
Normal maintenance works, such as grass cutting, vermin control and repairs of rutting, have a real impact on deterioration processes and can extend lifespan practically in perpetuity. The only limitation on life is when geotechnical problems appear, such as slumping. Topping up and settlement is considered refurbishment, not maintenance.
The slowest estimate is governed by the rate of deterioration of natural vegetation and assumes no vermin, no rutting and no geotechnical problems. The transition from CG2 to CG3 can be quite fast, unless very active vegetation management is carried out.
Fastest estimates relate to the presence of poor quality soils or inadequate design and construction of the embankment. There are examples of deterioration from CG4 to CG5 in just two to five years. Normal maintenance works are unlikely to have a big impact on the deterioration curves.
Having a wider embankment brings both positive and negative influences, but as these tend to cancel each other out, the same curve applies for wide and narrow embankments. Without maintenance and in the worst (fastest) conditions, however, deterioration of wider embankments is slower than for narrow embankments. Wider embankments are more likely to have been designed better and be less vulnerable to geotechnical problems which tend to dominate the fast deterioration curve.

Science Report – Guidance on determining asset deterioration 17
Embankment - Fluvial Environment - Turf - Narrow
1
2
3
4
50 20 40 60 80 100 120 140 160 180
Time (years)
Con
ditio
n gr
ade
Best -No maintenanceFast -No maintenanceSlow -No maintenanceBest -MaintenanceFast -MaintenanceSlow -Maintenance
Embankment - Fluvial Environment - Turf - Wide
1
2
3
4
50 20 40 60 80 100 120 140 160 180
Time (years)
Con
ditio
n gr
ade
Best -No maintenanceFast -No maintenanceSlow -No maintenanceBest -MaintenanceFast -MaintenanceSlow -Maintenance
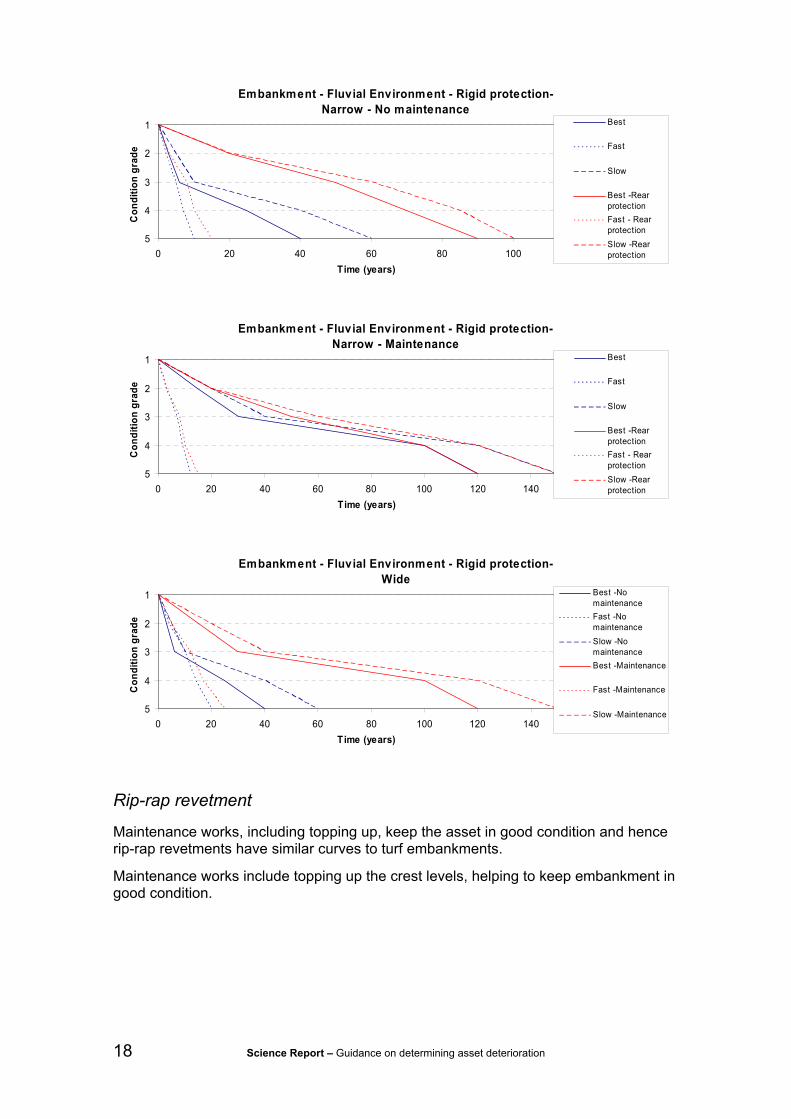
Rigid protection
Rigid face protection (Figure 4.4) will prevent some deterioration processes, but not those related to low quality of soil materials.
Figure 4.4 Embankment with hard surface protection
For rigid protection, material deterioration is the dominant process. A revetment is designed only if required because of loading conditions (for example waves), so failure of the revetment will be equivalent to defence failure.
This type of embankment has a more uniform and slower rate of deterioration than turfed embankments, with the deterioration rate limited by deterioration of cover layer.
For the fastest estimate, the worst predictions for the material underneath the protection dominate deterioration.
When the rear face is considered, deterioration is only dominated by the material (concrete).
18 Science Report – Guidance on determining asset deterioration
Embankment - Fluvial Environment - Rigid protection-Narrow - No maintenance
1
2
3
4
50 20 40 60 80 100 120
Time (years)
Con
ditio
n gr
ade
Best
Fast
Slow
Best -RearprotectionFast - RearprotectionSlow -Rearprotection
Embankment - Fluvial Environment - Rigid protection-Narrow - Maintenance
1
2
3
4
50 20 40 60 80 100 120 140 160
Time (years)
Con
ditio
n gr
ade
Best
Fast
Slow
Best -RearprotectionFast - RearprotectionSlow -Rearprotection
Embankment - Fluvial Environment - Rigid protection-Wide
1
2
3
4
50 20 40 60 80 100 120 140 160
Time (years)
Con
ditio
n gr
ade
Best -NomaintenanceFast -NomaintenanceSlow -NomaintenanceBest -Maintenance
Fast -Maintenance
Slow -Maintenance
Rip-rap revetment
Maintenance works, including topping up, keep the asset in good condition and hence rip-rap revetments have similar curves to turf embankments.
Maintenance works include topping up the crest levels, helping to keep embankment in good condition.

Science Report – Guidance on determining asset deterioration 19
Embankment - Fluvial Environment - Riprap -Narrow - No maintenance
1
2
3
4
50 10 20 30 40 50 60 70
Time (years)
Con
ditio
n gr
ade
Best
Fast
Slow
Best -RearprotectionFast - RearprotectionSlow -Rearprotection
Embankment - Fluvial Environment - Riprap -Narrow - Maintenance
1
2
3
4
50 20 40 60 80 100 120 140 160 180
Time (years)
Con
ditio
n gr
ade
Best
Fast
Slow
Best -RearprotectionFast - RearprotectionSlow -Rearprotection
Embankment - Fluvial Environment - Riprap -Wide
1
2
3
4
50 20 40 60 80 100 120 140 160 180
Time (years)
Con
ditio
n gr
ade
Best -NomaintenanceFast -NomaintenanceSlow -NomaintenanceBest -Maintenance
Fast -Maintenance
Slow -Maintenance
Flexible revetment
The suggested curves are based on the performance of such systems as block revetments, armorflex and so on.
When rear protection is present, the fastest deterioration curves are dominated by geotechnical deficiencies.
When no maintenance is considered, the best and slowest estimates are derived from the ones corresponding to turf embankments.
If maintenance is considered, the best and slowest estimates are derived from the ones corresponding to turf embankments until CG3 is achieved and from the ones corresponding to material (concrete) for CG4 and CG5.

20 Science Report – Guidance on determining asset deterioration
Embankment - Fluvial Environment - Flexible protection -Narrow - No maintenance
1
2
3
4
50 10 20 30 40 50 60 70
Time (years)
Con
ditio
n gr
ade
Best
Fast
Slow
Best -RearprotectionFast - RearprotectionSlow -Rearprotection
Embankment - Fluvial Environment - Flexible protection -Narrow - Maintenance
1
2
3
4
50 20 40 60 80 100 120 140 160
Time (years)
Con
ditio
n gr
ade
Best
Fast
Slow
Best -RearprotectionFast - RearprotectionSlow -Rearprotection
Embankment - Fluvial Environment - Flexible protection -Wide
1
2
3
4
50 20 40 60 80 100 120 140 160
Time (years)
Con
ditio
n gr
ade
Best -NomaintenanceFast -NomaintenanceSlow -NomaintenanceBest -Maintenance
Fast -Maintenance
Slow -Maintenance
4.2.2 Coastal environment
Permeable and impermeable revetment
The main processes driving deterioration of these revetments are toe undermining, the effect of material in the foreshore and deterioration of the material in impermeable revetments.
For the fastest estimate, toe undermining is the main process driving deterioration. Hence, curves are the same for permeable and impermeable revetments. Structures on eroding clay foreshores will last less time than those on chalk or other hard substrates.
For the slowest estimate, deterioration is driven by the material.

Science Report – Guidance on determining asset deterioration 21
Embankment - Coastal environment - Permeable revetment
1
2
3
4
50 20 40 60 80 100 120 140 160
Time (years)
Con
ditio
n gr
ade
Best -No maintenance
Fast -No maintenance
Slow -No maintenance
Best -Maintenance
Fast -Maintenance
Slow -Maintenance
Embankment -Coastal envirornment - Impermeable revetment
1
2
3
4
50 20 40 60 80 100 120 140 160
Time (years)
Con
ditio
n gr
ade
Best -No maintenance
Fast -No maintenance
Slow -No maintenance
Best -Maintenance
Fast -Maintenance
Slow -Maintenance
4.3 Culverts Only deterioration of the culvert itself is considered. Washouts due to overtopping or erosion of adjacent embankments are not taken into account. Culverts are generally well designed and do not suffer very aggressive situations.
Deterioration curves for the best and slowest estimates are based on those for fluvial brick and masonry and concrete walls, regardless of maintenance.
Fastest estimates are quicker in culverts than in fluvial brick and masonry and concrete walls because of variability of materials and difficulties in inspections.
Culverts
1
2
3
4
50 20 40 60 80 100 120 140 160
Time (years)
Con
ditio
n gr
ade
Best -No maintenance
Fast -No maintenance
Slow -No maintenance
Best -Maintenance
Fast -Maintenance
Slow -Maintenance

22 Science Report – Guidance on determining asset deterioration
4.4 Dunes and shingle beaches Given the wide range of natural characteristics and behaviours of this type of asset, it is difficult to assess rates of deterioration. For shingle beaches, initial deterioration is slow but then accelerates; later, following substantial beach loss, further deterioration slows as the remaining beach material ‘rattles around’ the foreshore. A wide range of situations can exist and hence the band of curves has been kept wide.
Dune beaches
1
2
3
4
50 10 20 30 40 50 60 70 80 90
Time (years)
Con
ditio
n gr
ade
Best -No maintenance
Fast -No maintenance
Slow -No maintenance
Best -Maintenance
Fast -Maintenance
Slow -Maintenance
Shingle beaches
1
2
3
4
50 10 20 30 40 50 60 70 80 90
Time (years)
Con
ditio
n gr
ade
Best -No maintenance
Fast -No maintenance
Slow -No maintenance
Best -Maintenance
Fast -Maintenance
Slow -Maintenance

Science Report – Guidance on determining asset deterioration 23
5 Structure-specific assessments
When identifying deterioration curves for specific structures, various options are available from selecting from the deterioration curves given here to making a site-specific evaluation, which could require intensive investigation and monitoring.
If the user does not wish to use standard deterioration curves, or must modify them significantly in the light of local experience, the assessment should be performance-based listing failure modes, parameters of deterioration and how they affect the likelihood of a breach. The following factors should be taken into account.
When assessing specific deterioration rates, it is necessary to take various factors into account. These include:
• the type and design of the structure;
• construction materials used;
• potential weak points;
• forces and influences acting upon the structure.
In addition to any calibration to take account of historic deterioration rates for the structure, factors that asset managers might need to consider for different structures are listed below.
Embankments and sloping seawalls
• Likely rate of reduction in beach/berm level.
• Likely rate of reduction in crest level.
• Likely rate of reduction in foreshore level, gradual loss of slope material.
• Degree of presence of vermin likely to generate holes.
• Degree of cracking (may only be apparent during dry weather).
• Likelihood of soft/saturated areas of the defence or ground nearby during high water levels.
• Risk of vandalism or damage.
• Level of use by vehicles/pedestrians/animals, creating tyre ruts, vegetation and bank damage, worn surface and access points.
• Anticipated loss/increase in extent and quality of vegetation, infestation by invasive plants.
• Likely movement of sections of embankment.

24 Science Report – Guidance on determining asset deterioration
Slope erosion protection
• Likely rate of reduction in level in front of defence.
• Likelihood of saturated slope or ground at crest of defence.
• Potential for future damage to revetment.
• Potential for movement of individual parts of revetment.
• Potential for movement of structure/slips within cliff.
• Potential for local holes and tears within revetment.
• Potential for bulging at the toe.
Vertical wall structures
• Likely rate of reduction in beach level.
• Potential for corrosion of reinforcing steel in concrete.
• Likelihood of distortion of steel piles/gaps in clutches.
• Potential for loss or loosening of tie rod fixings
• Potential for cracking.
• Potential for surface damage to structure.
• Potential for movement of retained ground/defence.
• Likely rate of reduction in foreshore level, damage to slope.
• Likely rate of loss of joint material, erosion around joints, voiding behind structure.
• Rate of growth of vegetation.
• Potential for seepage through wall (from retained section at low water for retaining walls and from landward face or toe during high water levels for walls with lower land immediately behind).
• Likelihood of cracking of concrete with an irregular pattern, disintegration of concrete surface (spalling), corrosion of steel.
Beaches
• Likely rate of reduction in beach level, loss of sediment/beach material.
• Likely rate of reduction in dune crest height, loss of sand volume (increased aeolian transport).
• Likely rate of change in profile of sections of dunes or beaches.
• Likely rate of toe retreat.
• Potential for reduced vegetation cover (dunes).

Science Report – Guidance on determining asset deterioration 25
6 Conclusions This guide provides deterioration curves and explains how to use them to establish the residual life of different types of flood defence assets. Vertical walls, embankments, culverts, dunes and shingle beaches are covered.
The curves are based on the condition grades defined in the Condition Assessment Manual (Environment Agency, 2006). The deterioration curves consider the type of environment (fluvial or coastal), type of material, width of the asset, whether maintenance is carried out and whether there is rear protection.
A table with deterioration rates for different condition grades and different asset types that summarises information from deterioration curves is also provided. The time (in years) to move between different condition grades is obtained from the difference between figures corresponding to those conditions grades.
A step-by-step guide supported with two examples of composite structures is provided.

26 Science Report – Guidance on determining asset deterioration
References Environment Agency (2006). Condition Assessment Manual. Managing flood risk. Document reference 116_03_SD01
Defra/Environment Agency (2009). Guidance on determining asset deterioration and the use of condition grade deterioration curves. PAMS Project, MSF9.1. Unpublished HR Wallingford Ltd, UK

Science Report – Guidance on determining asset deterioration 27
Glossary Best estimate: Deterioration rate estimate assuming standard conditions
around the asset, that is, conditions foreseen in the design stage of the asset.
Condition grade: Standards adopted by the Environment Agency to assess the condition (and hence likely performance) of flood defence assets: 1 being a very good condition and 5 a very poor one.
Defence system: Two or more defences acting to achieve common goals.
Design standard: A performance indicator that is specific to the engineering of a particular defence to meet a particular objective under a given loading condition. The design standard will vary with load; for example there may be different performance requirements under different loading conditions.
Deterioration curve: Expresses the deterioration with time of an asset, in terms of the anticipated time intervals to change from one condition grade to another.
Deterioration: Process involving a decline in the state of structural properties of the asset.
Environmental conditions:
Physicochemical and biological properties of the environment which influence the asset and, in the context of this report, affect its rate of deterioration.
Failure mode: Description of one of any number of ways in which a defence may fail to meet a particular performance indicator.
Failure: Inability to achieve a defined performance threshold (response given loading).
Fast estimate: Deterioration rate estimate assuming more aggressive loadings or environmental conditions that the ones envisaged in the design of the asset.
Load: Factors such as high river flows, water levels and wave heights, to which the flooding and erosion system is subjected.
Maintenance regime: Programme of works undertaken to maintain the performance of an asset to a certain level.
Performance: The degree to which a process or activity succeeds when evaluating against some stated aim or objective.
Residual life: The remaining time that a defence is able to achieve a minimum acceptable value of defined performance in terms of its serviceability function or structural strength.
Slow estimate: Deterioration rate estimate assuming less aggressive loadings or environmental conditions that the ones envisaged in the design of the asset.
Standard conditions: Conditions for which the asset was designed.

28 Science Report – Guidance on determining asset deterioration
Annex: Links with the NFCDD Defence Class Code In the next table, the types of assets described in Table 2.1 are linked with their respective class number following the NFCDD (RASP) Defence Class Code. A list with the assets as they are described in NFCDD is also provided.
Links between the types of assets and the NFCDD Code Number
Gabion Both 1, 2, 3, 39, 40Brick&Masonry / Concrete Both 4, 5, 6, 41, 42, 43
Sheet Piles Both 7, 8, 9, 44Brick&Masonry Both 28, 29 ,30, 56, 57
Concrete Both 25, 26, 27, 54, 55Sheet Piles Both 22, 23, 24, 52, 53
Narrow 10Wide 45
11, 12yes 13
Wide 46, 4714, 15
yes 16Wide 48, 49
17, 18yes 19
Wide 50, 51Permeable revetments Both 31, 32, 33, 58, 59
Impermeable revetments Both 34, 35, 36, 60, 61Culvert 21Dune 37
Shingle 38
NFCDD Class No
Coastal
Flexible Narrow
Rear protection
Vertical wall
Fluvial
Coastal
Type Environment Material Narrow / Wide
EmbankmentFluvial
Turf
Rigid Narrow
Riprap Narrow

Science Report – Guidance on determining asset deterioration 29
List of types of protection as in NFCDD/RASP
