guidelines for design of structures for vertical evacuation from
TRANSCRIPT

Guidelines for Designof Structures for Vertical Evacuation from Tsunamis Second Edition
FEMA P-646 / April 2012
FEMA


FEMA P-646 / April 2012
Guidelines for Design of Structures for Vertical Evacuation from Tsunamis
Second Edition
Prepared by APPLIED TECHNOLOGY COUNCIL 201 Redwood Shores Pkwy, Suite 240
Redwood City, California 94065 www.ATCouncil.org
Prepared for
FEDERAL EMERGENCY MANAGEMENT AGENCY National Earthquake Hazard Reduction Program
NATIONAL OCEANIC AND ATMOSPHERIC ADMINISTRATION
National Tsunami Hazard Mitigation Program
Michael Mahoney, FEMA Project Officer Robert D. Hanson, FEMA Technical Monitor
ATC MANAGEMENT AND OVERSIGHT Christopher Rojahn (Project Executive) William L. Coulbourne (Project Manager) Jon A. Heintz (Project Quality Control Monitor) William T. Holmes (Project Tech. Monitor)
PROJECT MANAGEMENT COMMITTEE (SECOND EDITION) Ian N. Robertson (Project Technical Director) Gary Chock John Hooper Timothy J. Walsh Harry Yeh
PROJECT MANAGEMENT COMMITTEE Steven Baldridge Frank Gonzalez John Hooper Ian N. Robertson Timothy J. Walsh Harry Yeh
PROJECT REVIEW PANEL John Aho George Crawford Richard Eisner Lesley Ewing Michael Hornick Christopher P. Jones Chris Jonientz-Trisler Marc L. Levitan George Priest Charles W. Roeder Jay Wilson

Notice
Any opinions, findings, conclusions, or recommendations expressed in this publication do not necessarily reflect the views of the Federal Emergency Management Agency (FEMA), the National Oceanic & Atmospheric Administration (NOAA), or the Applied Technology Council (ATC). Additionally, neither ATC, FEMA, NOAA, nor any of their employees, makes any warranty, expressed or implied, nor assumes any legal liability or responsibility for the accuracy, completeness, or usefulness of any information, product, or process included in this publication. Users of information in this publication assume all liability arising from such use.
Cover Images: Photographs showing various examples of potential vertical evacuation structures. Clockwise from top left: (1) designated vertical evacuation building in Kesennuma Port, Japan, where numerous residents found safe refuge at the roof level during the 2011 Tohoku tsunami; (2) sports complex where large numbers of people could gain easy access to elevated concourse and seating levels; (3) multi-level cast-in-place reinforced concrete parking garage in Biloxi, Mississippi, that survived storm surge inundation during Hurricane Katrina; and (4) earthen mound with ramp access to a safe elevation. Photographs provided courtesy of Ian Robertson, University of Hawaii at Manoa and Magnusson Klemencic Associates, Seattle, Washington.

Foreword
This publication was equally funded by the National Oceanic and Atmospheric Administration (NOAA), which leads the National Tsunami Hazard Mitigation Program (NTHMP) and by the Federal Emergency Management Agency (FEMA), which is responsible for the implementation portion of the National Earthquake Hazard Reduction Program (NEHRP).
FEMA initiated this project in September 2004 with a contract to the Applied Technology Council. The project was undertaken to address the need for guidance on how to build a structure that would be capable of resisting the extreme forces of both a tsunami and an earthquake. This question was driven by the fact that there are many communities along our nation’s west coast that are located on narrow spits of land and are vulnerable to a tsunami triggered by an earthquake on the Cascadia subduction zone, which could potentially generate a tsunami of 20 feet in elevation or more within 20 minutes. Given their location, it would be impossible to evacuate these communities in time, which could result in a significant loss of life. Many coastal communities subject to tsunami located in other parts of the country also have the same potential problem. In these cases, the only feasible alternative is vertical evacuation, using specially design, constructed and designated structures built to resist both tsunami and earthquake loads.
The significance of this issue came into sharp relief with the December 26, 2004 Sumatra earthquake, the Indian Ocean Tsunami, and the March 11, 2011 Tohoku Japan Tsunami. While these events resulted in a tremendous loss of life, this would have been even worse had not many people been able to take shelter in multi-story reinforced concrete buildings or been able to get to high ground sites after the tsunami warning was delivered. Without realizing it, these survivors were demonstrating the concept of vertical evacuation from a tsunami.
This publication presents the following information:
• General information on the tsunami hazard and its history;
• Guidance on determining the tsunami hazard, including the need for tsunami depth and velocity on a site-specific basis;
• Different options for vertical evacuation from tsunamis;
FEMA P-646 Foreword iii

• Determining tsunami and earthquake loads and structural design criteria necessary to address them; and,
• Structural design concepts and other considerations.
This is the second edition of FEMA P-646, originally published in June 2008. In this second edition revisions were made throughout the document, but particularly to the following items:
• Inclusion of observations and lessons learned from the March 11, 2011 Tohoku tsunami;
• Revision and enhancement of the debris impact expression to remove over-conservatism in the prior edition; and
• Updating of all reference documents to the most current version.
FEMA also issued a companion document in 2009, FEMA P-646A, Vertical Evacuation from Tsunamis: A Guide for Community Officials, that presents information on how the use of this design guidance can be encouraged and adopted at the State and local levels.
FEMA is grateful to the original Project Management Committee of Steve Baldridge, John Hooper, Ian Robertson, Tim Walsh, and Harry Yeh. We are also grateful to the Project Review Committee, the members of which are listed at the end of the document, and to the staff of the Applied Technology Council. The updates included in this second edition were made thanks to Gary Chock, John Hooper, Ian Robertson, Tim Walsh, and Harry Yeh. Their hard work has provided this nation with a first document of its kind, a manual on how citizens may for the first time be able to survive a tsunami, one of the most terrifying natural hazards known.
– Federal Emergency Management Agency
iv Foreword FEMA P-646

Preface
In September 2004 the Applied Technology Council (ATC) was awarded a “Seismic and Multi-Hazard Technical Guidance Development and Support” contract (HSFEHQ-04-D-0641) by the Federal Emergency Management Agency (FEMA) to conduct a variety of tasks, including one entitled “Development of Design and Construction Guidance for Special Facilities for Vertical Evacuation from Tsunamis,” designated the ATC-64 Project. This project included a review of available international research and state-of-the-practice techniques regarding quantification of tsunami hazard and tsunami force effects.
In 2008, this work resulted in the publication of the FEMA P-646 report, Guidelines for Design of Structures for Vertical Evacuation from Tsunamis, providing technical guidance and approaches for tsunami-resistant design, identification of relevant tsunami loads and applicable design criteria, development of methods to calculate tsunami loading, and identification of architectural and structural system attributes suitable for use in vertical evacuation facilities. In 2009, the companion FEMA P-646A report, Vertical Evacuation from Tsunamis: A Guide for Community Officials, was released providing information on how to use vertical evacuation design guidance at the state and local government levels.
Following its publication in 2008, FEMA P-646 was used in conceptual design studies as part of tsunami evacuation planning in Cannon Beach, Oregon. It was also used in ongoing research related to the development of Performance-Based Tsunami Engineering conducted at the University of Hawaii at Manoa, under the George E. Brown, Jr. Network for Earthquake Engineering Simulation (NEES). Based on findings from these activities, FEMA initiated a follow-up contract, designated the ATC-79 Project, to review the design guidance contained in FEMA P-646, and to consider updates, if needed, based on this new information.
As a result of this review, selected revisions were deemed necessary. Technical updates contained in this Second Edition of the FEMA P-646 report are related to: (1) inclusion of observations and lessons learned from the March 11, 2011 Tohoku tsunami; (2) revision of the debris impact expression to remove over-conservatism deemed to be present in the prior edition; (3) additional explanation of the definition of tsunami elevation as it
FEMA P-646 Preface v

relates to runup elevation used in tsunami force equations; and (4) update of reference documents to the most current version.
ATC is indebted to the members of the ATC-79 Project Team responsible for the technical development of this Second Edition of the FEMA P-646 report. The Project Management Committee, including Ian Robertson (Project Technical Director), Gary Chock, John Hooper, Tim Walsh, and Harry Yeh, reviewed new technical information relative to guidance contained in the original report, and decided on the necessary updates.
ATC remains indebted to the members of the ATC-64 Project Team who participated in the development of the original FEMA P-646 report. The Project Management Committee, consisting of Steven Baldridge (Project Technical Director), Frank Gonzalez, John Hooper, Ian Robertson, Tim Walsh, and Harry Yeh, were responsible for the development of the technical criteria, design guidance, and related recommendations. Technical review and comment at critical developmental stages were provided by the Project Review Panel, consisting of Christopher Jones (Chair and ATC Board Representative), John Aho, George Crawford, Richard Eisner, Lesley Ewing, Michael Hornick, Chris Jonientz-Trisler, Mark Levitan, George Priest, Charles Roeder, and Jay Wilson. The affiliations of all individuals who participated in the development of the original and second edition reports are provided in the list of Project Participants.
ATC also gratefully acknowledges the input and guidance provided by Michael Mahoney (FEMA Project Officer), Robert Hanson (FEMA Technical Monitor), William Holmes (ATC Project Technical Monitor), William Coulbourne for ATC project management, and Peter N. Mork for ATC report production services.
Jon A. Heintz Christopher Rojahn ATC Director of Projects ATC Executive Director
vi Preface FEMA P-646
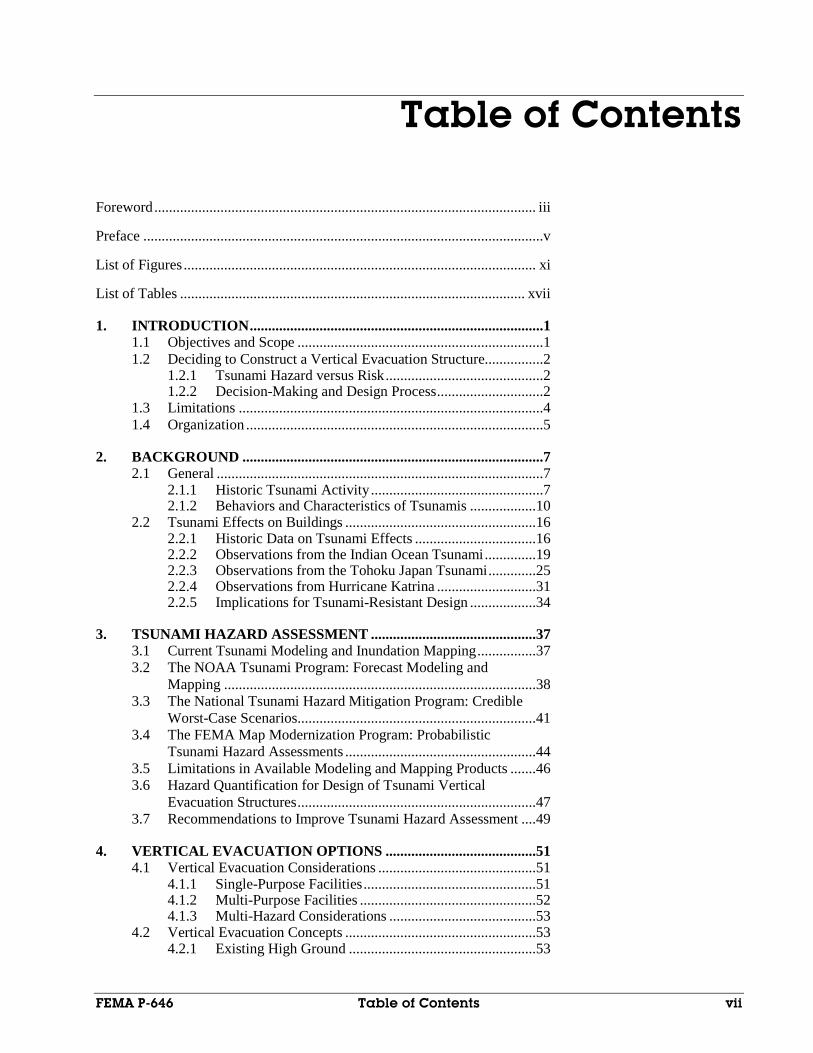
Table of Contents
Foreword ........................................................................................................ iii
Preface .............................................................................................................v
List of Figures ................................................................................................ xi
List of Tables .............................................................................................. xvii
1. INTRODUCTION ................................................................................1 1.1 Objectives and Scope ...................................................................1 1.2 Deciding to Construct a Vertical Evacuation Structure................2
1.2.1 Tsunami Hazard versus Risk ...........................................2 1.2.2 Decision-Making and Design Process .............................2
1.3 Limitations ...................................................................................4 1.4 Organization .................................................................................5
2. BACKGROUND ..................................................................................7 2.1 General .........................................................................................7
2.1.1 Historic Tsunami Activity ...............................................7 2.1.2 Behaviors and Characteristics of Tsunamis ..................10
2.2 Tsunami Effects on Buildings ....................................................16 2.2.1 Historic Data on Tsunami Effects .................................16 2.2.2 Observations from the Indian Ocean Tsunami ..............19 2.2.3 Observations from the Tohoku Japan Tsunami .............25 2.2.4 Observations from Hurricane Katrina ...........................31 2.2.5 Implications for Tsunami-Resistant Design ..................34
3. TSUNAMI HAZARD ASSESSMENT .............................................37 3.1 Current Tsunami Modeling and Inundation Mapping ................37 3.2 The NOAA Tsunami Program: Forecast Modeling and
Mapping .....................................................................................38 3.3 The National Tsunami Hazard Mitigation Program: Credible
Worst-Case Scenarios .................................................................41 3.4 The FEMA Map Modernization Program: Probabilistic
Tsunami Hazard Assessments ....................................................44 3.5 Limitations in Available Modeling and Mapping Products .......46 3.6 Hazard Quantification for Design of Tsunami Vertical
Evacuation Structures .................................................................47 3.7 Recommendations to Improve Tsunami Hazard Assessment ....49
4. VERTICAL EVACUATION OPTIONS .........................................51 4.1 Vertical Evacuation Considerations ...........................................51
4.1.1 Single-Purpose Facilities ...............................................51 4.1.2 Multi-Purpose Facilities ................................................52 4.1.3 Multi-Hazard Considerations ........................................53
4.2 Vertical Evacuation Concepts ....................................................53 4.2.1 Existing High Ground ...................................................53
FEMA P-646 Table of Contents vii

4.2.2 Soil Berms .................................................................... 54 4.2.3 Multi-Story Parking Garages ........................................ 55 4.2.4 Community Facilities.................................................... 55 4.2.5 Commercial Facilities ................................................... 56 4.2.6 School Facilities ........................................................... 58 4.2.7 Existing Buildings ........................................................ 58
5. SITING, SPACING, SIZING, AND ELEVATION CONSIDERATIONS ......................................................................... 59 5.1 Siting Considerations ................................................................. 59
5.1.1 Warning, Travel Time, and Spacing ................................ 59 5.1.2 Ingress and Vertical Circulation ...................................... 61 5.1.3 Consideration of Site Hazards ......................................... 62
5.2 Sizing Considerations ................................................................ 64 5.2.1 Services and Occupancy Duration ................................... 65 5.2.2 Square Footage Recommendations from Available
Sheltering Guidelines ....................................................... 65 5.2.3 Recommended Minimum Square Footage for
Short-Term Refuge from Tsunamis ................................. 67 5.3 Elevation Considerations ........................................................... 67 5.4 Size of Vertical Evacuation Structures ...................................... 68
6. LOAD DETERMINATION AND STRUCTURAL DESIGN CRITERIA ............................................................................................ 69
6.1 Currently Available Structural Design Criteria ......................... 69 6.1.1 Current U.S. Codes, Standards, and Guidelines ........... 69 6.1.2 Summary of Current Design Requirements .................. 72 6.1.3 Limitations in Available Flood Design Criteria
Relative to Tsunami Loading ........................................ 73 6.2 Performance Objectives ............................................................. 74
6.2.1 Tsunami Performance Objective .................................. 75 6.2.2 Seismic Performance Objectives .................................. 76
6.3 Earthquake Loading ................................................................... 76 6.3.1 Near-Source-Generated Tsunamis ................................ 77 6.3.2 Far-Source-Generated Tsunamis .................................. 77
6.4 Wind Loading ............................................................................ 78 6.5 Tsunami Loading ....................................................................... 78
6.5.1 Key Assumptions for Estimating Tsunami Load Effects ........................................................................... 79
6.5.2 Hydrostatic Forces ........................................................ 80 6.5.3 Buoyant Forces ............................................................. 82 6.5.4 Hydrodynamic Forces ................................................... 83 6.5.5 Impulsive Forces ........................................................... 85 6.5.6 Floating Debris Impact Forces ...................................... 86 6.5.7 Damming of Accumulated Waterborne Debris ............ 90 6.5.8 Uplift Forces on Elevated Floors .................................. 91 6.5.9 Additional Retained Water Loading on Elevated
Floors ............................................................................ 93 6.6 Combination of Tsunami Forces................................................ 94
6.6.1 Tsunami Force Combinations on the Overall Structure ........................................................................ 94
6.6.2 Tsunami Force Combinations on Individual Components .................................................................. 96
viii Table of Contents FEMA P-646

6.7 Load Combinations ....................................................................97 6.8 Member Capacities and Strength Design Considerations ..........98 6.9 Progressive Collapse Considerations .........................................99
6.9.1 Department of Defense Methodology ...........................99 6.9.2 General Services Administration Methodology ..........101
7. STRUCTURAL DESIGN CONCEPTS AND ADDITIONAL CONSIDERATIONS .......................................................................103 7.1 Attributes of Tsunami-Resistant Structures ..............................103 7.2 Structural Considerations for Tsunami Load Effects ...............103
7.2.1 Foundation / Scour Design Concepts ..........................104 7.2.2 Breakaway Wall Concepts ..........................................105
7.3 Concepts for Modifying and Retrofitting Existing Structures ..................................................................................107
7.4 Permitting and Quality Assurance for Vertical Evacuation Structures ...............................................................108 7.4.1 Permitting and Code Compliance ................................108 7.4.2 Peer Review .................................................................108 7.4.3 Quality Assurance / Quality Control ...........................109
7.5 Planning Considerations for Vertical Evacuation Structures ...109 7.6 Cost Considerations for Vertical Evacuation Structures ..........110
APPENDIX A – VERTICAL EVACUATION STRUCTURE EXAMPLES FROM JAPAN ..........................................................113
APPENDIX B – COMMUNITY DESIGN EXAMPLE ..........................119 B.1 Site 1 Example: Escape Berm ..................................................121 B.2 Site 2 Example: Multi-Use Structure .......................................124
APPENDIX C – EXAMPLE CALCULATIONS ....................................129 C.1 Inundation Depth ......................................................................130 C.2 Hydrostatic and Buoyant Forces ..............................................130 C.3 Hydrodynamic and Impulsive Forces .......................................132 C.4 Impact Force .............................................................................132 C.5 Damming Effect of Waterborne Debris ...................................134 C.6 Hydrodynamic Uplift Forces ....................................................135
APPENDIX D – BACKGROUND INFORMATION ON IMPACT LOAD CALCULATIONS ...............................................................137 D.1 Available Models for Impact Loads .........................................137 D.2 Summary and Discussion .........................................................142
APPENDIX E – MAXIMUM FLOW VELOCITY AND MOMENTUM FLUX IN THE TSUNAMI RUNUP ZONE ........145 E.1 Flow Velocity ...........................................................................145 E.2 Momentum Flux .......................................................................148
GLOSSARY................................................................................................151
REFERENCES ...........................................................................................161
PROJECT PARTICIPANTS ....................................................................173
FEMA P-646 Table of Contents ix


List of Figures
Figure 1-1 Decision-making and design process for vertical evacuation structures ..............................................................3
Figure 2-1 Maximum computed tsunami amplitudes (in centimeters) in the Indian Ocean ..............................................................11
Figure 2-2 Schematic diagrams of the vertical displacement resulting from subduction-type fault dislocation: (a) rupture zone located far offshore; and (b) rupture zone adjacent to coastline with coastal subsidence ..............12
Figure 2-3 Tide gage records (in meters) for the 2004 Indian Ocean tsunami at: (a) Ta Phao Noi, Thailand, showing the leading depression wave; and (b) Tuticorin, India, showing the leading elevation wave ....................................13
Figure 2-4 Measured runup heights of the 1993 Okushiri tsunami along Inaho Coast, demonstrating that runup height varies significantly between neighboring areas ...................14
Figure 2-5 Sketch of a bore and photo of the 1983 Nihonkai-Chubu Tsunami showing the formation of a bore offshore .............14
Figure 2-6 Sketch of a surge and photo of the 1983 Nihonkai-Chubu Tsunami showing the formation of a surge ..........................15
Figure 2-7 A sequence of photos of the 1983 Nihonkai-Chubu Tsunami showing surge flooding from tsunami runup ........15
Figure 2-8 Degrees of building damage vs. tsunami runup height ........16
Figure 2-9 Scotch Cap Lighthouse destroyed by the 1946 Aleutian Tsunami ...............................................................................17
Figure 2-10 Total destruction of a group of wood-frame houses in Aonae Village, Okushiri Island, Japan ................................18
Figure 2-11 Beach houses with varying levels of damage in El Popoyo, Nicaragua (1992 Nicaragua Tsunami) ..............18
Figure 2-12 Damage caused by impact from waterborne debris (fishing boat) in Aonae, Japan (1993 Okushiri Tsunami) ..............................................................................19
Figure 2-13 Examples of reinforced concrete structures that survived the 1993 Okushiri Tsunami ..................................................19
Figure 2-14 Damaged masonry beach house in Devanaanpattinam, India (2004 Indian Ocean Tsunami) ....................................20
Figure 2-15 Example of surviving reinforced concrete mosque in Uleele, Banda Aceh .............................................................21
FEMA P-646 List of Figures xi

Figure 2-16 Examples of waterborne debris from the 2004 Indian Ocean Tsunami .................................................................... 21
Figure 2-17 Damage to non-engineered concrete columns due to debris impact ....................................................................... 22
Figure 2-18 Damage to corner column due to debris damming .............. 22
Figure 2-19 Scour around shallow spread footing in Khao Lak area ...................................................................................... 23
Figure 2-20 Uplift damage to precast concrete floor panels and harbor piers .......................................................................... 23
Figure 2-21 Examples of structural collapse due to strong ground shaking in Banda Aceh prior to tsunami inundation ........... 24
Figure 2-22 Scene of near-total devastation of Minamisanriku .............. 25
Figure 2-23 Minamisanriku designated coastal evacuation building – note tsunami trace on sign ................................................... 26
Figure 2-24 Exterior elevator and stairway access to large roof evacuation area protected by 2 meter high braced guard fence on Minamisanriku coastal evacuation building ......... 27
Figure 2-25 Potential evacuation earth mound at West end of Sendai Port ...................................................................................... 27
Figure 2-26 Surviving and damaged reinforced concrete buildings in Minamisanriku .................................................................... 28
Figure 2-27 Collapsed top floor of reinforced concrete building with steel truss roof ..................................................................... 29
Figure 2-28 Overturned cold storage building in Onagawa .................... 30
Figure 2-29 Overturned steel-framed office building in Onagawa ......... 30
Figure 2-30 Overturned three-story commercial building on mat foundation ........................................................................... 31
Figure 2-31 Pass Christian office building with cast-in-place concrete pan joist floor system that suffered non-structural damage at first two floors but no structural damage ......................... 32
Figure 2-32 Progressive collapse of upper floors of a parking garage due to damage in lower level columns from impact of an adjacent barge-mounted casino ...................................... 33
Figure 2-33 Failure of prestressed piles due to damming effect of shipping container ............................................................... 33
Figure 2-34 Negative bending failure of a prestressed double-tee floor system due to uplift forces .......................................... 34
Figure 3-1 Coastal sites for site-specific tsunami inundation models for the Tsunami Forecasting System ................................... 39
xii List of Figures FEMA P-646

Figure 3-2 Tsunami inundation modeling products for Seattle, Washington ..........................................................................41
Figure 3-3 Tsunami inundation map for Seattle, Washington produced and published by the state of Washington, using modeling products as guidance ..................................42
Figure 3-4 Yaquina Bay, Oregon tsunami inundation map with three inundation lines ...........................................................43
Figure 3-5 Tsunami elevations with a 90% probability of not being exceeded in 50 years ............................................................45
Figure 3-6 The 500-year tsunami map for Seaside, Oregon, depicting maximum wave heights that are met or exceeded at an annual probability of 0.2% ..........................46
Figure 4-1 Soil berm combined with a community park at Sendai Port, Japan ................................................................54
Figure 4-2 Cast-in-place reinforced concrete parking garage in Biloxi, Mississippi after hurricane Katrina ..........................55
Figure 4-3 Sports complex. Designed for assembly use, this type of structure can accommodate circulation and service needs for large numbers of people ...........................56
Figure 4-4 Hotel and convention complex. Meeting rooms, ballrooms, and exhibit spaces located above the tsunami inundation elevation can be used to provide areas of refuge. ..................................................................................57
Figure 4-5 Residential apartment building in Kamaishi, Japan, with designated refuge area at or above the fourth level .............57
Figure 4-6 Evacuation map for Waikiki, Hawaii, indicating use of existing buildings for vertical evacuation ............................58
Figure 5-1 Vertical evacuation refuge locations considering travel distance, evacuation behavior, and naturally occurring high ground ..........................................................................62
Figure 5-2 Site hazards adjacent to vertical evacuation structures ........63
Figure 6-1 Seismic performance objectives linking building performance levels to earthquake hazard levels ..................75
Figure 6-2 Three types of coastal inundation where the tsunami elevation (TE) at a site of interest could be less than, equal to, or greater than the ultimate inland runup elevation (R) .........................................................................80
Figure 6-3 Comparison between numerical modeling (blue line) and field measurement of run-up (white dots) and flow elevations (blue dots) at Pago Pago Harbor, American Samoa ..................................................................................80
Figure 6-4 Hydrostatic force distribution and location of resultant ................................................................................82
FEMA P-646 List of Figures xiii
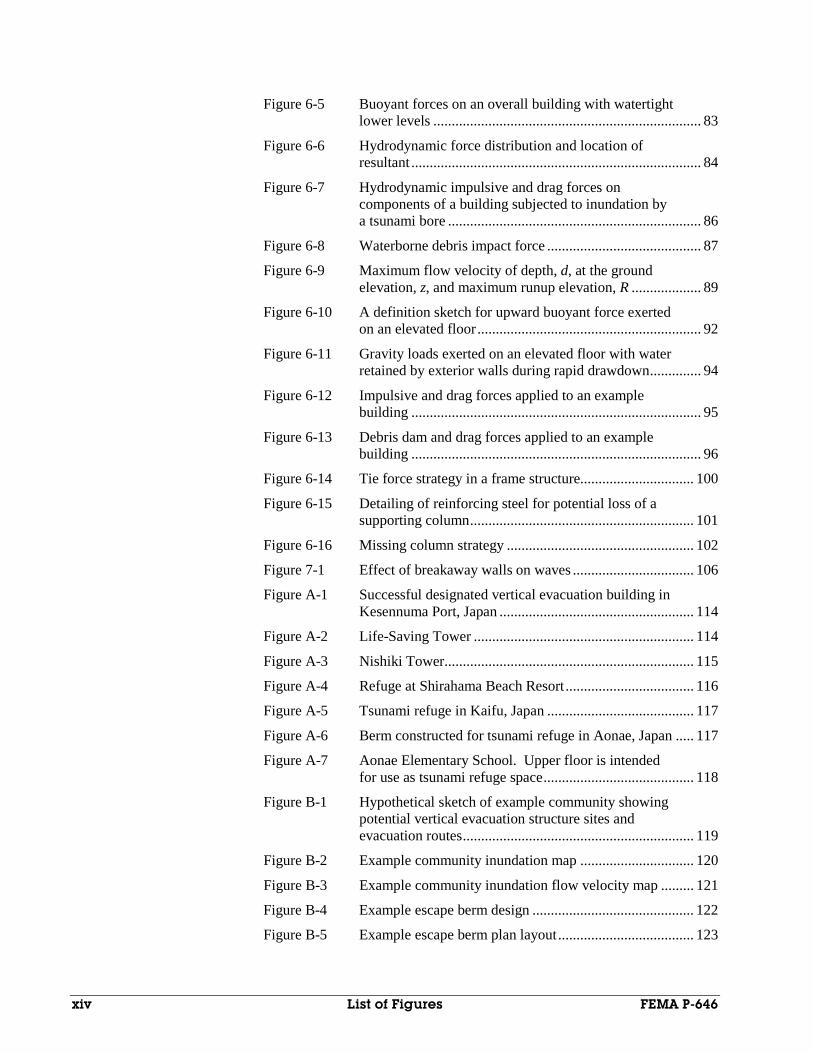
Figure 6-5 Buoyant forces on an overall building with watertight lower levels ......................................................................... 83
Figure 6-6 Hydrodynamic force distribution and location of resultant ............................................................................... 84
Figure 6-7 Hydrodynamic impulsive and drag forces on components of a building subjected to inundation by a tsunami bore ..................................................................... 86
Figure 6-8 Waterborne debris impact force .......................................... 87
Figure 6-9 Maximum flow velocity of depth, d, at the ground elevation, z, and maximum runup elevation, R ................... 89
Figure 6-10 A definition sketch for upward buoyant force exerted on an elevated floor ............................................................. 92
Figure 6-11 Gravity loads exerted on an elevated floor with water retained by exterior walls during rapid drawdown .............. 94
Figure 6-12 Impulsive and drag forces applied to an example building ............................................................................... 95
Figure 6-13 Debris dam and drag forces applied to an example building ............................................................................... 96
Figure 6-14 Tie force strategy in a frame structure............................... 100
Figure 6-15 Detailing of reinforcing steel for potential loss of a supporting column ............................................................. 101
Figure 6-16 Missing column strategy ................................................... 102
Figure 7-1 Effect of breakaway walls on waves ................................. 106
Figure A-1 Successful designated vertical evacuation building in Kesennuma Port, Japan ..................................................... 114
Figure A-2 Life-Saving Tower ............................................................ 114
Figure A-3 Nishiki Tower .................................................................... 115
Figure A-4 Refuge at Shirahama Beach Resort ................................... 116
Figure A-5 Tsunami refuge in Kaifu, Japan ........................................ 117
Figure A-6 Berm constructed for tsunami refuge in Aonae, Japan ..... 117
Figure A-7 Aonae Elementary School. Upper floor is intended for use as tsunami refuge space ......................................... 118
Figure B-1 Hypothetical sketch of example community showing potential vertical evacuation structure sites and evacuation routes ............................................................... 119
Figure B-2 Example community inundation map ............................... 120
Figure B-3 Example community inundation flow velocity map ......... 121
Figure B-4 Example escape berm design ............................................ 122
Figure B-5 Example escape berm plan layout ..................................... 123
xiv List of Figures FEMA P-646

Figure B-6 Example escape berm section ............................................123
Figure B-7 Example escape berm rear elevation ..................................124
Figure B-8 Example gymnasium ..........................................................125
Figure B-9 Example gymnasium plan ..................................................126
Figure B-10 Example gymnasium elevation ..........................................126
Figure C-1 Definition sketch for example calculations ........................129
Figure C-2 Condition resulting in buoyant forces ................................131
Figure D-1 Ranges of duration of impact .............................................142
Figure E-1 Maximum flow velocity of depth, d, at the ground elevation, z, and maximum runup elevation, R ..................147
FEMA P-646 List of Figures xv

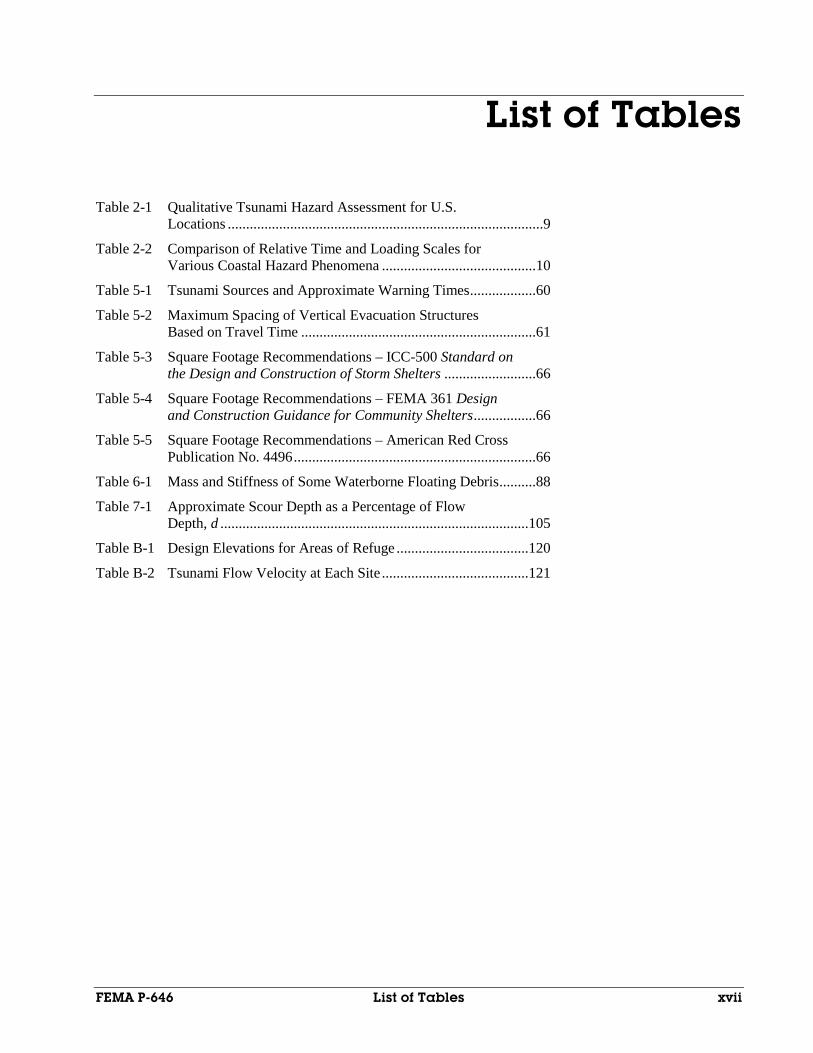
List of Tables
Table 2-1 Qualitative Tsunami Hazard Assessment for U.S. Locations ......................................................................................9
Table 2-2 Comparison of Relative Time and Loading Scales for Various Coastal Hazard Phenomena ..........................................10
Table 5-1 Tsunami Sources and Approximate Warning Times ..................60
Table 5-2 Maximum Spacing of Vertical Evacuation Structures Based on Travel Time ................................................................61
Table 5-3 Square Footage Recommendations – ICC-500 Standard on the Design and Construction of Storm Shelters .........................66
Table 5-4 Square Footage Recommendations – FEMA 361 Design and Construction Guidance for Community Shelters .................66
Table 5-5 Square Footage Recommendations – American Red Cross Publication No. 4496 ..................................................................66
Table 6-1 Mass and Stiffness of Some Waterborne Floating Debris ..........88
Table 7-1 Approximate Scour Depth as a Percentage of Flow Depth, d ....................................................................................105
Table B-1 Design Elevations for Areas of Refuge ....................................120
Table B-2 Tsunami Flow Velocity at Each Site ........................................121
FEMA P-646 List of Tables xvii


Chapter 1
Introduction
1.1 Objectives and Scope
Tsunamis are rare events often accompanied by advance warning. As such, strategies for mitigating tsunami risk have generally involved evacuation to areas of naturally occurring high ground outside of the tsunami inundation zone. Most efforts to date have focused on the development of more effective warning systems, improved inundation maps, and greater tsunami awareness to improve evacuation efficiency.
In some locations, high ground may not exist, or tsunamis triggered by local events may not allow sufficient warning time for communities to evacuate low-lying areas. Where horizontal evacuation out of the tsunami inundation zone is neither possible nor practical, a potential solution is vertical evacuation into the upper levels of structures designed and detailed to resist the effects of a tsunami.
The focus of this document is on structures intended to provide protection during a short-term high-risk tsunami event. Such facilities are generally termed refuges. A vertical evacuation refuge from tsunamis is a building or earthen mound that has sufficient height to elevate evacuees above the level of tsunami inundation, and is designed and constructed with the strength and resiliency needed to resist the effects of tsunami waves.
This document is a resource for engineers, architects, state and local government officials, building officials, community planners, and building owners who are considering the construction and operation of tsunami-resistant structures that are intended to be a safe haven for evacuees during a tsunami event. It provides guidance on the design and construction of structures that could be used as a refuge for vertical evacuation above rising waters associated with tsunami inundation, and includes specific recommendations on loading, configuration, location, operation, and maintenance of such facilities. It is intended for use in areas of the United States that are exposed to tsunami hazard, but that should not preclude the use of this guidance for facilities located in other areas exposed to similar hazards.
A Vertical Evacuation Refuge from Tsunamis is a building or earthen mound that has sufficient height to elevate evacuees above the level of tsunami inundation, and is designed and constructed with the strength and resiliency needed to resist the effects of tsunami waves.
FEMA P-646 1: Introduction 1

1.2 Deciding to Construct a Vertical Evacuation Structure
Many factors influence the decision to construct a vertical evacuation structure, including:
• the likelihood of a region being affected by a tsunami event,
• the potential consequences of a tsunami event (e.g., damage, injury, and loss of life),
• the elements of a local emergency response plan, including available evacuation alternatives,
• the planned and potential uses for a refuge facility, and
• the cost of constructing a tsunami-resistant structure.
1.2.1 Tsunami Hazard versus Risk
Hazard is related to the potential for an event to occur, while risk is related to consequences, given the occurrence of an event. Tsunami hazard is a measure of the potential for a tsunami to occur at a given site. It is also a measure of the potential magnitude of site-specific tsunami effects, including extent of inundation, height of runup, flow depth, and velocity of flow. Tsunami risk is a measure of the consequences given the occurrence of a tsunami, which can be characterized in terms of damage, loss of function, injury and loss of life. Risk depends on many factors including vulnerability and population density.
Similar to other hazards (e.g., earthquake and wind) structural design criteria for tsunami effects are based on relative tsunami hazard. The decision to build a vertical evacuation structure, however, may ultimately be based on real or perceived risk to a local population as a result of exposure to tsunami hazard.
1.2.2 Decision-Making and Design Process
A flowchart outlining the decision-making and design process for vertical evacuation structures is shown in Figure 1-1.
Given a known or perceived tsunami threat in a region, the first step is to determine the severity of the tsunami hazard. This involves identification of potential tsunami-genic sources and accumulation of recorded data on tsunami occurrence and runup. Chapter 3 provides guidance on the assessment of tsunami hazard, which can include a probabilistic assessment considering all possible tsunami sources, or a deterministic assessment considering the maximum tsunami that can reasonably be expected to affect a site. Once potential tsunami sources are identified, and the level of tsunami
Tsunami Hazard is a measure of the potential for a tsunami to occur at a given site. Tsunami Risk is a measure of the consequences given the occurrence of a tsunami, which can be characterized in terms of damage, loss of function, injury and loss of life.
2 1: Introduction FEMA P-646

hazard is known, site-specific information on the extent of inundation, height of runup, flow depth, and velocity of flow is needed. Some of this information may be obtained from available tsunami inundation maps, where they exist; however site-specific tsunami inundation studies should be performed to obtain reliable estimates of tsunami flow characteristics at the site of the proposed vertical evacuation structure.
Figure 1-1 Decision-making and design process for vertical evacuation
structures.
Given the tsunami hazard and extent of inundation, the potential risk of damage, injury, and loss of life in the region must then be evaluated. Explicit evaluation of tsunami risk is beyond the scope of this document, and will depend on a number of different factors including the presence of a tsunami warning system, existence of a local emergency response plan, availability of
FEMA P-646 1: Introduction 3

various evacuation alternatives, vulnerability of the existing building stock, and locations of existing short- and long-term shelter facilities. The feasibility of evacuation to existing areas of refuge, as well as the tsunami-resistance of these areas, must be considered. Vertical evacuation structures will likely be most useful when there is not enough time between the tsunami warning and tsunami inundation to allow a community to evacuate out of the inundation zone or to existing areas of high ground. In most cases this will be in communities at risk for near-source-generated tsunamis.
Where the risk to a coastal community is deemed to be unacceptably high, vertical evacuation can be a possible solution for mitigating tsunami risk. Chapter 4 outlines a number of potentially viable options for design and construction of vertical evacuation structures.
Implementation of vertical evacuation requires a distribution of structures throughout the community that are suitable for providing refuge from the effects of tsunami inundation, and that are appropriately sized for the population. Chapter 5 provides guidance on locating and sizing vertical evacuation structures.
Once the decision to utilize vertical evacuation is made, structures must be designed and constructed to be tsunami-resistant. Loading and other criteria for the design of vertical evacuation structures are provided in Chapters 6 and 7. The 2012 International Building Code, Appendix M, may be adopted by local jurisdictions that have a tsunami hazard and that regulate the design and construction of structures placed in high-risk or high-hazard areas.
1.3 Limitations
This document is a compilation of the best information available at the time of publication. It provides guidance for design and construction of vertical evacuation structures that is currently not available in other design guides, building codes, or standards. It is not intended to supersede or replace current codes and standards, but rather to supplement them with guidance where none is otherwise provided. It is intended to provide specific recommendations and design criteria that are unique to tsunami loading conditions for vertical evacuation structures, once the decision has been made to build such a structure. It is not intended to mandate or imply that all structures in tsunami hazard areas should be made tsunami-resistant using these criteria. Such a decision would be cost-prohibitive, especially for light-frame residential structures.
Vertical evacuation structures designed in accordance with the guidance presented in this document would be expected to provide safe refuge under
4 1: Introduction FEMA P-646

the assumed design conditions. For these structures, multiple design assumptions are required, including the intensity of a local earthquake that could threaten the structure prior to a tsunami, the flow depths and velocities of the design tsunami at the site, and the type of waterborne debris that may be characteristic at the site. Maximum loading must therefore be considered uncertain, and conservative assumptions should be made, particularly since these structures are expected to provide security and safety to the public.
Large damaging tsunamis are rare events, and existing knowledge is based on limited historic information. Coastal inundation patterns are based on complex combinations of many parameters, and are highly uncertain. Proportioning a structure for a design tsunami event does not necessarily mean the structure will be able to resist every possible tsunami event. Selection of the design tsunami is therefore based on the tsunami hazard in a region, the risk tolerance of a local community, and economic considerations.
Critical to the design of a vertical evacuation structure is the height of the refuge area above the anticipated tsunami flow depth. Even if the structure survives inundation, overtopping of the refuge area will result in unacceptable loss of life of those who sought refuge in the designated evacuation structure. This is clearly unacceptable performance of a vertical evacuation refuge and every effort must be taken to avoid this outcome.
1.4 Organization
This document provides guidance on siting concepts, performance objectives, design loads, design concepts, and emergency management issues that should be considered in locating, designing, and operating vertical evacuation structures as a refuge from tsunamis. Examples are presented that illustrate how the criteria are used. Information contained in this document is organized as follows:
Chapter 1 defines the scope and limitations for the guidance contained in this document. Chapter 2 provides background information on tsunami effects and their potential impacts on buildings in coastal communities. Chapters 3 through 7 provide design guidance on characterization of tsunami hazard, choosing between various options for vertical evacuation structures, locating and sizing vertical evacuation structures, estimation of tsunami load effects, structural design criteria, design concepts, and other considerations.
Appendices A through E provide supplemental information, including examples of vertical evacuation structures from Japan, example tsunami load calculations, a community design example, development of impact load
FEMA P-646 1: Introduction 5

equations, and background on maximum flow velocity and momentum flux in the tsunami runup zone.
A Glossary defining terms used throughout this document, and a list of References identifying resources for additional information, are also provided.
6 1: Introduction FEMA P-646

Chapter 2
Background
2.1 General
Tsunami is a Japanese word meaning “harbor” (tsu) and “wave” (nami). The term was created by fishermen who returned to port to find the area surrounding the harbor devastated. It is a naturally occurring series of waves that can result when there is a rapid, large-scale disturbance of a body of water. The most common triggering events are earthquakes below or near the ocean floor, but a tsunami can also be created by volcanic activity, landslides, undersea slumps, and impacts of extra-terrestrial objects. The waves created by this disturbance propagate away from the source. In deep water, the waves are gentle sea-surface slopes that can be unnoticeable. As the waves approach the shallower waters of the coast, however, the velocity decreases while the height increases. Upon reaching the shoreline the waves can have hazardous height and force, penetrating inland, damaging structures, and flooding normally dry areas.
In this document, tsunamis are categorized by the location of the triggering event and the time it takes the waves to reach a given site. A far-source-generated tsunami is one that originates from a source that is far away from the site of interest, and takes 2 hours or longer after the triggering event to arrive. A near-source-generated tsunami is one that originates from a source that is close to the site of interest, and can arrive within 30 minutes. Sites experiencing near-source-generated tsunamis will generally feel the effects of the triggering event (e.g., shaking caused by a near-source earthquake). A mid-source-generated tsunami is one in which the source is somewhat close to the site of interest, but not close enough for the effects of the triggering event to be felt at the site. Mid-source-generated tsunamis would be expected to arrive between 30 minutes and 2 hours after the triggering event.
2.1.1 Historic Tsunami Activity
The combination of a great ocean seismic event with the right bathymetry can have devastating results, as was brought to the world’s attention by the Indian Ocean Tsunami of December 26, 2004 and more recently the Tohoku Japan Tsunami of March 11, 2011. The Indian Ocean Tsunami was created by a magnitude-9.3 underwater earthquake and devastated coastal areas around the northern Indian Ocean. The tsunami took anywhere from 15
A Tsunami is a naturally occurring series of ocean waves resulting from a rapid, large-scale disturbance in a body of water, caused by earthquakes, landslides, volcanic eruptions, and meteorite impacts.
A far-source-generated tsunami is one that originates from a source that is far away from the site of interest, and takes 2 hours or longer after the triggering event to arrive. A near-source-generated tsunami is one that originates from a source that is close to the site of interest, and arrives within 30 minutes. The site of interest might also experience the effects of the triggering event. A mid-source-generated tsunami is one in which the source is somewhat close to the site of interest, and would be expected to arrive between 30 minutes and 2 hours after the triggering event.
FEMA P-646 2: Background 7
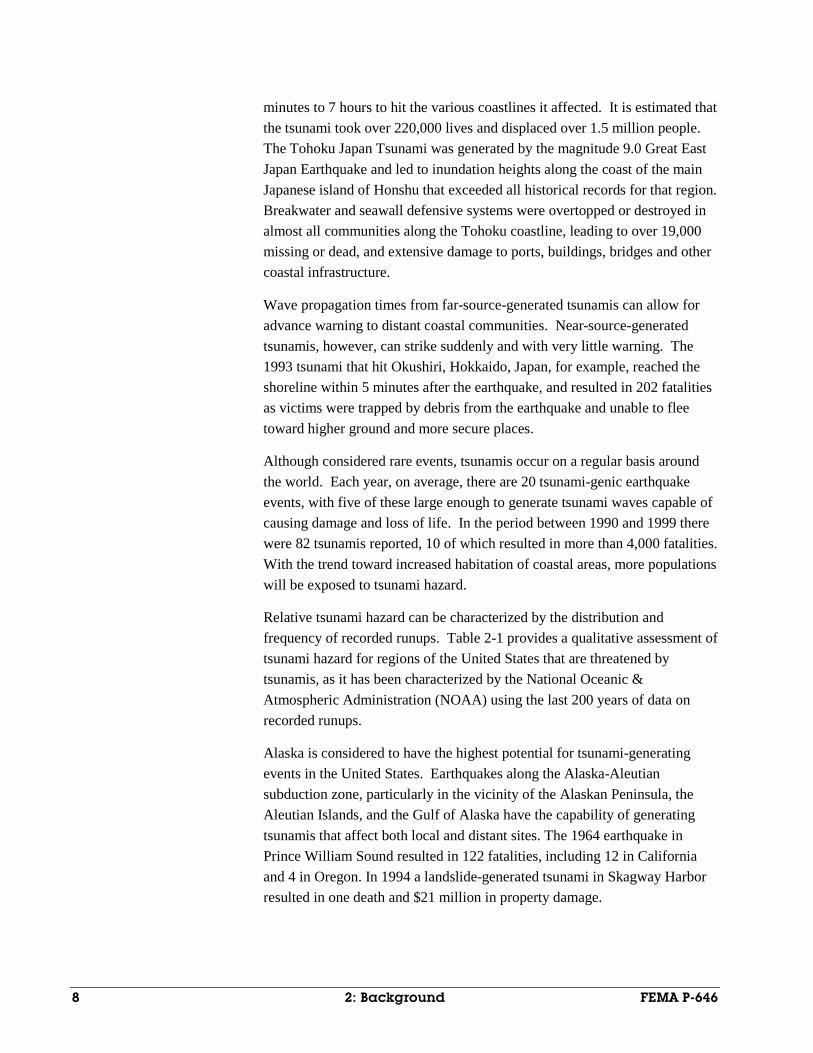
minutes to 7 hours to hit the various coastlines it affected. It is estimated that the tsunami took over 220,000 lives and displaced over 1.5 million people. The Tohoku Japan Tsunami was generated by the magnitude 9.0 Great East Japan Earthquake and led to inundation heights along the coast of the main Japanese island of Honshu that exceeded all historical records for that region. Breakwater and seawall defensive systems were overtopped or destroyed in almost all communities along the Tohoku coastline, leading to over 19,000 missing or dead, and extensive damage to ports, buildings, bridges and other coastal infrastructure.
Wave propagation times from far-source-generated tsunamis can allow for advance warning to distant coastal communities. Near-source-generated tsunamis, however, can strike suddenly and with very little warning. The 1993 tsunami that hit Okushiri, Hokkaido, Japan, for example, reached the shoreline within 5 minutes after the earthquake, and resulted in 202 fatalities as victims were trapped by debris from the earthquake and unable to flee toward higher ground and more secure places.
Although considered rare events, tsunamis occur on a regular basis around the world. Each year, on average, there are 20 tsunami-genic earthquake events, with five of these large enough to generate tsunami waves capable of causing damage and loss of life. In the period between 1990 and 1999 there were 82 tsunamis reported, 10 of which resulted in more than 4,000 fatalities. With the trend toward increased habitation of coastal areas, more populations will be exposed to tsunami hazard.
Relative tsunami hazard can be characterized by the distribution and frequency of recorded runups. Table 2-1 provides a qualitative assessment of tsunami hazard for regions of the United States that are threatened by tsunamis, as it has been characterized by the National Oceanic & Atmospheric Administration (NOAA) using the last 200 years of data on recorded runups.
Alaska is considered to have the highest potential for tsunami-generating events in the United States. Earthquakes along the Alaska-Aleutian subduction zone, particularly in the vicinity of the Alaskan Peninsula, the Aleutian Islands, and the Gulf of Alaska have the capability of generating tsunamis that affect both local and distant sites. The 1964 earthquake in Prince William Sound resulted in 122 fatalities, including 12 in California and 4 in Oregon. In 1994 a landslide-generated tsunami in Skagway Harbor resulted in one death and $21 million in property damage.
8 2: Background FEMA P-646

Table 2-1 Qualitative Tsunami Hazard Assessment for U.S. Locations (Dunbar, et. al., 2008)
Region Hazard Based on Recorded
Runups Hazard Based on Frequency
of Runups
Atlantic Coast Very low to low Very low
Gulf Coast None to very low None to very low
Caribbean High High
West Coast High High
Alaska Very high or severe Very high
Hawaii Very high or severe Very high
Western Pacific Moderate High
The Cascadia subduction zone along the Pacific Northwest coast poses a threat from northern California to British Columbia, Canada. An earthquake along the southern portion of the Cascadia subduction zone could create tsunami waves that would hit the coasts of Humboldt and Del Norte counties in California and Curry County in Oregon within a few minutes of the earthquake. Areas further north, along the Oregon and Washington coasts, could see tsunami waves within 20 to 40 minutes after a large earthquake.
Communities along the entire U.S. Pacific coastline are at risk for far-source-generated (trans-Pacific) tsunamis and locally triggered tsunamis. In southern California there is evidence that movement from local offshore strike-slip earthquakes and submarine landslides have generated tsunamis affecting areas extending from Santa Barbara to San Diego. The largest of these occurred in 1930, when a magnitude-5.2 earthquake reportedly generated a 20-foot-high wave in Santa Monica, California (California Geological Survey, 2006).
Hawaii, located in the middle of the Pacific Ocean, has experienced both far-source-generated tsunamis and locally triggered tsunamis (Pararas-Carayannis, 1968). The far-source 2011 Tohoku Japan Tsunami resulted in inundation of a number of coastal communities in Hawaii, causing structural and non-structural damage to homes, hotels and small boat harbors. Total damages were estimated at $40 million. The most recent near-source damaging tsunami in Hawaii occurred in 1975, the result of a magnitude-7.2 earthquake off the southeast coast of the island of Hawaii. This earthquake resulted in tsunami wave heights more than 20 feet and, in one area, more than 40 feet. Two deaths and more than $1 million in property damage were attributed to this local Hawaiian tsunami (Pararas-Carayannis, 1976).
FEMA P-646 2: Background 9

Although the Atlantic and Gulf Coast regions of the United States are perceived to be at less risk, there are examples of deadly tsunamis that have occurred in the Atlantic Ocean. Since 1600, more than 40 tsunamis and tsunami-like waves have been cataloged in the eastern United States. In 1929, a tsunami generated in the Grand Banks region of Canada hit Nova Scotia, killing 51 people (Lockridge et al., 2002).
Puerto Rico and the U.S. Virgin Islands are at risk from earthquakes and underwater landslides that could occur in the Puerto Rico Trench subduction zone. Since 1530, more than 50 tsunamis of varying intensity have occurred in the Caribbean. In 1918, an earthquake in this zone generated a tsunami that caused an estimated 40 deaths in Puerto Rico. In 1867, an earthquake-generated tsunami caused damage and 12 deaths on the islands of Saint Thomas and Saint Croix. In 1692 a tsunami generated by massive landslides in the Puerto Rican Trench reached the coast of Jamaica, causing an estimated 2,000 deaths (Lander, 1999).
2.1.2 Behaviors and Characteristics of Tsunamis
Information from historic tsunami events indicates that tsunami behaviors and characteristics are quite distinct from other coastal hazards, and cannot be inferred from common knowledge or intuition. The primary reason for this distinction is the unique timescale associated with tsunami phenomena. Unlike typical wind-generated water waves with periods between 5 and 20 sec, tsunamis can have wave periods ranging from a few minutes to over 1 hour (FEMA, 2005). This timescale is also important because of the potential for wave reflection, amplification, or resonance within coastal features. Table 2-2 compares various coastal hazard phenomena.
Table 2-2 Comparison of Relative Time and Loading Scales for Various Coastal Hazard Phenomena
Coastal Hazard Phenomenon
Time scale (Duration of Loading)
Loading Scale (Height of Water)
Typical Warning Time
Wind-generated waves
Tens of seconds 1 to 2 meters typical
Days
Tsunami runup Tens of minutes to an hour
1 to 10 meters Several minutes to hours
Hurricane storm surge
Several hours 1 to 10 meters Several hours to a few days
Earthquake shaking Seconds N/A Seconds to none
There is significant uncertainty in the prediction of hydrodynamic characteristics of tsunamis because they are highly influenced by the tsunami
Tsunami wave periods can range from a few minutes to over 1 hour, resulting in an increased potential for reflection, amplification, or resonance within coastal features.
10 2: Background FEMA P-646

waveform and the surrounding topography and bathymetry. Although there are exceptions, previous research and field surveys indicate that tsunamis have the following general characteristics:
• The magnitude of the triggering event determines the period of the resulting waves, and generally (but not always) the tsunami magnitude and damage potential (FEMA, 2005).
• A tsunami can propagate more than several thousand kilometers without losing energy.
• Tsunami energy propagation has strong directivity. The majority of its energy will be emitted in a direction normal to the major axis of the tsunami source. The more elongated the tsunami source, the stronger the directivity (Okal, 2003; Carrier and Yeh, 2005). Direction of approach can affect tsunami characteristics at the shoreline, because of the sheltering or amplification effects of other land masses and offshore bathymetry (FEMA, 2005). A numerical example for the 2004 Indian Ocean Tsunami is shown in Figure 2-1.
Figure 2-1 Maximum computed tsunami amplitudes (in centimeters) in the Indian Ocean (Titov, NOAA Center for Tsunami Research, http://nctr.pmel.noaa.gov/indo_1204.html)
• At the source, a tsunami waveform contains a wide range of wave components, from short to long wavelengths. Long wave components propagate faster than short wave components; therefore, a transoceanic tsunami is usually characterized by long-period waves (several to tens of
FEMA P-646 2: Background 11
minutes). Shorter wave components are left behind and attenuated by radiation and dispersion.
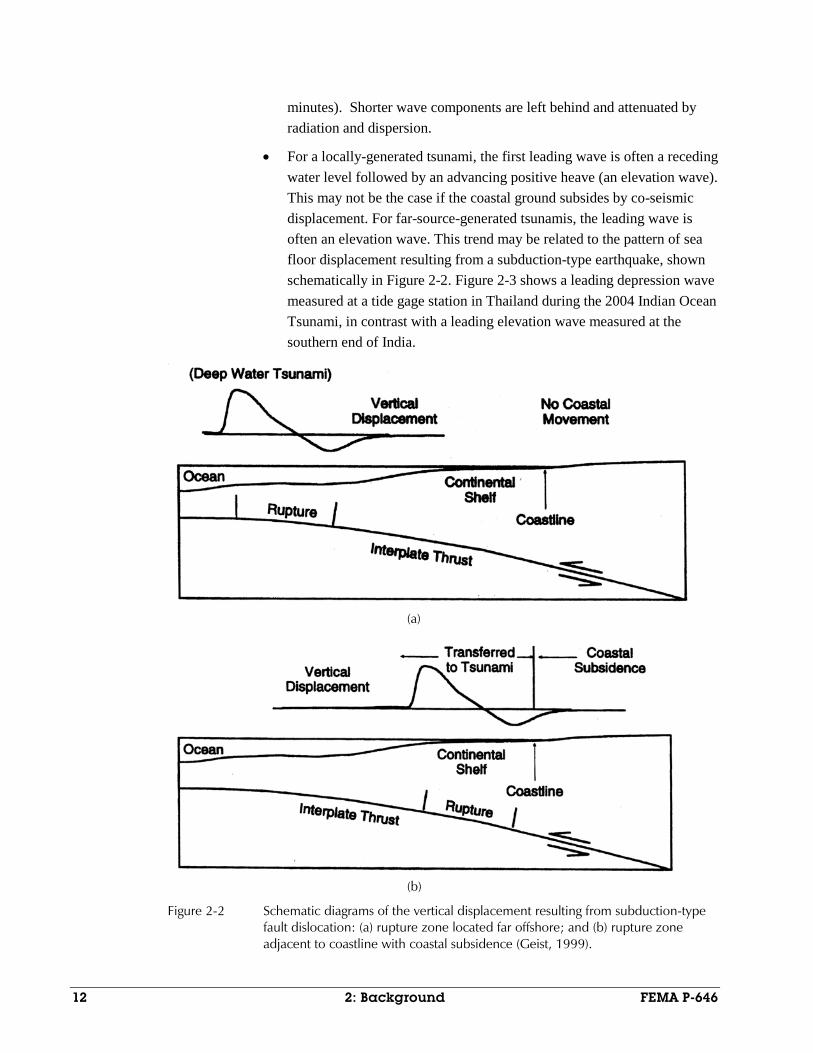
• For a locally-generated tsunami, the first leading wave is often a receding water level followed by an advancing positive heave (an elevation wave). This may not be the case if the coastal ground subsides by co-seismic displacement. For far-source-generated tsunamis, the leading wave is often an elevation wave. This trend may be related to the pattern of sea floor displacement resulting from a subduction-type earthquake, shown schematically in Figure 2-2. Figure 2-3 shows a leading depression wave measured at a tide gage station in Thailand during the 2004 Indian Ocean Tsunami, in contrast with a leading elevation wave measured at the southern end of India.
(a)
(b)
Figure 2-2 Schematic diagrams of the vertical displacement resulting from subduction-type fault dislocation: (a) rupture zone located far offshore; and (b) rupture zone adjacent to coastline with coastal subsidence (Geist, 1999).
12 2: Background FEMA P-646

(a)
(b) Figure 2-3 Tide gage records (in meters) for the 2004 Indian Ocean
tsunami at: (a) Ta Phao Noi, Thailand, showing the leading depression wave; and (b) Tuticorin, India, showing the leading elevation wave.
• Tsunamis are highly reflective at the shore, and capable of sustaining their motion for several hours without dissipating energy. Typically several tsunami waves attack a coastal area, and the first wave is not necessarily the largest. Sensitive instrumentation can detect tsunami activity for several days.
• Tsunami runup height varies significantly in neighboring areas. The configuration of the continental shelf and shoreline affect tsunami impacts at the shoreline through wave reflection, refraction, and shoaling. Variations in offshore bathymetry and shoreline irregularities
-2.0
-1.5
-1.0
-0.5
0.0
0.5
1.0
1.5
2.0
5 6 7 8 9 10 11 12 13 14 15
elev
atio
n (m
)
time (hours)
-0.5
0.0
0.5
1.0
1.5
2.0
25 26 27 28 29 30 31 32 33 34 35
Elev
atio
n (m
)
time (hours)
Tsunami runup heights vary significantly in neighboring areas due to variations in offshore bathymetry that can increase or decrease local tsunami impacts.
FEMA P-646 2: Background 13

can focus or disperse tsunami wave energy along certain shoreline reaches, increasing or decreasing tsunami impacts (FEMA, 2005). Figure 2-4 shows significant variation in runup heights measured along the northwest coastline of Okushiri Island.
Figure 2-4 Measured runup heights of the 1993 Okushiri tsunami along Inaho Coast, demonstrating
that runup height varies significantly between neighboring areas.
• The majority of eyewitness accounts and visual records (videos and photographs) indicate that an incident tsunami will break offshore forming a bore or a series of bores as it approaches the shore. A turbulent bore is defined as a broken wave having a steep, violently foaming and turbulent wave front, propagating over still water of a finite depth, as shown in Figure 2-5. These broken waves (or bores) are considered relatively short waveforms (although still longer than wind-generated waves) riding on a much longer main heave of the tsunami. Such bore formations were often observed in video footage of the 2004 Indian Ocean Tsunami and the 2011 Tohoku Japan Tsunami.
Figure 2-5 Sketch of a bore and photo of the 1983 Nihonkai-Chubu Tsunami showing the formation of
a bore offshore (photo from Knill, 2004).
14 2: Background FEMA P-646

• After a bore reaches the shore, the tsunami rushes up on dry land in the formation of a surge, as shown in Figure 2-6. In some cases, especially when a long-wavelength, leading-elevation, and far-source-generated tsunami attacks land on a steep slope, the runup can be characterized as a gradual rise and fall of water (i.e., surge flooding) as shown in Figure 2-7. The impact of the 1960 Chilean tsunami at some Japanese localities and the 1964 Alaska tsunami at the town of Port Alberni, Canada are classic examples of surge flooding.
Figure 2-6 Sketch of a surge and photo of the 1983 Nihonkai-Chubu Tsunami showing the
formation of a surge (photo courtesy of N. Nara).
Figure 2-7 A sequence of photos of the 1983 Nihonkai-Chubu Tsunami showing surge flooding from
tsunami runup (photo courtesy of S. Sato).
FEMA P-646 2: Background 15

2.2 Tsunami Effects on Buildings
Damage studies from historic tsunami events, the 2004 Indian Ocean Tsunami and the 2011 Tohoku Japan Tsunami, and storm surge associated with Hurricane Katrina in 2005 have provided information on the response of the built environment to devastating tsunamis and coastal flooding. Although there is considerable damage to, and often total destruction of, residential and light-framed buildings during extreme coastal flooding, there are also numerous examples of mid- to high-rise engineered structures that survived tsunami inundation.
Structural damage from tsunamis can be attributed to: (1) direct hydrostatic and hydrodynamic forces from water inundation; (2) impact forces from water-borne debris; (3) fire spread by floating debris and combustible liquids; (4) scour and slope/foundation failure; and (5) wind forces induced by wave motion.
2.2.1 Historic Data on Tsunami Effects
Studies of damage from historic tsunamis have shown that building survivability varies with construction type and tsunami runup height (Yeh et al., 2005). Figure 2-8 shows data on damage for various types of construction resulting from the 1993 Okushiri Tsunami and earlier tsunamis.
For a given tsunami height, wood frame construction experienced considerably more damage and was frequently destroyed, while reinforced concrete structures generally sustained only minor structural damage. Recent data, including those of the 2004 Indian Ocean Tsunami, support this conclusion.
Figure 2-8 Degrees of building damage vs. tsunami runup height. Marks filled in black are
data from the 1993 Okushiri tsunami; hollow marks are data from previous tsunami events (adapted from Shuto, 1994, Yeh, et al., 2005).
There are numerous examples of mid- to high-rise engineered structures that have survived tsunami inundation.
16 2: Background FEMA P-646

Note that the total destruction of one concrete structure is identified in Figure 2-8. This structure was the lighthouse at Scotch Cap, Unimak Island. The Scotch Cap lighthouse is shown in Figure 2-9, before and after the 1946 Aleutian Tsunami. There is some question as to how well the lighthouse was constructed, but it is possible that its destruction was the result of a wave breaking directly onto the structure, which was located right at the shoreline. The breaking wave could have been equivalent to a “collapsing” breaker, one of the classifications of wave breakers used in coastal engineering (Wiegel, 1964) that occurs at shorelines with steeply sloping beaches.
Figure 2-9 Scotch Cap Lighthouse destroyed by the 1946 Aleutian Tsunami.
The 1993 Okushiri Tsunami completely destroyed the entire town of Aonae. Figure 2-10 shows bare concrete foundations typically observed as remnants of wood-frame residential construction after the tsunami.
The 1992 Nicaragua Tsunami event provided other examples of variations in the performance of different structures. Figure 2-11 shows severe scour and complete destruction of a grade-level wood-frame house (left), and survival of an elevated wood frame and a grade-level rigid masonry structure (right). All three houses were located on a beach berm in the same vicinity, less than 200 meters apart.
Building failures have been observed when waterborne debris traveling at significant speeds impacts buildings. An example of the destruction caused by the impact of water-borne debris from the 1993 Okushiri Tsunami is shown in Figure 2-12. The debris in this case was a fishing boat that had broken free from its moorings. Waterborne debris is also known to collect
FEMA P-646 2: Background 17

between structural supports creating a barrier that can significantly increase hydraulic forces on the building.
Figure 2-10 Total destruction of a group of wood-frame houses in Aonae
Village, Okushiri Island, Japan (1993 Okushiri Tsunami).
Figure 2-11 Beach houses with varying levels of damage in El Popoyo, Nicaragua (1992 Nicaragua Tsunami).
All three houses are in the same vicinity.
18 2: Background FEMA P-646

Figure 2-12 Damage caused by impact from water-borne debris (fishing
boat) in Aonae, Japan (1993 Okushiri Tsunami) (photo courtesy J. Preuss).
In contrast to the many failures reported as a result of past tsunamis, many structures have been observed to survive tsunami inundation. Two structures that survived the 1993 Okishiri Tsunami are shown in Figure 2-13. Both are two-story reinforced concrete structures, and both were inundated by at least 3 meters of water.
Figure 2-13 Examples of reinforced concrete structures that survived the 1993 Okushiri Tsunami: vista house
at Cape Inaho (left); and fish market in Aonae (right) (photo courtesy N. Shuto).
2.2.2 Observations from the Indian Ocean Tsunami
Damage observed as a result of the 2004 Indian Ocean tsunami confirmed observations from historic data on tsunami effects, and provided new evidence on observed effects.
FEMA P-646 2: Background 19

Figure 2-14 shows a damaged unreinforced masonry house in Devanaanpattinam, India. Foundations experienced severe scour, and the rear walls were forced out by hydraulic pressure due to flooding inside the house. This type of damage is commonly observed in masonry buildings.
Figure 2-14 Damaged masonry beach house in Devanaanpattinam, India (2004 Indian Ocean Tsunami).
As observed in past tsunamis, numerous engineered buildings survived the 2004 Indian Ocean Tsunami. In some instances, there was damage to structural elements at the lower levels, but seldom to an extent that led to total collapse of the structure. One example of a surviving structure is a mosque located at the water’s edge in Uleele, Banda Aceh, shown in Figure 2-15. The inundation depth at the mosque was about 10 m (just under the roof line), and the surrounding town was destroyed. The mosque suffered significant damage but was still standing.
Dalrymple and Kriebel (2005) commented that the survival of many hotel buildings in Thailand was due in part to the relatively open nature of the first floor construction, so that “these buildings suffered little structural damage as the force of the tsunami broke through all of the doors and windows, thus reducing the force of the water on the building itself.”
The 2004 Indian Ocean Tsunami provided additional evidence of the effects of waterborne debris impact and scour on structural elements. Examples of waterborne debris included fishing boats and vehicles (Figure 2-16). Damage to structural elements of non-engineered reinforced concrete buildings was attributed to impact from such debris (Figure 2-17). Examples are also evident where debris damming resulted in damage to structural members (Figure 2-18). An example of observed scour below a shallow foundation is shown in Figure 2-19. From a review of available data taken by various survey teams, it appears that the maximum scour depth measured onshore was 3m in Khao Lak, Thailand.
20 2: Background FEMA P-646

Figure 2-15 Example of surviving reinforced concrete mosque in Uleele,
Banda Aceh (photo courtesy J. Borerro).
Figure 2-16 Examples of waterborne debris from the 2004 Indian Ocean Tsunami (photos courtesy of M.
Saatcioglu, A. Ghobarah and I. Nistor, CAEE, 2005).
A noteworthy structural failure encountered in the 2004 Indian Ocean Tsunami was uplift of precast concrete panels in buildings and docks (Figure 2-20). Uplift forces were sufficient to lift the concrete panels and break attachments between the panels and the supporting members. These failures cannot be explained by buoyancy effects alone, which reduce net downward gravity forces by the volume of water displaced. Net uplift forces sufficient to fail these elements have been attributed to additional buoyancy effects due to trapped air and vertical hydrodynamic forces caused by the rising water.
FEMA P-646 2: Background 21
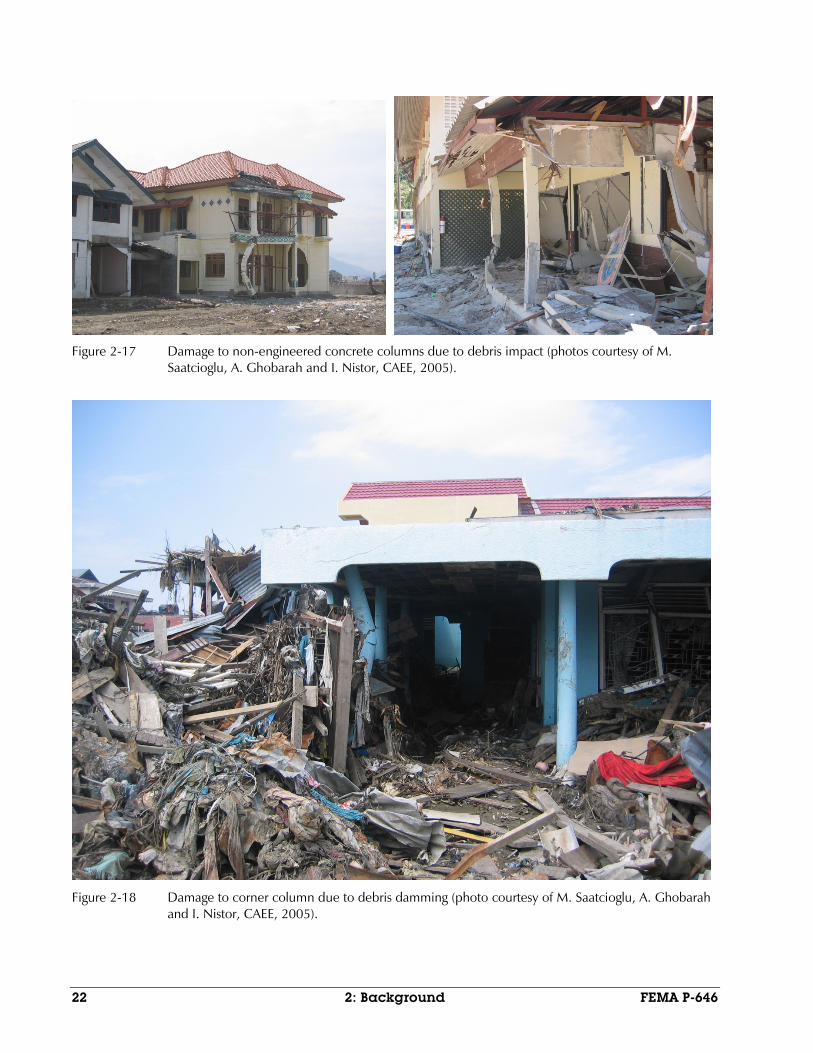
Figure 2-17 Damage to non-engineered concrete columns due to debris impact (photos courtesy of M.
Saatcioglu, A. Ghobarah and I. Nistor, CAEE, 2005).
Figure 2-18 Damage to corner column due to debris damming (photo courtesy of M. Saatcioglu, A. Ghobarah
and I. Nistor, CAEE, 2005).
22 2: Background FEMA P-646

Figure 2-19 Scour around shallow spread footing in Khao Lak area (Dalrymple and
Kriebel, 2005).
Figure 2-20 Uplift damage to precast concrete floor panels and harbor piers (photo courtesy of M.
Saatcioglu, A. Ghobarah and I. Nistor, CAEE, 2005).
Also, lack of adequate seismic capacity led to a number of collapses of multistory reinforced concrete buildings in Banda Aceh and other areas near the epicenter of the magnitude-9.3 earthquake that triggered the tsunami (Figure 2-21). These collapses occurred prior to inundation by tsunami waves, and highlight the importance of providing adequate seismic resistance in addition to tsunami resistance in regions where both hazards exist.
FEMA P-646 2: Background 23

(a) Beam-column connection failures
(b) Soft story failure
Figure 2-21 Examples of structural collapse due to strong ground shaking in Banda Aceh prior to tsunami inundation (photos courtesy of M. Saatcioglu, A. Ghobarah and I. Nistor, CAEE, 2005).
24 2: Background FEMA P-646

2.2.3 Observations from the Tohoku Japan Tsunami
Along the Tohoku coast, tsunami inundation height was in the range of 5 to 30+ meters. In general, light-frame residential construction subject to about a story height or more of inundation will collapse. In this event, complete collapse of residential light-frame construction occurred in nearly 100% of all affected areas extending to the edge of the inundation limit. In commercial and industrial areas, 75-95% of the low rise buildings collapsed, with the higher collapse rate occurring as tsunami height reached the upper range (Figure 2-22). In these inundated coastal zones, buildings taller than 5 stories were uncommon. Despite this devastation, there were a number of these multi-story buildings that survived the tsunami without loss of structural integrity of their vertical load carrying system or foundation. In fact, a significant proportion of the surviving buildings did not appear to have significant structural damage. This provides some encouragement regarding the potential resilience of larger modern buildings having robust seismic designs and scour and uplift-resistant foundations, even when subjected to tsunami inundation greater than that for which they were designed.
Figure 2-22 Scene of near-total devastation of Minamisanriku (photo courtesy of I. Nistor, ASCE, 2012).
Under a 2005 Japanese Cabinet Office guideline, buildings to be designated as tsunami shelters should be made of concrete or other similarly robust materials. They should be at least three stories high in areas where flood levels are predicted to reach two meters, or at least four stories high if flood
FEMA P-646 2: Background 25

levels are predicted to reach three meters. The 18 municipal governments in Aomori, Iwate, Miyagi and Chiba prefectures had designated a total of 88 buildings as vertical evacuation sites.
Figure 2-23 and Figure 2-24 show the designated evacuation area on the roof of a coastal building in Minamisanriku. This building was built as a residential structure, but with specific vertical evacuation attributes as part of the design. Access to the roof level evacuation area was provided by external elevator and staircase accessible without entering the rest of the building. The evacuation area measured a total of 660 square meters and was surrounded by a well-braced 2 meter high guard fence. Even though this building was overtopped by 0.7 meters, those who sought refuge on the roof survived the tsunami.
Figure 2-23 Minamisanriku designated coastal evacuation building – note tsunami trace on sign (photo courtesy of I. Robertson, ASCE, 2012).
Unfortunately, many of the designated vertical evacuation buildings were not tall enough for the flow depths encountered during this tsunami. An unknown number of people who sought refuge in these structures did not survive the inundation, even though the structures remained intact. It is therefore paramount that structures designated for vertical evacuation refuge be tall and strong enough to keep the refugees safe even during tsunami events that exceed the maximum considered event.
26 2: Background FEMA P-646

Figure 2-24 Exterior elevator and stairway access to large roof evacuation area protected by 2 meter high
braced guard fence on Minamisanriku coastal evacuation building (photo courtesy of I. Robertson, ASCE, 2012).
Figure 2-25 shows a man-made earth mound in a park area at the West end of Sendai port that was only inundated to about half its height, allowing considerable area for refuge in an otherwise flat region. Similar mounds near the coastline in Natori were overtopped during the tsunami so would not have been suitable as evacuation sites. Only limited erosion was observed on the flanks of these earth mounds indicating that this concept can work, provided the evacuation site on the top of the mound is well above the inundation level.
Figure 2-25 Potential evacuation earth mound at West end of Sendai Port
(photo courtesy of I. Robertson, ASCE, 2012).
As observed in prior tsunamis, the Tohoku Japan Tsunami created all loading and effects including hydrostatic forces, hydrodynamic forces, debris damming and debris impact forces, and scour effects.
Any of these effects alone, or in combination with the others, was observed to cause structural failures to low- to mid-rise building components of any structural material. Building performance was not guaranteed simply by generic choice of structural material and structural system. Lateral strength and element resistance to impact were critical to avoid local damage, while
FEMA P-646 2: Background 27

resistance to progressive collapse was effective at preventing local member failures from precipitating disproportionate structural collapse.
A number of low-rise reinforced concrete buildings in Minamisanriku survived complete inundation (Figure 2-26). Many of these buildings had solid concrete walls facing the ocean, exposing them to the maximum possible hydrodynamic loading. A nearby reinforced concrete building with shear walls framing the lower two floors, and concrete cantilever columns supporting a steel truss roof, suffered complete collapse of the top story (Figure 2-27). The large quantity of trees as debris in the flow, and the susceptibility of cantilever columns to flexural failure, likely contributed to this failure.
Figure 2-26 Surviving and damaged reinforced concrete buildings in Minamisanriku (photo courtesy of I. Robertson, ASCE, 2012).
The harbor town of Onagawa experienced a tsunami surge of approximately 18+ meters that overtopped nearly all buildings in the area except for those on a central hillside. Outflow velocities following this initial tsunami run-up were particularly high. Despite this, many low-rise steel and concrete buildings survived. Among the failed structures were more than a half-dozen overturned and displaced whole buildings, nearly structurally intact from foundation to roof. These buildings were either floated by hydrostatic forces and carried away, or overturned by hydrodynamic forces of the tsunami inflow or outflow, or a combination of both effects. The contribution of these
28 2: Background FEMA P-646

effects to the failures depended on the degree of openness of the building structures.
Figure 2-27 Collapsed top floor of reinforced concrete building with steel truss roof (photo courtesy of I. Nistor, ASCE, 2012).
One illustration is a two-story reinforced concrete cold storage building, which had refrigerated storage on the ground floor and the refrigeration equipment on the second floor. Due to this function, the building consisted of a closed concrete shell except for doors and a few second floor windows for its administrative room and ventilation. Hydrostatic buoyancy lifted the building off its pile foundation, which did not have tensile capacity, and carried it over a low wall before being deposited about 15 meters inland from its original location (Figure 2-28).
Other overturned concrete and steel buildings were sufficiently open to relieve hydrostatic uplift but were still toppled by hydrodynamic forces of the incoming or returning flow. A four-story structural steel moment resisting frame lost many of its lightweight precast concrete cladding panels and had numerous window openings (Figure 2-29). Nevertheless, the building’s spun-cast hollow precast piles were sheared off or extracted from the ground, and the office building displaced by about 15 meters.
Figure 2-30 shows a three-story reinforced concrete building frame with shear walls on a 0.9 meter-thick mat foundation which overturned toward Onagawa bay during the tsunami return flow.
FEMA P-646 2: Background 29
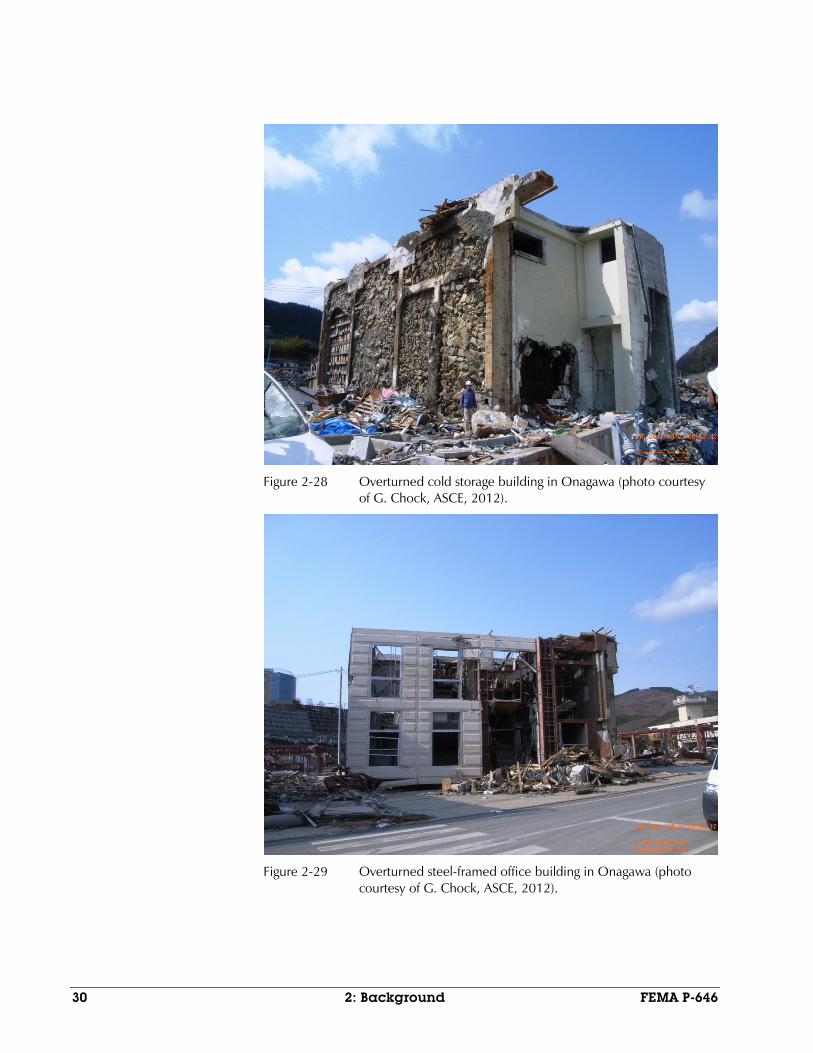
Figure 2-28 Overturned cold storage building in Onagawa (photo courtesy of G. Chock, ASCE, 2012).
Figure 2-29 Overturned steel-framed office building in Onagawa (photo courtesy of G. Chock, ASCE, 2012).
30 2: Background FEMA P-646

Figure 2-30 Overturned three-story commercial building on mat foundation (photo courtesy of I. Robertson, ASCE, 2012).
2.2.4 Observations from Hurricane Katrina
The storm surge along the Mississippi Gulf coast was estimated to have been between 25 and 28 feet during Hurricane Katrina (FEMA 548, 2006). This resulted in extensive inundation of low-lying coastal regions from New Orleans, Louisiana to Mobile, Alabama.
While hurricane storm surge and tsunami inundation both result in coastal flooding, the characteristic behavior of this flooding can be quite different. Hurricane storm surge typically inundates coastal areas for a longer duration (several hours) with repeated pounding from wave action and gusting winds. Tsunami inundation generally takes place over a shorter time period (tens of minutes) with rapidly changing water levels and sweeping currents. Because of these differences, extrapolation of conclusions from hurricane storm surge effects to tsunami inundation effects is necessarily limited. In spite of these differences, however, observations from Hurricane Katrina appear to support many of the effects documented with tsunami inundation and the conclusions drawn from historic tsunami data.
The worst storm surge in Hurricane Katrina was experienced between Pass Christian and Biloxi along the Mississippi coast, and thousands of light-framed single- and multi-family residences were totally destroyed or badly damaged by this surge (FEMA 549, 2006). However, consistent with
Observations from Hurricane Katrina appear to support many of the effects documented with tsunami inundation and the conclusions drawn from historic tsunami data.
FEMA P-646 2: Background 31

observations from past tsunamis, most multi-story engineered buildings along the coastline survived the surge with damage limited to nonstructural elements at the lower levels (Figure 2-31).
Figure 2-31 Pass Christian office building with cast-in-place concrete pan joist floor system that suffered non-
structural damage at first two floors but no structural damage (Hurricane Katrina, 2005).
Also consistent with past tsunami observations, Hurricane Katrina illustrated the effects of debris impact and damming. At the parking garage structure shown in Figure 2-32, impact from a barge-mounted casino failed a lower level column resulting in progressive collapse of the surrounding portions of the structure. In Figure 2-33, damming effects were significant enough to fail a series of prestressed concrete piles at a construction site when a shipping container lodged between the piles and blocked the surge flow.
Similar to uplift failures observed in the 2004 Indian Ocean Tsunami, uplift loading applied to the underside of floor systems is blamed for the collapse of elevated floor levels in numerous engineered structures. Parking garages constructed of precast prestressed concrete double-tee sections, like the one shown in Figure 2-34, were susceptible to upward loading caused by additional buoyancy forces from air trapped below the double-tee sections and upward hydrodynamic forces applied by the surge and wave action. Although most failures of this type did not result in collapse of the entire structure, loss of floor framing can lead to column damage, increased unbraced lengths, and progressive collapse of a disproportionate section of the building.
32 2: Background FEMA P-646

Figure 2-32 Progressive collapse of upper floors of a parking garage due to damage in
lower level columns from impact of an adjacent barge-mounted casino (Hurricane Katrina, 2005).
FEMA P-646 2: Background 33

Figure 2-33 Failure of prestressed piles due to damming effect of shipping container (Hurricane Katrina, 2005).
Figure 2-34 Negative bending failure of a prestressed double-tee floor system due to uplift forces (Hurricane
Katrina, 2005).
2.2.5 Implications for Tsunami-Resistant Design
Building survivability varies with construction type and tsunami runup height. While observations from past tsunamis show that certain types of construction are largely destroyed by high-velocity water flow, there is much evidence that appropriately designed structural systems can survive tsunami inundation with little more than nonstructural damage in the lower levels, and can continue to support the levels of a building above the flood depth. This enables consideration of vertical evacuation as a viable alternative when horizontal evacuation out of the inundation zone is not feasible.
Observed effects from historic tsunami data, the 2004 Indian Ocean Tsunami, the 2011 Tohoku Japan Tsunami, and supporting evidence from extreme storm surge flooding associated with Hurricane Katrina result in the following implications for tsunami-resistant design:
• Vertical evacuation structures must be tall enough to ensure safety of those seeking refuge even if the tsunami event exceeds the maximum
There is much evidence that appropriately designed structural systems can survive tsunami inundation. This enables consideration of vertical evacuation as a viable alternative when horizontal evacuation out of the inundation zone is not feasible.
34 2: Background FEMA P-646

considered tsunami. They should be well-engineered reinforced concrete or steel-frame structures.
• In the case of near-source generated tsunami hazards, vertical evacuation structures must be designed for seismic loading in addition to tsunami load effects.
• Vertical evacuation structures should be located away from the wave breaking zone.
• Impact forces and damming effects from waterborne debris are significant and must be considered.
• When elevated floor levels are subject to inundation, uplift forces from added buoyancy due to trapped air and vertical hydrodynamic forces on the floor slab must be considered.
• Scour around the foundations must be considered.
Because of uncertainty in the nature of water-borne debris and the potential for very large forces due to impact, progressive collapse concepts should be employed in the design of vertical evacuation structures to minimize the possibility of disproportionate collapse of the structural system.
FEMA P-646 2: Background 35


Chapter 3
Tsunami Hazard Assessment
Tsunami hazard in a particular region is a combination of the presence of a geophysical tsunami source, exposure to tsunamis generated by that source, and the extent of inundation that can be expected as a result of a tsunami reaching the site. The consequences of that hazard to the population of a coastal community are a function of the time it takes a tsunami to propagate from a source to the site, maximum flood depth, maximum current velocity, integrity of the built environment, and the ability to evacuate to areas of refuge.
Inundation is a complex process influenced by many factors. These include the source characteristics that determine the nature of the initially generated waves, the bathymetry that transforms the waves as they propagate to the shoreline, the topography traversed, the structures and other objects encountered, and the temporal variation in bathymetry, topography, structures and other objects caused by the impact of successive waves. In general, the physics of tsunami inundation is time-dependent, three-dimensional, and highly nonlinear.
Modeling of tsunami inundation is a key component of tsunami hazard assessment. Progress has been made in the development of modeling tools, but theory is still under development. This chapter provides an overview of currently available modeling tools and associated products available through nationally-coordinated efforts such as the National Oceanic and Atmospheric Administration (NOAA) Tsunami Program and the U.S. National Tsunami Hazard Mitigation Program (NTHMP).
3.1 Current Tsunami Modeling and Inundation Mapping
Site-specific inundation models and model-derived products, including maps, are essential for reliable tsunami hazard assessment. The NOAA Tsunami Program and the NTHMP are engaged in closely related modeling efforts. The NOAA Tsunami Program is focused on the development of the NOAA Tsunami Forecast System (Titov and Synolakis, 2005). The NTHMP Hazard Assessment effort is working on the development of inundation maps for emergency management programs (González, et al., 2005a). Both efforts are fundamentally dependent on tsunami numerical modeling technology.
Modeling of tsunami inundation is a key component of tsunami hazard assessment. Current efforts to characterize tsunami hazard include: The NOAA Tsunami Program: Forecast Modeling and Mapping The National Tsunami Hazard Mitigation Program: Credible Worst-Case Scenarios The FEMA Map Modernization Program: Probabilistic Tsunami Hazard Assessments
FEMA P-646 3: Tsunami Hazard Assessment 37

Tsunami modeling studies generally result in products that include a spatial mapping of the model output in either static or animated form. Primary tsunami wave parameters include the amplitude η(x,y,t) and associated current velocity components u(x,y,t) and v(x,y,t). A Geographic Information System (GIS) database of these output parameters and associated input data (e.g., model computational grids and source parameters) can be used to derive parameters such as flood depth, velocity, acceleration, and momentum flux.
3.2 The NOAA Tsunami Program: Forecast Modeling and Mapping
As part of the Tsunami Forecasting System, NOAA is developing site-specific inundation models at 75 sites shown in Figure 3-1. The National Center for Tsunami Research (NCTR) at the Pacific Marine Environmental Laboratory (PMEL) in Seattle, Washington, has the primary responsibility for this forecast modeling and mapping effort. The first step at each site is the development of a Reference Model using a grid with the finest resolution available, followed by extensive testing against all available data to achieve the highest possible accuracy. The second step is development of the Standby Inundation Model (SIM), which is used as the forecast model. This is done through modification of the grid to optimize for speed, yet retain a level of accuracy that is appropriate for operational forecast and warning purposes.
The NCTR employs a suite of tsunami generation, propagation, and inundation codes developed by Titov and Gonzalez (1997). On local spatial scales, nonlinear shallow water (NSW) equations are solved numerically. Propagation on regional and transoceanic spatial scales requires equations that are expressed in spherical coordinates. Propagation solutions are obtained by a numerical technique that involves a mathematical transformation known as splitting (Titov, 1997). Consequently, this suite of models has become known as the Method of Splitting Tsunamis (MOST) (Tang, 2009) model.
Because life and property are at stake when tsunami warnings are issued, NOAA requires that models used in the Tsunami Forecasting System meet certain standards (Synolakis, 2006). Among the requirements are:
• Peer-reviewed publication. A peer-reviewed article must be published that documents the scientific and numerical essentials of the model and includes at least one model comparison study using data from an historical tsunami.
38 3: Tsunami Hazard Assessment FEMA P-646

Figure 3-1 Coastal sites for site-specific tsunami inundation models for the
Tsunami Forecasting System.
FEMA P-646 3: Tsunami Hazard Assessment 39

• Benchmarking. The model must be tested against other peer models in a benchmark workshop, and the results documented in a report. The National Science Foundation has supported two tsunami inundation modeling benchmark workshops (Yeh, et al., 1996; Liu, et al., 2006). The National Tsunami Hazard Mitigation Program (NTHMP) supported another benchmarking workshop in 2011 (NTHMP MMS Tsunami Inundation Model Validation Workshop, 3-28-2011 to 4-1-2011, Texas A&M Galveston campus) for which a peer-reviewed proceedings volume is in preparation (NTHMP, 2012).
• Operational assessment. Important factors to be assessed include the model speed, accuracy, special operating environment needs, ease of use, and documentation.
Models meeting these requirements include the ADvanced CIRCulation (ADCIRC) model (Luettich and Westerink, 1991, 1995a, and 1995b; Myers and Baptista, 1995), hydrodynamic models of Kowalik and Murty (1993a, 1993b) as applied and field-checked against observed inundation in Alaska by Suleimani and others (2002a; 2002b), and the MOST model (Titov and Synolakis, 1998).
The MOST model has been extensively tested against laboratory experimental data and deep-ocean and inundation field measurements, and by successful modeling of benchmarking problems through participation in NSF-sponsored tsunami inundation model benchmark workshops.
As of June 2008, reference inundation models and forecast models have been completed using the MOST model for seven sites in Alaska, four sites in Washington, three sites in Oregon, five sites in California, seven sites in Hawaii, one site in North Carolina, and one site in South Carolina. Planned and completed sites are shown in Figure 3-1.
The primary function of these models is to provide NOAA Tsunami Warning Centers with real-time forecasts of coastal community inundation before and during an actual tsunami event. However, these site-specific inundation models can be applied to inundation modeling studies and the creation of inundation parameter databases, digital products, and maps specifically tailored to the design process.
Models provisionally validated in the most recent benchmark workshop include the Alaska Tsunami Forecast Model from the West Coast and Alaska Tsunami Warning Center, the Alaska Tsunami Model from the University of Alaska, SELFE from the Oregon Health Sciences Institute, FUNWAVE, from the Universities of Delaware and Rhode Island, THETIS from the
40 3: Tsunami Hazard Assessment FEMA P-646

Université de Pau et des Pays de l’Adour and University of Rhode Island, BOSZ and NEOWAVE from the University of Hawaii, TSUNAMI3D from University of Alaska and Texas A&M Galveston, GeoClaw from the University of Washington, and the MOST model from the Pacific Marine Environmental Laboratory. Most of these models are described elsewhere but the benchmark validation documentation is in preparation.
3.3 The National Tsunami Hazard Mitigation Program: Credible Worst-Case Scenarios
State mapping efforts performed as part of the National Tsunami Hazard Mitigation Program (NTHMP) are based on credible worst-case scenarios. Credible worst-case scenario maps are based on a geophysical tsunami source that can be scientifically defended as a worst-case scenario for a particular region or community, and a tsunami inundation model simulation for that scenario. The simulation output becomes the basis for maps that typically display maximum inundation depth and maximum current speed or velocity. Example worst-case scenario inundation model results for Seattle, Washington are shown in Figure 3-2. These products are provided to state geotechnical scientists, who then produce official state inundation maps such as the one for Seattle, Washington shown in Figure 3-3.
Figure 3-2 Tsunami inundation modeling products for Seattle, Washington.
Left panel: zoned estimates of maximum inundation depth. Right panel: zoned estimates of maximum current (Titov, et al., 2003).
FEMA P-646 3: Tsunami Hazard Assessment 41

Figure 3-3 Tsunami inundation map for Seattle, Washington produced and
published by the state of Washington, using modeling products as guidance (Walsh et al., 2003).
These maps are considered essential for effective disaster planning and development of emergency management products and programs. They guide the development of evacuation maps, educational and training materials, and tsunami mitigation plans. By 2004, the NTHMP Hazard Assessment component had completed 22 inundation mapping efforts and 23 evacuation maps covering 113 communities and an estimated 1.2 million residents at risk (González, et al., 2005a).
There are variations in state products because each state differs in its geophysical setting and the resulting tsunami regime including legislative goals, policies, agency structure, mission, scientific and technical infrastructure, and financial status. Differences between state mapping products include the following:
• Although most credible worst-case scenarios are based on seismic sources, maps generated for Alaska and California also include landslide sources in the tsunami hazard assessment.
• Oregon inundation maps, like the one for Yaquina Bay shown in Figure 3-4, display three inundation lines to depict the uncertainty in the hazard posed by tsunamis from the local Cascadia subduction zone.
42 3: Tsunami Hazard Assessment FEMA P-646
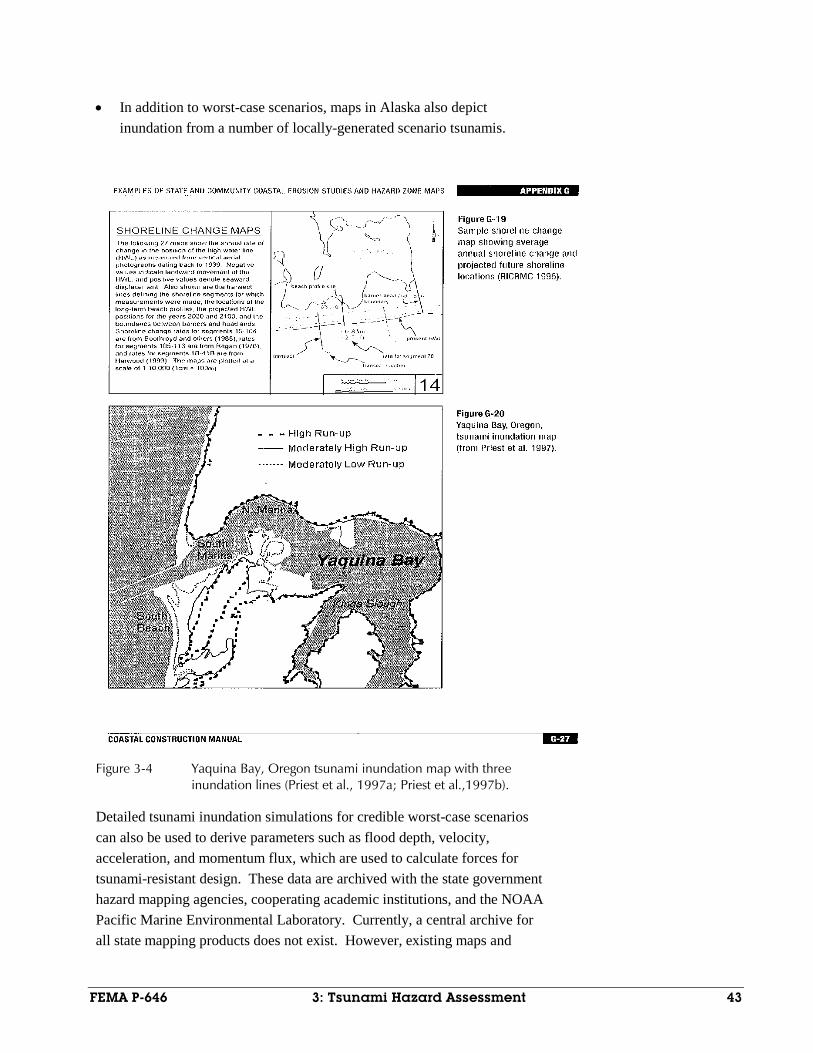
• In addition to worst-case scenarios, maps in Alaska also depict inundation from a number of locally-generated scenario tsunamis.
Figure 3-4 Yaquina Bay, Oregon tsunami inundation map with three inundation lines (Priest et al., 1997a; Priest et al.,1997b).
Detailed tsunami inundation simulations for credible worst-case scenarios can also be used to derive parameters such as flood depth, velocity, acceleration, and momentum flux, which are used to calculate forces for tsunami-resistant design. These data are archived with the state government hazard mapping agencies, cooperating academic institutions, and the NOAA Pacific Marine Environmental Laboratory. Currently, a central archive for all state mapping products does not exist. However, existing maps and
FEMA P-646 3: Tsunami Hazard Assessment 43
reports are available for viewing, download, or purchase from the following state web sites:
• Alaska: http://www.dggs.dnr.state.ak.us/pubs/publisher/dggs
• California: http://www.conservation.ca.gov/cgs/geologic_hazards /Tsunami/Inundation_Maps/Pages/Index.aspx
• Oregon: http://www.oregongeology.com/sub/publications/IMS/ims.htm
• Washington: http://www.dnr.wa.gov/Publications/ger_tsunami_inundation_maps.pdf
3.4 The FEMA Map Modernization Program: Probabilistic Tsunami Hazard Assessments
On the regional scale, FEMA (1997) presents a probabilistic estimate of the tsunami hazard for the West coast, Alaska, and Hawaii (Figure 3-5). On the local scale, FEMA Flood Insurance Rate Maps (FIRMs) present area-specific flooding scenarios for 100-year and, occasionally, 500-year events (i.e., events with a 1% and a 0.2% annual probability of exceedance, respectively).
The FIRMs provide a basis for establishing flood insurance premiums in communities that participate in the National Flood Insurance Program (NFIP), which is administered by FEMA. These maps were based on tsunami hazard assessment methods developed prior to 1990. To evaluate the underlying methodologies used to assess tsunami and other coastal flooding hazards, FEMA formed focused study groups for each of the flooding mechanisms. The Tsunami Focused Study Group found that the current treatment of tsunami inundation is inadequate, and recommended a joint NOAA/U.S. Geological Survey (USGS) pilot study to develop an appropriate methodology for Probabilistic Tsunami Hazard Assessments (PTHA) that could be used to update FIRMs (Chowdhury, et al., 2005).
In the joint NOAA/USGS/FEMA Seaside, Oregon Tsunami Pilot Study (Tsunami Pilot Study Working Group, 2006), USGS and academic colleagues developed a database of near- and far-field tsunami sources associated with a specified probability of occurrence, while NOAA developed a corresponding database of inundation model results based on the sources. The resulting PTHA methodology integrates hydrodynamics, geophysics, and probability theory to meet specific FEMA actuarial needs, and now represents the current state of the art in tsunami hazard assessment for emergency management and engineering design.
44 3: Tsunami Hazard Assessment FEMA P-646

Figure 3-5 Tsunami elevations with a 90% probability of not being
exceeded in 50 years (FEMA, 1997).
The 500-year maximum tsunami wave height map for Seaside, Oregon shown in Figure 3-6 is an example of the type of product that can be generated by such a study. The resulting GIS database of all model inputs, outputs, and related data can be used to conduct in-depth, site-specific probabilistic studies of tsunami hazard for design of vertical evacuation structures.
FEMA P-646 3: Tsunami Hazard Assessment 45

Figure 3-6 The 500-year tsunami map for Seaside, Oregon, depicting
maximum wave heights that are met or exceeded at an annual probability of 0.2% (Tsunami Pilot Study Working Group, 2006).
3.5 Limitations in Available Modeling and Mapping Products
The quality, content, and availability of currently available modeling and mapping products are limited. Quality varies considerably and, in many cases, cannot be assessed because standard modeling and mapping procedures have not been adopted. Most maps do not provide estimates of currents, so their content is often inadequate for use in design. Digital model products are generally not available to derive the more relevant parameters needed for calculation of forces on structures. Availability of information is limited because a central repository for maps and other model products does not exist.
46 3: Tsunami Hazard Assessment FEMA P-646

Limitations in bathymetric and topographic databases are being addressed through coordination of NOAA, USGS, and NTHMP to improve the coverage, quality and availability of the data, but this is an ongoing effort.
3.6 Hazard Quantification for Design of Tsunami Vertical Evacuation Structures
Given a known or perceived tsunami threat in a region, the first step is to determine the severity of the tsunami hazard. This involves identification of potential tsunami-genic sources and accumulation of recorded data on tsunami occurrence and runup. This can include a probabilistic assessment considering all possible tsunami sources, or a deterministic assessment considering the maximum tsunami that can reasonably be expected to affect a site.
Once potential tsunami sources are identified, and the severity of the tsunami hazard is known, site-specific information on the extent of inundation, height of runup, and velocity of flow is needed. Some of this information can be obtained from available tsunami inundation maps, where they exist; otherwise site-specific tsunami inundation studies must be performed. In the absence of available maps or site-specific inundation studies, analytical solutions can be used to estimate tsunami inundation parameters for preliminary or approximate design. Analytical solutions for flow velocity, depth, and momentum flux are provided in Chapter 6 and Appendix E.
In this document, the design tsunami event is termed the Maximum Considered Tsunami (MCT). There is, however, no firm policy or methodology for setting a Maximum Considered Tsunami at a specified hazard level. For the design criteria contained within this document, it is anticipated that the hazard level corresponding to the Maximum Considered Tsunami will be consistent with a 2500-year return period. The hazard level for tsunamis is therefore similar to the return period associated with the Maximum Considered Earthquake used in seismic design. However, the Maximum Considered Tsunami is not defined to be the same as the Maximum Considered Earthquake because the tsunami source may be distant rather than local.
Existing tsunami hazard assessments in some areas may be adequate for the design of vertical evacuation structures. Even if published hazard maps do not include velocity and depth information, the underlying modeling might. Where the NTHMP has been producing tsunami inundation maps (Alaska, California, Hawaii, Oregon, Puerto Rico, and Washington), the state hazard assessment team (http://nthmp.pmel.noaa.gov) will provide details of the
Tsunami hazard can be characterized by: (1) a probabilistic assessment considering all possible tsunami sources; or (2) a deterministic assessment considering the maximum tsunami that can reasonably be expected to affect a site.
The Maximum Considered Tsunami (MCT) is the design tsunami event. For site-specific tsunami hazard assessments, the Maximum Considered Tsunami should be developed using the Deterministic Maximum Considered Earthquake as the initial condition of the tsunami model.
FEMA P-646 3: Tsunami Hazard Assessment 47

appropriate modeling parameters and can either perform the assessment or provide a referral.
For site-specific tsunami hazard assessments, the Maximum Considered Tsunami should be developed using the tsunami-genic seismic events determined from a probabilistic hazard analysis. At a minimum, this analysis should also be checked for a Deterministic MCE for a near-source-generated tsunami in the United States evaluated as the largest potentially tsunami-genic earthquake reported in the “Quaternary Fault and Fold Database of the United States” http://earthquake.usgs.gov/regional/qfaults/.
Where the greatest threat is from a far-source-generated tsunami, selection of a Maximum Considered Tsunami is more difficult. At a minimum, it should be based on the largest event recorded in the National Geophysical Data Center (NGDC) Historical Tsunami Database (http://www.ngdc.noaa.gov/ hazard/tsu_db.shtml) with allowance for the limited accuracy, quantity, and period of time covered by the historic record. It should also consider the largest earthquakes likely in all regions that have generated historic tsunamis affecting the site being considered. The NOAA forecast modeling program may be able to model a Maximum Considered Tsunami for these cases using the reference inundation models that have higher resolution and larger computational domains rather than the tsunami inundation models used for real-time forecasting.
Tsunami inundation modeling is not routinely available commercially, but is performed by a number of organizations including government laboratories (USGS, NOAA, Los Alamos National Laboratory), selected universities (Cornell University, Oregon Health and Science University, Texas A&M Galveston, University of Hawaii, University of Alaska Fairbanks, University of Rhode Island, University of Southern California, University of Washington), and some consulting companies. An extensive bibliography of past tsunami-related research in modeling is available in Wiegel (2005, 2006a, 2006b, and 2008). The NTHMP has suggested some minimum guidelines regarding tsunami hazard mapping and modeling.
• Models should meet the benchmark standards (Synolakis and others, 2007), which were recently updated at the benchmarking workshop in Galveston (Horillo and others, in preparation).
• Digital Elevation Models (DEMs) used to develop modeling grids near shore should be at a resolution of at least 1/3 arc second, or about ten meters, but should not be smaller than the spacing of the source topographic data unless necessary to resolve important morphologic features.
48 3: Tsunami Hazard Assessment FEMA P-646

• DEMs should be based on the most accurate digital elevation model available. Lidar is becoming increasingly available and can achieve vertical accuracy of <1 foot.
• Model runtime should be sufficient to capture the maximum inundation and drawdown of the tsunami simulation.
• The computational grid developed from the DEM should be fine enough that any topographic or bathymetric feature that has an impact on inundation should be represented by more than three grid cells.
• The computational grid domain should be large enough to capture all important tsunami wave dynamics.
• A vertical datum of Mean High Water should be used to capture tidal conditions or an alternative maximum flooding condition should be used in modeling for tsunamis in lakes.
It should be noted that the above recommendations do not include modeling for tsunamis induced by landslides, volcanoes, or meteorite impacts.
3.7 Recommendations to Improve Tsunami Hazard Assessment
Similar to design for other hazards, a desirable goal for tsunami-resistant design of vertical evacuation structures is to achieve a uniform level of safety across all communities subjected to tsunami risk. ASCE 7, Minimum Design Loads for Buildings and Other Structures, is based on achieving structural reliability performance goals using probabilistic definitions of all hazards. In seismic and wind design, the starting point is probabilistic mapping of earthquake and wind hazard. The hazard is further refined by considering local effects such as soil type for seismic design, and topographic effects for wind design. Similar concepts can be used for tsunami design. Essential tools for tsunami hazard assessment are tsunami inundation models, maps, and comprehensive databases of tsunami inundation parameters.
Although more difficult for the public to interpret since they do not represent a single selected scenario, probabilistic maps for tsunami hazard can be made and are needed for reliable design of tsunami-resistant structures for uniform risk (Geist and Parsons, 2006). The probabilistic approach also provides a means to account for uncertainty. Probabilistic analysis of tsunamis is also important in explicitly defining the probability associated with individual deterministic scenarios.
FEMA P-646 3: Tsunami Hazard Assessment 49


Chapter 4
Vertical Evacuation Options
A vertical evacuation refuge from tsunamis is a building or earthen mound that has sufficient height to elevate evacuees above the level of tsunami inundation, and is designed and constructed with the strength and resiliency needed to resist the effects of tsunami waves. Vertical evacuation refuges can be stand-alone or part of a larger facility. They can be single-purpose refuge-only facilities, or multi-purpose facilities in regular use when not serving as a refuge. They can also be single-hazard (tsunami only) or multi-hazard facilities.
In concept, these options are applicable to new or existing structures, but it will generally be more difficult to retrofit an existing structure than to build a new tsunami-resistant structure using these criteria. This chapter describes the features of different vertical evacuation options that are available, and provides guidance to assist in choosing between various options.
It should be stressed that evacuation to high ground is always preferred where access to nearby high ground exists. This provides the option for refugees to move to even higher ground if the tsunami inundation is greater than anticipated, something that may not be possible in an evacuation building or earthen mound because of the height limitation of the refuge.
4.1 Vertical Evacuation Considerations
Vertical evacuation structures can be intended for general use by the surrounding population, or by the occupants of a specific building or group of buildings. Choosing between various options available for vertical evacuation structures will depend on emergency response planning and needs of the community, the type of construction and use of the buildings in the immediate vicinity, and the project-specific financial situation of the state, municipality, local community, or private owner considering such a structure.
4.1.1 Single-Purpose Facilities
The tsunami hazard assessment and inundation study may show that the best solution is to build new, separate (i.e., stand-alone) facilities specifically designed and configured to serve as vertical evacuation structures. Potential advantages of single-purpose, stand-alone facilities include the following:
In concept, vertical evacuation options are applicable to new or existing structures, but it will generally be more difficult to retrofit an existing structure than to build a new tsunami-resistant structure using these criteria.
Vertical evacuation facilities can be single-purpose, multi-purpose, or multi-hazard facilities.
FEMA P-646 4: Vertical Evacuation Options 51

• They can be sited away from potential debris sources or other site hazards.
• They do not need to be integrated into an existing building design or compromised by design considerations for potentially conflicting usages.
• They are structurally separate from other buildings and therefore not subject to the potential vulnerabilities of other building structures.
• They will always be ready for occupants and will not be cluttered with furnishings or storage items associated with other uses.
• Single-purpose, stand-alone structures will likely be simpler to design, permit, and construct because they will not be required to provide normal daily accommodations for people. They can have simplified prototypical structural systems, resulting in lower initial construction costs.
One example of a single-purpose facility is a small, elevated structure with the sole function of providing an elevated refuge for the surrounding area in the event of a tsunami. A possible application for such a facility would include low-lying residential neighborhoods where evacuation routes are not adequate, and taller safer structures do not exist in the area.
4.1.2 Multi-Purpose Facilities
A coastal community may not have sufficient resources to develop a single-purpose tsunami vertical evacuation structure or a series of structures, so creative ways of overcoming economic constraints are required. Possible solutions include co-location of evacuation facilities with other community-based functions, co-location with commercial-based functions, and economic or other incentives for private developers to provide tsunami-resistant areas of refuge within their developments. The ability to use a facility for more than one purpose provides immediate possibility for a return on investment through daily business or commercial use when the structure is not needed as a refuge.
Multi-purpose facilities can also be constructed to serve a specific need or function in a community, in addition to vertical evacuation refuge. Examples include elevated man-made earthen berms used as community open spaces. In downtown areas or business districts, they can be specially constructed private or municipal parking structures incorporating tsunami resistant design. On school campuses, vertical evacuation facilities could serve as gymnasiums or lunchrooms on a daily basis. In residential subdivisions, they can be used as community centers.
52 4: Vertical Evacuation Options FEMA P-646

4.1.3 Multi-Hazard Considerations
Communities exposed to other hazards (e.g., earthquakes, hurricanes) may choose to consider the possible sheltering needs associated with these other hazards, in addition to tsunamis. This could include allowances for different occupancy durations, consideration of different post-event rescue and recovery activities, and evaluation of short- and long-term medical care needs.
Designing for multiple hazards requires consideration of the load effects that might be unique to each type of hazard. This can pose unique challenges for the resulting structural design. For example, the structural system for vertical evacuation structures exposed to near-source-generated tsunamis will likely need to be designed for seismic hazards. Such a structure might include break-away walls or open construction in the lower levels to allow water to pass through with minimal resistance. Open construction in the lower levels of a multi-story structure are contrary to earthquake engineering practice to avoid soft or weak stories in earthquake-resistant construction. Proper design and construction will need to include special consideration by the structural engineer of these and other potential conflicting recommendations.
4.2 Vertical Evacuation Concepts
To provide refuge from tsunami inundation, vertical evacuation solutions must have the ability to receive a large number of people in a short time frame and efficiently transport them to areas of refuge that are located above the level of flooding. Potential vertical evacuation solutions can include areas of naturally occurring high ground, areas of artificial high ground created through the use of soil berms, new structures specifically designed to be tsunami-resistant, or existing structures demonstrated to have sufficient strength to resist anticipated tsunami effects.
Nonstructural systems and contents located in the levels below the inundation depth should be assumed to be a total loss if the design tsunami occurs. If the building is required to remain functional in the event of a disaster, the loss of lower level walls, nonstructural systems, and contents should be taken into account in the design of the facility and selection of possible alternative uses.
4.2.1 Existing High Ground
Naturally occurring areas of high ground may be able to be utilized or modified to create a refuge for tsunami vertical evacuation. Large open areas offer easy access for large numbers of evacuees with the added advantage of avoiding the possible apprehension about entering a building following an
Vertical evacuation structures can be soil berms, parking garages, community facilities, commercial facilities, school facilities, or existing buildings.
FEMA P-646 4: Vertical Evacuation Options 53

earthquake. In addition, most coastal communities have educated their populations to “go to high ground” in the event of a tsunami warning. The topography of the existing high ground should be evaluated for the potential of wave runup or erosion. Some modification of the existing topography may be required to address these issues.
4.2.2 Soil Berms
If natural high ground is not available, a soil berm can be constructed to raise the ground level above the tsunami runup height, as shown in Figure 4-1. Although care must be taken to protect the sides of the soil berm from the incoming and outgoing tsunami waves, this option can be relatively cost-effective in comparison to building a stand-alone structure. The height of the berm must be sufficient to avoid becoming inundated, and the slope of the sides must allow for ingress. A maximum ramp slope in the range of one foot vertical rise to four feet horizontal run (1 in 4) is recommended. Soil berms have the added benefit that they are immune to damage from large debris strikes such as shipping containers, barges and ships, making them suitable for locations near port facilities (Figure 4-1).
Figure 4-1 Soil berm combined with a community park at Sendai Port,
Japan. Concrete lining on the ocean face can deflect incoming waves while sloped sides provide for quick access. Graphic in the lower right side illustrates where the evacuation berm is located in Sendai Port.
54 4: Vertical Evacuation Options FEMA P-646

4.2.3 Multi-Story Parking Garages
Parking garages are good candidates for use as vertical evacuation structures. Similar to the example shown in Figure 4-2, most parking garages are open structures that will allow water to flow through with minimal resistance. They can also be open for pedestrian access at any time of the day or night. Interior ramps allow ample opportunity for ingress, and easy vertical circulation to higher levels within the structure. Parking garages can also be used to provide additional community amenities on the top level, including parks, observation decks, and sports courts. They are also obvious revenue-generating facilities, especially in areas that attract large numbers of tourists.
Parking garages, however, tend to be constructed using low-cost, efficient structural systems with minimal redundancy. If designed with higher performance objectives in mind, and if subjected to additional code review and construction inspection by local jurisdictions, parking garages could be effective vertical evacuation structures.
Figure 4-2 Cast-in-place reinforced concrete parking garage in Biloxi,
Mississippi after Hurricane Katrina. Open structural systems allow water to pass through with minimal resistance, and interior ramps allow for easy ingress and vertical circulation.
4.2.4 Community Facilities
Vertical evacuation structures could be developed as part of other community-based needs such as community centers, recreational facilities, sports complexes, libraries, museums, and police or fire stations. One such
FEMA P-646 4: Vertical Evacuation Options 55

example is shown in Figure 4-3. When not in use as a refuge, facilities such as these can be useful for a variety of functions that enhance the quality of life in a community. When choosing alternative uses for a vertical evacuation facility, consideration should be given to potential impacts that other uses might have on the vertical evacuation function. Potential negative impacts could include clutter that could become debris that disrupts ingress. Limited access after regular operating hours would make it difficult to use a facility for evacuation from a tsunami that could occur at any time of the day or night. Priority should be given to uses with complementary functions, such as accommodations for large numbers of people and 24-hour access.
4.2.5 Commercial Facilities
Vertical evacuation structures could be developed as part of business or other commercial facilities including multi-level hotels, restaurants, or retail establishments, as shown in Figure 4-4. For example, if the refuge area is part of a hotel complex, meeting rooms, ballrooms, and exhibit spaces that are located above the tsunami inundation elevation could be used to provide refuge when the tsunami occurs. The apartment building shown in Figure 4-5 was used successfully as a vertical evacuation structure during the Tohoku tsunami. Exterior stairs provided 24 hour access to the upper floors designated as the evacuation refuge.
Figure 4-3 Sports complex. Designed for assembly use, this type of
structure can accommodate circulation and service needs for large numbers of people.
56 4: Vertical Evacuation Options FEMA P-646

Figure 4-4 Hotel and convention complex. Meeting rooms, ballrooms, and
exhibit spaces located above the tsunami inundation elevation can be used to provide areas of refuge.
Figure 4-5 Residential apartment building in Kamaishi, Japan, with designated refuge area at or above the fourth level.
FEMA P-646 4: Vertical Evacuation Options 57

4.2.6 School Facilities
Similar to community facilities, public and private school facilities have the benefit of providing useful and essential services to the communities in which they reside. Ongoing construction of schools provides an opportunity and potential funding mechanism for co-located tsunami vertical evacuation structures. This has the added benefit of possible additional public support for projects that increase the safety of school-age children. Obviously these buildings must be tall enough or sited on high ground so that they are useful as tsunami refuge areas.
4.2.7 Existing Buildings
Historic damage patterns suggest that many structures not specifically designed for tsunami loading can survive tsunami inundation and provide areas of refuge. It is possible that some existing structures could serve as vertical evacuation structures or could be made more tsunami-resistant with only minor modifications. An assessment of both the functional needs and potential structural vulnerabilities would be required to determine if an existing building can serve as a vertical evacuation structure.
In some situations, providing some level of protection is better than none. An example of this concept is shown in Figure 4-6. In a tsunami evacuation map for Waikiki, it is noted that “structural steel or reinforced concrete buildings of six or more stories provide increased protection on or above the third floor”, and are identified as potential areas of refuge.
Figure 4-6 Evacuation map for Waikiki, Hawaii, indicating use of existing
buildings for vertical evacuation.
58 4: Vertical Evacuation Options FEMA P-646
Chapter 5
Siting, Spacing, Sizing, and Elevation Considerations
Tsunami risk is unique in that some communities may be susceptible to far-source-generated tsunamis (longer warning time), near-source-generated tsunamis (shorter warning time), or both. Far-source-generated tsunamis generally allow sufficient warning time so that emergency response plans can be based on evacuation out of the inundation zone. Near-source-generated tsunamis may not allow sufficient time for evacuation, so emergency response plans may need to include vertical evacuation refuge. This chapter provides guidance on how to locate vertical evacuation refuges within a community, and how to determine the size of a vertical evacuation structure.
5.1 Siting Considerations
Vertical evacuation structures should be located such that all persons designated to take refuge can reach the structure within the time available between tsunami warning and tsunami inundation. Travel time must also take into consideration vertical circulation within the structure to levels above the tsunami inundation elevation. Structures located at one end of a community may be difficult for some users to reach in a timely fashion. Routes to the structure should be easily accessible and well-marked.
Location of vertical evacuation structures within a community should take into account potential hazards in the vicinity of a site that could jeopardize the safety of the structure, and should consider that natural behaviors of persons attempting to avoid coastal flooding.
5.1.1 Warning, Travel Time, and Spacing
The West Coast and Alaska Tsunami Warning Center (WC/ATWC) in Alaska, and the Pacific Tsunami Warning Center (PTWC) in Hawaii monitor potential tsunamis, and warn affected populations of an impending tsunami. Table 5-1 summarizes approximate warning times associated with the distance between a tsunami-genic source and the site of interest. A far-source-generated tsunami originates from a source that is far away from the site, and could have 2 hours or more of advance warning time. A near-source-generated tsunami originates from a source that is close to the site,
Vertical evacuation structures should be located such that all persons designated to take refuge can reach the structure within the time available between tsunami warning and tsunami inundation.
FEMA P-646 5: Siting, Spacing, Sizing, and Elevation Considerations 59

and could have 30 minutes or less of advance warning time. Sites experiencing near-source-generated tsunamis will generally feel the effects of the triggering event (e.g., shaking caused by a near-source earthquake), and these effects will likely be the first warning of the impending tsunami. A mid-source-generated tsunami is one in which the source is somewhat close to the site of interest, but not close enough for the effects of the tsunami generating event to be felt at the site. Mid-source-generated tsunamis would be expected to have between 30 minutes and 2 hours of advance warning time.
Table 5-1 Tsunami Sources and Approximate Warning Times Location of Source Approximate Warning Time (t)
Far-source-generated tsunami t > 2 hrs
Mid-source-generated tsunami 30 min < t < 2 hrs
Near-source-generated tsunami t < 30 min
Consideration must be given to the time it would take for designated occupants to reach a refuge. To determine the maximum spacing of tsunami vertical evacuation structures, the critical parameters are warning time and ambulatory capability of the surrounding community. Once maximum spacing is determined, size must be considered, and population becomes an important parameter. Sizing considerations could necessitate an adjustment in the number and spacing of vertical evacuation structures if it is not feasible to size the resulting structures large enough to accommodate the surrounding population at the maximum spacing. Sizing considerations are discussed in Section 5.2.
The average, healthy person can walk at approximately 4-mph. Portions of the population in a community, however, may have restricted ambulatory capability due to age, health, or disability. The average pace of a mobility-impaired population can be assumed to be about 2-mph.
Assuming a 2-hour warning time associated with far-source-generated tsunamis, vertical evacuation structures would need to be located a maximum of 4 miles from any given starting point. This would result in a maximum spacing of approximately 8 miles between structures. Similarly, assuming a 30 minute warning time, vertical evacuation structures would need to be located a maximum of 1 mile from any given starting point, or 2 miles between structures. Shorter warning times would require even closer spacing. Table 5-2 summarizes maximum spacing of vertical evacuation structures based on travel time associated with a mobility-impaired population.
Recommended maximum spacing of vertical evacuation structures depends on warning time, ambulatory speed, and the surrounding population density.
60 5: Siting, Spacing, Sizing, and Elevation Considerations FEMA P-646
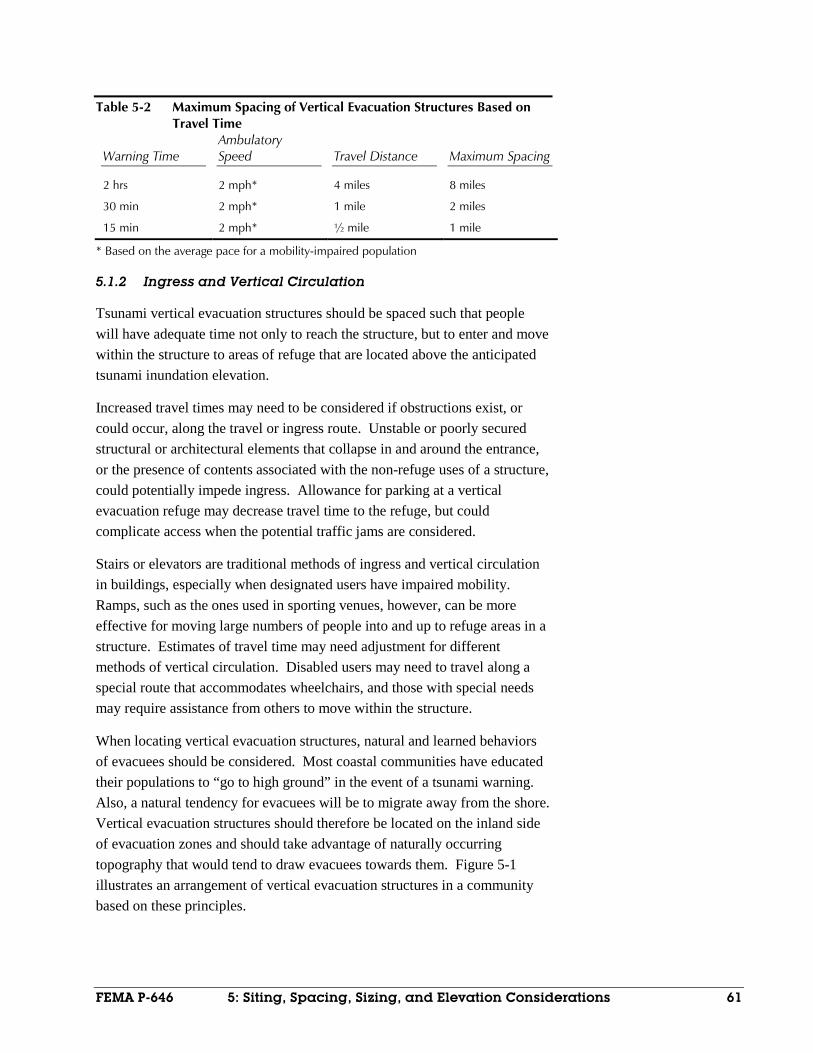
Table 5-2 Maximum Spacing of Vertical Evacuation Structures Based on Travel Time
Warning Time Ambulatory Speed Travel Distance Maximum Spacing
2 hrs 2 mph* 4 miles 8 miles
30 min 2 mph* 1 mile 2 miles
15 min 2 mph* ½ mile 1 mile
* Based on the average pace for a mobility-impaired population
5.1.2 Ingress and Vertical Circulation
Tsunami vertical evacuation structures should be spaced such that people will have adequate time not only to reach the structure, but to enter and move within the structure to areas of refuge that are located above the anticipated tsunami inundation elevation.
Increased travel times may need to be considered if obstructions exist, or could occur, along the travel or ingress route. Unstable or poorly secured structural or architectural elements that collapse in and around the entrance, or the presence of contents associated with the non-refuge uses of a structure, could potentially impede ingress. Allowance for parking at a vertical evacuation refuge may decrease travel time to the refuge, but could complicate access when the potential traffic jams are considered.
Stairs or elevators are traditional methods of ingress and vertical circulation in buildings, especially when designated users have impaired mobility. Ramps, such as the ones used in sporting venues, however, can be more effective for moving large numbers of people into and up to refuge areas in a structure. Estimates of travel time may need adjustment for different methods of vertical circulation. Disabled users may need to travel along a special route that accommodates wheelchairs, and those with special needs may require assistance from others to move within the structure.
When locating vertical evacuation structures, natural and learned behaviors of evacuees should be considered. Most coastal communities have educated their populations to “go to high ground” in the event of a tsunami warning. Also, a natural tendency for evacuees will be to migrate away from the shore. Vertical evacuation structures should therefore be located on the inland side of evacuation zones and should take advantage of naturally occurring topography that would tend to draw evacuees towards them. Figure 5-1 illustrates an arrangement of vertical evacuation structures in a community based on these principles.
FEMA P-646 5: Siting, Spacing, Sizing, and Elevation Considerations 61

Figure 5-1 Vertical evacuation refuge locations considering travel distance,
evacuation behavior, and naturally occurring high ground. Arrows show anticipated vertical evacuation routes.
5.1.3 Consideration of Site Hazards
Special hazards in the vicinity of each site should be considered in locating vertical evacuation structures. Potential site hazards include breaking waves, sources of large waterborne debris, and sources of waterborne hazardous materials. When possible, vertical evacuation structures should be located away from potential hazards that could result in additional damage to the structure and reduced safety for the occupants. Due to limited availability of possible sites, and limitations on travel and mobility of the population in a community, some vertical evacuation structures may need to be located at sites that would be considered less than ideal. Figure 5-2 illustrates adjacent site hazards that could exist in a typical coastal community.
Potential site hazards include breaking waves, sources of large waterborne debris, and sources of waterborne hazardous materials.
62 5: Siting, Spacing, Sizing, and Elevation Considerations FEMA P-646

Figure 5-2 Site hazards adjacent to vertical evacuation structures
(numbered locations). Arrows show anticipated vertical evacuation routes.
Wave breaking takes place where the water depth is sufficiently finite. In the design of usual coastal structures (e.g., breakwaters, seawalls, jetties), critical wave forces often result from breaking waves. In general, tsunamis break offshore. In the case of very steep terrain, however, they can break right at the shoreline, which is known as a collapsing breaker.
Forces from collapsing breakers can be extremely high and very uncertain. Location of vertical evacuation structures within the tsunami wave-breaking zone poses unknown additional risk to the structure. While the possibility of tsunami wave breaking at an on-shore location is not zero, it is considered to be very rare. For these reasons, recommended sites for vertical evacuation structures are located inland of the wave-breaking zone, and wave breaking forces are not considered in this document.
In Figure 5-2, vertical evacuation structures are located some distance inland from the shoreline. Structure No. 1 is located adjacent to a harbor and container terminal. Impact forces from ships, barges, boats, and other
FEMA P-646 5: Siting, Spacing, Sizing, and Elevation Considerations 63

waterborne debris have the potential to become very large. Locations with additional sources of large, possibly buoyant debris increase the chances of impact by one or more waterborne missiles, and increase the potential risk to the structure. If possible, it would be better if this structure was sited away from the harbor and container terminal. If there is no alternative location available to serve this area of the community, this structure would need to be designed for potential impact from the shipping containers and boats likely to be present during tsunami inundation.
Structure No. 2 is located off to the side of the harbor and adjacent to a parking lot. This structure would need to be designed for debris consistent with the use of the parking lot and surrounding areas, which could include cars, trucks, and recreational vehicles.
Structure No. 3 is immediately adjacent to a gas station. In past tsunamis, ignition of flammable chemicals or other floating debris has resulted in significant risk for fire in partially submerged structures. Depending on the potential for fuel leakage from this station in the event of a tsunami (or a preceding earthquake), this structure would need to be designed with fire resistive construction and additional fire protection.
Structure No. 4 is adjacent to a waterfront park facility. This location can be ideal, as the potential for waterborne debris can be relatively low. Possible hazards could include debris from park structures, naturally occurring driftwood, or larger logs from downed trees. This area has a higher potential for tourists and visitors unfamiliar with the area. It would require additional signage to inform park users what to do and where to go in the event of a tsunami warning.
Structure No. 5 is adjacent to an emergency response facility. Co-locating at such facilities can provide opportunities for direct supervision by law-enforcement and monitoring and support of refuge occupancies by other emergency response personnel.
At two locations, Structure No. 6 is intended to aid evacuees in taking advantage of naturally occurring high ground.
5.2 Sizing Considerations
Sizing of a vertical evacuation structure depends on the intended number of occupants, the type of occupancy, and the duration of occupancy. The number of occupants will depend on the surrounding population and the spacing and number of vertical evacuation structures located in the area.
64 5: Siting, Spacing, Sizing, and Elevation Considerations FEMA P-646

Duration of occupancy will depend on the nature of the hazard and the intended function of the facility.
5.2.1 Services and Occupancy Duration
A vertical evacuation structure is typically intended to provide a temporary place of refuge during a tsunami event. While tsunamis are generally considered to be short-duration events (i.e., pre-event warning period and event lasting about 8 to 12 hours), tsunamis include several cycles of waves. The potential for abnormally high tides and coastal flooding can last as long as 24 hours.
A vertical evacuation structure must provide adequate services to evacuees for their intended length of stay. As a short term refuge, services can be minimal, including only limited space per occupant and basic sanitation needs. Additionally, a vertical evacuation structure could be used to provide accommodations and services for people whose homes have been damaged or destroyed. As a minimum, this would require an allowance for more space for occupants, supplies, and services. It could also include consideration of different post-event rescue and recovery activities, and evaluation of short- and long-term medical care needs. Guidance on basic community sheltering needs is not included in this document, but can be found in FEMA 361, Design and Construction Guidance for Community Shelters (FEMA, 2000a).
Choosing to design and construct a vertical evacuation structure primarily for short-term refuge, or to supply and manage it to house evacuees for longer periods of time, is an emergency management issue that must be decided by the state, municipality, local community, or private owner.
5.2.2 Square Footage Recommendations from Available Sheltering Guidelines
Square footage recommendations are available from a number of different sources, and vary depending on the type of hazard and the anticipated duration of occupancy. The longer the anticipated stay, the greater the minimum square footage recommended.
A shelter for mostly healthy, uninjured people for a short-term event would require the least square footage per occupant. A shelter intended to house sick or injured people, or to provide ongoing medical care, would require more square footage to accommodate beds and supplies. For longer duration stays, even more square footage is needed per occupant for minimum privacy and comfort requirements, and for building infrastructure, systems, and services needed when housing people on an extended basis.
FEMA P-646 5: Siting, Spacing, Sizing, and Elevation Considerations 65

Table 5-3, Table 5-4 and Table 5-5 summarize square footage recommendations contained in International Code Council/National Storm Shelter Association, ICC-500, Standard on the Design and Construction of Storm Shelters (ICC/NSSA, 2007), FEMA 361 Design and Construction Guidance for Community Shelters (FEMA, 2000a), and American Red Cross Publication No. 4496, Standards for Hurricane Evacuation Shelter Selection (ARC, 2002).
Table 5-3 Square Footage Recommendations – ICC-500 Standard on the Design and Construction of Storm Shelters (ICC/NSSA, 2007)
Hazard or Duration Minimum Required Usable Floor
Area in Sq. Ft. per Occupant
Tornado Standing or seated Wheelchair Bedridden
5
10 30
Hurricane Standing or seated Wheelchair
Bedridden
20 20 40
Table 5-4 Square Footage Recommendations – FEMA 361 Design and Construction Guidance for Community Shelters (FEMA, 2000a)
Hazard or Duration Recommended Minimum Usable
Floor Area in Sq. Ft. per Occupant
Tornado 5
Hurricane 10
Table 5-5 Square Footage Recommendations – American Red Cross Publication No. 4496 (ARC, 2002)
Hazard or Duration Recommended Minimum Usable
Floor Area in Sq. Ft. per Occupant
Short-term stay (i.e., a few days) 20
Long-term stay (i.e., days to weeks) 40
The number of standing, seating, wheelchair, or bedridden spaces should be determined based on the specific occupancy needs of the facility under
66 5: Siting, Spacing, Sizing, and Elevation Considerations FEMA P-646

consideration. When determining usable floor area, ICC-500 includes the following adjustments to gross floor area:
• Usable floor area is 50 percent of gross floor area in shelter areas with concentrated furnishings or fixed seating.
• Usable floor area is 65 percent of gross floor area in shelter areas with un-concentrated furnishings and without fixed seating.
• Usable floor area is 85 percent of gross floor area in shelter areas with open plan furnishings and without fixed seating.
5.2.3 Recommended Minimum Square Footage for Short-Term Refuge from Tsunamis
For short-term refuge in a tsunami vertical evacuation structure, the duration of occupancy should be expected to last between 8 to 12 hours, as a minimum. Because tsunami events can include several cycles of waves, there are recommendations that suggest evacuees should remain in a tsunami refuge until the second high tide after the first tsunami wave, which could occur up to 24 hours later.
Based on square footage recommendations employed in the design of shelters for other hazards, the recommended minimum square footage per occupant for a tsunami refuge is 10 square feet per person. It is anticipated that this density will allow evacuees room to sit down without feeling overly crowded for a relatively short period of time, but would not be considered appropriate for longer stays that included sleeping arrangements. This number should be adjusted up or down depending on the specific occupancy needs of the refuge under consideration.
5.3 Elevation Considerations
In order to serve effectively as a vertical evacuation structure, it is essential that the area of refuge be located well above the maximum tsunami inundation level anticipated at the site. Determination of a suitable elevation for tsunami refuge must take into account the uncertainty inherent in estimation of the tsunami runup elevation, possible splash-up during impact of tsunami waves, and the anxiety level of evacuees seeking refuge in the structure. Unfortunately a number of designated evacuation structures in Japan were inundated during the Tohoku tsunami, leading to loss of life of many of the refugees. To account for this uncertainty, the magnitude of tsunami force effects is determined assuming a maximum tsunami runup elevation that is 30% higher than values predicted by numerical simulation modeling or obtained from tsunami inundation maps. Because of the high
Recommended minimum square footage is 10 square feet per occupant.
FEMA P-646 5: Siting, Spacing, Sizing, and Elevation Considerations 67

consequence of potential inundation of the tsunami refuge area, it is recommended that the elevation of tsunami refuge areas in vertical evacuation structures include an additional allowance for freeboard above this elevation.
The recommended minimum freeboard is one story height, or 10 feet (3 meters) above the tsunami runup elevation used in tsunami force calculations. The recommended minimum elevation for a tsunami refuge area is, therefore, the maximum tsunami runup elevation anticipated at the site, plus 30%, plus 10 feet (3 meters). This should be treated as an absolute minimum, with additional conservatism strongly encouraged.
5.4 Size of Vertical Evacuation Structures
Given the number and spacing of vertical evacuation structures, and the population in a given community, the minimum size can be determined based on square footage recommendations for the intended duration and type of occupancy. Consideration of other functional needs, such as restrooms, supplies, communications, and emergency power, should be added to the overall size of the structure.
Given the maximum tsunami runup elevation anticipated at the site, the minimum elevation of the area of refuge within a vertical evacuation structure can be determined based on minimum freeboard recommendations.
Recommended minimum refuge elevation is the maximum anticipated tsunami runup elevation, plus 30%, plus 10 feet (3 meters).
68 5: Siting, Spacing, Sizing, and Elevation Considerations FEMA P-646
Chapter 6
Load Determination and Structural Design Criteria
This chapter summarizes current code provisions as they may relate to tsunami load effects, describes intended performance objectives for vertical evacuation structures, specifies equations for estimating tsunami forces, and provides guidance on how tsunami forces should be combined with other effects.
6.1 Currently Available Structural Design Criteria
Very little guidance is provided in currently available structural design codes, standards, and guidelines on loads induced by tsunami inundation. Established design information focuses primarily on loads due to rising water and wave action associated with riverine flooding and storm surge. While little specific guidance was provided prior to this publication, the presumption heretofore had been that available flood design standards were to be adapted for designing for tsunami load effects. Therefore, it is important to understand those standards and how they differ from tsunami conditions.
6.1.1 Current U.S. Codes, Standards, and Guidelines
International Building Code. The International Code Council International Building Code (ICC, 2012) Section 1612 Flood Loads, Section 1804 Excavation, Grading and Fill, and Appendix G Flood Resistant Construction provides information on flood design and flood-resistant construction including by reference to ASCE/SEI Standard 24-05, Flood Resistant Design and Construction (ASCE 24, 2006a). Appendix M: Tsunami Generated Flood Hazard, provides tsunami regulatory criteria for those communities that have a recognized tsunami hazard and have developed and adopted a map of their Tsunami Hazard Zone, and is focused on keeping critical and high risk structures out of the tsunami inundation zone. However, buildings are permitted within the Tsunami Hazard Zone if designed as a Vertical Evacuation Refuge complying with the FEMA P-646 Guidelines or if designed to resist without collapse the hydrostatic, hydrodynamic, debris accumulation and impact, and scour effects of the Maximum Considered
Very little guidance is provided in currently available structural design codes, standards, and guidelines on loads induced by tsunami inundation. Established design information focuses primarily on loads due to rising water and wave action associated with riverine flooding and storm surge.
FEMA P-646 6: Load Determination and Structural Design Criteria 69

Tsunami. Appendices G and M are non-mandatory unless adopted by a local jurisdiction having authority.
ASCE/SEI Standard 24-05. The American Society of Civil Engineers/Structural Engineering Institute (ASCE/SEI) Standard 24-05 Flood Resistant Design and Construction (ASCE, 2006a) provides minimum requirements for flood-resistant design and construction of structures located in flood-hazard areas. Topics include basic requirements for flood-hazard areas, high-risk flood-hazard areas, coastal high-hazard areas, and coastal A zones. This standard was formulated for compliance with FEMA National Flood Insurance Program (NFIP) floodplain management requirements.
ASCE/SEI Standard 7-10. ASCE/SEI Standard 7-10 Minimum Design Loads for Buildings and Other Structures (ASCE, 2010) provides expressions for forces associated with flood and wave loads on specific types of structural components. Chapter 5 of this standard, Flood Loads, covers important definitions that relate to flooding and coastal high-hazard areas related to tides, storm surges, and breaking waves. (In 2016 it is anticipated that a new Chapter 6, Tsunami Loads and Effects, will be added.)
FEMA P-55 Coastal Construction Manual. The fourth edition of the FEMA P-55 Coastal Construction Manual (FEMA, 2011) includes discussion of coastal seismic and tsunami loads. This Manual was developed to provide design and construction guidance for low-rise (less than three stories), one- and two-family residential structures built in coastal areas throughout the United States. The Coastal Construction Manual addresses seismic loads for coastal structures, and contains expressions for flood loads, wave loads, and load combinations for specific types of structural components.
The Manual also provides general information on tsunami hazard. Section 3.3.3 states that:
“Tsunamis are long-period water waves generated by undersea shallow-focus earthquakes or by undersea crustal displacements (subduction of tectonic plates), landslides, or volcanic activity. Tsunamis can travel great distances, undetected in deep water, but shoaling rapidly in coastal waters and producing a series of large waves capable of destroying harbor facilities, shore protection structures, and upland buildings … Coastal construction in tsunami hazard zones must consider the effects of tsunami runup, flooding, erosion, and debris loads. Designers should also be aware that the “rundown” or return of water to the sea can also damage the landward sides of structures that withstood the initial runup.”
70 6: Load Determination and Structural Design Criteria FEMA P-646

The Manual also notes that tsunami effects at a particular site will be determined by the following four basic factors:
• the magnitude of the earthquake or triggering event,
• the location of the triggering event,
• the configuration of the continental shelf and shoreline, and
• the upland topography.
This Manual contains a warning statement in Chapter 8 that “This Manual does not provide guidance for estimating flood velocities during tsunamis. The issue is highly complex and site-specific. Designers should look for model results from tsunami inundation or evacuation studies.”
With regard to designing to resist tsunami loads, Section 8.6 of the Manual states that:
“Tsunami loads on residential buildings may be calculated in the same fashion as other flood loads; the physical processes are the same, but the scale of the flood loads is substantially different in that the wavelengths and runup elevations of tsunamis are much greater than those of waves caused by tropical or extratropical cyclones … When the tsunami forms a borelike wave, the effect is a surge of water to the shore. When this occurs, the expected flood velocities are substantially higher than in non-tsunami conditions … and if realized at the greater water depths, would cause substantial damage to all buildings in the path of the tsunami.”
Although authors of the Coastal Construction Manual conclude that it is generally not feasible or practical to design normal structures to withstand tsunami loads, it should be noted that this study was for conventional single family residential construction, and did not take into account the possibility of special design and construction details that would be possible for vertical evacuation structures and other larger buildings.
City and County of Honolulu Building Code. The City and County of Honolulu Building Code (CCH, 2007), Chapter 16, Article 11, provides specific guidance for “structural design of buildings and structures subject to tsunamis” in Section 16-11.5(f). The loading requirements in this section are based on a January 1980 Dames & Moore report, Design and Construction Standards for Residential Construction in Tsunami-Prone Areas in Hawaii, specifically Appendix A, Proposed Building Code Amendments. Drag forces were based on a non-bore velocity of flow in feet per second roughly estimated as equal in magnitude to the depth in feet of water at the structure (inconsistent with a Froude number assumption that would relate to the
FEMA P-646 6: Load Determination and Structural Design Criteria 71

square root of the depth). The report states that “The adequacy of this approach ... has not been satisfactorily examined.” However, at the same time prescriptive forces on walls were based on a bore flow velocity of 2 gh . Rough estimates are also given for anticipated scour around piles and piers based on distance from the shoreline and the soil type at the building site. However, the basis for these scour values is not documented. These provisions have not been updated since they were first adopted in the 1980’s, and are now largely archaic and primarily for historical reference.
6.1.2 Summary of Current Design Requirements
Coastal areas that are subject to high-velocity wave action from storms or seismic sources are designated Coastal High Hazard V-Zones (ASCE, 2010). In ASCE 7-2010 Chapter 5, Flood Loads, areas inland of Coastal V-Zones that are subject to smaller waves caused by storm surges, riverine flooding, seiches or tsunamis are designated Coastal A-Zones (ASCE, 2010). However, the Coastal Construction Manual defines the Coastal V-Zone as “an area subject to high-velocity wave action from storms or tsunamis”, and the Coastal A-Zone as an area “in which the principal source of flooding is coastal storms, and where the potential base flood wave height is between 1.5 and 3.0 feet.”
In design for coastal flooding due to storm surge or tsunamis, buildings or structures are proportioned to resist the effects of coastal floodwaters. Design and construction must be adequate to resist the anticipated flood depths, pressures, velocities, impact, uplift forces, and other factors associated with flooding, as defined by the code.
Habitable space in building structures must be elevated above the regulatory coastal storm flood elevation by such means as posts, piles, piers, or shear walls parallel to the expected direction of flow. Spaces below the base flood elevation must be free from obstruction. Walls and partitions in a coastal high-hazard area are required to break away so as not to induce excessive loads on the structural frame.
The effects of long-term erosion, storm-induced erosion, and local scour are to be included in the design of foundations of buildings or other structures in coastal high-hazard areas. Foundation embedment must be far enough below the depth of potential scour to provide adequate support for the structure. Scour of soil from around individual piles and piers must be provided for in the design. Shallow foundation types are not permitted in V-Zones unless the natural supporting soils are protected by scour protection, but are permitted in A-Zones subject to stability of the soil and resistance to scour.
72 6: Load Determination and Structural Design Criteria FEMA P-646

The main building structure must be adequately anchored and connected to the elevating substructure system to resist lateral, uplift, and downward forces.
6.1.3 Limitations in Available Flood Design Criteria Relative to Tsunami Loading
Although many of the hydrostatic and hydrodynamic loading expressions in the above-referenced codes, standards and guidelines are well-established, there are significant differences between tsunami inundation and riverine or storm surge flooding. For a typical tsunami, the water surface fluctuates near the shore with amplitude that may range from several meters to over 10 meters during a period of a few minutes to tens of minutes. A major difference between tsunamis and other coastal flooding is increased flow velocity for tsunamis, which results in significant increases in velocity-related loads on structural components. Application of existing loading expressions to tsunami loading conditions requires an estimate of the tsunami flood depth and velocity, neither of which is provided with accuracy by the above referenced information on flood and tsunami design.
Although impact of floating debris is required to be considered by the codes discussed in this chapter, impact force produced by a change in momentum is dependent on estimates of the debris mass, velocity, and the time taken for the mass to decelerate. No accommodation is made for added mass of the water behind the debris, or the potential for damming if debris is blocked by structural components. More significant forms of debris, such as barges, fishing boats, and empty storage tanks may need to be considered for tsunamis, depending on the location of the building under consideration. The size, mass, and stiffness of this type of debris are not considered in currently available criteria.
No consideration is given to upward loads on the underside of structures or components that are submerged by the flood or tsunami flow. These vertical hydrodynamic loads, different from buoyancy effects, are considered by the offshore industry in design of platforms and structural members that may be submerged by large waves.
There are two primary scour mechanisms that occur during a tsunami event. Shear-induced scour is similar to that observed during storm surge flooding, and consists of soil transport due to the flow velocity. Liquefaction-induced scour results from rapid drawdown as the water recedes. Without sufficient time to dissipate, pore pressure causes liquefaction of the soil resulting in substantially greater scour than would otherwise occur. Although the codes
Although many of the hydrostatic and hydrodynamic loading expressions in currently available codes, standards and guidelines are well-established, there are significant differences between tsunami inundation and riverine or storm surge flooding.
FEMA P-646 6: Load Determination and Structural Design Criteria 73

discussed in this chapter require consideration of scour, little guidance (other than rough estimates) is given as to the potential extent of scour.
6.2 Performance Objectives
While specific performance objectives for various forms of rare loading can vary, acceptable structural performance generally follows a trend corresponding to:
• little or no damage for small, more frequently occurring events; • moderate damage for medium-size, less frequent events; and • significant damage, but no collapse for very large, rare events.
In the case of earthquake hazards, model building codes, such as the International Building Code, implicitly assign seismic performance objectives to buildings based on their inherent risk to human life (e.g., very large occupancies) or their importance after an earthquake (e.g., emergency operation centers or hospitals). Buildings and other structures are classified into Risk Categories I through IV, in order of increasing risk to human life or importance, and code prescriptive design criteria are correspondingly increased, with the intention of providing improved performance. For Risk Category IV, design rules are intended to result in a high probability of buildings remaining functional after moderate shaking, and experiencing considerably less damage than normal buildings in very rare shaking.
Currently available performance-based seismic design procedures are intended to explicitly evaluate and predict performance, instead of relying on the presumed performance associated with prescriptive design rules. However, performance-based design is an emerging technology and the targeted performance cannot be delivered with 100% certainty. The current standard-of-practice for performance-based seismic design contained in ASCE/SEI 41-06 Seismic Rehabilitation of Existing Buildings (ASCE, 2006b) defines discrete performance levels with names intended to connote the expected condition of the building: Collapse, Collapse Prevention, Life Safety, Immediate Occupancy, and Operational. Seismic performance objectives are defined by linking one of these building performance levels to an earthquake hazard level that is related to the recurrence interval (return period) and the intensity of ground shaking, as shown in Figure 6-1.
74 6: Load Determination and Structural Design Criteria FEMA P-646
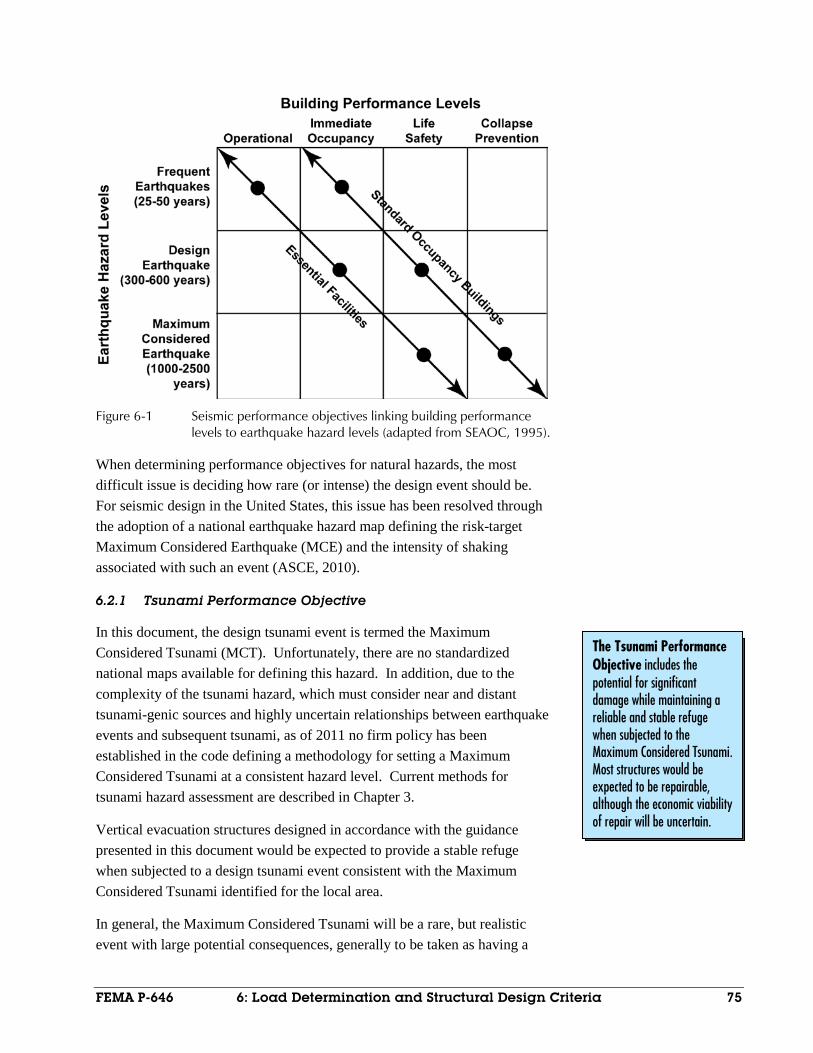
Figure 6-1 Seismic performance objectives linking building performance
levels to earthquake hazard levels (adapted from SEAOC, 1995).
When determining performance objectives for natural hazards, the most difficult issue is deciding how rare (or intense) the design event should be. For seismic design in the United States, this issue has been resolved through the adoption of a national earthquake hazard map defining the risk-target Maximum Considered Earthquake (MCE) and the intensity of shaking associated with such an event (ASCE, 2010).
6.2.1 Tsunami Performance Objective
In this document, the design tsunami event is termed the Maximum Considered Tsunami (MCT). Unfortunately, there are no standardized national maps available for defining this hazard. In addition, due to the complexity of the tsunami hazard, which must consider near and distant tsunami-genic sources and highly uncertain relationships between earthquake events and subsequent tsunami, as of 2011 no firm policy has been established in the code defining a methodology for setting a Maximum Considered Tsunami at a consistent hazard level. Current methods for tsunami hazard assessment are described in Chapter 3.
Vertical evacuation structures designed in accordance with the guidance presented in this document would be expected to provide a stable refuge when subjected to a design tsunami event consistent with the Maximum Considered Tsunami identified for the local area.
In general, the Maximum Considered Tsunami will be a rare, but realistic event with large potential consequences, generally to be taken as having a
The Tsunami Performance Objective includes the potential for significant damage while maintaining a reliable and stable refuge when subjected to the Maximum Considered Tsunami. Most structures would be expected to be repairable, although the economic viability of repair will be uncertain.
FEMA P-646 6: Load Determination and Structural Design Criteria 75

collapse prevention design equivalent of a 2% probability of being exceeded in a 50-year period or a 2500 year average return period (similar to the probability level of seismic criteria). Consistent with the general trend of acceptable performance for “Maximum Considered” loadings, the performance of vertical evacuation structures in this event would include the potential for significant damage while maintaining a reliable and stable refuge above the inundation height, although the economics of repair versus replacement will be uncertain, depending on the specifics of the situation including the magnitude of the actual event, interaction with the local bathymetry, and the design and construction of the facility.
6.2.2 Seismic Performance Objectives
The performance objective for vertical evacuation structures subjected to seismic hazards should be consistent with that of code-defined essential facilities such as hospitals, police and fire stations, and emergency operation centers. Following the prescriptive approach in the International Building Code, vertical evacuation structures are assigned to Risk Category IV, triggering design requirements that provide enhanced performance relative to typical buildings for normal occupancies.
In the specific case of earthquakes generating a near source tsunami, design for enhanced performance is necessary to assure that the structure is still usable for a tsunami following a local seismic event. To obtain a higher level of confidence that a vertical evacuation structure will achieve enhanced seismic performance, the design developed by prescriptive code provisions can be evaluated using currently available performance-based seismic design techniques and verification analyses. Utilizing the approach in ASCE/SEI 41-06, the performance objective for code-defined essential facilities should be at least Immediate Occupancy performance for the Design Basis Earthquake (DBE) and Life Safety performance for the Maximum Considered Earthquake (MCE).
6.3 Earthquake Loading
The recommended basis for seismic design of vertical evacuation structures is the International Building Code, which references ASCE/SEI 7-10 Minimum Design Loads for Buildings and Other Structures for its seismic requirements. These requirements are based on the NEHRP Recommended Provisions for Seismic Regulations for New Buildings and Other Structures (FEMA, 2004a) and additional information provided in the Commentary (FEMA, 2004b). Vertical evacuation structures should be designed using rules for Risk Category IV buildings.
Seismic Performance Objectives are consistent with the code-defined performance of essential facilities such as hospitals, police and fire stations, and emergency operation centers.
76 6: Load Determination and Structural Design Criteria FEMA P-646

The recommended basis for seismic evaluation and rehabilitation of existing buildings that are being considered for use as vertical evacuation structures is the SEI/ASCE Standard 31-03 Seismic Evaluation of Existing Buildings (ASCE, 2003b), using the Immediate Occupancy performance objective, and ASCE/SEI Standard 41-06 Seismic Rehabilitation of Existing Buildings, using the performance objectives specified in Section 6.2.2.
6.3.1 Near-Source-Generated Tsunamis
A vertical evacuation structure located in a region susceptible to near-source-generated tsunamis is likely to experience strong ground shaking immediately prior to the tsunami. As a properly designed essential facility, it is expected that sufficient reserve capacity will be provided in the structure to resist the subsequent tsunami loading effects. The reserve capacity of the structure, which will be some fraction of the original, needs to be evaluated. It is recommended that the condition of the structure after the Design Basis Earthquake (DBE) be used to determine the adequacy for tsunami loading. If inadequate, the resulting design would then need to be modified as necessary to address tsunami effects. For areas that are subject to near-source-generated tsunamis, this sequential loading condition will clearly control the design of the structure. To help ensure adequate strength and ductility in the structure for resisting tsunami load effects, Seismic Design Category D, as defined in ASCE/SEI 7-10, should be assigned to the structure, as a minimum.
A properly designed essential facility is also expected to have improved performance of non-structural components including ceilings, walls, light fixtures, fire sprinklers, and other building systems. For evacuees to feel comfortable entering a vertical evacuation structure following an earthquake, and remaining in the structure during potential aftershocks, it is important that visible damage to both structural and non-structural components be limited. Particular attention should be focused on non-structural components in the stairwells, ramps, and entrances that provide access and vertical circulation within the structure.
6.3.2 Far-Source-Generated Tsunamis
Although a vertical evacuation structure is not likely to experience earthquake shaking directly associated with a far-source tsunami, seismic design must be independently included as dictated by the seismic hazard that is present at the site. Even in regions of low seismicity, however, it is recommended that Seismic Design Category D be assigned to the structure,
A vertical evacuation structure located in a region susceptible to near-source-generated tsunamis is likely to experience strong ground shaking immediately prior to the tsunami.
FEMA P-646 6: Load Determination and Structural Design Criteria 77

as a minimum, to help ensure adequate continuity, strength, and ductility for resisting tsunami load effects.
6.4 Wind Loading
The recommended basis for wind design of a vertical evacuation structure is the International Building Code, which references ASCE/SEI 7-10 Minimum Design Loads for Buildings and Other Structures for the majority of its wind requirements. In many locations affected by tsunami risk, earthquake loading will likely govern over wind loading, but this is not necessarily true for all regions.
At locations where wind loading controls the design, the use of special seismic detailing for structural components should be considered. It is recommended that Seismic Design Category D be assigned to the structure, as a minimum, to help ensure adequate strength and ductility for resisting tsunami load effects.
6.5 Tsunami Loading
The following tsunami load effects should be considered for the design of vertical evacuation structures: (1) hydrostatic forces; (2) buoyant forces; (3) hydrodynamic forces; (4) impulsive forces; (5) debris impact forces; (6) debris damming forces; (7) uplift forces; and (8) additional gravity loads from retained water on elevated floors.
In this document, wave-breaking forces are not considered in the design of vertical evacuation structures. In general, tsunamis break offshore, and vertical evacuation structures should be located some distance inland from the shoreline. The term ‘wave-breaking’ is defined here as a plunging-type breaker in which the entire wave front overturns. When waves break in a plunging mode, the wave front becomes almost vertical, generating an extremely high pressure over an extremely short duration. Once a tsunami wave has broken, it can be considered as a bore because of its very long wavelength. Further justification for not considering wave-breaking forces can be found in Yeh (2008).
Wave-breaking forces could be critical for vertical evacuation structures located in the wave-breaking zone, which is beyond the scope of this document. If it is determined that a structure must be located in the wave-breaking zone, ASCE/SEI 7-10 Minimum Design Loads for Buildings and Other Structures and the Coastal Engineering Manual, EM 1110-2-1100, (U.S. Army Coastal Engineering Research Center, 2008) should be consulted for additional guidance on wave-breaking forces.
Tsunami Load Effects include: (1) hydrostatic forces; (2) buoyant forces; (3) hydrodynamic forces; (4) impulsive forces; (5) debris impact forces; (6) debris damming forces; (7) uplift forces; and (8) additional gravity loads from retained water on elevated floors.
78 6: Load Determination and Structural Design Criteria FEMA P-646

6.5.1 Key Assumptions for Estimating Tsunami Load Effects
Tsunami load effects are determined using the following key assumptions:
• Tsunami flows consist of a mixture of sediment and seawater. Most suspended sediment transport flows do not exceed 5% sediment concentration. Based on an assumption of vertically averaged sediment-volume concentration of 5% in seawater, the fluid density of tsunami flow should be taken as 1.1 times the density of freshwater, or ρs = 1,100 kg/m3 = 2.13 slugs/ft3.
• Tsunami flow depths vary significantly depending on the three-dimensional bathymetry and topography at the location under consideration. Figure 6-2 shows three possible scenarios where topography could affect the relationship between maximum tsunami elevation, TE, at a particular location and the ultimate inland runup elevation, R. For the loading expressions presented in this chapter, it is assumed that Figure 6-2b applies, that is TE = R. These expressions may be adjusted if numerical simulations of tsunami inundation provide more appropriate estimates of TE at the location being considered.
• There is significant variability in local tsunami runup heights, based on local bathymetry and topographic effects, and uncertainty in numerical simulations of tsunami inundation. Based on empirical judgment from past tsunami survey data, it is recommended that the design runup elevation, R, be taken as 1.3 times the predicted maximum runup elevation, R*, to envelope the potential variability in the estimates of modeling. The inundation elevation from the runup point back towards the shoreline would then be scaled by the same factor. Figure 6-3 shows a typical numerical prediction (Yamazaki et al., 2011) made for the 2009 Samoa Tsunami, which demonstrates that the 1.3 safety factor for uncertainty is realistic.
FEMA P-646 6: Load Determination and Structural Design Criteria 79

Figure 6-2 Three types of coastal inundation where the tsunami elevation (TE) at a site of interest could be less than, equal to, or greater than the ultimate inland runup elevation (R)
Figure 6-3 Comparison between numerical modeling (blue line) and field measurement of run-up (white dots) and flow elevations (blue dots) at Pago Pago Harbor, American Samoa (Yamazaki et al, 2011).
6.5.2 Hydrostatic Forces
Hydrostatic forces occur when standing or slowly moving water encounters a structure or structural component. This force always acts perpendicular to the surface of the component of interest. It is caused by an imbalance of
c)
80 6: Load Determination and Structural Design Criteria FEMA P-646

pressure due to a differential water depth on opposite sides of a structure or component. Hydrostatic forces may not be relevant to a structure with a finite (i.e., relatively short) breadth, around which the water can quickly flow and fill in on all sides. Hydrostatic forces are usually important for long structures such as sea walls and dikes, or for evaluation of an individual wall panel where the water level on one side differs substantially from the water level on the other side.
Hydrostatic and buoyant forces must be computed when the ground floor of a building is watertight, or is sufficiently insulated and airtight to prevent or delay the intrusion of water. In this situation, the hydrostatic force should be evaluated for individual wall panels. The horizontal hydrostatic force on a wall panel can be computed using Equation 6-1:
2max
12h c w sF p A gbhρ= = , (6-1)
where pc is the hydrostatic pressure, Aw is the wetted area of the panel, ρs is the fluid density including sediment (1100 kg/m3 = 2.13 slugs/ft3), g is the gravitational acceleration, b is the breadth (width) of the wall, and hmax is the maximum water height above the base of the wall at the structure location. If the wall panel with height hw is fully submerged, then the horizontal hydrostatic force can be written as Equation 6-2:
ρ = = −
max 2w
h c w s whF p A g h b h (6-2)
where hmax is the vertical difference between the design tsunami elevation R and the base elevation of the wall at the structure, zw, as shown in Equation 6-3:
= − = −max 1.3 * w wh R z R z (6-3)
where R* is the estimated maximum inundation elevation at the structure from a detailed numerical simulation model, or the runup elevation at maximum horizontal penetration of the tsunami from available tsunami inundation maps. The design runup elevation, R, is taken as 1.3 times the predicted maximum runup elevation, R*. The moment about the base of the wall can be evaluated using the line of action of the hydrostatic force resultant, as shown in Figure 6-4.
FEMA P-646 6: Load Determination and Structural Design Criteria 81

Figure 6-4 Hydrostatic force distribution and location of resultant.
6.5.3 Buoyant Forces
Buoyant or vertical hydrostatic forces will act vertically through the centroid of the displaced volume on a structure or structural component subjected to partial or total submergence. The total buoyant force equals the weight of water displaced. Buoyant forces on components must be resisted by the weight of the component and any opposing forces resisting flotation. Buoyant forces are a concern for structures that have little resistance to upward forces (e.g., light wood frame buildings, basements, empty tanks located above or below ground, swimming pools, components designed considering only gravity loads).
For a watertight structure, the total buoyant force is given by Equation 6-4:
ρ=b sF gV (6-4)
where ρs is the fluid density including sediment (1100 kg/m3 = 2.13 slugs/ft3), and V is the volume of water displaced by the building, i.e., the volume below the level of hmax as determined by Equation 6-3. Buoyant forces on an overall building are shown in Figure 6-5. If there is insufficient building weight to resist buoyant forces, tension piles may be used to increase the resistance to flotation, but reduction in pile side friction due to anticipated scour around the tops of the piles must be considered.
82 6: Load Determination and Structural Design Criteria FEMA P-646

Figure 6-5 Buoyant forces on an overall building with watertight lower
levels.
6.5.4 Hydrodynamic Forces
When water flows around a structure, hydrodynamic forces are applied to the structure as a whole and to individual structural components. These forces are induced by the flow of water moving at moderate to high velocity, and are a function of fluid density, flow velocity and structure geometry. Also known as drag forces, they are a combination of the lateral forces caused by the pressure forces from the moving mass of water and the friction forces generated as the water flows around the structure or component.
Hydrodynamic forces can be computed using Equation 6-5:
ρ= 2max
1 ( )2d s dF C B hu (6-5)
where ρs is the fluid density including sediment (1100 kg/m3 = 2.13 slugs/ft3), Cd is the drag coefficient, B is the breadth of the structure in the plane normal to the direction of flow (i.e. the breadth in the direction parallel to the shore), h is flow depth, and u is flow velocity at the location of the structure. For forces on components, B is taken as the width of the component. The drag coefficient may be conservatively taken as Cd = 2.0; the actual value is shape-, orientation-, and size-dependent. The resultant hydrodynamic force is applied approximately at the centroid of the wetted surface of the component, as shown in Figure 6-6.
R
DATUM
DESIGN RUNUP HEIGHT
BuildingWeight
Fb
Pile Tension
Total DisplacedVolume, V
hmax
FEMA P-646 6: Load Determination and Structural Design Criteria 83
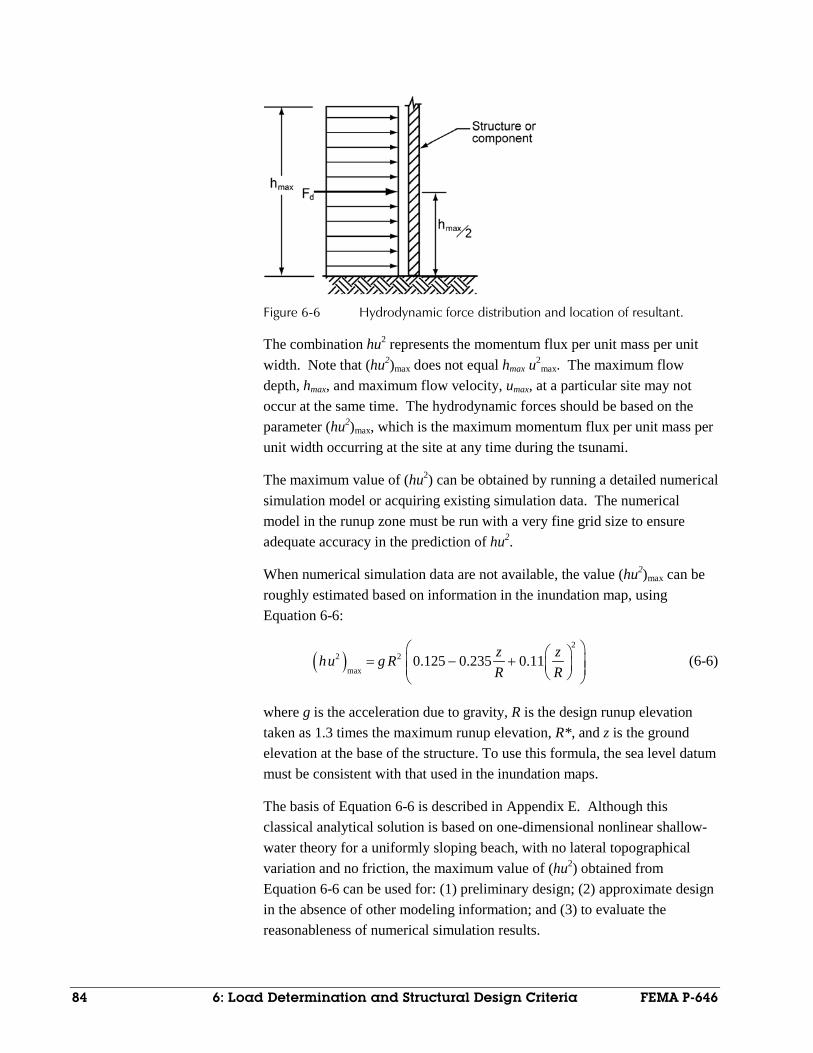
Figure 6-6 Hydrodynamic force distribution and location of resultant.
The combination hu2 represents the momentum flux per unit mass per unit width. Note that (hu2)max does not equal hmax u2
max. The maximum flow depth, hmax, and maximum flow velocity, umax, at a particular site may not occur at the same time. The hydrodynamic forces should be based on the parameter (hu2)max, which is the maximum momentum flux per unit mass per unit width occurring at the site at any time during the tsunami.
The maximum value of (hu2) can be obtained by running a detailed numerical simulation model or acquiring existing simulation data. The numerical model in the runup zone must be run with a very fine grid size to ensure adequate accuracy in the prediction of hu2.
When numerical simulation data are not available, the value (hu2)max can be roughly estimated based on information in the inundation map, using Equation 6-6:
( ) = − +
22 2
max0.125 0.235 0.11z zhu g R
R R (6-6)
where g is the acceleration due to gravity, R is the design runup elevation taken as 1.3 times the maximum runup elevation, R*, and z is the ground elevation at the base of the structure. To use this formula, the sea level datum must be consistent with that used in the inundation maps.
The basis of Equation 6-6 is described in Appendix E. Although this classical analytical solution is based on one-dimensional nonlinear shallow-water theory for a uniformly sloping beach, with no lateral topographical variation and no friction, the maximum value of (hu2) obtained from Equation 6-6 can be used for: (1) preliminary design; (2) approximate design in the absence of other modeling information; and (3) to evaluate the reasonableness of numerical simulation results.
84 6: Load Determination and Structural Design Criteria FEMA P-646

R* and z can be obtained from tsunami inundation maps. Because of uncertainties in modeling tsunami inundation, it is recommended that numerically predicted values of (hu2) should be compared with the values computed using Equation 6-6 to determine reasonableness.
6.5.5 Impulsive Forces
Impulsive forces are caused by the leading edge of a surge of water impacting a structure. Ramsden (1993) performed comprehensive experiments on impulsive forces. Laboratory data show no significant initial impact force (impulse force) in dry-bed surges, but an “overshoot” in force was observed in bores that occur when the site is initially flooded. The maximum overshoot is approximately 1.5 times the subsequent hydrodynamic force, consistent with some, but not all, of the independent laboratory data obtained by Arnason (2005). Further analysis of the conditions for the occurrence of this effect and high-speed video of similar test cases suggests it occurs when the surge depth to object width ratio is small so that a transient amount of additional “ponded” water depth accumulates against the forward side of the object before being eventually relieved by flowing around the sides. Since impact momentum increases with the sudden slam of the steep front of a bore (Yeh, 2007), the lack of overshoot in dry-bed surge can be attributed to the relatively mild slope of the front profile of the water surface. If the runup zone is flooded by an earlier tsunami wave, subsequent waves could impact buildings in the form of a bore.
For conservatism and especially for structural wall elements of significant width it is recommended that the impulsive forces be taken as 1.5 times the hydrodynamic force, as shown in Equation 6-7:
=1.5s dF F (6-7)
Impulsive forces may act on members at the leading edge of the tsunami bore, while hydrodynamic forces will certainly act on all members that have already been passed by the leading edge, as shown in Figure 6-7.
FEMA P-646 6: Load Determination and Structural Design Criteria 85

Figure 6-7 Hydrodynamic impulsive and drag forces on components of a
building subjected to inundation by a tsunami bore.
6.5.6 Floating Debris Impact Forces
The impact force from waterborne debris (e.g., floating driftwood, lumber, boats, shipping containers, automobiles, buildings) can be a cause of building damage. Unfortunately, it is difficult to estimate this force accurately. Background information on the development of the recommended impact force calculation is provided in Appendix D.
The debris impact force can be estimated using Equation 6-8, which is a more direct generalized form of the ASCE 7 Chapter 5 equation for debris impacts during riverine flooding, without the reduction factors for random orientation:
max1.3 (1 )i dF u km c= + (6-8)
where
1.3 is the Importance Coefficient for Risk Category IV structures that is specified by ASCE 7 Chapter 5 for debris impacts,
umax is the maximum flow velocity carrying the debris at the site (the debris is conservatively assumed to be moving at the same speed as the flow), except for debris rolling along the bottom where the velocity may be reduced by 50%,
c is a hydrodynamic mass coefficient which represents the effect of fluid in motion with the debris (see Table 6-1). This coefficient depends on the size, shape, and orientation of the object with respect to the flow direction. Note that it
h
z
max R
DATUM
DESIGN RUNUP HEIGHT
s,c2FFs,b2
Fs,c1Fd,c1
Fd,b2
Fd,c2
F - Impulsive forces on columns and beams at leading edge of bore
d,c1
s,c1
F - Drag forces on columns and beams behind leading edge of bore
c1 and c2 - Columns at first and second levels. b2 - Beams at second level
86 6: Load Determination and Structural Design Criteria FEMA P-646

no longer represents the traditional added-mass term derived from potential flow hydrodynamics (see Appendix D).
k is the effective net combined stiffness of the impacting debris and impacted structural element(s) deformed by the impact (i.e. 1/k = 1/ks + 1/kd). In this equation, the net stiffness is utilized to implicitly incorporate the impact duration to stop the debris. If the impact is large enough to cause inelastic behavior in the structure, this should be considered in determining the effective stiffness.
md is the mass of the debris.
Unlike other forces, impact forces are assumed to act locally on a single member of the structure at the elevation of the water surface, as shown in Figure 6-8. The probability of two or more simultaneous debris strikes is assumed to be low enough that it can be ignored.
Figure 6-8 Waterborne debris impact force.
Debris impact forces should be evaluated considering the location of the vertical evacuation structure and potential debris in the surrounding area. For example, it is likely that floating debris would consist primarily of driftwood, logs and pier pilings for most coastal towns, whereas for some large port areas, the debris could be shipping containers. Locations near yacht marinas or fishing harbors should consider possible impact from boats that break their moorings.
Use of Equation 6-8 requires the mass, hydrodynamic mass coefficient, and stiffness properties of the debris. Approximate values of md, c, and kd for common waterborne debris are listed in Table 6-1. The mass of contents in the shipping containers should only be included if they are rigidly attached to the container to prevent sliding during impact. Stiffness values for 20-ft standard shipping containers were determined using the secant stiffness corresponding to 25mm displacement for containers modeled numerically (Peterson and Naito, 2012). Values for the 20-ft heavy shipping containers
z
R
DATUM
DESIGN RUNUP HEIGHT
W Fi
d
FEMA P-646 6: Load Determination and Structural Design Criteria 87

were increased by the proportion of container weight, while those for the 40-ft containers were adjusted based on differences in framing section properties. Mass and stiffness properties for other types of debris should be derived or estimated as part of the design process.
Table 6-1 Mass and Stiffness of Some Waterborne Floating Debris
Type of Debris Mass (md )
in kg
Hydrodynamic Mass Coefft.
(c) Debris Stiffness
(kd ) in N/m
Lumber or Wood Log – oriented longitudinally
450 0 2.4 x 106 *
20-ft Standard Shipping Container – oriented longitudinally
2200 (empty)
0.30 85 x106 **
20-ft Standard Shipping Container – oriented transverse to flow
2200 (empty)
1.00 80 x106 **
20-ft Heavy Shipping Container – oriented longitudinally
2400 (empty)
0.30 93 x106 **
20-ft Heavy Shipping Container – oriented transverse to flow
2400 (empty)
1.00 87 x106 **
40-ft Standard Shipping Container – oriented longitudinally
3800 (empty)
0.20 60 x106
40-ft Standard Shipping Container – oriented transverse to flow
3800 (empty)
1.00 40 x106
* Haehnal and Daly, 2002; ** Peterson and Naito, 2012
The magnitude of the debris impact force depends on mass and velocity. Smaller (lighter) debris requiring little or no draft to float can travel at higher velocities than larger (heavier) debris requiring much larger depths to float. Use of maximum flow velocity without consideration of the depth required to float large debris would be unnecessarily conservative. The appropriate maximum flow velocity umax for a given flow depth can be obtained by running a detailed numerical simulation model or by acquiring existing simulation data. It is noted, however, that numerical predictions of flow velocities are less accurate than predictions of inundation depths, and the grid size for numerical simulations in the runup zone should be very fine in order to obtain sufficient accuracy in velocity predictions. Because of the uncertainty involved in even ‘accurate’ numerical simulations, it is suggested that a margin of safety be applied to the computed flow velocity, depending on the level of confidence in the numerical model simulations.
When a suitable numerical simulation model is unavailable, the maximum flow velocity carrying lumber or a wooden log (with essentially no draft) can be estimated using the analytical solution for tsunami runup on a uniformly sloping beach with no lateral topographical variation, given by Equation 6-9:
88 6: Load Determination and Structural Design Criteria FEMA P-646

= −
max 2 1 zu g RR
. (6-9)
where g is the acceleration due to gravity, R is the design runup height that is 1.3 times the ground elevation R* at the maximum tsunami penetration, and z is the ground elevation at the structure (the datum must be at the sea level). Background information on the development of this equation is provided in Appendix E.
For a shipping container or other similar large debris with draft d, the ratio of the draft d to the maximum runup height R can be computed, and Figure 6-9 can be used to estimate the maximum flow velocity. Draft d can be estimated using Equation 6-10:
ρ
=s f
Wdg A
(6-10)
where W is the weight of the debris, ρs is the fluid density including sediment (1100 kg/m3 = 2.13 slugs/ft3), g is the acceleration due to gravity, and Af is the cross-sectional area parallel to the water surface such that the product d × Af represents the volume of water displaced by the debris.
Figure 6-9 Maximum flow velocity of depth, d, at the ground elevation, z,
and maximum runup elevation, R. The bottom curve represents the lower limit of maximum flow velocity.
Based on the appropriate curve for d/R, and ratio between the elevation of the structure relative to the design runup elevation (z/R), Figure 6-9 will provide an estimate of the maximum flow velocity. It should be understood that
FEMA P-646 6: Load Determination and Structural Design Criteria 89

Figure 6-9 is based on an analytical solution valid only for the flow in the vicinity of the runup tip on a uniformly sloping beach, with no lateral topographical variation, and no friction. Computed values may differ from the actual velocities, and additional engineering evaluation and judgment should be considered. Background information on the development of Figure 6-9 is provided in Appendix E.
Impacts by Floating Vehicles. The impact of vehicles has been studied and codified for the case of vehicles impacting safety guardrails in parking structures. Vehicles are designed to resist impacts with significant inelastic deformation in order to reduce the forces experienced by passengers. It is recommended that the prescriptive code force of 6,000 lbs. used for safety barriers in parking structures be utilized to consider this effect on structural members immersed during the tsunami (ASCE 7, 2010). Alternatively, a work-energy approach similar to that discussed in Appendix D can be used.
6.5.7 Damming of Accumulated Waterborne Debris
The damming effect caused by accumulation of waterborne debris can be treated as a hydrodynamic force enhanced by the breadth of the debris dam against the front face of the structure. Equation 6-11 is a modification of Equation 6-5 to include the breadth of the debris dam:
ρ= 2max
1 ( )2dm s d dF C B hu (6-11)
where ρs is the fluid density including sediment (1100 kg/m3 = 2.13 slugs/ft3), Cd is the drag coefficient, Bd is the breadth of the debris dam, h is flow depth, and u is flow velocity at the location of the structure. It is recommended that the drag coefficient be taken as Cd = 2.0.
The maximum momentum flux per unit width (hu2)max should be obtained by running a detailed numerical simulation model or acquiring existing simulation data. If no numerical simulation results are available, an estimate of (hu2)max can be determined using Equation 6-6.
Since debris damming represents an accumulation of debris across the structural frame, the total debris damming force will likely be resisted by a number of structural components, depending on the framing dimensions and the size of debris dam. The debris damming force, Fdm, should be assumed to act as a uniformly distributed load over the extent of the debris dam. It should be assigned to each resisting structural component by an appropriate tributary width, and distributed uniformly over the submerged height of each resisting component. The recommended minimum debris dam width is the larger of Bd = 40 feet (or 12 m), representing a sideways shipping container,
90 6: Load Determination and Structural Design Criteria FEMA P-646

or a full structural bay width. The effects of debris damming should be evaluated at various locations on the structure to determine the most critical location. In addition, it has been observed that internal building contents may generate accumulated debris dammed against the exterior wall. The exterior wall may have partially failed to allow water flow, but structural studs and girts may be capable of holding contents in, thus generating hydrodynamic drag forces on the captured internal debris as the water flows through the structure. Accordingly, a full structural bay of debris dam is the minimum recommended width.
6.5.8 Uplift Forces on Elevated Floors
Uplift forces will be applied to floor levels of a building that are submerged by tsunami inundation. In addition to standard design for gravity loads, these floors must also be designed to resist uplift due to buoyancy and hydrodynamic forces. When computing the buoyant forces on a floor slab, consideration must be given to the potential for increased buoyancy due to the additional volume of water displaced by air trapped below the floor framing system. In addition, exterior walls at the upper floor level will exclude water until their lateral resistance is exceeded by the applied hydrostatic pressure. This can significantly increase the displaced volume of water contributing to the buoyancy, as shown in Figure 6-10.
The total upward buoyant force exerted on a floor system can be estimated using Equation 6-12:
ρ=b s f bF g A h (6-12)
where ρs is the fluid density including sediment (1100 kg/m3 = 2.13 slugs/ft3), g is the acceleration due to gravity, Af is the area of the floor panel or floor framing component, and hb is the water height displaced by the floor (including potentially entrapped air). The value of hmax indicated in Figure 6-10 should be determined using Equation 6-3.
The upward buoyant force per unit area exerted to the floor system can be estimated using Equation 6-13:
ρ=b s bf gh (6-13)
FEMA P-646 6: Load Determination and Structural Design Criteria 91

Figure 6-10 A definition sketch for upward buoyant force exerted on an
elevated floor.
Hydrodynamic forces can also act vertically on floor slabs. During rapid inundation, rising water will apply uplift to the soffit of horizontal structural components, adding to the buoyancy uplift. The presence of structural walls and columns in a building will obstruct the tsunami flow passing through the building, and recent experiments have shown that this can result in significant uplift forces on the floor slab immediately in front of the obstruction. It is recommended that the building structural layout be designed to minimize obstruction of tsunami flow through the lower levels of the building.
Until further research results become available, the total uplift force on the floor system can be estimated using Equation 6-14:
ρ= 212u u s f vF C A u (6-14)
where Cu is a coefficient (taken as 3.0), ρs is the fluid density including sediment (1100 kg/m3 = 2.13 slugs/ft3), Af is the area of the floor panel or floor framing component, and uv is the estimated vertical velocity or water rise rate (adapted from American Petroleum Institute, 1993).
The hydrodynamic uplift per unit area can be determined from Equation 6-15:
ρ= 212u u s vf C u (6-15)
Unless a detailed hydrodynamic study is performed, the value of uv for the condition of sloping terrain below the building can be estimated using Equation 6-16:
h
h
α
h
u s
max
b
fA = BxL
Fb
92 6: Load Determination and Structural Design Criteria FEMA P-646
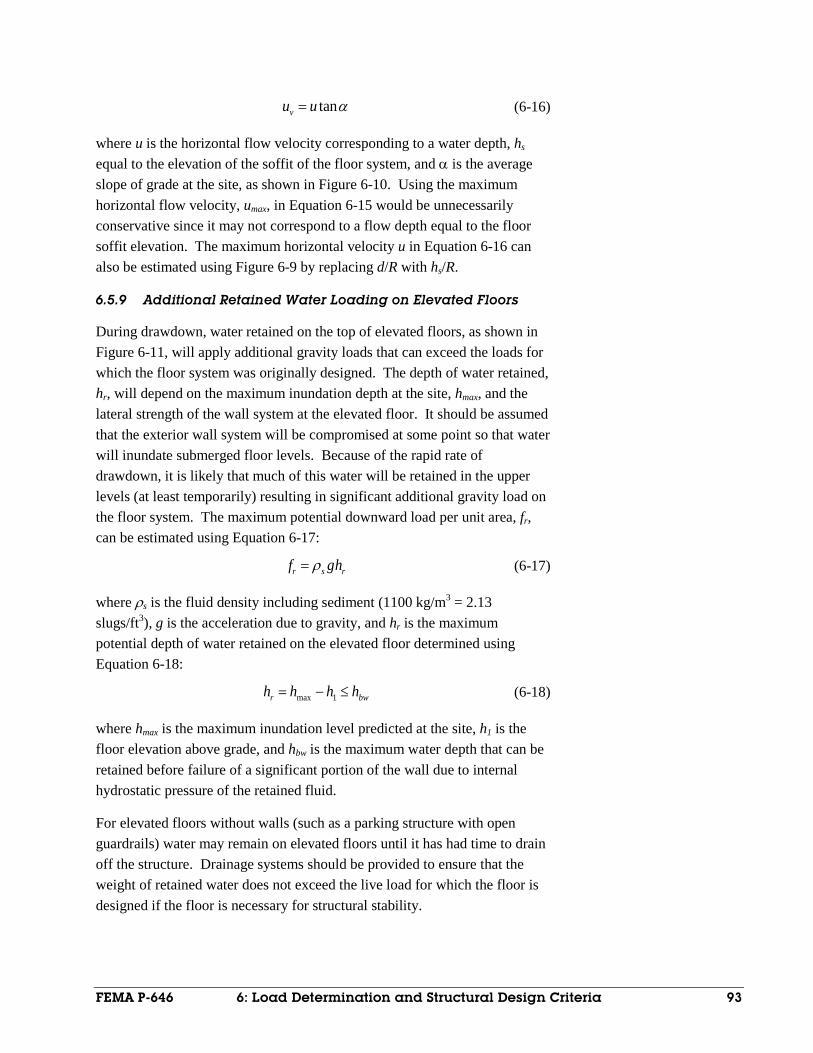
α= tanvu u (6-16)
where u is the horizontal flow velocity corresponding to a water depth, hs equal to the elevation of the soffit of the floor system, and α is the average slope of grade at the site, as shown in Figure 6-10. Using the maximum horizontal flow velocity, umax, in Equation 6-15 would be unnecessarily conservative since it may not correspond to a flow depth equal to the floor soffit elevation. The maximum horizontal velocity u in Equation 6-16 can also be estimated using Figure 6-9 by replacing d/R with hs/R.
6.5.9 Additional Retained Water Loading on Elevated Floors
During drawdown, water retained on the top of elevated floors, as shown in Figure 6-11, will apply additional gravity loads that can exceed the loads for which the floor system was originally designed. The depth of water retained, hr, will depend on the maximum inundation depth at the site, hmax, and the lateral strength of the wall system at the elevated floor. It should be assumed that the exterior wall system will be compromised at some point so that water will inundate submerged floor levels. Because of the rapid rate of drawdown, it is likely that much of this water will be retained in the upper levels (at least temporarily) resulting in significant additional gravity load on the floor system. The maximum potential downward load per unit area, fr, can be estimated using Equation 6-17:
ρ=r s rf gh (6-17)
where ρs is the fluid density including sediment (1100 kg/m3 = 2.13 slugs/ft3), g is the acceleration due to gravity, and hr is the maximum potential depth of water retained on the elevated floor determined using Equation 6-18:
= − ≤max 1r bwh h h h (6-18)
where hmax is the maximum inundation level predicted at the site, h1 is the floor elevation above grade, and hbw is the maximum water depth that can be retained before failure of a significant portion of the wall due to internal hydrostatic pressure of the retained fluid.
For elevated floors without walls (such as a parking structure with open guardrails) water may remain on elevated floors until it has had time to drain off the structure. Drainage systems should be provided to ensure that the weight of retained water does not exceed the live load for which the floor is designed if the floor is necessary for structural stability.
FEMA P-646 6: Load Determination and Structural Design Criteria 93

Figure 6-11 Gravity loads exerted on an elevated floor with water retained
by exterior walls during rapid drawdown.
6.6 Combination of Tsunami Forces
Not all tsunami load effects will occur simultaneously, nor will they all affect a particular structural component at the same time. This section describes combinations of tsunami forces that should be considered for the overall structure and for individual structural components. Other potential combinations should be considered as needed, based on the particular siting, structural system, and design of the structure under consideration.
6.6.1 Tsunami Force Combinations on the Overall Structure
Tsunami forces are combined on the overall structure as follows:
• Uplift due to buoyancy, Fb, and hydrodynamic uplift, Fu, have the effect of reducing the total dead weight of a structure, which may impact the overturning resistance. Buoyancy and hydrodynamic uplift appropriate for the design inundation level should be considered in all load combinations.
• Impulsive forces, Fs, are very short duration loads caused by the leading edge of a surge of water impinging on a wall-like structure. As the surge passes through a structure, impulsive forces will be applied sequentially to all structural components, but not at the same time. Once the leading edge of the surge has passed a structural component, it will no longer experience the impulsive force, but rather a sustained hydrodynamic drag force, Fd. The total horizontal hydrodynamic force on a structure will therefore be a combination of impulsive forces on members at the leading edge of the surge, and drag forces on all previously submerged members behind the leading edge. Figure 6-12 shows how this
hr
hmaxh1
u
Fr
Not all tsunami load effects will occur simultaneously, nor will they all affect a particular structural component at the same time.
94 6: Load Determination and Structural Design Criteria FEMA P-646

combination would apply to a building with multiple columns and shear walls. The worst case lateral load will likely occur when the leading edge of the surge fully impacts the most closed off section of the building.
• Debris impact forces, Fi, are short duration loads due to impact of large floating objects with individual structural components. Since large floating objects are not carried by the leading edge of the surge, the effect of debris impact is combined with hydrodynamic drag forces, Fd, but not impulsive forces, Fs. Although many floating objects may impact a building during a tsunami event, the probability of two or more impacts occurring simultaneously is considered small. Therefore, only one impact should be considered to occur at any point in time. Both the individual structural component and the overall structure must be designed to resist the impact force in combination with all other loads (except impulsive forces).
• Debris damming has the effect of increasing the exposed area for hydrodynamic loading. The debris damming force, Fdm, should be considered to act in the most detrimental location on a structure while hydrodynamic forces act on all other components of the structure. Figure 6-13 shows typical debris dam locations that could be considered in conjunction with drag forces on all other submerged structural components. It is conservative to ignore any shielding effect provided by the debris dam for components downstream of the dam.
Figure 6-12 Impulsive and drag forces applied to an example building.
FEMA P-646 6: Load Determination and Structural Design Criteria 95

Figure 6-13 Debris dam and drag forces applied to an example building.
• Breakaway walls are not part of the structural support of the building, and are intended, through design and construction, to fail under specific lateral loading. If lower level infill walls are designed as breakaway walls, the maximum lateral load will be the load at which the walls will “fail,” and the overall structure, as well as the structural components supporting these walls, must be designed to resist this failure load. Guidance on the design of break-away walls is provided in Chapter 7.
• Design of floor systems to withstand the effects of potential retained water, Fr, can be performed independently of the lateral loading on the structure.
6.6.2 Tsunami Force Combinations on Individual Components
Tsunami forces are combined on individual structural components (e.g., columns, walls, and beams), as follows:
• Impulsive force, Fs, applicable to wall and pier structural elements due to the leading edge of the tsunami bore, for maximum hu2.
• Hydrodynamic drag force, Fd, plus debris impact, Fi, at the most critical location on the member, for maximum hu2.
• Debris damming, Fdm, due to a minimum 40-foot wide or structural bay width debris dam causing the worst possible loading on the member, for maximum hu2.
96 6: Load Determination and Structural Design Criteria FEMA P-646

• Hydrostatic pressure, Fh, on walls enclosing watertight areas of a structure, for maximum h.
For uplift on floor framing components, the following combinations of tsunami forces should be considered:
• Buoyancy, Fb, of submerged floor framing components including the effects of entrapped air and upturned beams or walls, for maximum h.
• Hydrodynamic uplift, Fu, due to rapidly rising flood waters, for flow velocity at a depth equal to the soffit of the floor system, hs.
• Maximum uplift case: The larger of the above uplift loads combined with 90% dead load and zero live load on the floor system, for design against uplift failure of floor slabs, beams, and connections.
For downward load on floor framing components due to retained water, the following force combination should be considered:
• Downward load due to water retained by exterior walls, fr, combined with 100% dead load.
6.7 Load Combinations
The load combinations presented herein are based on the guidance given in the Commentary of ASCE/SEI 7-10 Minimum Design Loads for Buildings and Other Structures (ASCE, 2010), but are modified from those used in Section 2.5, Load Combinations for Extraordinary Events, of ASCE/SEI Standard 7-10. The modification is based on the presumption that only the refuge floor areas will be occupied during a tsunami event. They have been reviewed in the development of this document, but have not been extensively studied. They should be considered in addition to all other load combinations required by the current building code in effect, or Section 2 of ASCE/SEI 7-10.
Tsunami forces that will act on the entire structure and on individual structural components should be calculated in accordance with Section 6.5 and Section 6.6. The resulting member forces (Ts) should then be combined with gravity load effects using the following Strength Design Load Combinations:
Load Combination 1: 1.2D + 1.0Ts + 1.0LREF + 0.25L
Load Combination 2: 0.9D + 1.0Ts
Tsunami Load Combinations should be considered in addition to all other load combinations provided by the current building code in effect, or ASCE/SEI 7-05.
FEMA P-646 6: Load Determination and Structural Design Criteria 97

where D is the dead load effect, Ts is the tsunami load effect, LREF is the live load effect in the refuge area (assembly loading), and L is the live load effect outside of the refuge area.
A load factor of 1.0 is used in conjunction with tsunami forces calculated in accordance with this document for the following reasons: (1) it is anticipated that the tsunami hazard level corresponding to the Maximum Considered Tsunami will be consistent with the 2500-year return period associated with the Maximum Considered Earthquake used in seismic design; and (2) potential variability in tsunami runup elevations is explicitly considered by applying a 30% increase to runup elevations used in tsunami force calculations.
Load Combination 1 considers the refuge area in the vertical evacuation structure to be fully loaded with assembly live load (i.e., 100 psf). The assembly live load represents a practical upper limit for the maximum density of evacuees standing in the refuge area. In combination with tsunami inundation, it is expected that all other floor areas will experience a reduced live load equal to 25% of the design live load. This reduced live load is consistent with live load reductions used in combination with earthquake forces. When gravity load effects oppose tsunami load effects, Load Combination 2 applies.
No additional importance factor, I, is applied to tsunami loads in this document. These design guidelines have been developed specifically for tsunami evacuation structures, and the critical nature of these structures has been considered throughout.
Seismic loads are not considered to act in combination with tsunami loads. While aftershocks are likely to occur, the probability that an aftershock will be equivalent in size to the design level earthquake, and will occur at the same time as the maximum tsunami loading, is considered to be low. However, since seismic design in the U.S. does utilize post-elastic ductility, seismically damaged components may have less available ductility for a subsequently arriving local tsunami.
6.8 Member Capacities and Strength Design Considerations
Model building code provisions and engineering standards for Strength Design, also known as Load and Resistance Factored Design (LRFD), provide material-specific member capacity calculations and strength reduction factors for various force actions and different structural components. Until further research shows otherwise, it is recommended that
Member Capacities and Strength Reduction Factors should be applied to design for tsunami loading in the same way they are currently applied to design for earthquake and wind loading.
98 6: Load Determination and Structural Design Criteria FEMA P-646

capacity calculations and strength reduction factors be applied to design for tsunami loading in the same way they are currently applied to design for earthquake and wind loading.
6.9 Progressive Collapse Considerations
Reducing the potential for disproportionate (i.e., progressive) collapse due to the loss of one or more structural components will increase the likelihood that a vertical evacuation structure will remain standing if a column is severely damaged due to waterborne debris. The decision to include progressive collapse considerations in the design for a particular structure will depend on the site and the nature of the debris that could potentially impact the structure. Because the potential exists for localized severe damage due to debris impact, design for progressive collapse prevention is strongly encouraged. In the United States, primary design approaches for progressive collapse include measures to implement “tie force”, “enhanced local resistance” and “alternative load path” mitigation measures. For essential facility occupancies including emergency shelters, the Department of Defense requires the application of all three measures. The General Services Administration requires the alternative load path design technique to span over a missing vertical load carrying column or wall element.
6.9.1 Department of Defense Methodology
The Department of Defense (DOD) has adopted occupancy-dependent requirements for progressive collapse prevention to address the potential for progressive collapse in the design of facilities using UFC 4-023-03, Design of Buildings to Resist Progressive Collapse (DOD, 2009). For Risk Category IV, the designer provides:
1. Internal, peripheral, and vertical tie force capacities so that the building is mechanically tied together to enhance the development of alternative load paths.
2. Enhanced Local Resistance of the first two stories on the building perimeter, with flexural capacities of columns and walls increased by factors of 2 and 1.5, respectively, over the design flexural strength determined from the alternative load path procedure. The shear capacities of these elements shall be greater than the flexural capacities. For design of vertical evacuation structures it is proposed that these measures be applied to all levels anticipated to be submerged by the tsunami, but not less than the first two stories.
FEMA P-646 6: Load Determination and Structural Design Criteria 99

3. Alternative Load Path to enable the structure to bridge over vertical load-bearing elements that are notionally removed one at a time along the exterior.
The tie force strategy is illustrated in Figure 6-14.
Figure 6-14 Tie force strategy in a frame structure.
Tension ties in reinforced concrete structures typically consist of continuous reinforcing steel in beams, columns, slabs, and walls, as shown in Figure 6-15. Reinforcement required for tension ties can be provided in whole, or in part, by steel already sized to resist other actions, such as shear or flexure. In many cases, the quantity of steel provided to resist gravity and lateral forces for typical reinforced concrete structures is also sufficient to develop the necessary tie forces.
It is reasonable to check tie force compliance after a structure is initially designed for gravity and lateral loading. Ties must be properly spliced and adequately anchored at each end in order to develop their full capacity and perform as anticipated. Reinforcing steel used as tension ties must have lapped, welded, or mechanically joined (Type 1 or Type 2) splices per ACI 318, Building Code Requirements for Structural Concrete (ACI, 2011). Splices should be staggered and located away from joints and regions of high stress.
100 6: Load Determination and Structural Design Criteria FEMA P-646
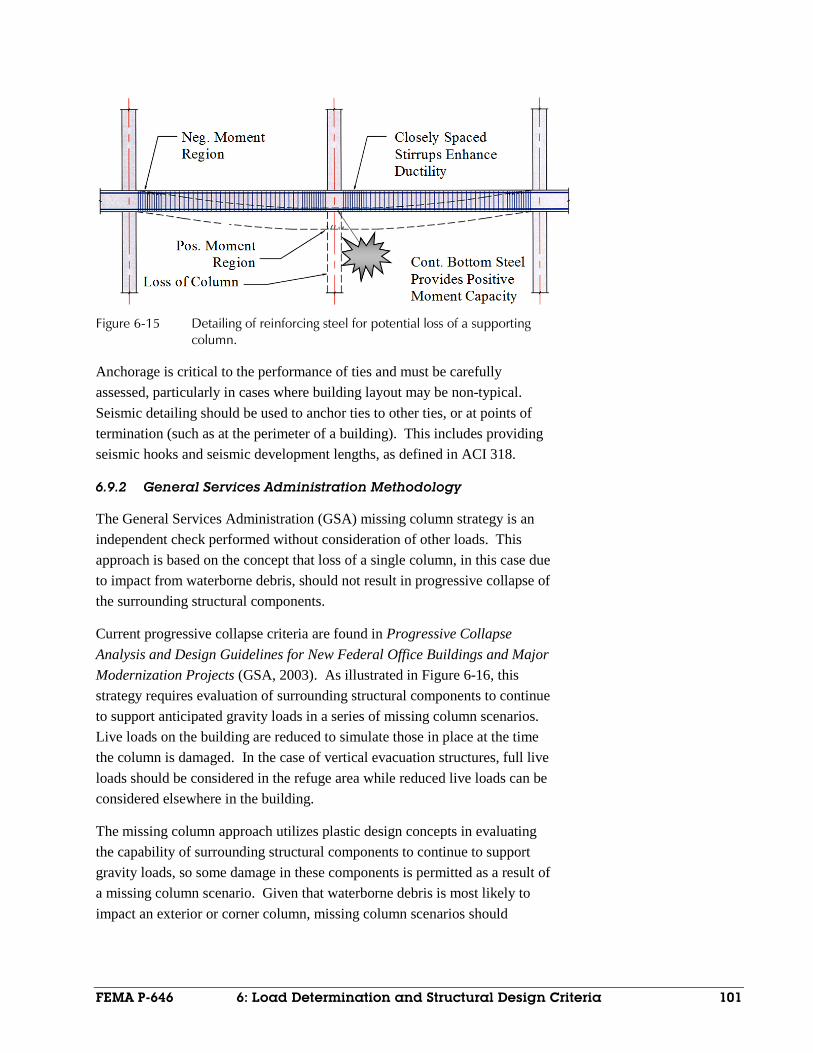
Figure 6-15 Detailing of reinforcing steel for potential loss of a supporting
column.
Anchorage is critical to the performance of ties and must be carefully assessed, particularly in cases where building layout may be non-typical. Seismic detailing should be used to anchor ties to other ties, or at points of termination (such as at the perimeter of a building). This includes providing seismic hooks and seismic development lengths, as defined in ACI 318.
6.9.2 General Services Administration Methodology
The General Services Administration (GSA) missing column strategy is an independent check performed without consideration of other loads. This approach is based on the concept that loss of a single column, in this case due to impact from waterborne debris, should not result in progressive collapse of the surrounding structural components.
Current progressive collapse criteria are found in Progressive Collapse Analysis and Design Guidelines for New Federal Office Buildings and Major Modernization Projects (GSA, 2003). As illustrated in Figure 6-16, this strategy requires evaluation of surrounding structural components to continue to support anticipated gravity loads in a series of missing column scenarios. Live loads on the building are reduced to simulate those in place at the time the column is damaged. In the case of vertical evacuation structures, full live loads should be considered in the refuge area while reduced live loads can be considered elsewhere in the building.
The missing column approach utilizes plastic design concepts in evaluating the capability of surrounding structural components to continue to support gravity loads, so some damage in these components is permitted as a result of a missing column scenario. Given that waterborne debris is most likely to impact an exterior or corner column, missing column scenarios should
FEMA P-646 6: Load Determination and Structural Design Criteria 101

consider the potential loss of any single exterior column. Loss of interior columns need not be considered.
Figure 6-16 Missing column strategy.
102 6: Load Determination and Structural Design Criteria FEMA P-646

Chapter 7
Structural Design Concepts and Additional Considerations
This chapter summarizes structural design concepts and other considerations relevant to the design of vertical evacuation structures, including retrofit of existing structures, permitting, peer review, quality control, planning issues, and potential cost impacts.
7.1 Attributes of Tsunami-Resistant Structures
Structural system selection and configuration, from foundation to roof framing, can have a significant effect on the ability of a vertical evacuation structure to withstand anticipated tsunami, earthquake, and wind loading. Many common structural systems can be engineered to resist tsunami load effects.
Structural attributes that have demonstrated good behavior in past tsunamis include: (1) strong systems with reserve capacity to resist extreme forces; (2) open systems that allow water to flow through with minimal resistance; (3) ductile systems that resist extreme forces without failure; and (4) redundant systems that can experience partial failure without progressive collapse. Systems exhibiting these attributes include reinforced concrete and steel moment frame systems, and reinforced concrete shear wall systems.
7.2 Structural Considerations for Tsunami Load Effects
Foundation design must consider the local effects of scour and liquefaction. In many cases foundation support will consist of deep foundations (piles). Pile design must consider increased demands due to downdrag and additional lateral forces, and increased unbraced pile length due to scour. Potential uplift from the overall buoyancy of the structure and overturning moments due to hydrodynamic and unbalanced hydrostatic loads need to be accounted for in the foundation design.
Design of individual columns for tsunami lateral loads should be performed assuming the appropriate degree of fixity at the column base and at each floor level. For example, a reinforced concrete column in a multi-story building supported by pile foundations can be assumed fixed at the base and
Tsunami-Resistant Structures have: (1) strong systems with reserve capacity to resist extreme forces; (2) open systems that allow water to flow through with minimal resistance; (3) ductile systems that resist extreme forces without failure; and (4) redundant systems that can experience partial failure without progressive collapse.
FEMA P-646 7: Structural Design Concepts and Additional Considerations 103

at each floor level. A steel column forming part of a moment-resisting frame can be assumed pinned or fixed at the base and at each floor level.
Column shape is also important. Round columns will result in lower drag forces than square or rectangular shapes. In addition, waterborne debris will be less likely to fully impact round columns.
If shear walls are used, the plan orientation of the walls is important. It is recommended that the shear walls be oriented parallel to the anticipated direction of tsunami flow to reduce associated hydrodynamic forces and impact forces from waterborne debris.
Design of reinforced concrete walls for tsunami forces should consider the full load on the wall, including hydrodynamic and debris impact forces, spanning vertically between floor levels. Reinforced concrete beams poured integral with the floor will be braced by the slab. Design of beams for horizontal tsunami forces should take into account the lateral bracing provided by the floor slab. Isolated beams must be designed for horizontal shear and bending induced by tsunami loads.
Floor systems must be designed for the effects of buoyancy and hydrodynamic uplift, which will induce shear and bending effects that are opposite to those resulting from gravity loads. Even though lower levels of a vertical evacuation structure are not intended for use during a tsunami, failure could result in damage or collapse of columns supporting upper levels, including the tsunami refuge area.
In structural steel floor systems, lateral torsional buckling of beam bottom flanges must be considered when subjected to uplift loading. In reinforced concrete floor systems, continuity of reinforcement should be provided in beams and slabs for at least 50% of both the top and bottom reinforcement.
Prestressed concrete floor systems must be carefully checked for buoyancy and hydrodynamic uplift effects when submerged. Internal prestressing forces used to oppose dead loads add to these effects. Web elements of typical prestressed joist systems are susceptible to compression failure under uplift conditions, and many typical bearing connections are not anchored for potential net uplift forces. Localized damage to the concrete in a prestressed floor system can result in loss of concrete compressive capacity, and release of the internal prestressing forces.
7.2.1 Foundation / Scour Design Concepts
Scour around shallow foundations can lead to failure of the supported structural element. Foundations consisting of drilled shafts or driven piles
104 7: Structural Design Concepts and Additional Considerations FEMA P-646

can be designed to avoid this failure; however, they must be able to resist all applied loads after scouring has exposed the pile cap and top of the shafts or piles.
Dames and Moore (1980) suggests that scour depth is related to distance from the shoreline and soil type. As indicated in Table 7-1, scour depth is estimated as a percentage of the maximum tsunami flow depth, d.
Table 7-1 Approximate Scour Depth as a Percentage of Flow Depth, d (Dames and Moore, 1980)
Soil Type
Scour depth (% of d) (Shoreline Distance < 300 feet)
Scour depth (% of d) (Shoreline Distance > 300 feet)
Loose sand 80 60
Dense sand 50 35
Soft silt 50 25
Stiff silt 25 15
Soft clay 25 15
Stiff clay 10 5
Observations after the Indian Ocean Tsunami indicate that scour can occur significantly farther inland than 300 feet from the shoreline. Scour depths of 10 to 13 feet (3 to 4 meters) were observed in locations of high velocity flow during the Tohoku tsunami. Conservative engineering judgment should be exercised in categorizing the soil type at the site into the broad categories listed above.
7.2.2 Breakaway Wall Concepts
Solid enclosure walls below the tsunami inundation level will result in large tsunami loads on the overall building. These walls will also increase the potential for wave scour at grade beams and piles. Non-structural walls below the anticipated tsunami flow depth can be designed as breakaway walls to limit the hydrostatic, buoyancy, hydrodynamic, and impulsive forces on the overall building and individual structural members. Breakaway wall requirements are described in detail in the FEMA 55 Coastal Construction Manual (FEMA, 2005), which complies with National Flood Insurance Program (NFIP) requirements for construction in the mapped V-Zone. Breakaway walls can create wave reflection and runup prior to failure as indicated in Figure 7-1.
In accordance with ASCE/SEI Standard 24-05 Flood Resistant Design and Construction (ASCE, 2006a), walls, partitions, and connections to the structure that are intended to break away are designed for the largest of the following loads acting perpendicular to the plane of the wall:
FEMA P-646 7: Structural Design Concepts and Additional Considerations 105
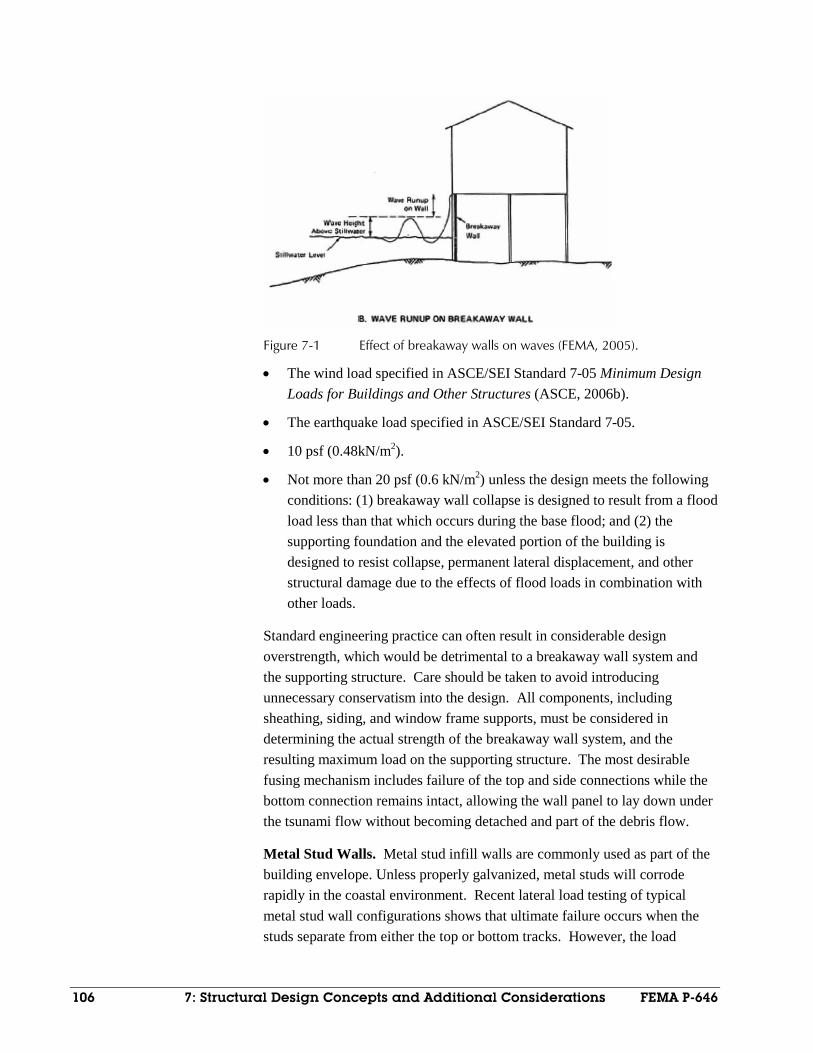
Figure 7-1 Effect of breakaway walls on waves (FEMA, 2005).
• The wind load specified in ASCE/SEI Standard 7-05 Minimum Design Loads for Buildings and Other Structures (ASCE, 2006b).
• The earthquake load specified in ASCE/SEI Standard 7-05.
• 10 psf (0.48kN/m2).
• Not more than 20 psf (0.6 kN/m2) unless the design meets the following conditions: (1) breakaway wall collapse is designed to result from a flood load less than that which occurs during the base flood; and (2) the supporting foundation and the elevated portion of the building is designed to resist collapse, permanent lateral displacement, and other structural damage due to the effects of flood loads in combination with other loads.
Standard engineering practice can often result in considerable design overstrength, which would be detrimental to a breakaway wall system and the supporting structure. Care should be taken to avoid introducing unnecessary conservatism into the design. All components, including sheathing, siding, and window frame supports, must be considered in determining the actual strength of the breakaway wall system, and the resulting maximum load on the supporting structure. The most desirable fusing mechanism includes failure of the top and side connections while the bottom connection remains intact, allowing the wall panel to lay down under the tsunami flow without becoming detached and part of the debris flow.
Metal Stud Walls. Metal stud infill walls are commonly used as part of the building envelope. Unless properly galvanized, metal studs will corrode rapidly in the coastal environment. Recent lateral load testing of typical metal stud wall configurations shows that ultimate failure occurs when the studs separate from either the top or bottom tracks. However, the load
106 7: Structural Design Concepts and Additional Considerations FEMA P-646
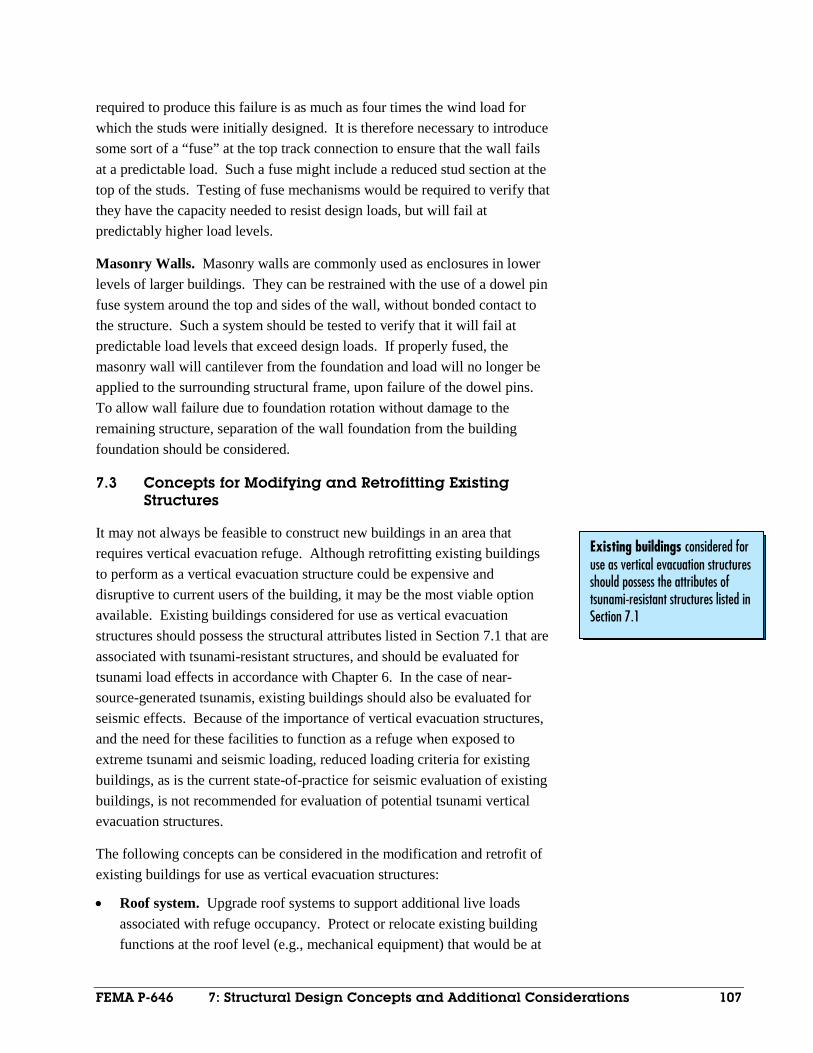
required to produce this failure is as much as four times the wind load for which the studs were initially designed. It is therefore necessary to introduce some sort of a “fuse” at the top track connection to ensure that the wall fails at a predictable load. Such a fuse might include a reduced stud section at the top of the studs. Testing of fuse mechanisms would be required to verify that they have the capacity needed to resist design loads, but will fail at predictably higher load levels.
Masonry Walls. Masonry walls are commonly used as enclosures in lower levels of larger buildings. They can be restrained with the use of a dowel pin fuse system around the top and sides of the wall, without bonded contact to the structure. Such a system should be tested to verify that it will fail at predictable load levels that exceed design loads. If properly fused, the masonry wall will cantilever from the foundation and load will no longer be applied to the surrounding structural frame, upon failure of the dowel pins. To allow wall failure due to foundation rotation without damage to the remaining structure, separation of the wall foundation from the building foundation should be considered.
7.3 Concepts for Modifying and Retrofitting Existing Structures
It may not always be feasible to construct new buildings in an area that requires vertical evacuation refuge. Although retrofitting existing buildings to perform as a vertical evacuation structure could be expensive and disruptive to current users of the building, it may be the most viable option available. Existing buildings considered for use as vertical evacuation structures should possess the structural attributes listed in Section 7.1 that are associated with tsunami-resistant structures, and should be evaluated for tsunami load effects in accordance with Chapter 6. In the case of near-source-generated tsunamis, existing buildings should also be evaluated for seismic effects. Because of the importance of vertical evacuation structures, and the need for these facilities to function as a refuge when exposed to extreme tsunami and seismic loading, reduced loading criteria for existing buildings, as is the current state-of-practice for seismic evaluation of existing buildings, is not recommended for evaluation of potential tsunami vertical evacuation structures.
The following concepts can be considered in the modification and retrofit of existing buildings for use as vertical evacuation structures:
• Roof system. Upgrade roof systems to support additional live loads associated with refuge occupancy. Protect or relocate existing building functions at the roof level (e.g., mechanical equipment) that would be at
Existing buildings considered for use as vertical evacuation structures should possess the attributes of tsunami-resistant structures listed in Section 7.1
FEMA P-646 7: Structural Design Concepts and Additional Considerations 107

risk or unsafe in the immediate vicinity of high occupancy areas. Modify existing roof parapets for fall protection of refuge occupants.
• Wall system. Consider modifying walls and wall connections in the lower levels of the building to perform as breakaway walls to minimize tsunami hydrostatic, hydrodynamic, and surge forces on the building.
• Access. Modify ingress into the building and improve vertical circulation through the use of new entrances, ramps, and stairs. Consider placing access points on the outside of the building for ease of construction and high visibility.
• Potential Debris. Remove or relocate building ground level functions that may become potential water-borne debris.
• Existing hazards at the site. Consider and protect against other hazards that might exist at the building site, including other adjacent buildings that could collapse, and the presence of hazardous or flammable materials near the site.
7.4 Permitting and Quality Assurance for Vertical Evacuation Structures
7.4.1 Permitting and Code Compliance
Before construction begins, all necessary state, local, building, and other permits should be obtained. Because model building codes and engineering standards do not address the design of a tsunami refuge specifically, design professionals should meet with building officials to discuss possible design requirements.
In general, mechanical, electrical, and plumbing systems should be designed for the normal daily use of the facility, unless otherwise directed by the authority having jurisdiction. Designing these systems for the high occupancy load that would occur only when the structure is serving as a vertical evacuation refuge may not be necessary.
7.4.2 Peer Review
A vertical evacuation structure is a unique structure that must withstand special loads and load combinations. While earthquake, wind, and flood loading effects are well understood in the design and permitting process, consideration of tsunami load effects includes some new concepts and approaches. Considering the importance of vertical evacuation structures and the extreme nature of tsunami loading, peer review by a qualified individual or team is recommended.
The unique nature of vertical evacuation structures may require special allowances for: (1) permitting and code compliance; (2) peer review; and (3) quality assurance.
108 7: Structural Design Concepts and Additional Considerations FEMA P-646

7.4.3 Quality Assurance / Quality Control
Because a vertical evacuation structure must perform well during extreme loading conditions, quality assurance and quality control for the design and construction of the structure should be at a level above that for normal building construction. Design calculations and drawings should be thoroughly scrutinized for accuracy.
The quality of both construction materials and methods should be ensured through the development and application of a quality control program. A quality assurance plan should be based on the Special Inspection Requirements listed in Chapter 17 of the International Building Code (ICC, 2006). Special inspections and quality assurance provisions for primary seismic- and wind-resisting systems should be applied to tsunami-resisting elements of vertical evacuation structures. Exceptions that waive the need for quality assurance when elements are prefabricated should not be allowed.
In addition to the building elements that are normally included special inspection programs, the following items require special attention:
• Breakaway walls and their connections to structural components to avoid unintended conservatism in construction.
• Other special components or details that are used to minimize tsunami-loading effects.
• Piles, pilecaps and grade beams that will potentially experience the effects of scour.
7.5 Planning Considerations for Vertical Evacuation Structures
In addition to structural design, planning for vertical evacuation facilities should consider a number of issues, including access, parking, pets, occupancy limitations, and protection of critical functions.
• Access and Entry. Confusion and panic will occur if evacuees arrive at a refuge facility, but cannot enter. Provisions should be made to ensure access in the event of a tsunami, while providing adequate security during times when the facility is unoccupied. Ideally, a vertical evacuation refuge should be configured so that it is always accessible, or can be entered without emergency personnel.
• Americans with Disabilities Act (ADA). Vertical evacuation structures, when not operating as a refuge, must comply with Federal, state, and local ADA requirements and ordinances for the normal daily use of the facility. Design of ingress and vertical circulation within a
Planning for vertical evacuation facilities should allow for: (1) access and entry; (2) Americans with Disabilities Act; (3) parking; (4) pets; (5) occupancy limitations; and (6) protection of critical functions.
FEMA P-646 7: Structural Design Concepts and Additional Considerations 109

vertical evacuation structure should consider the needs of disabled occupants to the extent possible, and the extent required by law, in the case of emergency evacuation. Given potential limitations on functionality of power sources and vertical conveyance systems (e.g., elevators and escalators) in the event of a near-source earthquake, disabled occupants may need assistance accessing refuge areas in vertical evacuation structures.
• Parking. Parking at evacuation facilities can be a problem. Traffic congestion can adversely affect access to the facility, and parked vehicles can become waterborne debris that can damage the structure. Planning for vertical evacuation facilities should consider parking limitations.
• Pets. Refuge facilities are typically not prepared to accommodate pets. Many people, however, do not want to leave their pets behind during a disaster. Planning should carefully consider the policy regarding pets.
• Occupancy Limitations. Population density can be non-uniform, and can vary by time of day, week, or year. In the event of a tsunami, evacuation behavior of the surrounding population may result in an unequal distribution of evacuees among available refuge facilities. In determining the maximum occupancy for a refuge facility, the time of day, day of the week, or season of the year that will result in the largest number of possible evacuees should be considered. The maximum occupancy might need to be increased in order to accommodate unexpected additional occupants or visitors in the area.
• Protection of Critical Functions. A vertical evacuation facility must be operational to serve its intended function in the event of a tsunami. Functions that are critical for operation as a short-term refuge, emergency response, medical care, or long-term sheltering facility must be protected from tsunami inundation, or located within the area of refuge. These might include emergency power, electrical equipment, communications equipment, basic sanitation needs, medical and pharmaceutical supplies, and emergency provisions (e.g., food, water, and supplies).
7.6 Cost Considerations for Vertical Evacuation Structures
Design of vertical evacuation structures for tsunami load effects will require more strength, ductility, and robustness than is necessary for normal-use structures. As recommended in this document, this can include the use of seismic detailing provisions, progressive collapse preventative measures, customized breakaway wall details, and deeper foundation systems. As such,
110 7: Structural Design Concepts and Additional Considerations FEMA P-646

it is expected that structural construction costs will be higher for vertical evacuation structures than for other structures. While there are no direct comparisons between the cost of a conventional structure versus the cost of a tsunami-resistant structure, order-of-magnitude information on potential structural construction cost increases can be obtained from currently available information.
Structural costs, however, are only a fraction of total construction costs for a building. Depending on the nature of building occupancy and use, structural construction costs can range between 5% and 40% of total construction costs. Structural costs are a lower percentage of the total for occupancies with special uses (e.g., hospitals) requiring more expensive nonstructural systems and contents, and are higher percentage of the total for occupancies with standard uses (e.g., offices).
Anecdotal evidence from design and construction of essential facilities (e.g., hospitals) in California, Oregon, and Washington indicate that the cost premium for seismic design requirements associated with essential facilities versus ordinary occupancy facilities is on the order of 10% to 20% of structural construction costs. This would represent an increase on the order of 1% to 8% in terms of total construction costs.
In a recent study funded by the National Institute of Standards and Technology (NIST), Engineering Design and Cost Data for Reinforced Concrete Buildings for Next Generation Design and Economic Standards for Structural Integrity (NIST, 2007), the cost premium for progressive collapse-resistant design was on the order of 10% to 20% of structural construction costs. Similar to seismic design, this would represent an increase on the order of 1% to 8% in terms of total construction costs.
Considering additional allowances for added strength to resist tsunami load effects, it is reasonable to expect that a tsunami-resistant structure, including seismic-resistant and progressive collapse-resistant design features, would experience about a 10% to 20% order-of-magnitude increase in total construction costs over that required for normal-use buildings. While each project will be unique, and relative costs will depend on the specific tsunami hazard and site conditions, it should not be assumed that incorporation of tsunami-resistant design features in a vertical evacuation structure will be cost prohibitive.
Structural construction costs are only a fraction of total construction costs for a building.
Tsunami-resistant structures could experience about a 10% to 20% order-of-magnitude increase in total construction costs over that required for normal-use buildings.
FEMA P-646 7: Structural Design Concepts and Additional Considerations 111


Appendix A
Vertical Evacuation Structure Examples from Japan
In Japan there are examples of structures that were designed and constructed specifically for the purpose of tsunami refuge. The Government of Japan, Director-General for Policy Planning, published Guidelines for Tsunami Evacuation Buildings in Japanese in June 1995 (DGPP, 1995). Okada, et al (2005) of the Building Center of Japan, Building Technology Research Institute, provide an English explanation in SMBTR - Structural Design Method of Buildings for Tsunami Resistance, which has been used for design of vertical evacuation structures such as the apartment building in Minamisanriku, shown in Figure 2-23.
A number of multi-story reinforced concrete and structural steel buildings in Japan were designated as vertical evacuation buildings prior to the Tohoku tsunami. All performed well structurally, though many were too low for the actual inundation depth, resulting in loss of life (Murakami et al, 2012). Figure A-1 shows such a building in Kesennuma Port that was successfully used by refugees during the tsunami. Over 4000 buildings and other structures in Japan are now officially designated for use as vertical evacuation refuges (Yomiuri Shimbun, 2012).
Life-Saving Tower: The Life-Saving Tower (Tasukaru Tower) developed by Fujiwara Industries Company, Limited, Japan, is shown in Figure A-2. This is a simple and economical structure that enables a temporary high refuge for evacuees. The structure has a 5.4-meter span between the supporting posts, a refuge elevation of 5.8 meters from ground level, and a capacity of 50 people.
FEMA P-646 A: Vertical Evacuation Structure Examples from Japan 113

Figure A-1 Successful designated vertical evacuation building in Kesennuma Port, Japan.
Figure A-2 Life-Saving Tower
114 A: Vertical Evacuation Structure Examples from Japan FEMA P-646
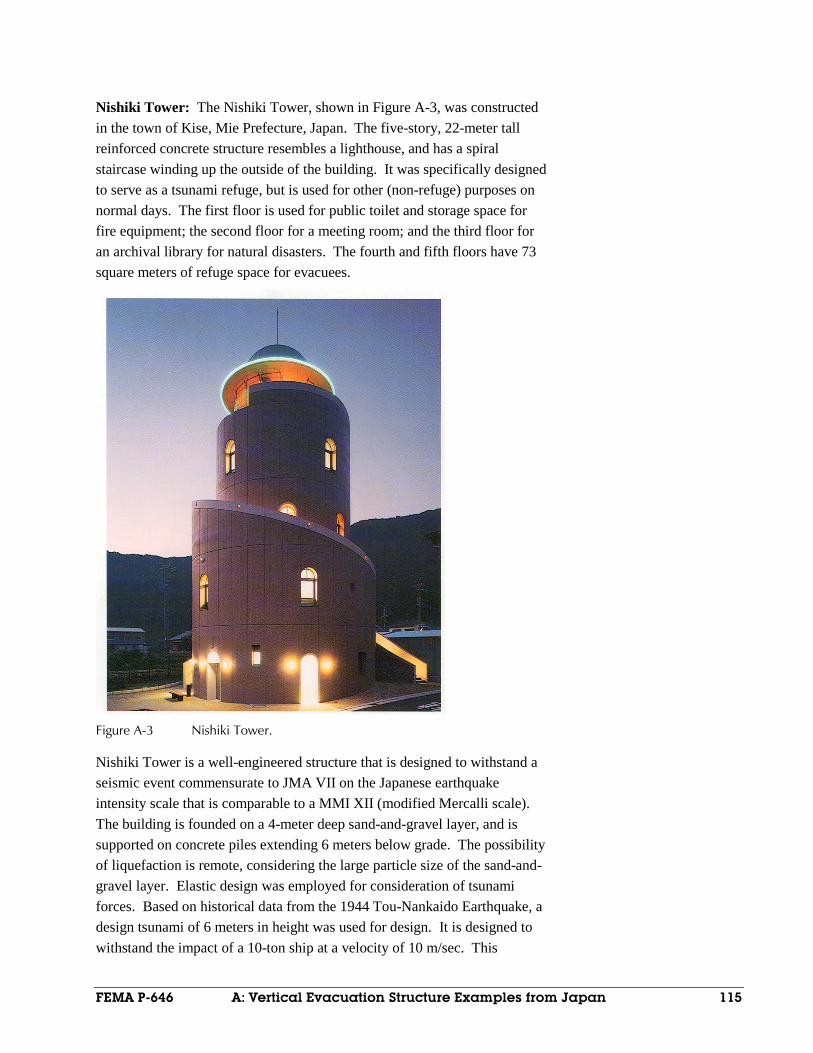
Nishiki Tower: The Nishiki Tower, shown in Figure A-3, was constructed in the town of Kise, Mie Prefecture, Japan. The five-story, 22-meter tall reinforced concrete structure resembles a lighthouse, and has a spiral staircase winding up the outside of the building. It was specifically designed to serve as a tsunami refuge, but is used for other (non-refuge) purposes on normal days. The first floor is used for public toilet and storage space for fire equipment; the second floor for a meeting room; and the third floor for an archival library for natural disasters. The fourth and fifth floors have 73 square meters of refuge space for evacuees.
Figure A-3 Nishiki Tower.
Nishiki Tower is a well-engineered structure that is designed to withstand a seismic event commensurate to JMA VII on the Japanese earthquake intensity scale that is comparable to a MMI XII (modified Mercalli scale). The building is founded on a 4-meter deep sand-and-gravel layer, and is supported on concrete piles extending 6 meters below grade. The possibility of liquefaction is remote, considering the large particle size of the sand-and-gravel layer. Elastic design was employed for consideration of tsunami forces. Based on historical data from the 1944 Tou-Nankaido Earthquake, a design tsunami of 6 meters in height was used for design. It is designed to withstand the impact of a 10-ton ship at a velocity of 10 m/sec. This
FEMA P-646 A: Vertical Evacuation Structure Examples from Japan 115

criterion was based on size of ships moored in the neighboring port. The intended performance level allows for partial damage of the building without incurring loss of life.
Elevated Shelter at Shirahama Beach Resort: A rather aesthetic tsunami refuge was constructed at a beach resort in the town of Shirahama, Tokushima Prefecture, shown in Figure A-4. It is designed to accommodate 700 refugees in the area of 700 square meters. The design inundation elevation is 7.5 meters, based on historical data from the 1854 Ansei-Tokai Earthquake (M 8.4) and resulting tsunami. With a planned freeboard of 4 meters, the evacuation platform is located at elevation of 11.5 meters. This reinforced concrete structure is designed to withstand a maximum base acceleration of 780 gal. Because of a potential for soil liquefaction, pipe piles were driven approximately 20 meters deep into bedrock. The facility is also equipped with a solar-powered lighting system.
Figure A-4 Refuge at Shirahama Beach Resort (photo courtesy of N. Shuto).
Other Tsunami Refuge Structures: There are other structures in Japan specifically designed as tsunami refuges. A reinforced concrete structure in the town of Kaifu, Tokushima Prefecture, Japan is shown in Figure A-5. An artificial high ground (berm), shown in Figure A-6, was constructed in Aonae, Okushiri-Island, Japan, where the 1993 tsunami struck the hardest. After the 1993 Okushiri Tsunami, Aonae elementary school, shown in Figure A-7, was reconstructed as a tsunami resistant structure. The upper floor can
116 A: Vertical Evacuation Structure Examples from Japan FEMA P-646

be used as a tsunami refuge space. The ground floor of the school is constructed with breakaway walls to relieve tsunami forces.
Figure A-5 Tsunami refuge in Kaifu, Japan.
Figure A-6 Berm constructed for tsunami refuge in Aonae, Japan.
FEMA P-646 A: Vertical Evacuation Structure Examples from Japan 117

Figure A-7 Aonae Elementary School. Upper floor is intended for use as tsunami refuge
space.
118 A: Vertical Evacuation Structure Examples from Japan FEMA P-646

Appendix B
Community Design Example
A hypothetical community is indicated in Figure B-1 below. In this appendix, the initial design and configuration of a series of vertical evacuation structures is illustrated.
The community has evaluated public and private sites that might be appropriate for construction of new vertical evacuation structures and identified existing facilities for possible renovation for use as vertical evacuation structures. This evaluation includes consideration of the number of sites required based on travel time and population, as discussed in Chapter 5.
Figure B-1 Hypothetical sketch of example community showing potential
vertical evacuation structure sites and evacuation routes.
FEMA P-646 B: Community Design Example 119

An assessment of the tsunami inundation depths and flow velocities is necessary for assessing tsunami effects within the community and determining tsunami design parameters. Predicted tsunami inundation depths for this example community are shown in Figure B-2.
Figure B-2 Example community inundation map. Shaded areas show various predicted tsunami inundation depth, d.
In this example community, the area of refuge at each site would need to be elevated as indicated in Table B-1.
Table B-1 Design Elevations for Areas of Refuge
Site
Predicted Inundation Depth
Freeboard (3 meters plus 30%)
Design Elevation
Site 1 3 m 3 m + 0.9 m 6.9 m
Site 2 4 m 3 m + 1.2 m 8.2 m
Site 3 3 m 3 m + 0.9 m 6.9 m
Site 4 4 m 3 m + 1.2 m 8.2 m
Site 5 3 m 3 m + 0.9 m 6.9 m
Tsunami inundation depths indicated in Figure B-2 are increased by 30% to account for local variability in numerical simulations. An additional minimum freeboard of 3 meters (or one-story height) is recommended to ensure that the area of refuge is not inundated from splash or wave action.
120 B: Community Design Example FEMA P-646

The velocity at a particular site is affected by the surrounding topography as well as natural and man-made obstructions to flow. Predicted flow velocities for this example community are shown in Figure B-3 and summarized in Table B-2.
Figure B-3 Example community inundation flow velocity map. Shaded
areas show various predicted tsunami flow velocities, u.
Table B-2 Tsunami Flow Velocity at Each Site
Site Tsunami Flow Velocity
Site 1 9 m/s
Site 2 12 m/s
Site 3 9 m/s
Site 4 12 m/s
Site 5 9 m/s
B.1 Site 1 Example: Escape Berm
Site 1 has several unique conditions to consider. The waterfront in this area is somewhat industrial in nature and includes a container terminal facility at the harbor. Areas adjacent to the site contain some residential development. The evacuation population at this site would include both employees of the harbor industrial area and adjacent residences.
FEMA P-646 B: Community Design Example 121

The community has been struggling with finding ways to address other social issues in this area, which have included a lack of recreational facilities for the residents, some neglected and deteriorating properties, and a need to revitalize and enhance the area. At this site a man-made berm, as shown in Figure B-4, provides an opportunity to add new public open space in addition to vertical evacuation refuge. This solution creates a unique elevated park setting for the community, which addresses recreational needs, and provides a scenic overlook for the waterfront.
With a location adjacent to a container terminal facility, there is a potential for shipping containers to become waterborne debris. Construction of the berm utilizing a sheet piles to contain the fill addresses this issue.
Figure B-4 Example escape berm design.
The features of this escape berm, illustrated in Figure B-5, include the following:
• Location 1 (Figure B-5). The semicircular configuration was selected to help divert tsunami flood waters and potential waterborne debris around the facility and away from the access stairs and ramp. The elevated area is over 31,000 square feet, and can handle over 3,000 evacuees at 10 square feet per person. There is sufficient space in the elevated area to accommodate a comfort station that could be used for both day to day recreational purposes and emergency use.
122 B: Community Design Example FEMA P-646

Figure B-5 Example escape berm plan layout.
• Location 2 (Figure B-5). The ocean facing side of the berm is essentially vertical to prevent tsunami flood waters and potential floating debris from moving upslope into the area of refuge. Trees and other landscaping can be used to hide the vertical face and create an aesthetically appealing feature.
• Location 3 (Figure B-5). The sides of the berm can be sloped to provide additional access to the area of vertical refuge. Care should be taken to orientate the slope so that water and debris are not inadvertently channeled upslope.
• Locations 4 and 5 (Figure B-5). Stairs and ramps provide primary access for both recreational and emergency purposes.
Additional considerations are illustrated in Figures B-6 and B-7 and described below.
Figure B-6 Example escape berm section.
FEMA P-646 B: Community Design Example 123

Figure B-7 Example escape berm rear elevation.
• Location 1 (Figure B-6). Where the elevated area is adjacent to a steep drop off, guard rails or walls of appropriate size and height should be provided for fall protection. Using a solid wall for the guardrail will have the added benefit of providing additional protection from tsunami runup or splash onto the area of refuge. Walls can be configured to divert splash away from the wall.
• Location 2 (Figure B-6). Materials used to help create the berm will need to be constructed deep enough below existing grade to ensure that retaining system is not undermined by scour around the perimeter of the berm.
• Location 3 (Figure B-7). With sufficient length, both ADA compliant ramps and stairs can be provided. This will address both the day to day recreational use of the facility as well as emergency evacuation needs. Sloped surfaces on the sides of the berm can be used to provide additional access, and can also help channel floating debris away from the base of the ramps and stairs to minimize the risk of blockage.
B.2 Site 2 Example: Multi-Use Structure
Site 2 is situated on property managed by the school district. The site is located adjacent to an existing school and the surrounding area contains a combination of residential and business use. The existing school is located well within the inundation zone. The waterfront in this area includes an on-grade parking lot that services businesses in the area, and a nearby oceanfront park. The evacuation population at this site would include children attending the school, neighbors in the adjacent residences, employees of nearby businesses, and nearby users of the oceanfront park.
The school district has had an ongoing need for a covered gymnasium. At this site, the community has decided to incorporate the roof of the proposed gymnasium into its emergency planning. It is decided that this new structure will be designed to meet the requirements for a vertical evacuation structure
124 B: Community Design Example FEMA P-646

to serve two important community needs. The structure is illustrated in Figure B-8.
Located adjacent to an on-grade parking lot, the structure will need to be designed for potential impacts from floating vehicles. If the community is located in a climate that requires the gymnasium to be enclosed, special attention should be paid to the design of the exterior wall system. Walls should be detailed as breakaway walls to minimize tsunami loading on the overall structure. Otherwise the structure will need to be designed to for the corresponding increased hydrostatic, hydrodynamic, and impulse loads.
As a school facility, the building must also be designed to address typical health and safety requirements for school facilities in normal use (when not serving as a vertical evacuation refuge).
Figure B-8 Example gymnasium.
Features of this multi-use structure, illustrated in Figure B-9 and Figure B-10, include the following:
• Location 1 (Figure B-9). The rectangular layout is selected based on the gymnasium requirements for the school. The elevated area is over 10,000 square feet in size, and can handle over 1,000 evacuees at 10 square feet per person. Using available census information, it has been determined that this should be sufficient for the surrounding area this facility is intended to serve.
FEMA P-646 B: Community Design Example 125
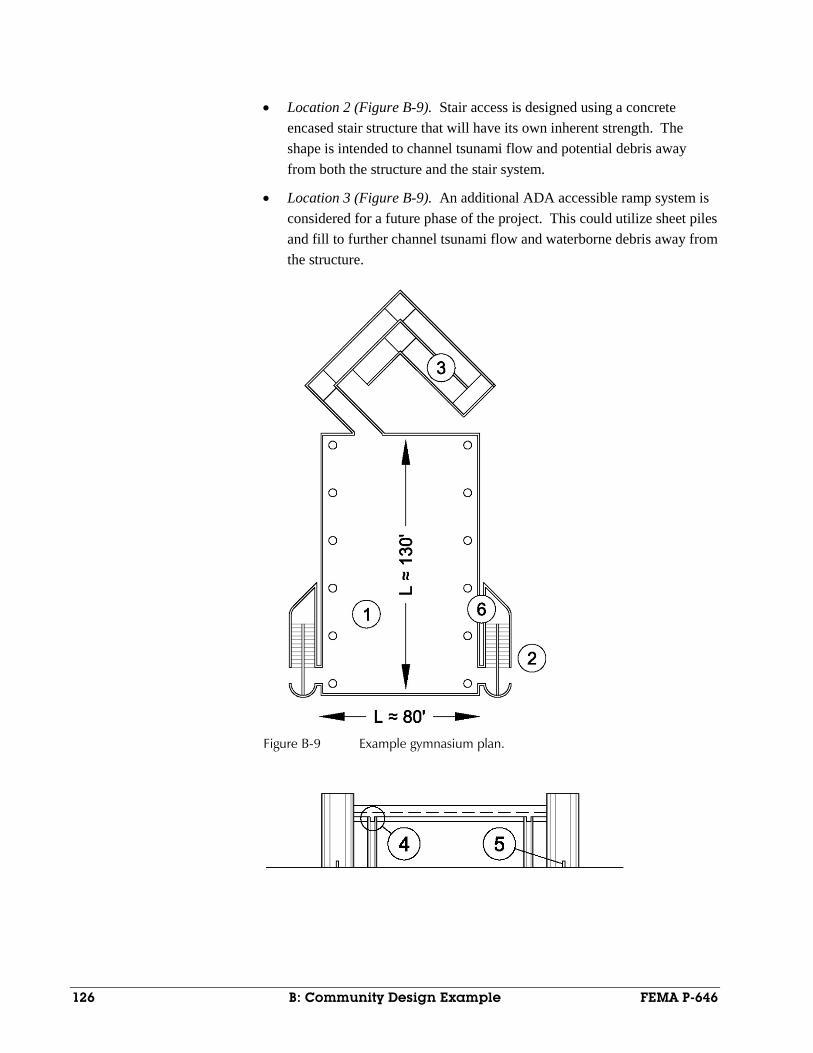
• Location 2 (Figure B-9). Stair access is designed using a concrete encased stair structure that will have its own inherent strength. The shape is intended to channel tsunami flow and potential debris away from both the structure and the stair system.
• Location 3 (Figure B-9). An additional ADA accessible ramp system is considered for a future phase of the project. This could utilize sheet piles and fill to further channel tsunami flow and waterborne debris away from the structure.
Figure B-9 Example gymnasium plan.
Figure B-10 Example gymnasium elevation.
126 B: Community Design Example FEMA P-646

• Location 4 (Figure B-10). The structural system utilizes a concrete moment frame to create an open lower level that will keep hydrodynamic loads on the structure to a minimum. This includes using circular shaped columns.
• Location 5 (Figure B-10). Additional strength can be provided in the system by using walls that parallel the anticipated direction of the tsunami inundation flow.
• Location 6 (Figure B-9). The stairs structures can be integrated with the primary structure to provide additional strength, or they can be made structurally independent.
FEMA P-646 B: Community Design Example 127


Appendix C
Example Calculations
A rectangular-shaped tsunami evacuation structure, 10 m wide, is constructed at a site 200 m from the shoreline, where the elevation is 4 m from the sea level. The local beach slope is 1/50 and there is no significant alongshore variation in the topography. The tsunami inundation map indicates the elevation R* = 10 m at the maximum inundation point (runup height of 10 m at the location 500 m from the shoreline). A log (8.53 m long, 0.35 m in diameter, and 450 kg mass) is considered as the design waterborne missile for the impact loading. In addition, the impact loading of a 40-ft shipping container (40 ft L x 8 ft W x 8-1/2 ft H, or 12.2 m x 2.44 m x 2.59 m) is estimated. A definition sketch for these example calculations is provided in Figure C-1.
Figure C-1 Definition sketch for example calculations: R* is the maximum runup elevation (the maximum inundation distance is 500 m) and z is the elevation at the location of the tsunami evacuation structure (located 200 m from the shoreline). Two horizontal lines represent the initial water level and the maximum inundation level, respectively.
If a reliable and accurate tsunami inundation numerical model satisfying the criteria in Chapter 3 has been used to estimate flow depth and velocity at the building location, then the numerical data should be used for the force evaluations. At a site of interest, the following parameters should be extracted from the numerical simulation: the maximum inundation depth hmax, the maximum flow speed of the depth greater than the debris draft umax, and the maximum value of the product, (hu)2
max. The local effects of the tsunami flows are difficult to predict due to nonlinear interactions of three-dimensional flows. It is recommended that the design inundation elevation be increased at the building site by 30% over the computed inundation elevation, that the design flow velocity be increased by 15%, and that the
R* = 10 m
z = 4 mdatum
FEMA P-646 C: Example Calculations 129

momentum flux (hu2) be increased by 70% over the computed values for conservatism. These safety factors are simply a guideline based on the 30% error band in modeled tsunami runup heights compared with observed runup heights from past tsunami survey data. In practice, the safety factors should be determined based on the confidence in accuracy of the numerical simulations. Once the design flow parameters are determined, then the forces can be calculated using the methods described below.
The following calculations are for situations where no detailed numerical simulation data are available. In such cases, it is assumed that the only information available at a site of interest is an inundation map, and the forces are intended to be conservatively estimated.
C.1 Inundation Depth
The recommended design runup height, R, is 30% greater than the predicted maximum runup elevation, R*, to account for local amplification and uncertainty in the predicted value, i.e., R = 1.3 R* = 13 m. Therefore, the design inundation depth at the structure is 13 – 4 = 9 m. A minimum freeboard of 3 m (10 ft) or one story height is recommended. If the typical floor height is 4 m, the refuge area must be located higher than 9 + 4 = 13 m above the ground level. This would imply that the refuge area should be located on the 4th floor or higher. Note that when numerical simulation data are available, the inundation depth at the site can be obtained directly. However, it is still recommended that a 30% safety factor be applied to the computed inundation elevation at the site.
C.2 Hydrostatic and Buoyant Forces
It is recommended that all nonstructural walls at the lower levels of the building be designed as breakaway walls. In that case, the hydrostatic forces and potential uplift of the overall building are significantly reduced. However, if the structure, or any portion of the structure, is constructed watertight at the lower levels, then the wall panels must be designed for the anticipated hydrostatic pressure. The maximum force acting on a wall panel of 4 m wide and 3 m tall on the ground floor can be computed using Equation 6-2. Since the wall panel on the ground floor is fully submerged:
( )( ) ( )( )
ρ
= × − + −
=
= − + ∆ −
3 2 3m1100 kg m 9.81m sec 1.3 10m (4m 0.5m) 3m 4m2
906 kN
( )2W
h s WhF g R z z h b
130 C: Example Calculations FEMA P-646

or an average lateral pressure of
2906 kN/12 m 75.5 kPahP = =
where ∆z is the height at the toe of the wall panel from the ground level, assumed to be 0.5 m. Note that the fluid density ρ = 1.1 ρwater is used assuming a mixture of seawater and sediment.
With the water level at 9 m at the building location, the first and second floors will be submerged. Assuming the nonstructural walls have broken away at these two levels, but not yet at the third level, then the uplift due to buoyancy acting on the third floor should be evaluated. Assuming plan dimensions of 5 m by 5 m for a typical floor panel on the third floor, and a floor elevation of 7 m above the ground level, as shown in Figure C-2, then the upward buoyant force can be computed using Equation 6-4:
ρ=
= × × − −=
3 2 (1100 kg/m )(9.81m/sec )(5 m 5 m)((1.3 10 m 4 m) 7 m) 540 kN
b s f bF gA h
or an upward pressure of
2540 kN/25m 21.6 kPahP = =
where hb is the water height displaced by the floor including the effect of air trapped below the floor, as shown in Figure C-2.
Figure C-2 Condition resulting in buoyant forces.
7m
9m
2m
5m
FEMA P-646 C: Example Calculations 131

C.3 Hydrodynamic and Impulsive Forces
Hydrodynamic drag and impulse forces are exerted on the building as a whole, assuming no breakaway walls at the lower levels. The maximum value of h u2 at the site can be computed using Equation 6-6, with z = 4 m, R = 13 m and g = 9.81 m/sec2:
( ) = − + =
22 2 3 2
max0.125 0.235 0.11 105 m secz zhu g R
R R
Hence, from Equation 6-5 the fluid force is:
ρ=
=
=
2max
3 3 2
1 ( )21 (1100 kg/m )(2.0)(10 m)(105 m /sec )2
1155 kN
d s dF C hu
where B = 10 m (shelter width), and Cd = 2.0. If the worst-case tsunami arrives at a previously flooded site, then the tsunami front may form a bore. The impulsive force for this condition would be 1.5 times the hydrodynamic force, as in Equation 6-7:
== 1730 kN1.5s dF F
If the nonstructural walls at the lower level are designed to break away during a tsunami, then the hydrodynamic drag and impulse forces would be computed for all individual structural members (e.g., columns, shear walls) and combined as shown in Figure 6-12.
C.4 Impact Force
The maximum flow velocity at the site can be estimated using R = 13 m in Equation 6-9:
= −
= − =
max 2 1
4m2 (13 m) 1 13.3 m sec.13m
zu g RR
g
Note that this flow velocity is at the leading tongue of the flow where the flow depth is nil. Hence, this value of approximately 48 km/hr (30 mph) will be conservative. Using this conservative velocity estimate, the impact force due to a floating log can be computed by Equation 6-8, with c= 0, k = 2.4 x
106 N /m, and m = 450 kg:
132 C: Example Calculations FEMA P-646

max1.3 (1 )i dF u km c= +
6 1.3(13.3 m/sec) (2.4 10 N/m)(450 kg)(1 0)= × +
568 kN=
This force would be applied locally at the assumed point of impact.
If the assumed draft, d, of the log is 0.25m, then the velocity is evaluated using Figure 6-9. Using the ratios ζ = z/R = 0.31, and the flow depth, d/R = 0.019, at the location of the site:
=max 0.532u
g R
( )( )= =max 0.53 2 9.81 13 8.5 secu m
The impact force is then:
)1(3.1 max ckmuF di +=
6 1.3(8.5 m/sec) (2.4 10 N/m)(450 kg)(1 0)= × +
363 kN=
which is more realistic than the previous estimate (568 kN). The total force on the structure at the time of the impact can be determined conservatively by combining this impact force with the hydrodynamic drag force determined earlier:
363 1155 1518 kNi dF F+ = + =
To compute the impact force due to a floating shipping container, the draft, d, must be estimated:
d
s h
m gdgAρ
=
3
(3800 kg) 0.116 m(1100 kg/m ) (12.2 m 2.44 m)
gg
= =×
where md is the weight (Table 6-1) and Ah is the cross sectional area of the box in the horizontal plane, and the constant g cancels out. Considering the configuration of the support frame at the bottom of the container and the large horizontal dimension, the container is assumed to float freely at d = 0.5 m. The maximum flow velocity that supports a draft, d = 0.5 m, can be found from Figure 6-9. At the location of the site, ζ = z/R = 0.31, and the flow
FEMA P-646 C: Example Calculations 133

depth, d/R = 0.039. Figure 6-9 shows υ = 0.31. Hence, the maximum velocity is:
max 0.31 2 5.0 m/secu gR= =
Note that Figure 6-9 is only valid near the leading tip of the runup, therefore, use of a numerical model to estimate inundation flow depth and velocity is encouraged for large and heavy debris objects.
With a debris velocity of 5 m/s at impact, the impact force due to a longitudinal strike by the shipping container is computed by Equation 6-8 with c = 0.2, k = 60 x 106 N /m, and md = 3800 kg (Table 6-1):
max1.3 (1 )i dF u km c= +
6 1.3(5.0 m/sec) (60 10 N/m)(3800 kg)(1 0.2)= × +
3400 kN=
The impact force due to a transverse strike by the shipping container is computed by Equation 6-8 with c = 1.0, k = 30 x 106 N /m, and md = 3800 kg (Table 6-1):
max1.3 (1 )i dF u km c= +
6 1.3(5.0 m/sec) (30 10 N/m)(3800 kg)(1 1)= × +
3100 kN=
These are large forces compared with the hydrodynamic drag determined earlier. They represent a conservative assumption that the container is traveling at high velocity and applies a direct strike to the building. Unless the site is located adjacent to a container storage yard, this is a low probability event. The incorporation of progressive collapse prevention in the building design is intended to protect against failure of an exterior column or wall element due to this low probability impact.
C.5 Damming Effect of Waterborne Debris
The damming effect of debris can be computed using Equation 6-11, which is readily obtained from the hydrodynamic force computed earlier, substituting the recommended debris dam width of 12 m (40 ft):
12 m(1155 kN) 1386 kN10 mdmF = × =
If the building were wider than 12 m, then the damming effect should be considered at various locations as shown in Figure 6-13 to determine the
134 C: Example Calculations FEMA P-646

worst condition for loading on the structure as a whole, and on individual structural elements.
C.6 Hydrodynamic Uplift Forces
The hydrodynamic uplift force can be computed using Equation 6-14. Assuming that the water depth at the soffit of the second floor is hs = 3 m, and at the location of the shelter site, ζ = z/R = 0.31, and the flow depth, d/R = hs/R = 0.23, Figure 6-9 shows υ along the limit curve at ζ = 0.31. Hence, the maximum velocity is:
= =0.15 2 2.4m sec.Ru g
The vertical velocity can be computed using Equation 6-16, assuming the slope at the site is 1/20:
( )( )α = == 2.4 1 20 0.12 m sectanvu u
Hence, the hydrodynamic uplift force given by Equation (6-14) is:
( )( )( )( )
ρ=
= ×
=
2
23
121 3 1100 kg m 5m 5m 0.12m sec2594 N
u u s f vF C A u
which is insignificant for the beach slope assumed in this example. If a beach slope of 1/5 is assumed, the hydrodynamic uplift force increases to 9.5 kN or an uplift pressure of 0.38 kPa on the bottom of the floor slab.
FEMA P-646 C: Example Calculations 135


Appendix D
Background Information on Impact Load Calculations
D.1 Available Models for Impact Loads
The impact force from waterborne debris (e.g., floating driftwood, lumber, boats, shipping containers, automobiles, and other buildings) can be a cause of structural damage or even building destruction. Unfortunately, it is difficult to estimate this force accurately. Unlike the other forces, the impact force occurs locally at the point of contact when the debris is smaller than the building. Impact forces can be assumed to act at or near the water surface level when the debris strikes the building. Most available models are based on the impulse-momentum concept, in which the impulse of the resultant force acting for an infinitesimal time is equal to the change in linear momentum:
( )τ
τ= = →∫0; 0I F dt d mu (D-1)
where:
I = impulse
F = resultant force
m = mass of waterborne debris
u = velocity of the debris
t = time
For actual computations, a small but finite time, ∆t (not infinitesimal), and the average change in momentum are used as an approximation. There is significant uncertainty in evaluating the duration of impact, ∆t. The following are available formulae for debris-impact force estimation.
Matsutomi (1999). Matsutomi experimentally investigated the impulse forces of driftwood. He performed two sets of experiments: one in a small water tank and the other for full-scale impact in air. In his small water tank, a bore and a surge were generated (a bore is a moving hydraulic jump onto a quiescent shallower water in front of it, while a surge is a moving water body onto a dry bed). A scaled-down driftwood model was placed 2.5 m upstream from the receiving wall. The model driftwood was picked up by the generated bore (or surge) and impacted onto the receiving vertical wall. His
FEMA P-646 D: Background Information on Impact Load Calculations 137

full-scale impact experiments were conducted to compensate for potential scale effects in his small-scale experiments. A full-scale log was tied at the end of a pendulum and was swung against a stationary stop equipped with a load cell. It is noted that this impact condition in the air may significantly differ from an actual waterborne case because of the absence of the added mass effect of water: prior to the impact, the waterborne debris is carried by the surrounding water flow and the momentum of the water may increase or decrease the impact force. Matsutomi then compensated for the added mass effect with the data obtained from the small-scale water tank experiments. Based on a regression analysis of the large amount of data, Matsutomi proposed Equation D-2 for the impact force, F:
σ
γγ
=
1.2 0.4
2 1.6 fM
ww
F uCLD L g D
(D-2)
where:
γw = the specific weight of the log,
D and L = the diameter and the length of the log, respectively,
CM = 1 + Ca, is an inertia coefficient,
Ca is the added mass coefficient based on the displaced fluid volume,
u = the velocity of the log at impact, and
σf = the yield stress of the wood.
Matsutomi recommended σf = 20 × 106 Pa for a wet log. The equation applies when driftwood collides at almost right angles with “rigid” structures such as reinforced concrete buildings.
From small-scale experimental data, he recommended a value of CM ≈ 1.7 for driftwood located at the tip of the inundation flow or strong bore condition, and CM ≈ 1.9 for a steady flow or if the log is located behind the tip of the inundation flow or strong bore. Note that the recommended values of CM are the upper limit when more than 60% of the receiving wall is open and permeable. The value of CM is smaller when the receiving wall does not allow the flow to pass through. For a solid (impermeable) receiving wall, Matsutomi found that CM = 0.5 for a bore and CM = 1.1 for a surging flow. Note that in the case of a bore striking an impermeable wall (i.e., no flow-through), CM is less than unity (= 0.5). This is because the flow reflection at the wall actually reduces the impact force.
138 D: Background Information on Impact Load Calculations FEMA P-646

In spite of a thorough study with a large amount of laboratory data, the derived form of Equation D-2 is inconvenient due to the particular choice of the scaling parameters, and it is only applicable to driftwood or logs.
Ikeno et al. (2001, 2003). Laboratory experiments similar to Matsutomi (1999) were performed to examine the impact forces of objects other than driftwood or logs. They used cylindrical, square column, and spherically-shaped drift bodies. Note that unlike Matsutomi’s experiments, Ikeno et al. only examined the impact onto an impermeable vertical wall. The following empirical formula was derived based on small-scale experiments (approximately 1/100 model):
=
2.5
MF uSC
g m g D L (D-3)
where:
S = a constant (equal to 20 for a bore case),
CM = 1 + Ca is the inertia coefficient
Ca is the added mass coefficient based on the displaced fluid volume
m = the mass of the drift body.
CM = 0.5 was used regardless of the shape of the objects for a bore impact onto an impermeable wall, which was adopted from Matsutomi’s results. For a dry-bed surge, Ikeno and Tanaka (2003) suggested S = 5 and CM = 0.8 for spherical-shaped objects and CM = 1.5 ~ 2.0 for cylinders and square-shaped columns. The results by Ikeno et al. are valid only for the condition of an impermeable wall (i.e., the entire incident flow reflects back to the offshore direction). This is why the inertia coefficient has a value less than unity.
Haehnel and Daly (2002). At the U.S. Army Cold Regions Research and Engineering Laboratory (CRREL), Haehnel and Daly performed experiments similar to Matsutomi (1999). They considered reduced-scale logs in steady flow in a small flume, and prototype logs in a large towing basin. It must be noted that the condition in the towing basin differs from the actual impact condition of a waterborne object. In the towing basin the water is stationary while in the actual condition moving water carries the debris. Instead of the impulse-momentum approach, Haehnel and Daly analyzed the data using linear dynamic analysis with one degree of freedom. Since the collision occurs over a short duration, damping effects are neglected. Assuming the overall structural system has a period much greater than the impact duration, approximating a rigid structure, the model can be formulated by Equation D-4:
FEMA P-646 D: Background Information on Impact Load Calculations 139

m x + k x = 0 (D-4) where:
m = the mass of the log,
x = the summation of the compression of the building and the log during impact and rebound, with the dot denoting the time derivative, and
k = the effective stiffness associated with both the log and the building.
The effective stiffness of the collision is 1/k =1/ks + 1/kd where ks is the local stiffness of the structure at the impact zone; and kd is the stiffness of the debris, and other nonstructural elements deformed at impact. The structure will be rigid if the structure stiffness is much greater than the stiffness of the target zone nonstructural elements or the debris. The structure will also act as if it is rigid if the mass of the structure is so great that it does not move appreciably in response to the impact.
Solving Equation D-4 yields the maximum force given by Equation D-5:
( )= =MaxmaxF kx u k m (D-5)
where: u is the impact velocity.
Based on their laboratory experiments, the effective stiffness k between a log and a rigid building was estimated to be 2.4 × 10⁶ N/m.
Haehnel and Daly demonstrated that the impulse-momentum approach could be reduced to the constant-stiffness approach shown in Equation D-5 by
setting π∆ =
2mtk
(note that, to be consistent to Equation D-4, the force is
considered a sinusoidal function in time). The work-energy approach can also be made equivalent to Equation D-5 by setting the stopping distance as
=mS uk
. The work-energy approach is an impact force estimation that
equates the work done on the building with available kinetic energy of the floating debris object. Based on their laboratory data, the following formulae were suggested by Haehnel and Daly:
Constant-stiffness approach:
( )= = ≈Max 1550maxF kx u k m u m (D-6)
Impulse-momentum approach:
140 D: Background Information on Impact Load Calculations FEMA P-646

π= ≈
∆90.9
2maxu mF um
t (D-7)
Equivalent to ∆t = 0.0173 sec.
Work-energy approach:
= ≈ +∆
22125 8000max
u mF mux
(D-8)
Note that in Equations D-6, D-7, and D-8, the velocity, u, is in m/sec and the mass, m, is in kg. It is emphasized that errors associated with the use of a towing tank (instead of the realistic condition of a log being carried with flow) may be significant in the results by Haehnel and Daly (2002), since the added mass effect of water flowing with the debris is not included. To include the added mass effect that opposes the direction of acceleration, the single degree of freedom equation of motion D-4 above (Equation D-4) would be modified to:
amx kx m x+ = −
and therefore,
( ) 0am m x kx+ + = (D-9)
where ma is the hydrodynamic mass given by;
(displaced volume)a dispm cm cρ= = where c is the hydrodynamic mass coefficient.
Note that this application of hydrodynamic mass to the solution of the structural dynamics equation of debris impacts in water no longer represents the traditional added-mass term derived from potential flow hydrodynamics. However, both are similar transitory impulsive effects and are more related to the shape and orientation of the body than a property of its true mass. To avoid confusion, the term “hydrodynamic mass” is used in Equation D-9 instead of the term “added mass.”
Solving Equation D-9 yields the maximum force given by Equation D-10:
max ( ) (1 )aF u k m m u km c= + = + (D-10)
SEI/ASCE Standard 7-10 (ASCE, 2010). ASCE gives the following modified design formula based on Equation D-1:
π=
∆2I O D B maxmuC C C C RF
t (D-11)
where:
FEMA P-646 D: Background Information on Impact Load Calculations 141

m = the water-borne-debris mass,
u = the impact velocity of the debris,
CI = the importance coefficient,
CO = the orientation coefficient, (statistically based)
CD = the depth coefficient,
CB = the blockage coefficient,
Rmax = the maximum response ratio for impulsive load, and
∆t = the impact duration.
The C coefficients are based on results of laboratory testing and on engineering judgment. Rmax is a coefficient to compensate for the effect of the degree of flexibility of the building. A single value of the impact duration, ∆t = 0.03 sec, is recommended (Kriebel, et al, 2000), although there is wide variation in the impact duration owing to, for example, the object material and deformability, the flow blockage condition, and the flexibility of the building element being struck. It is worth noting that the City and County of Honolulu Building Code (CCH, 2000) recommends ∆t values for wood construction as 1.0 sec, steel construction as 0.5 sec, and reinforced concrete as 0.1 sec; these values are unsubstantiated. Furthermore, the FEMA 55 Coastal Construction Manual (FEMA, 2005) provides ∆t values shown in Figure D-1. Such an excessive variation in ∆t could make Equation D-11 unreliable if used with various prescriptive impact duration values. Improved results may result with explicit calculation of the duration per
π∆ =
2m
tk
.
Figure D-1 Ranges of duration of impact (FEMA, 2005).
D.2 Summary and Discussion
Review of previous work clearly demonstrates the uncertainty of the present understanding of waterborne debris-impact forces. The form of Equation D-11 exhibits a struggle to obtain an engineering estimate of the forces by
142 D: Background Information on Impact Load Calculations FEMA P-646

adjusting five coefficients based on engineering judgment, together with a single estimate for ∆t. All of the prediction formulae are based on small-scale laboratory data by compensating with the full-scale measurements in compromised conditions. For example, Matsutomi’s full-scale data were obtained by the impact study in air, and Haehnel and Daly’s data were obtained in a towing tank. Since the added mass effect appears important at the impact (the impact halts not only the waterborne debris itself but also decelerates a portion of the water caused to flow around it), the results derived from the compromised experimental conditions may contain significant errors.
Even if the impact velocity, u, and the debris mass, m, were given, each formula yields a different functional relation to predict the forces, which indicates complexity and uncertainty inherent in the problem. For each of the available methods, proportionality between the impact force, debris velocity and mass are:
Constant-stiffness approach ⇒ ∝F u m , Impulse-momentum approach ⇒ ∝F um ,
Work-energy approach ⇒ ∝ 2F u m , (D-12)
Ikeno and Tanaka (2003) ⇒ ∝ 2.5 nF u m , n ≈ 0.58, and
Matsutomi (1999) ⇒ ∝ 1.2 nF u m , n ≈ 0.66.
Although Equation D-2 by Matsutomi is based on his substantial analyses of a large set of laboratory data, the form of Equation D-2 is physically ambiguous in terms of the choice of the scaling parameters, is limited only to cylindrical shaped debris, and is inconvenient for use in actual practice. The empirical Equation D-3 by Ikeno et al. is based on their small-scale laboratory experiments with an impermeable wall; hence, its extrapolation is unreliable for most real-world applications. Proper estimates of ∆t and ∆x are uncertain for the impulse-momentum and work-energy approaches, respectively. The value of the effective constant stiffness, k, should be evaluated when using Haehnel and Daly’s Equation D-5. In reality, k is not constant; it is likely a function of x during the impact.
Until more comprehensive studies can be made, an effective stiffness approach given in Equation D-10, based on Haehnel and Daly, is recommended because of its simple but rational formulation. In addition, as shown in the foregoing comparisons in Equations D-12, the functional relation of m and u to the force F is similar to Matsutomi’s empirical Equation D-2, which was derived based on a very large amount of experimental data. Considering that Matsutomi’s empirical treatment was
FEMA P-646 D: Background Information on Impact Load Calculations 143
based on the impulse-momentum approach, the coincidental similarity with the constant-stiffness approach provides additional confidence in the formulation. With the introduction of the hydrodynamic mass parameter, c, the hydrodynamic mass effect is already included in Equation D-10. Applying an importance factor of 1.3 per ASCE 7-10 for critical facilities results in the recommended impact expression as shown in Equation D-13:
max1.3 (1 )i dF u km c= + (D-13)
In this expression, k must be determined along the direction of the impact based on the modeled debris (e.g., as mentioned earlier, k = 2.4 × 10⁶ N/m was recommended for a log by Haehnel and Daly). Note that a proper estimate of k is the key for this method. In reality, k may not be the elastic stiffness; it is likely a function of x during inelastic impacts of structural significance. Hence, the linearized equation D-4 may be inadequate. Engineering judgment and iterative analysis may be necessary to determine the most appropriate secant stiffness to be used for a particular magnitude of impact. The values for k suggested in Table 6-1 for shipping containers were developed based on computer models of standard containers (Peterson and Naito, 2012). An added advantage for the use of Equation D-13 is that k is not as sensitive as ∆x in the work-energy approaches, which can be shown
from the fact that ∆x is proportional to 1k , as discussed earlier.
The hydrodynamic mass coefficient, c, is due to the fact that the decelerating body must also momentarily decelerate or disturb some volume of the surrounding fluid flow. It depends greatly on the size, shape, and orientation of the object with respect to the surge direction. Estimated values for c are provided in Table 6-1 for the various debris strike conditions considered.
144 D: Background Information on Impact Load Calculations FEMA P-646
Appendix E
Maximum Flow Velocity and Momentum Flux in the
Tsunami Runup Zone
E.1 Flow Velocity
For prediction of flow velocities and depths at a site of interest for a given design tsunami, the best practice available is to run a detailed numerical simulation model with a very fine grid size (less than 10 meters) in the tsunami runup zone. Such a numerical model is usually run with a nested grid system with a grid size of several kilometers in the abyssal plain, a few hundreds of meters on the continental shelf, a few tens of meters near the shore, and less than 10 meters in the runup zone. A numerical simulation can provide the complete time history of flow velocity and depth at the site of interest.
Alternatively, the use of analytical solutions can be considered. Although some simplifications and assumptions must be imposed, the results are useful as a guideline for checking the reasonableness of results, or as estimate of approximate values in the absence of other information. Available analytical solutions are based on one-dimensional, fully nonlinear shallow-water-wave theory for the condition with a uniformly sloping beach. With those assumptions, the exact solution for the runup of an incident bore was given by Shen and Meyer (1963), based on Ho and Meyer (1962). The maximum fluid velocity occurs at the leading runup tip as calculated by Equation E-1:
u = 2 g x tan α , (E-1) where:
α = the beach slope,
g = the gravitational acceleration, and
x = the distance from the maximum runup location to the location of interest; the location of interest must be above the initial shoreline.
Results indicate that the flow at the leading runup tip moves up the beach under gravity, just like a particle with simple energy transfer between its kinetic and potential energies. According to Yeh (2006), Equation E-1
FEMA P-646 E: Maximum Flow Velocity and Momentum Flux in the Tsunami Runup Zone
145

provides the upper-limit envelope of the flow velocity for all incident tsunami forms. Because a real beach is not uniformly sloped, it is more convenient to present Equation E-1 as a function of the ground elevation, instead of distance as follows:
z umax = 2 g R1 − (E-2) R
where:
R = the ground elevation at the maximum penetration of tsunami runup, measured from the initial shoreline, and
z = the ground elevation of the location of interest, measured from the initial shoreline level.
It is emphasized that the model does not include the effects of friction and the maximum flow velocity occurs at the leading runup tip, where the flow depth is zero. Since debris requires some finite flow depth in order to float (draft), use of Equations E-1 and E-2 to estimate velocity for impact load calculations is overconservative.
Based on Shen and Meyer’s (1963) results, Peregrine and Williams (2001) provided the formulae for the temporal and spatial variations in fluid velocity and flow depth of the incident bore runup in the vicinity of the leading runup tip. With slightly different scaling, Yeh (2007) expressed Peregrine and Williams’ formulae for the flow depth and velocity, respectively as follows:
1 2η = (2 2τ τ− − 2ζ )2 (E-3)
36τ 2
and
1 2 +υ = (τ − 2τ 2 ζ ) (E-4) 3τ
where, in the above equations:
d u g z; ζ = R 2 g R R R
η = ; υ = ; τ = t tan α
d = the water depth,
R = the ground elevation at the maximum penetration of tsunami runup, measured from the initial shoreline,
u = the flow velocity,
g = the gravitational acceleration,
α = the beach slope,
t = the time: 0 when the bore passes at the initial shoreline, and
146 E: Maximum Flow Velocity and Momentum Flux in the FEMA P-646 Tsunami Runup Zone

z = the ground elevation of the location of interest, measured from the initial shoreline: this identifies the location of interest along a uniformly sloping beach.
For a given maximum runup penetration, a bore formation should yield the fastest flow velocity among all the incident tsunami formations. Gradual flooding of non-breaking tsunamis should result in slower flow velocity than that caused by the bore runup. Therefore, Equations E-3 and E-4 can be used to estimate the maximum flow velocity at a given location for a given flow depth. Combining Equations E-3 and E-4 and eliminating τ, Figure E-1 can be derived. Each curve in the figure represents the dimensionless flow velocity υ versus the location ζ (in terms of ground elevation, z) for a given local flow depth, d. This figure can be used to evaluate the maximum flow velocity that can carry floating debris with finite draft depth, since draft of the debris must be greater than the flow depth to make the debris float. Equations E-3 and E-4 are valid only for the flows very close to the leading runup tip. Therefore, the velocity estimated for a case with a sufficiently large draft depth can be overly conservative.
Figure E-1 Maximum flow velocity of depth, d, at the ground elevation, z, and maximum runup elevation, R. The bottom curve represents the lower limit of maximum flow velocity.
The bottom curve in Figure E-1 is the lower limit of the maximum flow velocity for a given depth, d. Note that the results in Figure E-1 are based on the runup condition of uniform incident bore. Local inundation depth of other tsunami forms usually exceeds that of a bore runup, and the maximum flow velocity is lower than the limit curve in Figure E-1. Hence when a floating-debris has a draft that exceeds the flow depth of the bore runup, the
FEMA P-646 E: Maximum Flow Velocity and Momentum Flux in the Tsunami Runup Zone
147

design velocity umax can be estimated conservatively with the lower limit curve.
E.2 Momentum Flux
When a detailed numerical simulation model is available, the critical values of forces can be evaluated directly for a location of interest. The maximum value of the product of water depth and the square of flow velocity hu2 is needed to compute the hydrodynamic forces.
Even in the case of no numerical simulation data, the maximum momentum flux per unit water mass per unit width hu2 can be estimated conservatively once the maximum runup height (or distance) is determined. Using the exact solution algorithm, Yeh (2006) developed an envelope curve of hu2 , expressed in Equation E-5:
hu2 x x= 0.11( )2
+ 0.015( ) (E-5) 2 2gα f f f
where:
hu2 = the momentum flux per unit mass per unit width,
α = the beach slope,
g = the gravitational acceleration,
x = the distance from the maximum runup location to the location of interest (the location of interest must be above the initial shoreline), and
f = the maximum runup distance.
Once the maximum runup distance, f, is determined (e.g., from an available inundation map), the momentum flux, ρ hu2 per unit breadth at a given location x, can be computed by Equation E-5. It is emphasized that Equation E-5 is for a uniform beach slope; therefore, some adjustments need to be made to evaluate realistic conditions. Because a real beach is not uniformly sloped, it is more convenient to express Equation E-5 as a function of ground elevation instead of distance, as follows:
2hu z z 2
= 0.125 − 0.235 + 0.11 (E-6) 2 g R R R where:
hu2 = the momentum flux per unit mass per unit width,
g = the gravitational acceleration,
148 E: Maximum Flow Velocity and Momentum Flux in the FEMA P-646 Tsunami Runup Zone

R = the ground elevation at the maximum penetration of tsunami runup, measured from the initial shoreline, and
z = the ground elevation of the location of interest, measured from the initial shoreline: this identifies the location of interest along a uniformly sloping beach.
Although a real beach is not uniformly sloped and tsunami runup is not a one-dimensional motion, Figure E-1 and Equations E-2 and E-6 provide an analytical basis for runup conditions.
FEMA P-646 E: Maximum Flow Velocity and Momentum Flux in the Tsunami Runup Zone
149


Glossary
The following definitions are provided to explain the terms and acronyms used throughout this document. Many have been taken directly from the FEMA 55, Coastal Construction Manual (FEMA, 2005).
A
ADA – Americans with Disabilities Act. Law requiring that design accommodations be made for persons with certain disabilities.
Armor – Material used to protect slopes from erosion and scour by floodwaters, such as riprap, gabions, or concrete.
ASCE – American Society of Civil Engineers.
ATC – Applied Technology Council.
A-Zone – Under the National Flood Insurance Program, the area subject to inundation by a 100-year flood where waves are less than 3 feet high [designated Zone A, AE, A1-A30, A99, AR, AO, or AH on a Flood Insurance Rate Map (FIRM)].
B
Base flood – Flood that has a 1% probability of being equaled or exceeded in any given year, also known as the 100-year flood.
Base Flood Elevation (BFE) – Elevation of the base flood in relation to a specified datum, such as the National Geodetic Vertical Datum or the North American Vertical Datum. The Base Flood Elevation is the basis of the insurance and floodplain management requirements of the National Flood Insurance Program.
Bathymetry – Underwater configuration of a bottom surface of an ocean, estuary, or lake.
Berm – A mound of soil or other earthen material.
Bore – A long, broken wave propagating into a quiescent body of water, with an abrupt increase in water depth at its front face covered with turbulent, tumbling water.
FEMA P-646 Glossary 151

Breakaway wall – Under the National Flood Insurance Program, a wall that is not part of the structural support of the building and is intended, through its design and construction, to collapse under specific lateral loading forces without causing damage to the elevated portion of the building or supporting foundation system. Breakaway walls are required by the National Flood Insurance Program regulations for any enclosures constructed below the Base Flood Elevation beneath elevated buildings in coastal high-hazard areas (also referred to as V-Zones). In addition, breakaway walls are recommended in areas where floodwaters flow at high velocities or contain ice or other debris.
Building codes – Regulations adopted by local governments that establish standards for construction, modification, and repair of buildings and other structures.
Building official – An officer or other designated authority charged with the administration and enforcement of the code, or a duly authorized representative such as a building, zoning, planning, or floodplain management official.
Bulkhead – A wall or other structure, often of wood, steel, stone, or concrete, designed to retain or prevent sliding or erosion, and occasionally used to protect against wave action.
C
CAEE – Canadian Association for Earthquake Engineering.
Cast-in-place concrete – Concrete that is formed, placed, and cured in its final location in the structure.
Cladding – Exterior surface of the building envelope.
Coastal A-Zone – The portion of the Special Flood Hazard Area landward of a V-Zone or landward of an open coast without mapped V-Zone in which the principal sources of flooding are astronomical tides, storm surge, seiches, or tsunamis (not riverine sources). The flood forces in coastal A-Zones are highly correlated with coastal winds or coastal seismic activity. Coastal A-Zones may therefore be subject to wave effects, velocity flows, erosion, scour, or combinations of these forces. (Note: National Flood Insurance Program regulations do not differentiate between coastal A-Zones and non-coastal A-Zones.)
Coastal barrier – Depositional geologic features such as a bay barrier, tombolo, barrier spit, or barrier island that consists of unconsolidated
152 Glossary FEMA P-646

sedimentary materials; is subject to wave, tidal, and wind energies; and protects landward aquatic habitats from direct wave attack.
Coastal High-Hazard Area – Under the National Flood Insurance Program, an area of special flood hazard extending from offshore to the inland limit of a primary frontal dune along an open coast, and any other area subject to high-velocity wave action from storms or seismic sources. On a Flood Insurance Rate Map, the coastal high-hazard area is designated Zone V, VE, or V1–V30. These zones designate areas subject to inundation by the base flood where wave heights or wave runup depths are greater than or equal to 3 feet. In Hawaii, the VE-Zones are generally determined where the depth of water from a 100-year event (as determined from tsunami and/or hurricane data) is greater than 4 feet.
Collapsing breaker – A type of breaking wave associated with a steep beach slope and flat incident wave, which occurs right at the instantaneous shoreline.
D
Dead load – Weight of all materials of construction incorporated into the building, including but not limited to walls, floors, roofs, ceilings, stairways, built-in partitions, finishes, cladding, and other similarly incorporated architectural and structural items and fixed service equipment. See Loads.
Debris – Solid objects or masses carried by or floating on the surface of moving water.
Debris impact loads – Loads imposed on a structure by the impact of waterborne debris.
Debris line – Markings on a structure or the ground caused by the deposition of debris, indicating the height or inland extent of floodwaters.
Design Basis Earthquake (DBE) – The earthquake hazard level that structures are specifically proportioned to resist, taken as two-thirds of the Maximum Considered Earthquake (MCE) hazard level.
DoD – Department of Defense.
Draft – The depth of water that a body needs in order to float.
F
Far-source-generated tsunami – Tsunami resulting from a source located far from the site such that it arrives in excess of a 2-hour timeframe.
FEMA P-646 Glossary 153

FEMA – Federal Emergency Management Agency.
FEMA MAT Report – FEMA Mitigation Assessment Team Report.
Fill – Material such as soil, gravel, or crushed stone placed in an area to increase ground elevations or change soil properties. See Structural Fill.
FIRM – Flood Insurance Rate Map.
500-year flood – Flood that has a 0.2% probability of being equaled or exceeded in any given year.
Flood elevation – Height of the water surface above an established elevation datum such as the National Geodetic Vertical Datum, the North America Vertical Datum, or mean sea level.
Flood-hazard area – The greater of the following: (1) the area of special flood hazard, as defined under the National Flood Insurance Program, or (2) the area designated as a flood-hazard area on a community's legally adopted flood-hazard map, or otherwise legally designated.
Flood Insurance Rate Map – Under the National Flood Insurance Program, an official map of a community upon which the Federal Emergency Management Agency has delineated both the special hazard areas and the risk premium zones applicable to the community. (Note: The latest FIRM issued for a community is referred to as the effective FIRM for that community.)
Footing – The enlarged base of a foundation wall, pier, post, or column designed to spread the load of the structure so that it does not exceed the soil bearing capacity.
G
Grade beam – Section of a concrete slab that is thicker than the slab and acts as a footing to provide stability, often under load-bearing or critical structural walls.
GSA – General Services Administration.
H
Hydrodynamic loads – Loads imposed on an object, such as a building, by water flowing against and around it. Among these loads are positive frontal pressure against the structure, drag effect along the sides, and negative pressure on the downstream side.
154 Glossary FEMA P-646
Hydrostatic loads – Loads imposed on a surface, such as a wall or floor slab, by a standing mass of water. The water pressure increases linearly with the water depth; hence, the hydrostatic loads increase with the square of the water depth.
I
Impact forces – Loads that result from waterborne debris transported by tsunami waves striking against buildings and structures or parts thereof.
Impulsive forces – Force induced against a vertical obstruction subjected to the leading edge of a tsunami during runup, also termed “surge” forces.
Ingress – The act of entering a building.
Inland zone – For the purposes of this report, the area that is inland of the A-and X-Zones (the limit of the 500-year flood).
L
Liquefaction – A phenomenon that occurs in saturated soils when the net pore pressure exceeds the gravity force holding soil particles together. Soil strength and stiffness decrease dramatically as the soil behaves similar to a fluid.
Loads – Forces or other actions that result from the weight of all building materials, occupants and their possessions, environmental effects, differential movement, and restrained dimensional changes.
M
Masonry – Built-up construction of combination of building units or materials of clay, shale, concrete, glass, gypsum, stone, or other approved units bonded together with or without mortar, grout, or other accepted methods of joining.
Maximum Considered Earthquake (MCE) – The most severe earthquake effects considered by seismic design codes and standards. The MCE is based on the United States Geological Survey seismic hazard maps, which are based on a combination of: (1) 2500-year probabilistic earthquake ground motion hazards; and (2) deterministic ground motion hazards in regions of high seismicity, with the appropriate ground motion attenuation relationships defined for each region.
Maximum Considered Tsunami (MCT) – A design tsunami event based on a probabilistic assessment considering all possible tsunami sources, or a
FEMA P-646 Glossary 155

deterministic assessment considering the maximum tsunami that can reasonably be expected to affect a site.
Mid-source-generated tsunami – Tsunami generated by a source that is near the site of interest, but not close enough so that the effects of the triggering event is felt at the site.
Mitigation – Any action taken to reduce or permanently eliminate the long-term risk to life and property from natural hazards.
N
National Flood Insurance Program (NFIP) – The federal program created by Congress in 1968 that makes flood insurance available in communities that enact and enforce satisfactory floodplain management regulations.
National Geodetic Vertical Datum (NGVD) – Datum established in 1929 and used as a basis for measuring flood, ground, and structural elevations; was previously referred to as Sea Level Datum or Mean Sea Level. The Base Flood Elevations shown on most of the Flood Insurance Rate Maps issued by the Federal Emergency Management Agency are referenced to NGVD or, more recently, to the North American Vertical Datum.
Near-source-generated tsunami – Tsunami generated by a source located near the site such that it arrives within a 30-minute timeframe, and the effects of the triggering event are felt at the site.
Nonstructural wall – A wall that does not support vertical loads other than its own weight.
North American Vertical Datum (NAVD) – Datum used as a basis for measuring flood, ground, and structural elevations. NAVD, rather than the National Geodetic Vertical Datum, has been used in many recent flood insurance studies.
P
Pier foundation – Foundation consisting of isolated masonry or cast-in-place concrete structural elements extending into firm materials. Piers are relatively wide in comparison to their length, and derive their load-carrying capacity through skin friction, end bearing, or a combination of both.
Pile foundation – Foundation consisting of concrete, wood, or steel structural elements driven or jetted into the ground, or cast in place. Piles are relatively slender in comparison to their length, and derive their load-
156 Glossary FEMA P-646

carrying capacity through skin friction, end bearing, or a combination of both.
Plain concrete – Structural concrete with no reinforcement or with less reinforcement than the minimum amount specified for reinforced concrete.
Plunging Breaker – A type of breaking wave when the wave front curls over, forming a tube; it usually happens on beaches where the slope is moderately steep.
Post foundation – Foundation consisting of vertical support members, usually made of wood, set in holes and backfilled with compacted material.
Precast concrete – Concrete, usually a discrete structural member, that is formed, placed, and cured at one location, and subsequently moved and assembled into a final location in a structure.
Probabilistic maps – Maps of predicted tsunami effects including for inundation zone, flood depths, and flow velocities, based on a method involving probability and uncertainty.
Progressive collapse – ASCE/SEI Standard 7-02 defines progressive collapse as “the spread of an initial local failure from element to element resulting eventually, in the collapse of an entire structure or a disproportionately large part of it.”
R
Rapid drawdown – A sudden reduction in water level immediately prior to the first tsunami wave, or between tsunami waves.
Reinforced concrete – Structural concrete reinforced with steel.
Retrofit – Any change made to an existing structure to reduce or eliminate potential damage to that structure from flooding, erosion, high winds, earthquakes, or other hazards.
S
Scour – Removal of soil or fill material by the flow of floodwaters, frequently used to describe storm-induced, localized conical erosion around pilings and other foundation supports where the obstruction of flow increases turbulence.
Sea wall – Solid barricade built at the water’s edge to protect the shore and to prevent inland flooding.
FEMA P-646 Glossary 157

SEI – Structural Engineering Institute of ASCE.
Shearwall – Load-bearing or non-load-bearing wall that transfers in-plane forces from lateral loads acting on a structure to its foundation.
Special Flood Hazard Area (SFHA) – Under the National Flood Insurance Program, an area having special flood, mudslide (i.e., mudflow), and/or flood-related erosion hazards, and shown on a Flood Hazard Boundary Map or Flood Insurance Rate Map as Zone A, AO, A1-A30, AE, A99, AH, V, V1-V30, VE, M, or E.
Stillwater elevation – Projected elevation that floodwaters would assume, referenced to the National Geodetic Vertical Datum, the North American Vertical Datum, or some other datum, in the absence of waves resulting from wind or seismic effects.
Storm surge – Rise in the water surface above normal water level on an open coast due to the action of wind stress and atmospheric pressure on the water surface.
Structural fill – Fill compacted to a specified density to provide structural support or protection to a structure.
T
Topography – Configuration of a terrain, including its relief and the position of its natural and man-made features.
Tsunami – A naturally occurring series of ocean waves resulting from a rapid, large-scale disturbance in a body of water, caused by earthquakes, landslides, volcanic eruptions, and meteorite impacts.
Tsunami inundation elevation – The elevation, measured from sea level, at the location of the maximum tsunami penetration
Tsunami inundation zone – The region flooded by tsunami penetration inland.
Tsunami runup – Rush of tsunami waves up a slope, terrain, or structure.
Tsunami runup height – The difference between the elevation of maximum tsunami penetration and the elevation of the shoreline at the time of tsunami attack.
Tsunami water level – The difference between the elevation of the highest local water level and the elevation of the shoreline at the time of tsunami attack.
158 Glossary FEMA P-646
U
Undermining – Process whereby erosion or scour exceeds the depth of the base of a building foundation, or the level below which the bearing strength of the foundation is compromised.
Uplift – Vertical hydrostatic pressure caused by the volume of displaced water under a building.
V
V-Zone – See Coastal High-Hazard Area.
VE-Zone – Coastal High-Hazard Areas where the Base Flood Elevations have been determined through a detailed study.
Vertical Evacuation Refuge from Tsunamis – A building or earthen mound that has sufficient height to elevate evacuees above the tsunami inundation depth, and is designed and constructed with the strength required to resist the forces generated by tsunami waves.
W
Waterborne debris – Any object transported by tsunami waves (e.g., driftwood, small boats, shipping containers, automobiles).
Wave crest – The point of highest elevation in a wave profile.
Wave height – Vertical distance between the successive local maximum and minimum elevations in a wave profile.
Wave zone – Area that coincides with V, VE, or V1–V30 Zones or Coastal High-Hazard Areas.
FEMA P-646 Glossary 159


References
Abe, S., Sugaya, C., Tanaka et al., 2005, “Guideline for Tsunami Evacuation Buildings,” Tsunami Evacuation Building Guideline Committee, http://www.bousai.go.jp/oshirase/h17/tsunami_hinan.html (translated from Japanese).
Abednego, L.G., 2005, “The Contribution of Indonesian Engineers Association to Aceh Province After Earthquake and Tsunami,” Proceedings of the Scientific Forum on Tsunami, Its Impact and Recovery, AIT Conference Center, Bangkok, Thailand.
ACI, 2008, Building Code Requirements for Structural Concrete (ACI 318-08) and Commentary (ACI 318R-08), American Concrete Institute, Farmington Hills, Michigan.
ARC, 2002, Standards for Hurricane Evacuation Shelter Selection, Publication No. 4496, http://www.tallytown.com/redcross/library/ StandardsForHurricaneEvacuationShelterSelection.pdf, American Red Cross, Tallahassee Florida.
Arnason, H., 2005, Interactions Between an Incident Bore and a Free-Standing Coastal Structure, Ph.D. dissertation, University of Washington, Seattle, Washington.
ASCE, 2003, Seismic Evaluation of Existing Buildings, ASCE/SEI Standard 31-03, American Society of Civil Engineers, Reston, Virginia.
ASCE, 2006a, Flood Resistant Design and Construction, ASCE/SEI Standard 24-05, American Society of Civil Engineers, Reston, Virginia.
ASCE, 2006b, Seismic Rehabilitation of Existing Buildings, ASCE/SEI Standard 41-06, American Society of Civil Engineers, Reston, Virginia.
ASCE, 2010, Minimum Design Loads for Buildings and Other Structures, ASCE/SEI Standard 7-10, American Society of Civil Engineers, Reston, Virginia.
Bernard, E.N., 2005, “The U.S. National Tsunami Hazard Mitigation Program: A Successful State–Federal Partnership,” Natural Hazards, Special Issue: U.S. National Tsunami Hazard Mitigation Program, Vol. 35, No. 1, pp. 5-24.
FEMA P-646 References 161

Borrero, J., Ortiz, M., Titov, V., and Synolakis, C.E., 1997, “Field Survey of Mexican Tsunami Produces New Data, Unusual Photos,” Eos Transactions, American Geophysical Union, Vol. 78, No. 8, pp. 85, 87-88.
Bourgeois, J., Petroff, C., Yeh, H., Titov, V., Synolakis, C.E., Benson, B., Kuroiwa, J., Lander, J., and Norabuena, E., 1999, “Geologic Setting, Field Survey and Modeling of the Chimbote, Northern Peru, Tsunami of 21 February 1996,” Pure and Applied Geophysics, Vol. 154, Nos. 3/4, pp. 513-540.
Bretschneider, C.L., 1974, Development of Structural Standards in Flood and Tsunami Areas for the Island of Hawaii, Ocean Engineering Consultants, Inc., Honolulu, Hawaii.
Briggs, M.J., Synolakis, C.E., Harkins, G.S., and Green, D.R., 1995, “Laboratory Experiments of Tsunami Runup on Circular Island,” Pure and Applied Geophysics, Vol. 144, Nos.3/4, pp. 569-593.
CAEE, 2005, Reconnaissance Report on the December 26, 2004 Sumatra Earthquake and Tsunami, Canadian Association for Earthquake Engineering, June, p. 21.
Carrier, G.F. and Yeh, H. 2005, “Tsunami Propagation from a Finite Source,” Computer Modeling in Engineering & Sciences, Vol. 10, pp. 113-122.
CBC, 2003, California Building Code, California Building Standards Commission, Whittier, California.
CCH, 2007, City and County of Honolulu Building Code, Department of Planning and Permitting of Honolulu Hawaii, Honolulu, Hawaii.
CGS, 2006, Historic Tsunamis in California, California Geological Survey, http://www.consrv.ca.gov/cgs/geologic_hazards/Tsunami/About_Tsunamis.htm#Historic%20Tsunamis%20in%20California, Sacramento, California.
Chowdhury, S., Geist, E., González, F., MacArthur, R., and Synolakis, C., 2005, “Tsunami Hazards,” Coastal Flood Hazard Analysis and Mapping Guidelines Focused Study Report, Federal Emergency Management Agency, Washington, D.C.
Curtis, G., 2001, “A Multi-Sensor Research Program to Improve Tsunami Forecasting,” International Tsunami Symposium 2001 Proceedings, Seattle, Washington.
162 References FEMA P-646

Dalrymple, R.A., and Kriebel, D.L., 2005, “Lessons in Engineering from the Tsunami in Thailand,” The Bridge, pp. 4-13.
Dames & Moore, 1980, Design and Construction Standards for Residential Construction in Tsunami-Prone Areas in Hawaii, prepared by Dames & Moore for the Federal Emergency Management Agency, Washington D.C.
DGPP, 1995, Guidelines for Tsunami Evacuation Buildings, Director-General for Policy Planning, Government of Japan, June 1, pp. 68, (in Japanese).
DOD, 2009, Design of Buildings to Resist Progressive Collapse, Unified Facilities Criteria (UFC) 4-023-03, Department of Defense, Washington, D.C.
Dunbar, P., Weaver, C., Bernard, E., and Dominey-Howes, D., 2008, U.S. States and Territories National Tsunami Hazard Assessment, 2006 Historical Record and Sources for Waves, National Oceanic and Atmospheric Administration, Washington, D.C. (draft report).
FEMA, 1997, Multi-Hazard Identification and Risk Assessment: A Cornerstone of the National Mitigation Strategy, Federal Emergency Management Agency, Washington, D.C.
FEMA, 2000a, Design and Construction Guidance for Community Shelters, FEMA 361 Report, Federal Emergency Management Agency, Washington, D.C.
FEMA, 2000b, Prestandard and Commentary for the Seismic Rehabilitation of Buildings, FEMA 356 Report, prepared by the American Society of Civil Engineers for the Federal Emergency Management Agency, Washington, D.C.
FEMA, 2004a, NEHRP Recommended Provisions for Seismic Regulations for New Buildings and Other Structures, FEMA 450-1/2003 Edition, Part 1: Provisions, prepared by the Building Seismic Safety Council for the Federal Emergency Management Agency, Washington, D.C.
FEMA, 2004b, NEHRP Recommended Provisions for Seismic Regulations for New Buildings and Other Structures, FEMA 450-2/2003 Edition, Part 2: Commentary, prepared by the Building Seismic Safety Council for the Federal Emergency Management Agency, Washington, D.C.
FEMA P-646 References 163

FEMA, 2006a, Hurricane Katrina in the Gulf Coast—Summary Report, Mitigation Assessment Team Report, FEMA 548 Report, Federal Emergency Management Agency, Washington, D.C.
FEMA, 2006b, Hurricane Katrina in the Gulf Coast—Observations, Recommendations, and Technical Guidance, Mitigation Assessment Team Report, FEMA 549 Report, Federal Emergency Management Agency, Washington, D.C.
FEMA, 2011, Coastal Construction Manual, FEMA P-55 Volumes I and II, Federal Emergency Management Agency, Washington, D.C.
Fukuyama, H., and Okoshi, T., 2005, Introduction of the Tsunami Resisting Design Method for Buildings Proposed by the Building Center of Japan, Building Center of Japan, Tokyo, Japan.
Geist, E. L., 1999, “Local Tsunamis and Earthquake Source Parameters,” Advances in Geophysics, Vol. 39, pp. 117-209.
Geist, E. L., and Parsons, T., 2006, “Probabilistic Analysis of Tsunami Hazards,” Natural Hazards, Springer, Vol. 37, No. 3, pp. 277-314.
Ghosh, S.K., and Fanella, D.A., 2003, Seismic and Wind Design of Concrete Buildings, International Code Council, Country Club Hills, Illinois.
González, F.I., Bernard, E.N., Meinig, C., Eble, M., Mofjeld, H.O., and Stalin, S., 2005b, “The NTHMP Tsunameter Network,” Natural Hazards, Special Issue: U.S. National Tsunami Hazard Mitigation Program, Vol. 35, No. 1, pp. 25-39.
González, F.I., Titov, V.V., Mofjeld, H.O., Venturato, A., Simmons, S., Hansen, R., Combellick, R., Eisner, R., Hoirup, D., Yanagi, B., Yong, S., Darienzo, M., Priest, G., Crawford, G., and Walsh, T., 2005a, “Progress in NTHMP Hazard Assessment,” Natural Hazards, Special Issue: U.S. National Tsunami Hazard Mitigation Program, Vol. 35, No. 1, pp. 89-110.
GSA, 2003, Progressive Collapse Analysis and Design Guidelines for New Federal Office Buildings and Major Modernization Projects, General Services Administration, Washington, D.C.
Gusiakov, V.K., 1978, “Static displacement on the surface of an elastic space. Ill-posed problems of mathematical physics and interpretation of geophysical data,” VC SOANSSSR, Novosibirsk , pp. 23-51 (in Russian).
164 References FEMA P-646
Haehnel, R.B., and Daly, S.F., 2002, Maximum Impact Force of Woody Debris on Floodplain Structures, Technical Report ERDC/CRREL TR-02-2, U.S. Army Corps of Engineers. Springfield, Virginia.
Hamabe, C., Ishikawa, T., Ohgi, T., et al., 2004, “Tsunami Resistant Design Method of Buildings (tentative),” Building Letter (Journal of the Building Center of Japan), 2004.10, pp. 7-13, and 2004.11, pp. 1-8.
Ho, D.V., and Meyer, R.E., 1962, “Climb of a Bore on a Beach. Part 1: Uniform Beach Slope,” Journal of Fluid Mechanics, Vol. 14, pp. 305-318.
Hwang, D., 2005a, Hawaii Coastal Hazard Mitigation Guidebook, Hawaii Department of Land and Natural Resources, State Office of Planning, Honolulu, Hawaii.
Hwang, D., 2005b, Mitigating the Risk from Coastal Hazards: Strategies & Concepts for Recovery from the December 26, 2004 Tsunami.
ICC, 2012, International Building Code, International Code Council, Inc., Country Club Hills, Illinois.
ICC/NSSA, 2007, Standard on the Design and Construction of Storm Shelters, ICC 500, International Code Council and National Storm Shelter Association, Country Club Hills, Illinois (Third Public Comments Draft).
Ikeno, M., Mori, N., and Tanaka, Y., 2001, “Experimental Study on Tsunami Force and Impulsive Force by a Drifter under Breaking Bore Like Tsunamis,” Proceedings of Coastal Engineering, Japan Society of Civil Engineering, Vol. 48, pp. 846-850 (in Japanese).
Ikeno, M., and Tanaka, Y., 2003, “Experimental Study on Impulse Force of Drift Body and Tsunami Running Up to Land,” Proceedings of Coastal Engineering, Japan Society of Civil Engineering, Vol. 50, pp. 721-725 (in Japanese).
Imamura, F., Ito, M., Kawata, Y., et al., 2005, Recommendations of the Tsunami Protection Committee, Tsunami Protection Committee, http://www.mlit.go.jp/river/shinngikai/tsunami/pdf/ teigen_english.pdf.
Imamura, F., Synolakis, C.E., Gica, E., Titov, V., Listanco, E., and Lee, H.G., 1995, “Field Survey of the 1994 Mindoro Island, Philippines Tsunami,” Pure and Applied Geophysics, Vol. 144, pp. 875-890.
FEMA P-646 References 165
Kisei Town Hall Prevention of Disasters Section, Tower of Relief - Life is Protected from Tidal Wave Disaster, http://www.webmie.or.jp/ ~kisei-t/bosai.html, (translated from Japanese).
Knill, J., and Knill, J., 2004, http://www.cnn.com/SPECIALS/2004/ tsunami.disaster/, Cable News Network.
Kowalik, Z. and Murty, T. S., 1993a, Numerical Modeling of Ocean Dynamics, World Scientific Publishing Co. Pte., Ltd., Singapore.
Kowalik, Z. and Murty, T. S., 1993b, “Numerical Simulation of Two-Dimensional Tsunami Runup.” Marine Geodesy, Vol. 16, pp. 87-100.
Kriebel, D.L., Buss, L., and Rogers, S., 2000, Impact loads from flood-borne debris, Report to the American Society of Civil Engineers, Reston, Virginia.
Lander, J.F., 1999, Caribbean Tsunamis: An Initial History, http://www.mona.uwi.edu/uds/Tsunami_Lander.html.
Liu, P.L.-F., Synolakis, C.E., and Yeh, H.H., 1991, “Report on the International Workshop on Long-Wave Run-up,” Journal of Fluid Mechanics, Vol. 229, pp. 675-688.
Liu, P.L.-F., Synolakis, C.E., and Yeh, H.H., 2006, Report on the Tsunami Model Benchmark Comparisons Workshop, National Science Foundation Report, Catalina Island, California.
Lockridge, P.A., Whiteside, L.S., Lander, J.F., 2002, “Tsunamis and Tsunami-Like Waves of the Eastern United States,” Science of Tsunami Hazards, Vol. 20, No. 3.
Luettich, R.A. and J.J. Westerink, 1995a. An Assessment of Flooding and Drying Techniques for Use in the ADCIRC Hydrodynamic Model: Implementation and Performance in One-Dimensional Flows, U.S. Army Corps of Engineers, Vicksburg, Mississippi.
Luettich, R.A. and J.J. Westerink, 1995b. Implementation and Testing of Elemental Flooding and Drying in the ADCIRC Hydrodynamic Model, U.S. Army Corps of Engineers, Vicksburg, Mississippi.
Luettich, R.A., J.J. Westerink and N.W. Scheffner, 1991. An Advanced Three-Dimensional Circulation Model for Shelves, Coasts, and Estuaries, U.S. Army Corps of Engineers, Washington, D.C.
Matsutomi, H., 1999, “A Practical Formula for Estimating Impulsive Force Due to Driftwoods and Variation Features of The Impulsive Force,”
166 References FEMA P-646

Proceedings of the Japan Society of Civil Engineers, Vol. 621, pp. 111-127 (in Japanese).
McGehee, D., and McKinney, J., 1995, Tsunami Detection and Warning Capability Using Nearshore Submerged Pressure Transducers, U.S. Army Engineer Waterways Experiment Station, Vicksburg, Mississippi.
Morrissey, W., 2005, Tsunamis: Monitoring, Detection, and Early Warning Systems, Congressional Research Service Report for Congress, Library of Congress, Washington, D.C.
Mosqueda, G., and Porter, K.A., 2006, “Preliminary Conclusions—Assessing Damage to Engineered Buildings in the Wake of Hurricane Katrina,” Structural Engineer, Vol. 7, No. 1, pp 20-26.
Murakami, H., Fraser, S., Leonard, G. S., and Matsuo, I., 2012, “A Field Study on Conditions and Roles of Tsunami Evacuation Buildings in the 2011 Tohoku Pacific Earthquake and Tsunami,” Proceedings of the 9th International Conference of Urban Earthquake Engineering, Tokyo, Japan, pp. 89-95.
Myers, E.P. and A.M. Baptista, 1995. “Finite Element Modeling of the July 12, 1993 Hokkaido Nansei-Oki Tsunami,” Pure and Applied Geophysics, Vol. 144, No. 3/4, pp. 769-801.
NIST, 2007, Engineering Design and Cost Data for Reinforced Concrete Buildings for Next Generation Design and Economic Standards for Structural Integrity, prepared by S.K. Ghosh Associates, Inc. in collaboration with Baldridge & Associates Structural Engineering, Inc., for the National Institute of Standards and Technology, Gaithersburg, Maryland.
NSTC, 2005, Tsunami Risk Reduction for the United States: A Framework for Action, Joint Report of the Subcommittee on Disaster Reduction and the United States Group on Earth Observations, National Science and Technology Council, Washington, D.C.
NTHMP, 2012, Proceedings and Results of the 2011 NTHMP Model Benchmarking Workshop. National Tsunami Hazard Mitigation Program (U.S.), NOAA Special Report. Silver Spring, Maryland, U.S. Dept. of Commerce, National Oceanic and Atmospheric Administration, 416 p.
Okada, Y., 1985, “Surface Deformation Due to Shear and Tensile Faults in a Half Space,” Bulletin of the Seismological Society of America, Vol. 75, pp. 1135-1154.
FEMA P-646 References 167

Okal, E.A., 2003, “Normal Mode Energetics for Far-Field Tsunami Generated by Dislocations and Landslides,” Pure Applied Geophysics., Vol. 160, pp. 2189-2221.
Pacheco, K.H., and Robertson, I.N., 2005, Evaluation of Tsunami Loads and their Effect on Concrete Buildings, University of Hawaii Research Report UHM/CEE/05-06, p. 189, 207.
Pararas-Carayannis, G., 1968, Catalog of Tsunamis in Hawaiian Islands, http://www.drgeorgepc.com/TsunamiCatalogHawaii.html.
Pararas-Carayannis, G., 1976, The Earthquake and Tsunami of 29 November 1975 in the Hawaiian Islands, ITIC Report, http://www.drgeorgepc.com/Tsunami1975.html.
Peregrine, D.H. and Williams, S. M., 2001, Swash overtopping a truncated plane beach, Journal of Fluid Mechanics, Vol. 440, pp. 391-399.
Peterson, K., and Naito, C., 2012, Simplified ABAQUS model of ISO Shipping Container, Research Report, Lehigh University.
Priest, G.R., Myers, E., Baptista, A.M., Fleuck, P., Wang, K., Kamphaus, R.A., and Peterson, C.D., 1997a, Cascadia Subduction Zone Tsunamis: Hazard Mapping at Yaquina Bay, Oregon, Open-File Report O-97-34, Oregon Department of Geology and Mineral Industries.
Priest, G., Myers, E., Baptista, A., Kamphaus, R., Peterson, C., and Darienzo, M., 1997b, Tsunami Hazard Map of Yaquina Bay Area, Lincoln Co., OR, Interpretive Map Series, IMS-2, 1:12,000, Oregon Department of Geology and Mineral Industries.
Ramsden, J.D., 1993, Tsunamis: Forces on a Vertical Wall Caused by Long Waves, Bores, and Surges on a Dry Bed, Report No. KH-R-54, W.M. Keck Laboratory, California Institute of Technology, Pasadena, California.
Robertson, I.N., Riggs, R.H., Yim, S., and Young Y.L., 2006, “Lessons from Katrina,” Civil Engineering, American Society of Civil Engineers, Vol. 76, No. 4, pp. 56-63.
SEAOC, 1995, Performance-Based Seismic Engineering of Buildings, Vision 2000 Report, Structural Engineers Association of California, Sacramento, California.
Shen, M.C. and Meyer, R.E., 1963, Climb of a Bore on a Beach, Part 3 Run-up, Journal of Fluid Mechanics, Vol. 16, pp. 113-125.
168 References FEMA P-646

Shuto, N., 1991, “Numerical Simulation of Tsunamis,” Tsunami Hazard, Kluwer Academic Publishers, Dordrecht, Netherlands, pp. 171-191.
Suleimani, E.N., Combellick, R.A., Hansen, R.A., and Carver, G.A., 2002a, “Tsunami Hazard Mapping of Alaska Coastal Communities,” TsunInfo Alert, Vol. 4, No. 4, pp. 4-8.
Suleimani, E.N., Hansen, R.A. Combellick, G.A., Carver, R.A. Kamphaus, J.C. Newman, and A.J. Venturato, 2002b, “Tsunami Hazard Maps of the Kodiak Area, Alaska,” Report of Investigations 2002-1, State of Alaska Department of Natural Resources, Division of Geological & Geophysical Surveys.
Synolakis, C.E., Imamura, F., Tinti, S., Tsuji, Y., Matsutomi, H., Cooke, B., and Usman, M., 1995, “The East Java Tsunami of July 4, 1994,” Eos Transactions, American Geophysical Union, Vol. 76, No. 26, pp. 257, 261-262.
Synolakis, C.E., 2006, Standards, Criteria and Procedures for NOAA Evaluation of Tsunami Numerical Models (in review).
Titov, V.V., 1997, Numerical Modeling of Long Wave Runup, Ph.D. dissertation, University of Southern California, Los Angeles, California.
Titov, V.V., and Synolakis, C.E., 1995, “Modeling of Breaking and Nonbreaking Long Wave Evolution and Runup Using VTCS-2,” Journal of Waterways, Ports, Coastal and Ocean Engineering, Vol. 121, No. 6, pp. 308-316.
Titov, V.V., and Synolakis, C.E., 1996, “Numerical Modeling of 3-D Long Wave Runup Using VTCS-3,” Long Wave Runup Models, World Scientific Publishing Co. Pte., Ltd., Singapore, pp. 242-248.
Titov, V., and González, F.I., 1997, Implementation and Testing of the Method of Splitting Tsunami (MOST) Model, NOAA Technical Memo ERL PMEL-112 (PB98-122773), NOAA/Pacific Marine Environmental Laboratory, Seattle, Washington.
Titov, V.V., and Synolakis, C.E., 1997, “Extreme Inundation Flows During the Hokkaido-Nansei-Oki Tsunami,” Geophysical Research Letters, Vol. 24, No. 11, pp. 1315-1318.
Titov, V.V., and Synolakis, C.E., 1998, “Numerical Modeling of Tidal Wave Runup,” Journal of Waterways, Ports, Coastal and Ocean Engineering, Vol. 124, No. 4, pp. 157-171.
FEMA P-646 References 169

Titov,V.V., González, F.I., Mofjeld, H.O., and Venturato, A.J., 2003, NOAA TIME Seattle Tsunami Mapping Project: Procedures, Data Sources, and Products, NOAA Technical Memo OAR PMEL-124, NOAA/Pacific Marine Environmental Laboratory, Seattle, Washington.
Titov, V.V., González, F.I., Bernard, E.N., Eble, M.C., Mofjeld, H.O., Newman, J.C., and Venturato, A.J., 2005, “Real-time Tsunami Forecasting: Challenges and Solutions,” Natural Hazards, Special Issue: U.S. National Tsunami Hazard Mitigation Program, Vol. 35, No. 1, pp. 41-58.
Tsunami Hazard Mitigation Federal/State Working Group, 1996, Tsunami Hazard Mitigation Implementation Plan — A Report to the Senate Appropriations Committee, Washington, D.C.
Tsunami Pilot Study Working Group, 2006, Seaside, Oregon Tsunami Pilot Study—Modernization of FEMA Flood Hazard Maps, USGS Open-File Report 2006-1234, NOAA OAR Special Report, NOAA/OAR/PMEL, Seattle, Washington.
UBC, 1997, Uniform Building Code, International Conference of Building Officials, Whittier, California.
UK, 1992, The Building Regulations, London, Her Majesty’s Stationary Office, United Kingdom.
U.S. Army Coastal Engineering Research Center, 2011, Coastal Engineering Manual, EM 1110-2-1100.
Walsh, T.J., Titov, V.V., Venturato, A.J., Mofjeld, H.O., and González, F.I., 2003, Tsunami Hazard Map of the Elliott Bay Area, Seattle, Washington—Modeled Tsunami Inundation from a Seattle Fault Earthquake.
Wiegel, R.L., 1964, Oceanographical Engineering, Prentice-Hall, Inc., Englewood Cliffs, New Jersey.
Wiegel, R. L,, 2005, Tsunami Information Sources, Hydraulic Engineering Laboratory Technical Report UCB/HEL 2005-1, University of California, Berkeley, California.
Wiegel, R. L,, 2006a, Tsunami Information Sources, Part 2, Hydraulic Engineering Laboratory Technical Report UCB/HEL 2006-1, University of California, Berkeley, California.
170 References FEMA P-646

Wiegel, R. L,, 2006b, Tsunami Information Sources, Part 3, Hydraulic Engineering Laboratory Technical Report UCB/HEL 2006-3, University of California, Berkeley, California.
Wiegel, R. L,, 2008, Tsunami Information Sources, Part 4, Hydraulic Engineering Laboratory Technical Report UCB/HEL 2008-1, University of California, Berkeley, California.
Yamazaki, Y., Cheung, K. F., and Kowalik, Z., 2011, “Depth-integrated, non-hydrostatic model with grid nesting for tsunami generation, propagation, and run-up,” Int. Journal for Numerical Methods in Fluids, 67(12), pp. 2081-2107.
Yeh, H., 2006, “Maximum Fluid Forces in the Tsunami Runup Zone,” Journal of Waterways, Ports, Coastal and Ocean Engineering, American Society of Civil Engineers, Vol. 132, pp. 496-500.
Yeh, H. 2007, “Design Tsunami Forces for Onshore Structures,” Journal of Disaster Research, Vol. 2, No.6, pp. 531-536.
Yeh, H., 2008, “Closure to Maximum Fluid Forces in the Tsunami Runup Zone,” Journal of Waterways, Ports, Coastal and Ocean Engineering.
Yeh, H., Imamura, F., Synolakis, C.E., Tsuji, Y., Liu, P.L.-F., and Shi, S., 1993, “The Flores Island Tsunamis,” Eos Transactions, American Geophysical Union, Vol. 7, No. 33, pp. 369, 371-373.
Yeh, H., Liu, P.L.-F., and Synolakis, C.E., 1996, Long-wave Runup Models, Friday Harbor, USA, World Scientific Publishing Co. Pte., Ltd., Singapore, pp. 12–17.
Yeh, H., Robertson, I., and Preuss, J., 2005, Development of Design Guidelines for Structures that Serve as Tsunami Vertical Evacuation Sites, Open File Report 2005-4, Washington Division of Geology and Earth Resources, State of Washington (contract 52-AB-NR-200051), Olympia, Washington.
Yeh, H., Titov, V., Gusiakov, V.K., Pelinovsky, E., Khramshin, V., and Kaistrenko, V., 1995, “The1994 Shikotan Earthquake Tsunami,” Pure and Applied Geophysics, Vol. 144, No. 3/4, pp. 569-593.
FEMA P-646 References 171


Project Participants
ATC Management and Oversight
Christopher Rojahn (Project Executive) Applied Technology Council 201 Redwood Shores Parkway, Suite 240 Redwood City, California 94065 William L. Coulbourne (Project Manager) Applied Technology Council 19266 Coastal Highway Rehoboth Beach, Delaware 19971
Jon A Heintz (Project Quality Control Monitor) Applied Technology Council 201 Redwood Shores Parkway, Suite 240 Redwood City, California 94065 William T. Holmes (Project Technical Monitor) Rutherford & Chekene 55 Second Street, Suite 600 San Francisco, California 94105
FEMA Project Officer
Michael Mahoney (Project Officer) Federal Emergency Management Agency 500 C Street, SW, Room 416 Washington, D.C. 20472
FEMA Technical Monitor
Robert D. Hanson (Technical Monitor) (Federal Emergency Management Agency) 2926 Saklan Indian Drive Walnut Creek, California 94595
Project Management Committee (Second Edition)
Ian N. Robertson (Project Technical Director) University of Hawaii at Manoa Dept. of Civil and Environmental Engineering 2540 Dole Street, Holmes Hall 383 Honolulu, Hawaii 96822 Gary Chock Martin and Chock 1132 Bishop Street, Suite 1550 Honolulu, Hawaii 96813 John Hooper Magnusson Klemencic Associates 1301 Fifth Avenue, Suite 3200 Seattle, Washington 98101
Timothy J. Walsh Dept. of Natural Resources, Geology & Earth
Resources 1111 Washington Street SE, P.O. Box 47007 Olympia, Washington 98504 Harry Yeh Oregon State University School of Civil & Construction Engineering 220 Owen Hall, Corvallis, Oregon 97331
FEMA P-646 Project Participants 173
Project Management Committee
Steven Baldridge (Project Technical Director) BASE Research & Development, LLC 1164 Bishop Street, Suite 605 Honolulu, Hawaii 96813 Frank Gonzalez National Ocean & Atmospheric Administration Pacific Marine Environmental Laboratory 7600 Sand Point Way NE, Building 3 Seattle, Washington 98115-0070 John Hooper Magnusson Klemencic Associates 1301 Fifth Avenue, Suite 3200 Seattle, Washington 98101
Ian N. Robertson University of Hawaii at Manoa Dept. of Civil and Environmental Engineering 2540 Dole Street, Holmes Hall 383 Honolulu, Hawaii 96822 Timothy J. Walsh Dept. of Natural Resources, Geology & Earth
Resources 1111 Washington Street SE, P.O. Box 47007 Olympia, Washington 98504 Harry Yeh Oregon State University School of Civil & Construction Engineering 220 Owen Hall Corvallis, Oregon 97331
Project Review Panel
Christopher P. Jones (Chair) 5525 Jomali Drive Durham, North Carolina 27705 John Aho CH2M Hill 301 West Northern Lights Blvd., Suite 601 Anchorage, Alaska 99503-2662 George Crawford Washington State Military Dept. Emergency Management Division Camp Murray, Washington 98430 Richard Eisner Governor's Office of Emergency Services 1300 Clay Street, Suite 400 Oakland, California 94612 Lesley Ewing California Coastal Commission 45 Fremont Street, Suite 2000 San Francisco, California 94105 Michael Hornick DHS/FEMA, Region IX 1111 Broadway, Suite 1200 Oakland, California 94607
Chris Jonientz-Trisler DHS/FEMA, Region X 130 228th Street SW Bothell, Washington 98021 Marc L. Levitan LSU Hurricane Center Suite 3221 CEBA Building Louisiana State University Baton Rouge, Louisiana 70803 George R. Priest Oregon Dept. of Geology and Mineral Industries Newport Coastal Field Office P.O. Box 1033 Newport, Oregon 97365 Charles W. Roeder University of Washington Dept. of Civil and Environmental Engineering 233-B More Hall, Box 2700 Seattle, Washington 98195 Jay Wilson Clackamas County Department of Emergency
Management 2200 Kaen Road Oregon City, Oregon 97045
174 Project Participants FEMA P-646