guidelines for preparation of the comprehensive state
TRANSCRIPT

Guidelines for Preparation of the Comprehensive State Water Quality Assessments (305(b) Reports) and
Electronic Updates:
Report Contents
September 1997
Assessment and Watershed Protection Division (4503F) Office of Wetlands, Oceans, and Watersheds
Office of Water
U.S. Environmental Protection Agency 401 M Street, SW
Washington, DC 20460
Acknowledgments
EPA prepared these Guidelines with participation by the 305(b) Consistency Workgroup, whose members are listed on the following page. The full Workgroup met in June and October 1996 to develop the guidance for the new 305(b) cycle. Members also participated in numerous conference calls and focus group meetings to discuss key technical issues and develop materials for these Guidelines. EPA gratefully acknowledges thelr efforts, which have significantly improved the 305(b) assessment and reporting process.
Barry Burgan, National 305(b) Coordinator, led the development of these Guidelines and facilitated the efforts of the Workgroup. Research Triangle Institute and Tetra Tech, Inc., provided technical and logistical support under EPA Contract 68-C3-0303
EPA National Contacts
The primary contact regarding these Guidelines, the National Water Quality Inventory Report to Congress, and the Waterbody System (WBS) is:
Barry Burgan, National 305(b) and WBS Coordinator Office of Wetlands, Oceans and Watersheds Assessment and Watershed Protection Division, Monitoring Branch (4503F) U.S. Environmental Protection Agency 401 M Street, SW Washington, DC 20460 (202) 260-7060 (E-mail: [email protected]) (202) 260-1 977 (fax)
Other National Contacts:
Water enviromental indicators and Index of Watershed Indicators IIWI): Sarah Lehmann (202) 260-7021 ([email protected])
peach File IRF31: Tommy Dewald (202) 260-2488 ([email protected],gov)
: Tod Dabolt (202) 260-3697
. .ProbabWv-based Steve Paulsen or Phil Larsen (541) 754-4362 ([email protected] [email protected])
-:
al inteprity: Chris Faulkner (202) 260-6228 ([email protected])
3 3 : Mimi Dannel (202) 260-1897 ([email protected])
Clean:Anne Weinberg (202) 260-7107 ([email protected])
WBS User SUI)DOTt: Research Triangle Institute (91 9) 990-8637

TABLE OF CONTENTS
Volume 1: 305(b) Report Contents
Acknowledgements . . . . . . . . . . . . . . . . . . . . . . . . . . . . . . . . . . . . . . . . . ii List of Figures . . . . . . . . . . . . . . . . . . . . . . . . . . . . . . . . . . . . . . . . . . . . . vi List of Tables . . . . . . . . . . . . . . . . . . . . . . . . . . . . . . . . . . . . . . . . . . . . . .vii Acronym List . . . . . . . . . . . . . . . . . . . . . . . . . . . . . . . . . . . . . . . . . . . . . .ix
1 THE305(b)PROCESS . . . . . . . . . . . . . . . . . . . . . . . . . . . . . . . . 1-1 1.1 Blueprint for the Comprehensive 305(b) Guidelines . . . . . . . 1-1 1.2 Background on 305(b) Reporting . . . . . . . . . . . . . . . . . . . . 1-2 1.3 The Updated 305(b) Process . . . . . . . . . . . . . . . . . . . . . . . 1-3 1.4 Electronic Updates . . . . . . . . . . . . . . . . . . . . . . . . . . . . . 1-5 1.5 Rotating Basin SurveysIBasin Management . . . . . . . . . . . . 1-7 1.6 Comprehensive Assessments . . . . . . . . . . . . . . . . . . . . . . . 1-8 1.7 Performance Partnership Agreements . . . . . . . . . . . . . . . . . 1-9 1.8 Water Environmental Indicators . . . . . . . . . . . . . . . . . . . . . 1-9 1.9 Index of Watershed Indicators (IWI) . . . . . . . . . . . . . . . . . . 1-11 1.10 Vision and Long-term Goals . . . . . . . . . . . . . . . . . . . . . . . 1-12 1.11 Goals for the 1998 and Future 305(b) Cycles . . . . . . . . . . . 1-12 1.12 Tribal 305(b) Reporting . . . . . . . . . . . . . . . . . . . . . . . . . . . 1-21
2 SUMMARY OF CHANGES SINCE THE 1996 305(b) GUIDELINES . . . 2-1 2.1 New Format for the Guidelines . . . . . . . . . . . . . . . . . . . . . 2-1 2.2 New Information on the Context of 305(b) . . . . . . . . . . . . . 2-2 2.3 AnnualIBiennial Electronic Reporting . . . . . . . . . . . . . . . . . 2-2 2.4 Comprehensive and Targeted Coverage . . . . . . . . . . . . . . . 2-2 2.5 Individual Use Support . . . . . . . . . . . . . . . . . . . . . . . . . . . 2-2 2.6 Ground Water and Drinking Water . . . . . . . . . . . . . . . . . . 2-2
3 305(b) CONTENTS -- PARTS I AND II: SUMMARY AND BACKGROUND . . . . . . . . . . . . . . . . . . . . . . . . . 3-1 305(b) Contents -- Part I: Executive Summary/Overview . . . . . . . . 3-7
iii
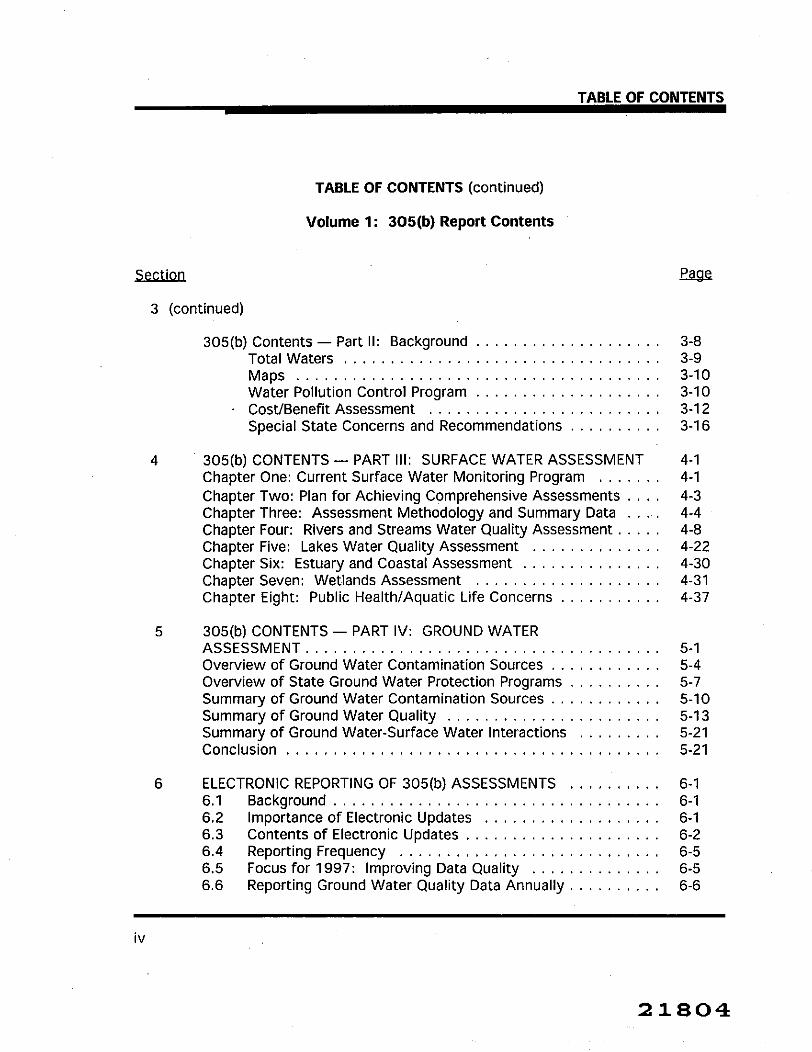
TABLE OF CONTENTS (continued)
Volume 1: 305(b) Report Contents
3 (continued)
305(b) Contents -- Part II: Background . . . . . . . . . . . . . . . . . . . . 3-8 Total Waters . . . . . . . . . . . . . . . . . . . . . . . . . . . . . . . . . . 3-9 Maps . . . . . . . . . . . . . . . . . . . . . . . . . . . . . . . . . . . . . 3-10 Water Pollution Control Program . . . . . . . . . . . . . . . . . . . . 3-10 CostlBenefit Assessment . . . . . . . . . . . . . . . . . . . . . . . . . 3-12 Special State Concerns and Recommendations . . . . . . . . . . 3-16
4 305(b) CONTENTS -- PART Ill: SURFACE WATER ASSESSMENT 4-1 Chapter One: Current Surface Water Monitoring Program . . . . . . . 4-1 Chapter Two: Plan for Achieving Comprehensive Assessments . . . . 4-3 Chapter Three: Assessment Methodology and Summary Data . . . . 4-4 Chapter Four: Rivers and Streams Water Quality Assessment . . . . . 4-8 Chapter Five: Lakes Water Quality Assessment . . . . . . . . . . . . . . 4-22 Chapter Six: Estuary and Coastal Assessment . . . . . . . . . . . . . . . 4-30 Chapter Seven: Wetlands Assessment . . . . . . . . . . . . . . . . . . . . 4-31 Chapter Eight: Public HealthlAquatic Life Concerns . . . . . . . . . . . 4-37
5 305(b) CONTENTS -- PART IV: GROUND WATER ASSESSMENT . . . . . . . . . . . . . . . . . . . . . . . . . . . . . . . . . . . . . . 5-1 Overview of Ground Water Contamination Sources . . . . . . . . . . . . 5-4 Overview of State Ground Water Protection Programs . . . . . . . . . . 5-7 Summary of Ground Water Contamination Sources . . . . . . . . . . . . 5-10 Summary of Ground Water Quality . . . . . . . . . . . . . . . . . . . . . . . 5-13 Summary of Ground Water-Surface Water Interactions . . . . . . . . . 5-21 Conclusion . . . . . . . . . . . . . . . . . . . . . . . . . . . . . . . . . . . . . . . .5-21
6 ELECTRONIC REPORTING OF 305(b) ASSESSMENTS . . . . . . . . . . 6-1 6.1 Background . . . . . . . . . . . . . . . . . . . . . . . . . . . . . . . . . . .6-1 6.2 Importance of Electronic Updates . . . . . . . . . . . . . . . . . . . 6-1 6.3 Contents of Electronic Updates . . . . . . . . . . . . . . . . . . . . . 6-2 6.4 Reporting Frequency . . . . . . . . . . . . . . . . . . . . . . . . . . . . 6-5 6.5 Focus for 1997: Improving Data Quality . . . . . . . . . . . . . . 6-5 6.6 Reporting Ground Water Quality Data Annually . . . . . . . . . . 6-6

7
TABLE OF CONTENTS
TABLE OF CONTENTS (continued)
Volume 1: 305(b) Report Contents
6 (continued)
6.7 Staff Needs. . . . . . . . . . . . . . . . . . . . . . . . . . . . . . . . . . . 6-7 6.8 File Format and Transfers . . . . . . . . . . . . . . . . . . . . . . . . . 6-7 6.9 Special Information for Non-WBS States . . . . . . . . . . . . . . 6-8
REFERENCES . . . . . . . . . . . . . . . . . . . . . . . . . . . . . . . . . . . . . . 7-1

TABLE OF CONTENTS
FIGURES
! l unbL Pa.!=
1-1 Recent Federal and State initiatives important to the 305(b) process 1-6
1-2 Hierarchy of nested watersheds. . . . . . . . . . . . . . . . . . . . . . . . . . 1-20
3-1 Schedule for the 305(b) Cycle . . . . . . . . . . . . . . . . . . . . . . . . . . . 3-4
4-1 Natural resources, Wando River Watershed . . . . . . . . . . . . . . . . . . 4-6
4-2 Activities potentially affecting water quality, Ashley River Watershed 4-6

TABLES
Reporting Requirements Satisfied by 305(b) Reports . . . . . . . . . . .
Atlas . . . . . . . . . . . . . . . . . . . . . . . . . . . . . . . . . . . . . . . . . . . .
Types of Information that States May Include on Their 303(d) Lists
Summary of Fully Supporting. Threatened. and Impaired Waters . . .
Individual Use Support Summary . . . . . . . . . . . . . . . . . . . . . . . . .
Total Sizes of Waters lmpaired by Various CauselStressor Categories
Total Sizes of Waters Impaired by Various Source Categories . . . . .
Trophic Status of Significant Publicly Owned Lakes . . . . . . . . . . .
Lake Rehabilitation Techniques . . . . . . . . . . . . . . . . . . . . . . . . . .
List of Clean Lakes Program Projects Active During 1996-1 998 Reporting Period . . . . . . . . . . . . . . . . . . . . . . . . . . . . . . . . . . . .
Acid Effects on Lakes . . . . . . . . . . . . . . . . . . . . . . . . . . . . . . . .
Sources of High Acidity in Lakes . . . . . . . . . . . . . . . . . . . . . . . . .
Trends in Significant Public Lakes . . . . . . . . . . . . . . . . . . . . . . . .
Development of State Wetland Water Quality Standards . . . . . . . .
4-1 3 Extent of Wetlands. by Type . . . . . . . . . . . . . . . . . . . . . . . . . . . . 4-36
4-1 4 Total Size Affected by Toxicants . . . . . . . . . . . . . . . . . . . . . . . . . 4-38
4-15 Waterbodies Affected by Fish and Shellfish Consumption Restrictions Due to Toxicants . . . . . . . . . . . . . . . . . . . . . . . . . . . . . . . . . . . .4-41
vii

TABLES (continued)
.eaE Waterbodies Affected by Fish Kills and Fish Abnormalities . . . . . . . 4-41
Summaryof Drinking Water Use Assessments for Rivers and
Summary of Drinking Water Use Assessments for Lakes and
Recommended Format for Use Support Data for States that Opt for
Recommended Format for Source Data for States that Opt for
Waterbodies Affected by Sediment Contamination . . . . . . . . . . . . 4-42
Waterbodies Affected by Shellfish Advisories due to Pathogens . . . 4-42
Waterbodies Affected by Bathing Area Closures . . . . . . . . . . . . . . 4-42
Summary of Contaminants Used in the Assessment . . . . . . . . . . . 4-45
Streams . . . . . . . . . . . . . . . . . . . . . . . . . . . . . . . . . . . . . . . . . .4-46
Reservoirs . . . . . . . . . . . . . . . . . . . . . . . . . . . . . . . . . . . . . . . . .4-46
Major Sources of Ground Water Contamination . . . . . . . . . . . . . . 5-5
Summary of State Ground Water Protection Programs . . . . . . . . . . 5-8
Ground Water Contamination Summary . . . . . . . . . . . . . . . . . . . . 5-11
Aquifer Monitoring Data . . . . . . . . . . . . . . . . . . . . . . . . . . . . . . . 5-17
Key Data Elements for Electronic Updates . . . . . . . . . . . . . . . . . . 6-3
Spreadsheets . . . . . . . . . . . . . . . . . . . . . . . . . . . . . . . . . . . . . . .6-10
Spreadsheets . . . . . . . . . . . . . . . . . . . . . . . . . . . . . . . . . . . . . .6-10
viii

TABLE OF CONTENTS
ACRONYM LIST
ADEQ Arizona Department of Environmental Quality ADWR Arizona Department of Water Resources ALUS Aquatic life use support ASTM American Society for Testing Materials AWQMN Ambient Water Quality Monitoring Network
BMP Best management practice BPJ Best professional judgement
CAFO Concentrated animal feeding operation CCC Criteria continuous concentration CLPMS Clean Lakes Program Management System CMC Criteria maximum concentration cso Combined sewer overflows CU USGS watershed cataloging unit CWA Clean Water Act CZARA Coastal Zone Act Reauthorization Amendments
DNREC Delaware Department of Natural Resources and Environmental Conservation DLG Digital line graph (database) DO Dissolved oxygen DOE Washington State Department of Ecology DQO Data quality objective DWFG 305(b) Drinking Water Focus Group
EMAP Environmental Monitoring and Assessment Program EPA U.S. Environmental Protection Agency
FDA U.S. Food and Drug Administration FlPS Federal Information Processing Standard FWS U.S. Fish and Wildlife Service-
GIs Geographic information system GPS Global positioning satellite system GRlS Grants Reporting and Tracking System

HUC
ITFM IWI
LAN LWQA
MCL MDL
NAS NAWQA NBS NHD NOAA NPDES NPS NRCS NSTP NWQMC
OGWDW OPPE ORD OST OW OWM owow
PACE
PCB PCS POTW PPA PS PSP PWS
Hydrologic Unit Code
ACRONYM LIST (continued)
Intergovernmental Task Force on Monitoring Water Quality Index of Watershed Indicators
Local Area Network Lake Water Quality Assessment
Maximum contaminant level Method detection limit
National Academy of Science National Ambient Water Quality Assessment Program National Biological Service National Hydrographic Dataset National Oceanic and Atmospheric Administration National Pollutant Discharge Elimination System Nonpoint source Natural Resources Conservation Service NOAA's National Status and Trends Program National Water Quality Monitoring Council (formerly ITFM)
Office of Ground Water and Drinking Water EPA Office of Policy, Planning, and Evaluation EPA Office of Research and Development Office of Science and Technology EPA Office of Water EPA Office of Wastewater Management EPA Office of Wetlands, Oceans, and Watersheds
Annual Census Bureau Survey of Pollution Abatement Costs and Expenditures Polychlorinated biphenyl EPA Permit Compliance System Publicly owned treatment works Performance Partnership Agreements Point source Paralytic shellfish poisoning Public water supply


Q A QC
RBP REMAP RF3 RTI
SCRFI SCS SDWA SOC SOP STORET
TDS TMDL TVA
UAA USACE USDA USFWS USGS
VOC
WBS WQC WET WLA WQL WQS WRC
ACRONYM LIST (continued)
Quality assurance Quality control
Rapid bioassessment protocol Regional Environmental Monitoring and Assessment Program EPA Reach File Version 3 Research Triangle Institute
Waterbody System Screenfile 1 Soil Conservation Service Safe Drinking Water Act
. Semi-volatile organic compound Standard operating procedure EPA STOrage and RETrieval system
Total dissolved solids Total maximum daily load Tennessee Valley Authority
Use attainability analysis U.S. Army Corps of Engineers U.S. Department of Agriculture U.S. Fish and Wildlife Service U.S. Geological Survey
Volatile organic compound
EPA Waterbody System Water quality criteria Whole effluent toxicity Waste load allocation Water quality limited Water quality standard Water Resource Council

SECTION 1
THE 305(b) PROCESS
1.IBlueprint for the Comprehensive 305(b) Guidelines
The goals for 305(b) include:
Comprehensive coverage characterizing all waters in each State, Territory, Interstate Water Commission, the District of Columbia and participating Tribes. Comprehensive coverage will lead to comprehensive national coverage.
Reducing paperwork while increasing the amount of assessed waters in each State, otherjurisdiction and participating Tribe.
Annual electronic updates of key information for all assessed waters during the previous year, starting with 1997 for pilot States ready to do so.
Georeferencing of 305(b) information to identify and map specific waterbodies, including whether they meet water quality standards. and to enable long-term tracking of trends.
More rapid real-time public availability of water quality information.
For 1998 and beyond, these 305(b) Guidelines ask each State, other jurisdiction and participating Tribe to:
Report electronically, preferably on an annual basis, as soon as the State can. Several States will be ready in 1997, many others by 1998.
Georeference 305(b) information to show the actual locations of the waters and whether they meet water quality standards. Quite a few States now can achieve this or are in the process of doing so; all should be able to do such computerized mapping by 2002.
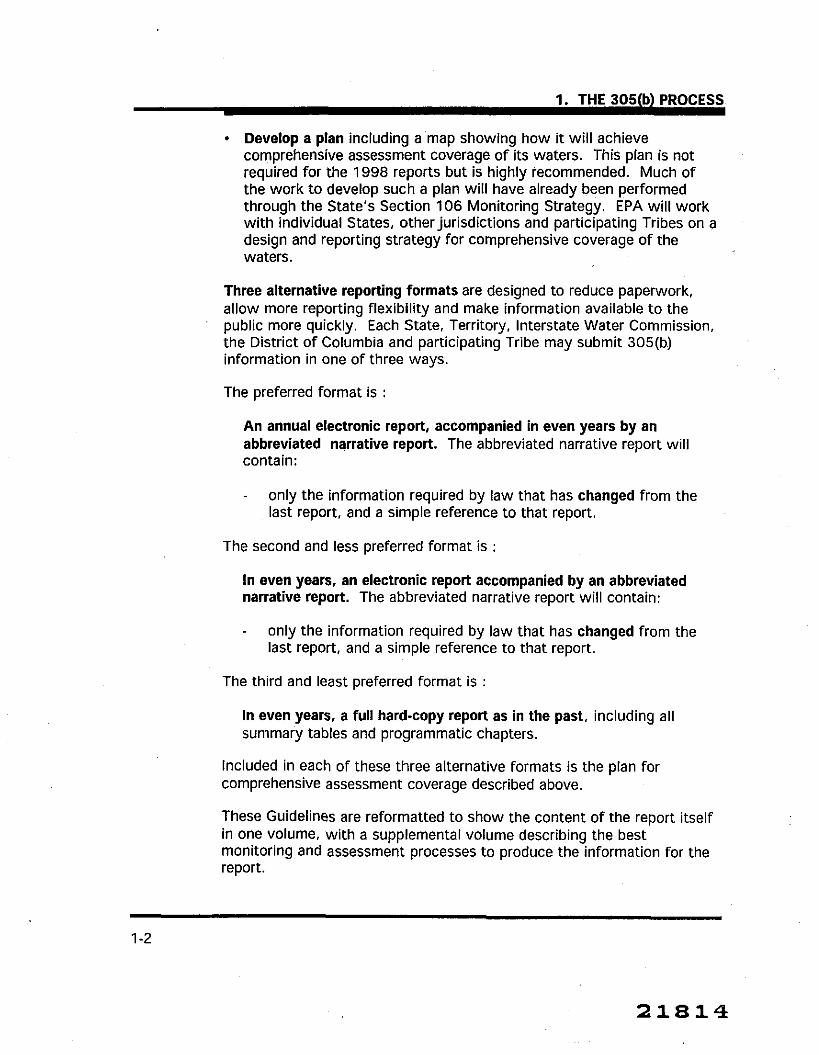
Develop a plan including a map showing how it will achieve comprehensive assessment coverage o f its waters. This plan is not required for the 1998 reports but is highly recommended. Much of the work to develop such a plan will have already been performed through the State's Section 106 Monitoring Strategy. EPA will work with individual States, other jurisdictions and participating Tribes on a design and reporting strategy for comprehensive coverage of the waters.
Three alternative reporting formats are designed to reduce paperwork, allow more reporting flexibility and make information available to the public more quickly. Each State. Territory, Interstate Water Commission, the District of Columbia and participating Tribe may submit 305(b) information in one of three ways.
The preferred format is :
An annual electronic report, accompanied in even years by an abbreviated narrative report. The abbreviated narrative report will contain:
- only the information required by law that has changed from the last report, and a simple reference to that report.
The second and less preferred format is :
In even years, an electronic report accompanied by an abbreviated narrative report. The abbreviated narrative report will contain:
- only the information required by law that has changed from the last report, and a simple reference to that report.
The third and least preferred format is :
In even years, a full hard-copy report as in the past, including all sunimary tables and programmatic chapters.
Included in each of these three alternative formats is the plan for comprehensive assessment coverage described above.
These Guidelines are reformatted to show the content of the report itself in one volume, with a supplemental volume describing the best monitoring and assessment processes to produce the information for the report.

The U.S. Environmental Protection Agency's (EPA's) national 305(b) Reports to Congress, published biennially in 1998 and future years, will include:
All information included in biennial Reports to Congress as in the past.
An added section describing progress in achieving comprehensive assessment coverage of the waters both nationally and State-by-State. This section will be cumulative in nature and will, over time, depict trends and all water quality information submitted to date.
EPA Assistance to States, other jurisdictions, and participating Tribes to achieve the 305(b) goals will include:
Financial resources to help support georeferencing of 305(b) information to Reach File 3 (RF3).
Technical assistance from experts in EPA Headquarters, Regions and the EPA Office of Research and Development's Environmental Monitoring and Assessment Program (EMAP).
1.2 Background on 305(b) Reporting
The Federal Water Pollution Control Act (PL92-500, commonly known as the Clean Water Act), as last reauthorized by the Water Quality Act of 1987 (PL100-4), establishes a process for States to use to develop information on the quality o f the Nation's water resources. The requirements for this process are found in Sections 106(e), 204(a), 303(d), 305(b), and 314(a) of the Clean Water Act (see Appendix A of the Guidelines Supplement). Each State must develop a program to monitor the quality of its surface and ground waters and prepare a report describing the status of its water quality. EPA is to compile the data from the State reports, summarize them, and transmit the summaries to Congress along with an analysis of the status of water quality nationwide. This 305(b) process is the principal means by which EPA, Congress, and the public evaluate whether U.S. waters meet water quality standards, the progress made in maintaining and restoring water quality, and the extent of remaining problems. In 1996, 56 States. Territories, Interstate Commissions, and Indian Tribes prepared 305(b) reports.
1.3 The Updated 305(b) Process
The updated 305(b) process will include comprehensive assessments of the State's waters using a combination of monitoring designs and

1. THE 305(b) PROCESS
evaluative techniques. Beginning in 1998, the States are encouraged to include in their 305(b) reports a map and plan for achieving the goal of comprehensive assessment coverage. EPA believes that much of the work to develop such a plan will have occurred through the Section 106 Monitoring Strategy process. States are being asked to achieve comprehensive assessment coverage as soon as possible and report in 1998 and subsequent 305(b) reports their status in achieving this goal.
Contents of Abbreviated Hard-copy 3050~)Reports
pART I: EXECUTIVE SUMMARY1OVERVIEW-Provide a new and revised version for each hard-copy report.
pART II: BACKGROUND (Atlas. Total Waters, Water Pollution Control Program, CostIBenefit Assessment, Special State Concerns and Recommendations)- Report on changes since last hard copy report*.
PARTI. (Monitoring Program, Assessment Methodology and Summary Data, etc.)
Include plan and status of achieving comprehensive assessments; in addition, report on changes since last hard-copyreport*.
. Summary tables for riventstreams, lakes, and estuaries are optional if electronic reports of all key data are submitted electronically, which will allow EPA to calculate summaries. However, if the State is using a probability-based monitoring network, report overall network results in the hard-copy 305(b) reports (include waterbody-leveldata for that network in the assessment database).
Update Clean Lakes tables and wetlands section and tables if significant changes occurred since last hard-copyreport*.
PART IV: GROUND WATER ASSESSMENT (Overview of Ground Water ContaminationSources and Protection Programs; Summaries of Contamination Sources, Ground Water Quality, and Ground Water-SurfaceWater Interactions)-Report on changes since last hard-copyreport*. Summary tables are optional if State provides them via electronic reporting.
* Where no significant changes have occurred since the last 305(b) report within any subsection of this Part, report that no changes have occurred.

EPA is updating the 305(b) process to allow States to take advantage of modern information technology to provide more current and comprehensive information on the status of the Nation's waters. Three alternative reporting formats are designed to reduce paperwork, allow more reporting flexibility and make information available to the public more quickly. Each State, Territory, Interstate Water Commission, the District of Columbia and participating Tribe may submit 305(b) information in one of three ways. The three formats are described in Section 1. I , Blueprint for the Comprehensive 305(b) Guidelines.
EPA will use all reports and electronic updates described above to report biennially to Congress on the status of the Nation's waters. The Report to Congress will include a new section which shows the progress made by the States, other jurisdictions, and participating Tribes toward the goal of comprehensive coverage of waters.
States that are implementing rotating basin management plans might choose to transmit electronic updates annually covering the basins, and any other waters assessed, over the previous year. The goal is to have all States participating in annual electronic reporting by the year 2000. Such States also might find i t more convenient to prepare their hard-copy reports on an annual basis as well, to synchronize with their basin management plans.
Beyond the national uses of the State 305(b) reports, there are many State-specific and local uses. To meet these needs and provide comprehensive programmatic information and data, EPA encourages States selecting the first or second option to prepare a full hard-copy report periodically, including complete programmatic chapters, maps, and summary tables as described in Sections 3 through 6 of these Guidelines.
This new, comprehensive 305(b) cycle supports several recent Federal and State initiatives:
Comprehensive monitoring and assessments
Rotating basin surveys and basin management
Reduction of paperwork burden through the use of electronic reporting of State assessment data
Water environmental indicators including the Index of Watershed Indicators (IWI)
Performance Partnership Agreements (PPAs)

Figure 1-1shows how some of these initiatives are related to each other, and Sections 1.4 through 1.9describe these initiatives in more detail.
1.4 Electronic Updates
The StateIEPA 305(b) Consistency Workgroup agreed on the need for periodic, electronic updates from the States on their waterbody-level assessments. Resources saved by switching to abbreviated hard:copy 305(b) reports should be put toward improved data management and

Figure 1-1 not available in electronic form

electronic reporting. EPA and the Workgroup find such updates important for two reasons:
EPA needs the data for biennial reports to Congress, Clean Water Act reauthorization, and other national planning activities
Assessments and data management should be ongoing activities, not performed in haste prior to preparation of a 305(b) report.
Contents of AnnualIBiennial Electronic Updates
. The State's waterbody-levelassessment data tiles for assessments completed in previous calendar year(s). I f more convenient, the State may send its updated 305(b) assessment database for the entire State, providedthe assessment dates are included for each waterbody.
. If the State is using a probability-based monitoring network, include waterbody level data for that network in the assessment database but report overall network results in hard-copyreports.
A GIs coverage showing assessment results since last update or hard-copy maps showing assessment results
The bulk of a State's Metadata for the above files including a brief data dictionary
electronic update will consist of waterbody-level Updated ground water assessment tables in assessment data for database, spreadsheet, or word processing assessments completed in format previous calendar year(s). These data files can be EPA Waterbody System files or State-developed databases files. I t is extremely important that the State files be submitted in a format that EPA can convert to standard national 305(b) codes as described in Section 6. We will work with States to help ensure database compatibility and national consistency. Annual electronic reporting should not be a large burden for most States. Nearly 40 States transmitted the same types of assessment data in electronic form during 1995-96.
EPA is offering technical support to States that need to create or upgrade assessment databases. Other components of a State's electronic update are listed in the box entitled "Contents of AnnualIBiennial Electronic Updates."
In even-numbered years beginning in 1998, annual electronic updates are due April 1 with the abbreviated narrative reports. In odd-numbered years, annual electronic updates should be transmitted to EPA in April i f possible, although they can be transmitted over the summer. StateslTribes with existing electronic reporting capability are encouraged

to submit their 1997 updates by the end of December 1997. This update consists of (1) assessment data for State-defined watersheds or those basins or €!-digit U.S. Geological Survey (USGS) cataloging unit (CU) watersheds assessed in the previous calendar year as well as any additional waters assessed in the previous calendar year, or (2) the entire statewide database as updated.
If a State is unable to transmit an electronic update of their assessment data in a given year, the State should send a biennial electronic update by April 1 of the following year covering waters assessed in the previous two calendar years. See Section 6 for more information on electronic reporting, a detailed list of data elements, and "data rules" for ensuring compatibility with standard national codes and formats.
1.5 Rotating Basin Su~eys/Basin Management
Approximately half of the States have implemented statewide basin management approaches that include rotating basin monitoring. Typically, such States assess one-third to one-fifth of their watersheds or basins in a single year, so that all watersheds or basins are assessed over a three to five year period. Annual electronic updates include assessment data primarily for those basins or watersheds assessed in the previous calendar year as well as assessments routinely completed in other parts of the State during the previous year(s). This should not present a problem if States keep their assessment databases up-to-date. States that have not yet done so should consider adopting a rotating-basin approach for water quality assessment and management.
A comprehensive assessment of all State waters should be accomplished as quickly as feasible. Through a rotating basin survey approach, comprehensive assessments can often be achieved over a five year cycle or less. The advantage of this approach is that i t allows greater coverage of State waters than historical practices, through a combination of probabilistic monitoring techniques and the efficiencies of integrated watershed management.
1.6 Comprehensive Assessments
EPA and the States have established a long-term goal of comprehensively characterizing all surface and ground waters of each State using a variety of techniques targeted to the condition of, and goals for, the waters. These techniques may include a combination of traditional targeted monitoring and probability-based designs. To help ensure national progress toward this goal, each State is encouraged to include in its 1998

305(b) report a plan for comprehensive monitoring and assessment of its waters. Section 4 describes the contents of this plan.
Probability-based Monitoring (Sample Su~eys )
No State has sufficient monitoring resources to sample all its waters. With probability-based monitoring, a State can report assessment results for the target resource as a whole (e.g., all headwater streams) notjust those waters that have been monitored. These assessment results are unbiased and include confidence limits. Several States including Maryland, Delaware and Indiana are incorporating this approach. EPA can provide technical support for designing probability-based monitoring networks to supplement existing networks through its Environmental Monitoring and Assessment Program (EMAP) staff who have extensive experience designing and conducting probability-based monitoring.
In order to provide for national and regional consistency, EPA and State monitoring staff should discuss preparation of this plan, including ways to adapt their current monitoring program to achieve comprehensive monitoring. See Section 2 and Appendix I of the Guidelines Supplement for more information about different monitoring designs for achieving comprehensive assessments.
1.7 Performance Partnership Agreements
More than 30 States are entering into Performance Partnership Agreements (PPAs) with EPA. PPAs give the States more flexibility to set their own programmatic priorities. In return, measuring environmental performance and reporting on certain environmental indicators are among the activities States agree to perform when entering a PPA. A Performance Partnership begins with a comprehensive assessment of a State's problems and conditions to establish a stronger basis for decision- making. Based on this information, the State proposes environmental and public health objectives and an action plan as a basis for negotiating a PPA with EPA. At this point, if not before, the State also conducts outreach efforts to ensure appropriate public understanding and support.
Next, EPA and the State begin negotiating the actual agreement. Ideally, the PPA includes specific roles for EPA and the State, including how EPA's oversight of State roles will be reduced in those areas of strong performance. In addition, i t includes indicators of environmental and program management performance to better measure success.

An added element of PPAs is grants flexibility. States are given a new option of combining two or more single-media grants into a single Performance Partnership Grant. For example, a State could propose a single grant combining CWA Section 106, 104(b)(3), and 319 grants and Safe Drinking Water Act public water supply and underground injection grants. Thus, PPAs give the States and Tribes increased flexibility to set programmatic and funding priorities. PPAs also offer administrative savings and improved environmental performance monitoring through agreed-upon environmental indicators.
1.8 Water Environmental lndicators
In return for increased flexibility, States implementing PPAs agree to measure certain environmental indicators. €PA Office of Water, in conjunction with States and other public and private agencies, have developed a suite of 18 water environmental indicators to track environmental progress. These were published in June 1996 in the report Environmental lndicators of Water Quality in the United States (€PA 841-F-96-001). EPA intends to publish an indicators report periodically to measure progress toward national goals, milestones, and objectives. Each State and its €PA Region will work together to include the 18 indicators in the StateIEPA PPA. Appendix C of the Guidelines Supplement includes fact sheets for these 18 water indicators and their reporting frequencies as recommended by the 305(b) Consistency Workgroup.
The 305(b) Workgroup recommended that two of the 18 indicators be reported in State 305(b) reports and annual electronic updates:
Individual use support for drinking water, aquatic life, recreation, and shellfish and fish consumption (in 305(b) reports and electronic updates)
Biological integrity (see Guidelines Supplement, Section 4).
Through the indicators process, €PA will be collecting and reporting on data from many national-level databases. States and Tribes already provide this information to EPA through other reporting mechanisms. Except for species-at-risk data, which come from the Nature Conservancy's aggregation of State Natural Heritage databases, the following nine indicators are from €PA-maintained databases. In preparing the national Report to Congress, €PA will draw from the information included in these databases.

-
Fish and Wildlife Consumption Advisory Database
Contaminated sediments
Selected point source loadings to surface water and through Class V wells to ground water
Population served by community drinking water systems violating public health standards
Population served by community drinking water systems exceeding lead actions levels
Number of community systems with source water protection programs
Species at risk
Surface water pollutants
Population served by unfiltered surface water systems at risk from microbiological pollution (Note: this indicator is no longer being used to track national water quality)
EPA will provide to the States and Tribes at least six months preceding their 305(b) report submissions the most current output from these national databases for their review. States are requested to use these data where appropriate in their assessments.
For the following seven indicators, EPA will collect information from national data sets that are not necessarily developed in conjunction with States and Tribes as are the above nine indicators. Most of these data are aggregated and reported by other Federal agencies. EPA will use these data sets to supplement State and Tribal assessments in the Report to Congress.
Shellfish bed conditions Wetland acreage Ground water pollutants: nitrate Coastal water pollutants in shellfish Estuarine eutrophication conditions Nonpoint source sediment loadings from cropland Marine debris

NOTE: The lndex of Watershed lndicators project (see below) has added three indicators to the original 18; EPA will also acquire data for these three indicators from national datasets. They are:
Population change Hydrologic modification causes by dams Urban runoff potential
1.9 lndex of Watershed lndicators (IWI)
IWI is an EPA initiative to make available to the public water quality information at the watershed level. The Office of Water and its many public and private partners are using theirjoint information on the key water indicators to characterize the conditions of the 2.1 11 USGS %-digit CUs in the conterminous United States (Alaska and Hawaii will come later). The objectives of IWI include:
Characterize the Nation's watersheds and identify watersheds at risk Serve as a baseline for dialogue among public and private partners Empower citizens to learn about and protect their watersheds Measure progress toward a goal of healthy, productive watersheds
To accomplish these objectives, EPA aggregated information on the key environmental indicators-including the States' 1994 waterbody-level use support data-to the CU level. EPA then created an overall characterization of relative watershed condition based on these multiple data types. After review by the States, the index of watershed health was made available in July 1997 to the public via EPA's Surf Your Watershed page on the World Wide Web. Surf Your Watershed is an electronic index to provide data, maps and text to users on a thematic as well as geographic basis. It can be found at http:/www.epa.gov/surf.
Through IWI, EPA and its partners are learning a great deal about strengths and weaknesses of the Nation's water quality assessments. A common issue for many States is the relatively low percentage of waters assessed in a two-year period and a bias toward assessing known problem waters. One solution for these States is to incorporate probability-based monitoring to achieve more comprehensive assessments and eliminate bias. For this reason, achieving more comprehensive assessments is listed in Sections 1.I0 and 1.I 1 as both a long-term goal and a special goal for the 1998 305(b) process.
1.10 Vision and Long-term Goals

The text boxes on the next few pages contain the vision and long-term goal statements for State 305(b) reports and the National Water Quality Inventory Report to Congress.
I .I I Goals for the 1998 and Future 305(b) Cycles
EPA establishes goals or themes for each 305(b) reporting cycle to promote achievement of the vision and long-term goals for the 305(b) process and to

coordinate reporting efforts among the States, Territories, Interstate Commissions, and Tribes. The goals for 1998 are to:
Expand use of biological indicators and reporting
Improve data management and institute annuallbiennial electronic reporting
Achieve comprehensive assessment coverage (complete spatial coverage)
lncrease assessments of drinking water use support
Document and improve assessment quality
lncrease the use of visuals in presenting information (e.g., GIs maps)
Develop a process for reporting by hydrologic unit (georeferencing)

-
Vision for State 305(b) Reports and the National Water Quality Inventory Reports to Congress
(adopted by 305(b) Consistency Workgroup in 1995)
The 305(b) reports will characterize water quality and the attainment of water quality standards at various geographic scales. In doing so, the StateTTerritoryIlnterstate Commission and Tribal reports, as well as the National Water Quality Inventory, will
Comprehensively characterize the waters of the States, Tribes, Territories, and the Nation. including surface water, ground water, coastal water, and wetlands Use data of known quality from multiple sources to make assessments Indicate progresstoward meeting water quality standards and goals Describe causes of polluted waters and where and when waters need special protection Support watershed and environmentalpolicy decision making and resource allocation to address these needs Describe the effects of prevention and restoration programs as well as the associated costs and benefits In the long term, describe assessment trends and predict changes Initiate development of a comprehensive inventory of water quality that identifies the location and causes of polluted waters and that helps States, Tribes, and Territories direct control programs and implement management decisions.

Long-term Goals for the 305(b)Process-The Report to Congress continues to meet Clean Water Act (CWA) requirements and be a primary source of national information on water quality. The State and national 305(b) reports meet CWA reporting requirements, which include reporting on the achievement of water quality standards and designated uses, recommendations for actions to achieve these uses, and estimates of the environmental impact, costs, and benefits of achieving these uses. The assessment data that form the basis of the reports become more useful and accessible to decision makers by increased use of tools such as a modernized STORET; the EPA Waterbody System (WBS); the EPA Reach File Version 3 (RF3) and, when available, the National Hydrography Dataset (NHD); and geographic information systems (GISs). The reports move toward reporting assessment data by watershed andlor CU and State; data management tools allow consolidation at both levels. The reports also satisfy other needs identified by State 305(b) staff: educating citizens and elected officials, helping to focus resources on priority areas, consolidatingassessments in one place, consolidating CWA-related lists of impaired waters, identifying data gaps, and reporting the results of comprehensive assessments.
at and Contern
Report format and content remain relatively stable with some improvementseach cycle, such as:
- increased use of GIs maps - more emphasis on watershed protection, ecological indicators, and biological integrity - increasedemphasis on Regionaland Tribal water quality issues - increased input from sources outside 305(b) such as EPA's Environmental Monitoring and
Assessment Program (EMAP), the Biological Resources Division of the U.S. Geological Survey (USGS) (formerly the Departmentof Interior's National Biological Service), the USGS National Ambient Water Quality Assessment (NAWQA) Program, the National Oceanic and Atmospheric Administration's National Status and Trends Program, the National Wetlands Program of the U.S. Fish and Wildlife Service, and the National Water Quality Monitoring Council (formerly the IntergovernmentalTask Force on Monitoring Water Quality or ITFM).
The full Report to Congress andlor the Summary Report become available in electronic format on the information superhighway; platforms may includethe Internet or CD ROM.
(continued)

Long-term Goals (continued)
The reports comprehensively characterize the condition of the waters of the States, Territories, Tribes, and the Nation. . States make greater use of data from Federal agencies, all appropriate State agencies, local governments, and nongovernmental organizations to increase the extent of State assessments each 305(b) cycle.. Between 305(b) cycles. States keep their monitoring and assessment databases current to simplify report preparation and increase the usefulness of assessment data.
. States adopt improved monitoring and assessment methods as recommended by the ITFM and reported in the 305(b) reports.The reports include assessments of ground water aquifers. . States increase efforts to achieve reproducible assessments; i.e., once an assessment methodology has been set, the use support determination for any waterbody becomes independentof the individualassessor. . States identify the quality of individual assessments beginning with aquatic life use support for wadable streams and rivers Also, States describe their assessment methods in detail and include flow charts of these methods. . Assessments begin early in each cycle to allow time for adequate quality assurance of State reports and WBS or State-specific databases. States and EPA georeference State waterbodies to RF3 or, when available, NHD to allow mapping of impaired waters. At the 305(b) Workgroup's recommendation, at least one staff position per State is devoted to managing and analyzing assessment data, with a dedicated personal computer and GIs support. The ITFMand EPA's Section 106 monitoring guidelines recommend a multi-disciplinaryState assessment team.

Expand Use of Biological Indicators and Reporting
EPA and the States have long recognized the importance of developing, implementing, and supporting ambient biological assessment programs to report on the overall health of aquatic ecosystems. Biological indicators reveal whether an ecosyslem is functioning properly and is self-sustaining. This information will assist States, Territories, Tribes, and Interstate Commissions in measuring progress toward achieving the CWA objective of biological integrity and determining attainment of designated aquatic life uses. EPA strongly recommends using an integrated assessment involving biological, habitat, physical/chemical, and toxicity monitoring. Sections 3 and 4 of the Guidelines Supplement contain improved guidance for aquatic life use support determinations and guidance for voluntary pilot biological integrity determinations.
EPA, the Intergovernmental Task Force on Monitoring Water Quality (ITFM), and the 305(b) Consistency Workgroup have concluded that increased capability and use of biological assessment tools at the State level will result in more consistent and accurate reporting of designated use attainment in the National Water Quality Inventory Report to Congress.
Improve Data Management and Institute AnnuallBiennial Electronic Reporting
Waterbody-specific information is needed to comply with requirements under Sections 319, 314, and 303(d) of the Clean Water Act and to answer key programmatic questions. State assessment data are also receiving much wider scrutiny now than ever before due to such initiatives as IWI. To improve data consistency and usefulness, simplify preparation of State reports, and provide a management tool for States, EPA developed a computerized data system, the Waterbody System (WBS), to manage the waterbody-specific portion of the 305(b) information.
Extensive analysis of State assessment databases for IWI has identified several areas for improvement for 1998. These problems greatly hamper national analysis; solving them would help ensure that EPA properly interprets State data. These problem areas are:
Several States do not store sizes affected by sources or causes/stressors State-specific codes are sometimes not clearly defined Several States do not have electronic assessment databases at all

EPA intends to provide detailed feedback to each State about its 1996 assessment database and suggest ways to resolve such issues.
WBS users have recommended the following for the 1998 cycle:
Maintain stability in basic WBS operations and file structure
Develop a Windows version of WBS
Continue reach-indexing waterbodies to the EPA Reach File (RF3) or, when available, the National Hydrography Dataset (NHD), in interested States
Provide additional hands-on WBS and RF3lNHD training
Promote the establishment of a full-time position for water quality assessments and database management in each State and EPA Region; the person in this position would maintain ongoing familiarity with WBS andlor the appropriate customized State 305(b) database and ensure data quality
Continue to provide technical support to States that choose to use WBS. Work with other States to provide EPA with WBS-compatible data files sufficiently complete for EPA to aggregate.
EPA is implementing those recommendations for which it has authority for the 1998 cycle. The updated version of WBS will retain the same core programs and user-friendly concepts (pop-up windows, pick lists) as the previous version. EPA will provide an updated WBS and installation instructions to States soon after transmittal of final 305(b) Guidelines. EPA contacts for the WBS are the Regional 305(b) or WBS Coordinators and the National WBS Coordinator (see page ii).
EPA expects all States to fully implement the WBS or a WBS-compatible system. EPA has provided WBS users with technical assistance since 1987 and will continue to do so. WBS and customized State assessment databases will be the vehicles by which States will transmit their annual electronic updates beginning in April 1998 (in 1997 for some States). See Section 6 for more information on these updates.

Assessment Database Managers-Text boxes with this PC logo appear in several sections of these Guidelines. These boxes give important information and helpful hints for ensuring accurate databases that will meet EPA's requirements.

1. THE 305(b) PROCESS
Achieve Comprehensive Assessment Coverage (Complete Spatial Coverage)
EPA established the following goals for the 1998 cycle and beyond:
States progress toward characterizing surface and ground waters comprehensively (in keeping with the State's rotating basin approach i f applicable) using a variety of techniques targeted to the condition of, and goals for, the waters. These techniques may include probability-based sampling designs to enable inferences about entire categories of waters (e.g., all wadable streams) from a subset of waterbodies.
States include information from Federal agencies and other relevant organizations in their 305(b) reports to increase the breadth or extent of assessments.
To help ensure national progress toward this goal, each State is asked to include in its 1998 305(b) report a plan for comprehensive monitoring and assessment of its waters. Section 4 describes the contents of this plan. Section 2 of the Guidelines Supplement contains recommendations for using a combination of targeted and probability-based monitoring to achieve more comprehensive assessments.
Increase Assessments of Drinking Water Use Support
One of the findings of the last two 305(b) reporting cycles is the relatively low percentage of waters that have been assessed for drinking water designated use nationwide. EPA strongly encourages States to focus resources on increasing the percentage of waters assessed for this use and on enhancing the accuracy and usefulness of these assessments. This goal is consistent with EPA's source water protection initiative under the 1996 Amendments to the Safe Drinking Water Act. States are encouraged to use source water assessments to delineate watershed areas (source water protection areas) for all public water systems and thereby increase the assessment of source waters for drinking water use. The States also are encouraged to use this information from the source water assessments in their 305(b) reports.
Document and Improve Assessment Quality
In the past, fewstates have tracked measures of assessment or data quality in their 305(b) assessments. For 1998, the Guidelines ask States to assign assessment quality levels to the aquatic life use support

assessment for each wadable river or stream waterbody (see Section 3.2 of the Guidelines Supplement).
Such measures will be useful at the State level in planning and evaluating monitoring programs. For example, a State might find that assessments in a particular basin need to have a higher level of information before spending large sums of money to implement controls there.
EPA will not report assessment description information at the national level. Rather, EPA will use the information to determine the strengths and limitations of State monitoring and assessment programs and improvements needed, eventually helping to increase comparability of assessments among States. This is especially important, for example, in ecoregion studies that cross State boundaries or in Regional comparisons.
Increase the Use of Visuals in Presenting Information
A great deal of information about use support, causes/stressors, and sources of impairment can be presented in a single map or other illustration. Several States have made effective use of color maps and photographs in recent reports. GIS technology and the data to support it, such as WBS datasets, are becoming available in more State water quality agencies each 305(b) cycle. EPA is currently providing technical support to States to georeference their waterbodies to RF3, EPA's national hydrologic database, to facilitate GIS applications.
The goal for 1998 is for each State to include maps showing, at a minimum, use support, causes, and sources. Color maps are preferred because of the wide range of information they can present. EPA is making sample maps available to State and Regional 305(b) Coordinators; contact the National 305(b) Coordinator.
Develop a Process for Reporting by Hydrologic Unit (Georeferencing)
Historically, States have tracked use support at two levels: the individual waterbody level and statewide. Modern information technology makes i t possible to track assessments at other levels with relatively little additional effort. In addition to the individual waterbody or stream- segment level, the most useful levels to water quality managers are the small watershed, the large watershed (e.g., the USGS 8-digit CU), the river basin, and the ecoregion. Figure 1-2 shows four of these different levels.

1. THE 305(b) PROCESS
The goal for 1998 is to move closer to full integration of assessment information at all scales. Fully integrated assessment information would mean
All waterbodies are georeferenced to RF3 (i.e., assigned locational coordinates for GIs mapping and analysis).

figure not available in electronic form
Figure 1-2. Hierarchy of nested watersheds (adapted from GIs coverages for the Upper Tar-Pamlico River Basin, NC; RTI, 1994)

1. THE 305(b) PROCESS
Watersheds, basins, and other hydrologic units are selected to "nest" within one another and to share common boundaries wherever possible.
Assessment reports and maps can be generated electronically at any hydrologic level and by ecoregion.
Assessment results are consistent among 305(b) reports, watershed plans, basin plans, and other State reports.
Careful data integration is key to the goal of aggregating assessments at different hydrologic units. For this reason, EPA is providing technical support to the States for georeferencing waterbodies. Some States are revising their watershed boundaries to be consistent with other agencies' boundaries. As States upgrade their information systems and make greater use of GIs, WBS, and other tools, EPA is confident that this goal will eventually be achieved nationwide.
To ensure progress toward this goal, EPA asks each State to include in its 1998 305(b) report a plan for georeferencing its waterbodies (streams, lakes, estuaries and ocean shorelines) to RF3. If a State wishes to use a hydrographic coverage other than RF3 with similar or better resolution, the plan should address how this will be achieved and how it will be linked to RF3 to enable national coverage. States that have already georeferenced their waterbodies should simply document the process and the hydrographic coverage they used. As described in Section 4, this georeferencing plan can be included in the State's plan for achieving comprehensive assessments.
1.12 Tribal 305(b) Reporting
€PA encourages Native American Tribes to develop the capability to assess and report on the quality of Tribal water resources. The development of a Water Quality Assessment Report under Section 305(b) of the Clean Water Act provides a method for Tribal decision makers to assess monitoring data in a meaningful way and use this information to guide efforts to care for Tribal water resources. The process offers an opportunity for a Tribe to call national attention to issues such as fish tissue and groundwater contamination from toxic chemicals, and provides a vehicle for recommending actions to EPA to achieve the objectives of the Clean Water Act and protect Tribal waters for cultural or ceremonial needs.
Native Americans are exempted from the Clean Water Act reporting requirement under Section 305(b) (Federal Register, Vol. 54, No. 68.
April 11, 1989, p. 14357). However, several Tribal entities including the Hoopa Valley Reservation in California and the Gila River Community in Arizona have prepared 305(b) reports. This reporting process has allowed these Tribes to go beyond reporting summaries of raw data and to identify the pollutants and stressors causing impairment of Tribal waters and the sources of these stressors where possible.
The Guidelines Supplement contains a summary of key items for first-time Tribal reports (Appendix F). Also, EPA has prepared a booklet describing the basics for Tribal 305(b) reporting and potential advantages to Tribes that choose to report through the 305(b) process--Knowing Our Waters: Tribal Reporting under Section 305(b) (EPA 841 -8-95-003). This booklet is available through EPA Regional 305(b) Coordinators.
EPA encourages Tribes to work with appropriate Federal or State agencies to facilitate technical transfer of methods and data to enhance the Tribes' capabilities and ensure coverage of Tribal waters. Tribes are encouraged to prepare their own 305(b) reports, prepare a joint report about Tribal waters with the appropriate State water quality agency, or contribute assessment data to the State 305(b) report.


2. SUMMARY OF CHANGES SINCE THE 1996 305(b) GUIDELINES
SECTION 2
SUMMARY OF CHANGES SINCE THE 1996 305(b) GUIDELINES
This section summarizes changes since the 1996 Guidelines. The changes are grouped below by topic.
2.1 New Format for the Guidelines
- These Guidelines are presented in two documents. The volume you are reading now describes the information to be included in State 305(b) reports. A separate Guidelines Supplement includes extensive information on recommended procedures for conducting assessments developed over the past 10 years by EPA and the 305(b) Consistency Workgroup
New material since 1996 is contained in the Guidelines Supplement and its Appendixes:
Appendix B: Benefits of Rotating Basin Monitoring and Assessment: South Carolina
Appendix C: Water Environmental Indicators and 305(b) Reporting
Appendix D: Data Dictionary for Annual Electronic Reporting
- Appendix G: Definitions of Selected Source Categories
- Appendix I: 305(b) Monitoring and Assessment Design Focus Group Handouts
- Appendix K: Section 106 Monitoring Guidance and Guidance for 303(d) Lists
- Appendix M: Section 319 v. 314 Funding

2.2 New Information on the Context of 305(b)
Section 1 of this volume describes the linkages among the 305(b) cycle, annual electronic reporting, georeferencing, national water environmental indicators, Performance Partnership Agreements, and other recent initiatives.
A brochure entitled "The Updated 305(b) Cycle: Advantages. Context, and Expectations" accompanies these Guidelines. It is intended for management of State water agencies, explaining the above concepts and linkages.
2.3 AnnuallBiennial Electronic Reporting
Electronic updates of the 305(b) databases are key to the 305(b) process for 1998 and beyond; Section 6 of this volume describes data elements, format, and other matters.
Electronic reporting will include a new voluntary pilot biological integrity indicator. Section 4 of the Guidelines Supplement describes an approach to measuring and reporting this indicator. States/Tribes will only report the indicator in annual electronic reporting.
2.4 Comprehensive and Targeted Coverage
Sections 1.6 and 4 of this volume and Section 2 of the Guidelines Supplement contain information on achieving the long-term goal of comprehensively characterizing all waters of the State on a regular basis. This includes descriptions and brief examples of different monitoring designs that a StateITribe can use to make defensible statements about use attainment of all its waters.
2.5 Individual Use Support
Section 3 of the Guidelines Supplement includes expanded guidance for making aquatic life use support decisions, including additional information on using habitat and toxicity data and case studies of assessments involving multiple data types
2.6 Ground Water and Drinking Water
Section 5 of this volume contains revised guidance for reporting ground water assessments of aquifers or hydrogeologic settings based on work by the 305(b) Ground Water Subgroup

Section 3.5 of the Guidelines Supplement contains recommendations for making drinking water use assessments based on work by the 305(b) Drinking Water Subgroup


SECTION 3
305(b) CONTENTS -PARTS IAND II: SUMMARY AND BACKGROUND
States must transmit their water quality assessments (Section 305(b) reports) to the EPA Administrator by April 1, 1998, with draft reports to their EPA Regional Offices for review and comment no later than February 1, 1998. EPA requests that the States submit five (5) copies of their final reports to:
Barry Burgan National 305(b) Coordinator Assessment and Watershed Protection Division (4503F) U.S. Environmental Protection Agency 401 M Street, SW Washington, DC 20460.
The EPA Regional Office may require additional copies,
The updated 305(b) process requires comprehensive assessments of the State's waters using a combination of monitoring designs. Beginning in 1998, States are encouraged to include in their 305(b) reports a map and plan for achieving the goal of comprehensive assessment coverage. States should achieve comprehensive assessment coverage as soon as possible and report in 1998 and subsequent 305(b) reports their status in achieving this goal.
EPA is updating the 305(b) process to allow States to take advantage of modern information technology to provide more current and comprehensive information on the status of the Nation's waters. Three alternative reporting formats are designed to reduce paperwork, allow more reporting flexibility and make information available to the public more quickly. Each State, Territory, Interstate Water Commission, the District of Columbia and participating Tribe may submit 305(b) information in one of three ways.
The preferred format is:

An annual electronic report accompanied in even years by an abbreviated narrative report. The abbreviated narrative report will contain:
- only the information required by law that has changed from the last report, and a simple reference to that report.
The second and less preferred approach is:
In even years, an electronic report accompanied by an abbreviated narrative report. The abbreviated narrative report will contain:
- only the information required by law that has changed from the last report, and a simple reference to that report.
The third and least preferred approach is:
In even years, a full hard-copy report as in the past, including all '
summary tables and programmatic chapters.
Included in each of these three alternative formats is the plan for comprehensive assessment coverage described above.
€PA will use all reports and electronic updates described above to report biennially to Congress on the status of the Nation's waters. The Report to Congress will include a new section which shows the progress made by the States, other jurisdictions, and participating Tribes toward the goal of comprehensive coverage of waters.
Beyond the national uses of the State 305(b) reports, there are many State-specific and local uses. To meet these needs and provide comprehensive programmatic information and data, EPA encourages States selecting the first or second option to prepare a full hard-copy report periodically, including complete programmatic chapters, maps, and summary tables as described in Sections 3 through 6 of these Guidelines.
None of the reporting formats relieve the States of any specific grant reporting requirements under related programs such as Sections 314 or 319.
The remainder of this Section of the Guidelines describes the requirements for full hard-copy 305(b) reports. For information about contents of the abbreviated hard-copy reports under the first or second option, see the text box in Section 1.3 of these Guidelines entitled "Contents of Abbreviated Hard-copy 305(b) Reports."

The StatelEPA 305(b) Consistency Workgroup agreed on the need for periodic, electronic updates from the States on their waterbody-level assessments. In order for EPA to prepare a timely Report to Congress, States should provide electronic updates by April 1 of each year for the waters assessed in the previous calendar year. Figure 3-1 shows the schedule for hard-copy reports and electronic updates. See the text box on page 3-5 and Section 6 for details. I f a State is unable to transmit an electronic update of their assessment data in a given year, the State should send a biennial electronic update by April 1 of the following year covering waters assessed in the previous two calendar years.
Sections 3 through 5 of these ~uidel ines describe the baseline of water quality information required for the Section 305(b) report; however, each State may expand on this baseline where i t sees fit or as agreed upon with its EPA Region. If a State has no information on a given measure or topic, the report should clearly indicate that this is the case. Appendixes may be used to supplement the report with information considered tbo detailed for general reading.
Each State's assessment should be based on the most recent water quality data available. In order to produce a comprehensive portrayal of the State's water quality, the assessment should include all waters for which the State has accurate current information. States should collect and evaluate data from all available sources, including State fish and
game agencies, health departments, dischargers, volunteer monitoring organizations, and Federal agencies such as the U.S. Geological Survey (USGS), the National Oceanic and Atmospheric Administration, and the U.S. Fish and Wildlife Service.
States should involve designated management agencies for nonpoint source control programs in assessments for their respective source categories and affected waterbodies. EPA further encourages States to increase the involvement of Federal agencies in conducting assessments of waters on Federal lands.
The Section 305(b) report can be used to satisfy a State's reporting requirements under Sections 106, 314, and 319 in addition to 305(b). See Table 3-1. Because the date for State submission of the 305(b) reports is the same date as submission of State Section 303(d) lists, States may want to submit their 303(d) lists with their 305(b) reports. However, since the statutory and regulatory requirements differ for the 303(d) list and the 305(b) report, States should submit each as a separate document. The 305(b) reports, the assessments under 106, 31 4, and 31 9

if done separately from the 305(b) report, and the 303(d) lists should be compatible. If inconsistencies occur. States should explain them in a cover letter to EPA Headquarters and the Regional Office.

Completion Date
State 305(b) reports (Full or abbreviated depending upon use of electronic updates)
State annual electronic pilot* updates*
EPA Reports to Congress
* Electronic updates are based upon assessments completed in the previous calendar yearb). statesl~ribeswith electronic capability are encouraged to subrnita "pilot" electronic update for 1997 by December 31,1997; subsequent updates are due by April 1 of each year.
Figure 3-1. Schedule for the 305(b) Cycle

Contents of Electronic Updates
The bulk of a State's electronic update will consist of waterbody-levelassessment data for assessments completed in previous calendar year. Some States have indicatedthey would prefer to send their updated statewide 305(b) assessment databases for convenience or to ensure that EPA is working with the latest, complete dataset. This is acceptable provided assessment dates are includedfor each waterbody. I f the State is using probability-based monitoring network, includewaterbody-level data for that network in the assessment database but report overall network results in the hard-copy 305(b) reports.
The transmitted data tiles can be EPA Waterbody System tiles or State-developed database files (provided EPA can convert the files to standard 305(b)MIBS codes). Note: nearly 40 States transmitted their assessment databases in electronic form during 1994-95.
Section 6 lists the data elements that States should include for each waterbody. With the exception of Biological Integrity fields, WBS and most State in-house programs already contain these data elements. EPA will modify WBS to include these and any other new fields required by these Guidelines.
In addition to the above, a State's electronic update will also include:
A coverage or map showing cumulative extent of assessment coverage statewide (i.e., progress toward comprehensive assessment of the States's waters) and either a GIs coverage showing assessment results since the last update or hard-copy maps showing assessment results
Metadata for the above files (database manager's name, phone number, agency, and a brief data dictionary; see "Improving meta data" below)
Updated ground water tables in database, spreadsheet, or word processing format
See Section 6 for more details on electronic updates.

Table 3-1. Reporting Requirements Satisfied by 305(b) Reports
States can use the WBS to manage the waterbody-specific, quantitative information concerning surface water quality and sources of pollution. WBS can track 303(d)/total maximum daily load (TMDL) lists as well as 305(b) assessments. As in previous reporting cycles, EPA will continue to provide States with technical assistance in implementing the WBS. A WBS Users Guide is also available to assist users in the operation of the WBS. For more information, contact the appropriate Regional 305(b) or WBS Coordinator.
CWA Section
106
305(b)
314
319
Reauirement
Requires States to report on the quality of navigable waters and, to the extent practicable, ground water in 305(b) reports as a condition of receiving 106(e) grants for water quality monitoring programs.
106 monitoring guidelines include reporting elements for ground water, wetlands, and estuaries (see Appendix K). Therefore, the 305(b) report is a convenient mechanism for reporting on programs such as:
The National Estuary Program (CWA Section 320) Ground water protection programs Wetlands programs
Biennial reporting on the status of surface and ground water quality statewide; subject of these Guidelines.
State assessment of status and trends of significant publicly owned lakes including extent of point source and nonpoint source impacts due to toxics, conventional pollutants, and acidification; must report through 305[b).
One-time assessment of the types and extent of nonpoint source (NPS) pollution statewide; for those States that have committed to update their 319 assessments (e.g., due to grant conditions), the 305(b) report is a convenient place for such an update.
305(b) CONTENTS -PART I: EXECUTIVE SUMMARYIOVERVIEW
Each State should provide a concise executive summaryloverview. For both surface and ground water, i t should
Describe overall State water quality (for surface water, include a summary of the degree of designated use support for the different waterbody types)
. Describe the causeslstressors and sources of water quality impairments
Summarize the plan showing how the StateITribe will achieve comprehensive coverage of its waters.
Discuss the programs to correct impairments
Discuss the general changes or trends in water quality
Briefly recap the highlights of each section of the report, particularly the State's monitoring programs, the objectives of the State water management program, issues of special concern to the State, and any State initiatives or innovations in monitoring and assessment such as expanded use of biological indicators or biocriteria or a shift to statewide basin management.
For surface water, include a summary map or maps o f designated use support and/or impairment for aquatic life, drinking water, and other uses; if this information is too detailed for a State-level map, include basin-levelmaps in Part 111.

3. 305(b) CONTENTS -PARTS I AND II: SUMMARY AND BACKGROUND
305(b) CONTENTS -PART II: BACKGROUND
To put the report into perspective for the reader, States should provide a brief resource overview, as shown in Table 3-2. States may choose to add categories to the atlas table to reflect special areas of interest (e.g., acres of playas; acres of riparian areas outside of wetlands; miles of streams and acres of lakes on Tribal lands).
Table 3-2. Atlas
- Miles of perennial riverslstreams (subset? - Miles of intermittent (nonperennial) streams (subset? - Miles of ditches and canals (subset?
BAvailable from EPA RF3lDLG estimates ("Total Waters" estimates)
NOTE: Impoundments should be classified according to their hydrologic behavior, either as stream channel miles under rivers or as total surface acreage under lakeslreservoirslponds, but not under both categories. In general, impoundments should be reported as lakes/reservoirslponds unless they are run-of-river impoundments with very short retention times.

3. 305(b) CONTENTS -PARTS IAND II: SUMMARY AND BACKGROUND
Total Waters
The StatelEPA 305(b) Consistency Workgroup has agreed that the best estimates of total State waters available nationwide are obtained using the EPA River Reach File Version 3.0 (RF3). RF3 is derived from the U.S. Geological Survey (USGS) 1:100,000 scale Digital Line Graph (DLG) data, which contain all hydrologic features found on the same scale USGS paper maps.
EPA has used RF3 to develop estimates of total waters, by State, as follows: total river miles, with breakdowns for perennial streams, intermittent streams, ditches and canals, and border rivers; total lake acres; and number of lakes. These breakdowns were produced using the USGS DLG codes to differentiate between types of hydrologic features. These estimates, which have not changed since the 1994 305(b) cycle, are available on diskette from the National 305(b) Coordinator, at (202) 260-7060.
EPA will be citing the RF3lDLG estimates of total waters (i.e., total river miles, lake acres, ocean coastal miles, and Great Lakes shore miles) in its biennial 305(b) Reports to Congress, and urges States to use them in their State water quality assessments. EPA, in consultation with individual States and USGS, will continue to refine these estimates where appropriate. EPA and USGS jointly plan to update the Total Waters database after completion of the National Hydrography Dataset (NHD). States using maps and measurement techniques of higher resolution than those on which the RF3lDLG estimates are based may choose to report their own estimates, with appropriate explanation in the text of their reports. In particular, due to limitations of the DLG data underlying EPA's Total Waters estimates, States may have more accurate estimates of ocean coastal miles and Great Lake shore miles.
EPA recognizes that variation in cartographic density exists among the maps used to create the DLG, and, therefore, the RF3-based total water numbers also reflect these variations. Also, RF3 is a new database and users may identify needed corrections. States and other users are urged to participate in updating and correcting RF3 in the future. RF3 data and documentation can be obtained from EPA by contacting STORET User Assistance at (800) 424-9067. Other RF3-related questions should be directed to the Monitoring Branch. EPA Office of Wetlands, Oceans, and Watersheds, at (202) 260-2488.
Until improved approaches are available to determine total estuarine and wetlands waters, States should continue to use the best available methods and should identify those methods. The U.S. Fish and Wildlife

Service National Wetlands Inventory is recommended for State wetland acreage estimates.
Maps
States should include maps and other graphical depictions of background information relevant to water quality assessments. For the 1998 cycle. the 305(b) report should include maps of basins or watersheds used in rotating basin surveys or statewide basin management, ecoregions, physiogeographic provinces. Tribal lands, and other significant characteristics of the State. EPA encourages the use of GIS coverages to prepare these maps. [Note: In Section 4, Surface Water Assessment, the Guidelines request maps showing degree of use support of waterbodies.]
Water Pollution Control Program
Each State should provide an overview of its approach to water quality management.
Watershed Approach
Include an overview of any watershed- or basin-oriented programs, such as the statewide basin management approach involving rotating basins used by many States and strongly supported by EPA. Describe the manner in which monitoring and point and nonpoint source control programs are implemented within this watershed approach. Also. describe how 305(b) reporting fits in with these programs, including the extent to which assessment information developed for basin management plans is compatible with or can be transferred directly to the 305(b) reporting process.
Water Quality Standards (WQS) Program
Provide an overview of the Standards program, including the extent to which the State establishes designated uses for their rivers, lakes, and estuarine/coastal waters consistent with the goals of the Clean Water Act. States should also explain what kinds of waters are not classified as to designated use and how they determine which waters should be classified. Last, the 305(b) report should include a brief discussion of changes in water quality standards that have occurred since the previous report, including progress toward implementing biocriteria.
EPA asks States to provide a list of the State ambient WQSs that are used to assess drinking water use attainment and to compare these WQSs to the list of National Primary Drinking Water Regulations

contaminants. This information should be included as an appendix to the State 305(b) report.
Point Source Program
Within the context of both technology-based and water-quality-based controls, States should provide a general ovewiew of the point source control program. They should focus on program actions, their relationship to water quality, and their effectiveness in improving water quality. In particular, State programs to assess and control the discharge of toxic pollutants should be discussed.
EPA will use information available through the Permit Compliance System (PCS) to summarize national progress. EPA encourages the States to provide additional quantitative information i f they choose.
Nonpoint Source Control Program
Section 319 of the Clean Water Act, as amended by the Water Quality Act of 1987, required States to conduct an assessment of their nonpoint source (NPS) pollution problems and submit that assessment to EPA. In this chapter, the State is asked to update its Section 31 9(a) assessment report, as necessary, and discuss highlights of its nonpoint source management programs, including NPS priority watersheds. Updated waterbody-specific information on Section 31 9 waters should be included in the WBS or other State assessment database. In addition, i f a State provides a hard-copy list of its Section 319 waters, i t should do so here or in a clearly identified appendix.
Program highlights to be reported in this chapter should include both activities funded under Section 31 9 and nonpoint source activities funded from other Federal. State, or local sources. Highlights may include, but are not limited to, results of special nonpoint source projects, new State legislation for nonpoint source control, Section 319 ground water activities, an analysis of the change in water quality due to implementation of NPS controls, and innovative activities begunlcompleted since the last 305(b) reporting cycle (e.g., intergovernmental initiatives, watershed targeting, point source/nonpoint source trading).
In addition, States may refer to several other sources that will help them in reporting on nonpoint sources. The Nonpoint Source Program and Grants Guidance for Fiscal Year 1997 and Future Years (May 1996) describes annual reporting for the Section 31 9 Management Program, which is not included in the 305(b) reporting process. Also, a NPS monitoring and evaluation guide is available; see text box at end of Section 4.2 of these Guidelines.

Section 621 7 of the Coastal Zone Act Reauthorization Amendments of 1990 requires each State with a federally approved coastal zone management program to develop a coastal nonpoint program to restore and protect coastal waters. States must implement management measures in conformity with guidance issued by EPA and NOAA to protect coastal waters. This guidance, Guidance Specifying Management Measures for Sources o f Nonpoint Pollution in Coastal Waters (EPA 840- 8-92-003), describes management measures that States are to achieve or implement throughout their coastal zones.
States should use their 305(b) reporting process to document water quality improvements in the Section 6217 management area. Where coastal water quality is impaired or threatened even after the implementation of management measures, then additional management measures are required. The 305(b) reporting process should be used as one of the components to the State's Coastal Nonpoint Program and the identification of threatened or impaired waters. Additional information on the Section 6217 program can be obtained from EPA's Nonpoint Source Control Branch at (202) 260-7085 or NOAA's Coastal Programs Division at (301) 713-3155.
Coordination with Other Agencies
Provide a description and/or table of program coordination with other State, Tribal, and local agencies. Mention any formal agreements such as memoranda of agreement or understanding, interagency or interstate agreements, or other agreements regarding watersheds or waterbodies. Also discuss any informal arrangements (e.g.. related to monitoring or enforcement).
CosUBenefit Assessment
Section 305 requires the States to report on the economic and social costs and benefits of actions necessary to achieve the objective of the Clean Water Act. I t is recognized that this information may be difficult to obtain due to the complexities of the economic analysis involved. However, until such time as comparable procedures for evaluating costs and benefits are in wider use, States should provide as much of the following information as possible.
Cost Information
EPA asks States to provide as much of the following information as possible. Some possible sources of information are included in the text box that follows.

Capital investments in municipal facilities in the past 5 years, 10 years, and since 1972
Capital investments in industrial facilities in the past 5 years, 10 years, and since 1972
Investments in nonpoint source measures in the past 5 years, 10 years, and since 1972
Annual operation and maintenance costs of municipal facilities
. Annual operation and maintenance costs of industrial facilities
Total annual costs of municipal and industrial facilities
Annual costs to States and local governments to administer water pollution control activities.
Benefits Information
The economic benefits that result from improvements in water quality are those effects that improve the economic well-being of individuals or firms. Individuals can benefit from enhanced recreation opportunities and aesthetics and from the knowledge that the aquatic ecosystem is being protected, perhaps for future generations. As a result of water quality improvements, people may visit different water sites than they used to, or they may recreate near water often. Business and industry may gain from cleaner water by having lower water treatment costs or perhaps by having lower wage costs due to the higher quality of life that their location has to offer.
Other non-recreational benefits can accrue from the role wetlands play as natural filters or sinks for certain pollutants and from their crucial role as fish nurseries. Society in general can benefit from improved habitat for endangered or threatened species.
Methods of quantifying economic benefits are described briefly in U.S. EPA (1991) and theory and methods are detailed in Freeman (1993). To facilitate comparisons between the costs and benefits of efforts to improve or protect water quality, it is desirable to measure both in dollar units. However, this is not always feasible or cost-effective. Nonetheless, it may be prudent to quantify benefits in nonmonetary terms or to provide qualitative descriptions of the water quality improvements and the associated effects of those improvements. To aid in this regard, the State

Sources of Cost Information
After issuance of these Guidelines, the EPA Regions will provide information to State 305(b) Coordinators from the Federal government sources cited below. Two annual Census Bureau surveys provide information on State spending on water quality which could be used to supplement information available from the States themselves. The Census Bureau conducts an Annual Survey of Government Finances and an annual Survey of Pollution Abatement Costs and Expenditures (PACE), and publishes the results of each (Government Finances: 7990-97.Series GFI91-5: Current Industrial Reports, MA 200, "PACE." through the U.S. Government Printing Office. Washington, DC). To obtain a copy of each report, telephone (301) 457-4100. Possible sources on State water quality expenditures from these documents include:
m a 1 i n v e s t ~ t s and annual O&M ex~enditures at municioal facilities -
Government Financesreport, Table 27: "Finances of Utilities Operated by State and Local Governments by State, Type of Utility, and Government" -This table indicates (by State) the expenditures by government utilities for water supply, and breaks down operating costs and capital costs.
Government Finances report, Table 29: "State and Local Government Revenue and Expenditure by Level and Type of Government, by State" -This table indicates total expenditures by State and local governments on sewerage (with capital outlay separated) and solid waste management.
Technical and Economic Capacity of States and Public Water Systems to Implement Drinking Water Regulations -Report to Congress (EPA 81 0-R-93-001, September 1993).
State sources: State water quality agencies, revolving fund program
. .W a I I n v e s m t s and O&M exoenditures at industrial fac i l i tk -PACE report, Table 6b: "Capital Expenditures by States for Media Water" -This table indicates (by State) total capital expenditures for water pollution abatement by manufacturing establishments, and breaks expenditures down by type of pollutant abated (hazardous vs. nonhazardous) as well as abatement technique (end of line vs. production process enhancements)
PACE report, Table lob : "Operating Costs by States for Med~a Water" -This table indicates (by State) total operating costs for water pollution abatement by manufacturing establishments, and breaks down costs by type of pollutant abated (hazardous vs. nonhazardous). Nonhazardous costs are further broken down (payments to industry vs. sewage services payments to government).
For nonmanufacturing sectors (mining, petroleum and electric utilities), information is not broken down by State in the PACE report.
Nonoolnt source investments -State NPS program, other State water quality agencies
Administrative Costs- State budget office.

3. 305(b) CONTENTS -PARTS I AND II: SUMMARY AND BACKGROUND

3. 305(b) CONTENTS -PARTS IAND II: SUMMARY AND BACKGROUND
may attempt to document how people and firms are using the waters in the State. Information on recreation participation rates is useful in and of itself.
EPA is in the process of collecting data on water-based recreation activities (i.e., fishing, swimming, boating, and near-shore) using a random sample of the national population. These data will be provided to States as they are published. States may have easy access to information on participation for those activities that require licenses or entrance fees. States may also be in a position to tabulate the number of industrial units, thermoelectric facilities, and farms that divert water for productive purposes. Some localities may also have data demonstrating the importance of shoreline properties to the local tax base. Some regions may have lower average salaries for highly trained professionals that can be attributed to a higher quality of life due to abundant environmental amenities.
Such participation, water use, and quality of life information aids in documenting the importance of water resources. However, to estimate the economic benefits of water quality improvements, i t must first and foremost be documented that water quality has in fact been improved or that degradation in water quality has been prevented as a result of investments in protection and enhancement. States may vary quite a bit in the type of data that they collect to verify the quality of their waters. The common requirement for an economic benefit assessment is the ability to demonstrate how the changes in water quality result in changes in how people and business enterprises use and enjoy the water resources.
States may also find well-qualified academics who are willing to answer questions related to the information needs for, and feasibility of, conducting an economic benefit assessment. The Association of Environmental and Resource Economists maintains a directory of its members, including their main fields of study. A large percentage of the membership has experience in valuation. This list can be obtained from Resources for the Future, 1616 P Street, NW, Washington, DC 20036.
States should provide the following information about benefits to the extent possible:
lmprovements in recreational fishing
lmprovements in commercial fishing (catch rate, etc.)

Number of stream miles, lake acres, etc., improved from impaired to fully supporting in the past 10 years
Reduced cost of drinking water treatment due to cleaner intake water

305(b) CONTENTS -PARTS IAND II: SUMMARY AND BACKGROUND3.
Increase in use of beaches attributed to improved water quality
Increase in recreational boating attributed to improved water quality.
States should also report case studies of water quality improvement due to point and nonpoint source controls or habitat restoration and cases of impairment prevented by controls or habitat protection. In the absence of extensive costlbenefit studies, case studies of specific waterbodies can make a compelling argument for the value of water quality management actions.
Case studies might include instances where expenditures resulted in increased water-based recreational activities, improvements in commercial or sports fisheries, recovery of damaged aquatic environments, reduced costs of water treatment undertaken at municipal and industrial facilities, or reduced medical costs due to improved water quality for recreation. States should also discuss the costs and benefits of water quality achievements for programs or specific sites documented elsewhere in the report. Examples of such projects include Clean Lakes restoration and nonpoint source control projects.
Special State Concerns and Recommendations
This section should consist of two parts. First, States should discuss special concerns that are significant issues within the State and that affect its water quality program. List and discuss any special concerns that are not specifically addressed elsewhere in this guidance, or, if they are addressed, are not identified as special State concerns. This section is a key part of the assessment, describing the forces driving specific State programs and illustrating the complex and varying nature of water quality problems throughout the country. Include, i f possible, the strategies that are being planned or implemented to alleviate these problems and give site-specific examples.
Second, provide recommendations as to additional general actions that are necessary to achieve the objective of the Clean Water Act: providing for the protection and propagation of shellfish, fish, and wildlife and allowing recreation in and on the water. Examples of recommendations include developing more FDA action levels, improving training of municipal treatment facility operators, correcting combined sewer overflows, placing more emphasis on the identification and control of nonpoint sources, point sourcelnonpoint source trading, statewide basin management, and other watershed-based water quality management programs.

4. 305(b) CONTENTS -PART Ill: SURFACE WATER ASSESSMENT
SECTION 4
305(b) CONTENTS -PART Ill: SURFACE WATER ASSESSMENT
Chapter One: Current Surface Water Monitoring Program
To provide a perspective on their activities to evaluate water quality, States must describe their monitoring programs and briefly discuss any changes in program emphasis that are planned or have taken place since the last report. Of particular interest this cycle are any changes resulting from a shift to basinwide or watershed planning, rotating basin surveys, or probability-based monitoring.
The description of State monitoring programs should include the basic program components that follow, with references to other documents includinq approved aualitv assurance proaram plans. The followinq are excerptld fiom oni it or ins Program ~ o r k ~ ~ a n ' e ~ e m e n t sin section106 Monitorinq Guidance to the States (Appendix K of the Guidelines ~ u ~ ~ l e r n & t ) ,first issued by EPA in 1994, which is in turn based on the ITFM framework for water quality monitoring. States could extract information from existing documents such as basin plans, Performance Partnership Agreements or 106 work plans to prepare this section of the 305(b) report.
Purpose of monitoring program - goals - use of data quality objectives - geographic areas targeting for monitoring - environmental indicators - use of reference conditions
Coordinationlcollaboration - other agencies or groups with similar monitoring goals or
information - how such information is used

4. 305(b)CONTENTS -PART Ill: SURFACE WATER ASSESSMENT
Networks and Programs (for each include objectives, design methodology, number of sites, sampling methods, sampling frequency, parameters) - Fixed-station networks - Intensive surveys including rotating basin surveys - Probability-based surveys - Toxics monitoring programs - Biological monitoring programs - Fish tissue, sediment, and shellfish monitoring programs.
. Laboratory analytical support - Laboratories used - Issues (e.g., capacity, methods)
Quality assurancelquality control program (brief description)
Approach for data storage, management and sharing
. Training and support for volunteer monitoring - status of State-coordinated volunteer monitoring program, i f any - use of volunteer monitoring data in report - source of volunteer monitoring data used - type of volunteer monitoring data used
Data interpretation and communication - status of the State's WBS or equivalent system - status of georeferencing waterbodies to WBS - efforts to make reports accessible
Program evaluation - updates of monitoring strategy and QA plans - effectiveness in meeting program objectives - changes needed to evaluate new problems
States should include maps of fixed-station monitoring sites and other key monitoring sites and networks. These may be river basin maps from basin management plans or reports.
States should also discuss any plans to use data generated by Federal agencies such as EPA's Environmental Monitoring and Assessment Program (EMAP), USGS's NAWQA and NASQAN programs, or the National Oceanic and Atmospheric Administration's (NOAA's) Status and Trends Program. Finally, States should identify any monitoring andlor data management tools needed to improve their ability to assess the quality of their waters and to increase the percentage of waters assessed

4.305(b) CONTENTS -PART Ill: SURFACE WATER ASSESSMENT
Examples of such needs are data systems, training, or technical assistance for new monitoring protocols.

4. 305(b) CONTENTS -PART Ill: SURFACE WATER ASSESSMENT
Chapter Two: Plan for Achieving Comprehensive Assessments
EPA has established a long-term goal of comprehensively characterizing surface and ground waters of each State (in keeping with the State's rotating basin approach if applicable) using a variety of techniques targeted to the condition of, and goals for, the waters. These techniques may include traditional targeted monitoring and probability-based designs. To help ensure national progress toward this goal, each State is encouraged to include in its 1998 305(b) report a plan and maps showing how they will achieve comprehensive monitoring and assessment of its waters. EPA believes that most of the work involved in developing such a plan will have already been performed in the development of the State's Section 106 Monitoring Strategy. In cases where the existing strategy does not already include comprehensive assessment of State waters, States are encouraged to revise the strategy to achieve this goal. At a minimum, States should attach a copy of their current Section 106 Monitoring Strategy to the 1998 305(b) report.
Prior to preparing this plan, EPA recommends that State monitoring and 305(b) staff hold a series of discussions with their EPA Regional Monitoring and TMDL Coordinators regarding ways to adapt their current monitorinq proqram to achieve comprehensive monitoring. EPA can also provide technical support for designing probability-basedmonitoring networks to supplement existing networks. For example, EPA's EMAP staff have extenjive experiencedesigning and conducting probability-based monitoring. The EPA contact is shown on page ii.
See Section 2 and Appendix I of the Guidelines Supplement for more information about different monitoring designs for achieving comprehensive assessments. Among the possible approaches for a State to achieve comprehensive assessments based on monitoring are:
All sizes and categories of streams (or lakes or estuaries) are sampled based on probabilistic monitoring designs. This type of design can be incorporated into a State's rotating basin monitoring program.
Certain categories of waterbodies are sampled based on probability-based designs, while other categories are sampled with historical fixed station networks or other non-random designs.
As an example of the latter approach, a State might monitor its headwater streams using a probability-based design, since the number of small streams makes monitoring each one impractical. The State could monitor large streams and rivers using a more traditional network. The probability network would allow the State to draw valid inferences about

4. 305(b) CONTENTS -PART Ill: SURFACE WATER ASSESSMENT
the degree of use support in its headwater streams, while the remaining streams and rivers would be monitored through proper spacing of monitoring sites. Similarly, small lakes could be monitored probabilistically and larger lakes using other designs.
Contents of the plan should include:
How the State plans to investigate its options for comprehensive monitoring and assessment-i.e., the process the State will follow for selecting a valid, cost-effective program including existing networks to comprehensively determine designated use support and biological integrity statewide.
If known, a description of any proposed future monitoring networks, including the types of information listed above under Chapter 1: Current Surface Water Monitoring Program; several States have begun using a combination of traditional and probability-based monitoring, and may be able to prepare this part of the plan for their 1998 305(b) reports.
Maps showing the schedule by watershed or basin for introducing the necessary monitoring changes to achieve comprehensive monitoring.
A plan for georeferencing all waterbodies (streams, lakes, estuaries and ocean shorelines) to RF3. If a State wishes to use a hydrographic coverage other than RF3 with similar or better resolution, the plan should address how this will be achieved and how it will be linked to RF3 to enable national coverage. States that have already georeferenced their waterbodies should simply document the process and the hydrographic coverage they used. See page ii for the EPA national contact for georeferencing waterbodies to RF3.
Chapter Three: Assessment Methodology and Summary Data
States should provide information on the methods they used to assess data for determining use support status. This documentation should include types of information used, data sources, assessment confidence levels, and identification of organizational units that make use support determinations. The decision process for assigning waterbodies to different use support categories (fully supporting, partially supporting, etc.) should be explained in detail. The use of flow charts of the decision process is recommended. Appendix J of the Guidelines Supplement includes example assessment methodologies with the appropriate level of

detail. States not using the WBS should describe the databases they use to track and report assessments.
States should highlight changes in assessment methodology since the last 305(b) assessment. States should also explain any biases incorporated into their assessments (e.g., monitoring concentrated around areas of known contamination; small percentage of waters assessed; limited monitoring of waterbodies affected by nonpoint sources). Also, EPA asks States to discuss how they determine the extent of a waterbody represented by a single assessment or monitoring site (see also Section 2.1 of the Guidelines Supplement).
Approximately half of the States have adopted or are considering a statewide basin management approach in which they assess all basins or watersheds at regular intervals (typically three to five years). EPA encourages this approach and requests that States report the status of their efforts and any special considerations in making assessments using rotating basin data. A State using rotating basin surveys as part of a statewide basin management approach should report the number of years required to assess all basins (i.e., the entire State) and the percentage of total State waters actually assessed during this cycle. States should also report basinwide plans by name and year completed or expected to be completed.
To achieve more comprehensive coverage of its waters, a State could assess a statistically valid subset of such waterbodies and intermittent streams and infer the condition of the whole. See Section 4.2 of the Guidelines Supplement for more information about probability-based monitoring.
Finally, if water quality trends are reported, the State should include a description of its methods and software.
EPA and many States represented on the 305(b) Consistency Workgroup are committed to improving the usefulness of water quality data through spatial analysis. For example, maps displaying designated use support information for rivers, lakes, estuaries, oceans, Great Lakes, and wetlands are very useful in showing the extent of impairment of designated uses. Maps can also illustrate the distribution of waters impaired by specific sources or causes/stressors, as well as the locations of monitoring sites, dischargers, land-disturbing activities, and threatened wetlands. Figures 4-1 and 4-2 are watershed-scale maps that illustrate these types of features. These are black and white copies of the original color maps.

4. 305(b) CONTENTS -PART Ill: SURFACE WATER ASSESSMENT
For examples of color maps from 1996 State 305(b) reports, States may contact the National

Figures 4-1 and 4-2
figures not available in electronic form

4. 305(b) CONTENTS -PART Ill: SURFACE WATER ASSESSMENT
305(b) Coordinator. EPA highly recommends the use of color maps for displaying assessment results.
States with GlSs can generate such maps by georeferencing their waterbody-specific assessment data (e.g., WBS data) to the Reach File Version 3 (RF3). To do this, the State assigns locational coordinates to each waterbody. RF3 is EPA's national hydrologic database; RF3 allows georeferenced water data to be displayed spatially and overlaid with other data in a GIS. EPA is providing technical support for this process to States.
To move toward greater use of spatial analysis, the 305(b) Workgroup made the following recommendations:
EPA should continue to encourage States to georeference their waterbodies to RF3 and provide technical support for this effort.
Each State should have a base-level computer system to implement software such as ARCIINFO. ArcView, and the Waterbody System.
Each State should seek technical input from EPA before reach indexing to ensure Regional and national compatibility and to take advantage of lessons learned in other States. The EPA contact for reach indexing is shown on page ii.
For other information about the above items, contact the National 305(b) Coordinator.
EPA recognizes that some State 305(b) programs may not have access to a GIS for the 1998 report; these States are asked to provide maps in whatever form they commonly use for other documents. For example, each State has base maps of hydrography that can be used to prepare use support maps. Using waterbody-specific assessment data from WBS or other systems, States should prepare maps showing degree of use support for each use (aquatic life, drinking water, etc.). Similar maps should display the major causes and sources of impairment. These maps can be at the State level or basin scale. Basin-scale maps may be available from basin plans under a statewide basin management approach.
Section 303idl Waters
Each State must transmit a Section 303(d) list to EPA biennially, with the next update due by April 1, 1998. Because the date for State submission of the 305(b) reports is the same date as submission of State Section

303(d) lists, States may want to submit their 303(d) lists with their 305(b) reports. However, since the statutory and regulatory requirements differ for the 303(d) list and the 305(b) report, States should submit each as a separate document.
In any case, each State is expected to use existing and readily available information to determine which waterbodies should be on the Section 303(d) list. A number of sources can be used to assist in making this determination, including the State's assessment database and most recent 305(b) report. A deliberative analysis of existing information, including best professional judgment, should be conducted to evaluate i f the information is adequate to support inclusion of a waterbody on the Section 303(d) list.
Section 303(d) of the CWA requires States to identify and establish a priority ranking for waters that do not or are not expected to achieve or maintain water quality standards with existing or anticipated required controls. States are required to establish TMDLs for such waters in accordance with such priority ranking. If EPA disapproves a State list, EPA is required to identify waters and assign a priority ranking for TMDL development.
For guidance regarding State and EPA responsibilities under Section 303(d) and a list of EPA Regional TMDL Coordinators, see Appendix K to the Guidelines Supplement. For more information, contact the EPA Watershed Branch (202) 260-7074.
Table 4-1 is included here to show 305(b) staff the types of information that States may include on their 303(d) lists. Note that the data field WBlD (waterbody identification number) in Table 4-1 will help EPA and the State manage both 305(b) and 303(d) data in the future by providing a common data element for cross-referencing data. States have the option to use WBS to track this information. WBS contains a TMDL list module with cause and source codes and other fields from Table 4-1.
Chapter Four: Rivers and Streams Water Quality Assessment
Desianated Use Support
The State should prepare a table summarizing the extent of impairment of designated use support (Table 4-2). States with statewide or regional fish consumption advisories for mercury are asked to provide two versions of Table 4-2, one version including impairment due to these advisories and one version excluding such impairment. Presenting separate tables

helps clarify the extent of mercury advisory problems versus other more tractable problems in the State.

Table 4-1. Types of Information that States May include on Their 303(d) Lists (optional)'
a This table is presented for information purposes for State 305(b) staff to track and manage both 305(b) and 303(d) information. Itdoes not create new requirements, nor does it supercede any existing statutory or regulatory requirements.
Required information under 303(d) regulations and statute.
WB = Waterbody WBlD = Waterbody identification number from 305(b) assessment database Targeted = Waterbody has been identified for TMDL development during the next two-year cycle (e.g., April 1998
to April 2000). NPDES = National Pollutant Discharge Elimination System.

Table 4-2. Summary of Fully Supporting, Threatened, and Impaired watersa
Degree of Use
a See text regarding preparing two versions of this table if the State has a statewide or regional fish consumption advisory due to mercury.
Report size in each category (rivers and streams reported in miles).
Size threatened is a distinct category of waters and is not a subset of the size fully supporting use (see Section 1.2 of the Guidelines Supplement). I t should be added into the totals entered in the bottom line.
Impaired = Partially or not supporting a designated use

4.305(b) CONTENTS -PART Ill: SURFACE WATER ASSESSMENT
The 1996 305(b) Consistency Workgroup recommended that overall use support no longer be a reporting requirement, as it masks the specific number of uses impaired. To retain summary information on the total condition and size of waters assessed, States should report the information in Table 4-2 for rivers and streams.
In addition, the State should prepare a table summarizing individual designated use support (Table 4-3). Table 4-3 lists specific designated uses and combines Clean Water Act goal reporting and designated use reporting into one table. The fishable goal of the Clean Water Act is reported under the fish consumption, shellfishing, and aquatic life support uses, and the swimmable goal is reported under the swimming and secondary contact uses.
In order for EPA to summarize use support at a national level, States must report waterbody sizes for the generalized use categories shown in Table 4-3 (fish consumption, shellfishing, etc.). More specific State uses may be itemized in the spaces provided at the bottom of the table, but must be consolidated into the eight general use categories to the extent possible. This consolidation should be based on the most sensitive State use within a generalized use (e.g., cold water fishery would be included in aquatic life use support for a trout stream).
Assessment Database Managen-Whether you use WBS or a customized system, to generate Table 4-2 accurately you may need to enter values for a summary of uses (formerly overall use. Code 01) at least for waterbodies having impairmentof multiple individualuses. This is because of potential overlap of impairment. For example, i f a stream waterbody has 5 miles of aquatic life use impairmentand 2
size impaired for a waterbody equals the largest size impaired for any individual use.
miles of swimming use impairment, it could have from 5 to 7 miles of impairment. Note: if a State does not provide sizes for "summary of uses" Code 01 in its database, EPA will assume that the total
WBS treats the summary of uses/overall use Code 01 the same as individualuse codes. You only need to provide data for this code if the waterbody has impairment of multiple individualuses. Contact WBS User Support for further information; see page ii for telephone number).

Several States separate CWA goals (fishable, swimmable) from State goals (aquatic life use support (ALUS), primary contact recreation, etc.). Therefore, States can also report on their own individual designated uses. However, to ensure that EPA correctly interprets their summary data, States should include in Table 4-3 values for the national designated use categories (aquatic life, fish consumption, shellfishing, swimming, secondary contact, drinking water, agricultural, culturallceremonial) whether or not they choose to include State-specific uses.
f i d Uses
For those waters assessed that are not fully supporting their designated uses (i.e., impaired waters), States should provide the following information to illustrate the causeslstressors and sources of use impairment statewide.
States may also wish to prepare similar tabular information for waters that fully support uses but are threatened.
Assessment DatabaseManagers-Whether you use WBS or a customizedsystem, EPA needs your cooperationto accurately interpret your use support data. For each waterbody, please fill in the size fields for the any of the following national use support categories that apply:
. Aquatic Life Use Fish Consumption Use Shellfishing Use Swimming Use . Secondary Contact Use DrinkingWater Use
Even if you have State-specificsubcategories for these uses. EPA also needs sizes for the above national uses. Also, please complete the Assessment Category field to distinguish evaluated (E) from monitored (M) assessments.
Note to WBS Users-If you follow the above instructions, WBS can be used to generate Tables 4-2 and 4-3.

4.305(b) COMTENTS -PART Ill: SURFACE WATER ASSESSMENT
TABLE 4-3 (see last page of this file)

Relative Assessment of CauseslStressors-
Causes/stressorsare those pollutants or other stressors (e.g., flow and other habitat alterations, presence of exotic species) that contribute to the actual or threatened impairment of designated uses in a waterbody. In Table 4-4. States should provide the total size (in miles) of rivers and streams affected by each causelstressor category. A waterbody may be affected by several different causesistressors and its size should be counted in each relevant causelstressor category. See Section 1 of the Guidelines Supplement for new discussion of the terms MajorlModeratelMinor and a list of cause/stressor codes for the WBS. See the footnote to Table 4-4 regarding the importance of leaving no blanks in Table 4-4; to avoid confusion in national summaries, please use asterisks, dashes, or zeros as described in the footnote.
The relative magnitude of causeslstressors does not necessarily correspond to degree of use support. For example, a waterbody can have three causeslstressors labeled as moderate, but have sufficient impairment from these multiple causeslstressors to be assessed as not supporting.
Most of the causeslstressors in Table 4-4 are self-explanatory but some warrant clarification:
. Siltation refers to the deposition of sediment on the bottom of a waterbody causing such impacts as smothering benthic habitat in streams or filling in of lakes.
Thermal modification generally involves the heating of receiving waters by point sources (e.g., plant cooling water) or nonpoint sources (e.g., runoff from pavement or elimination of bank shading).
Flow alteration refers to frequent changes in flow or chronic reductions in flow that impact aquatic life (e.g., as flow-regulated rivers or a stream with excessive irrigation withdrawals).
Other habitat alterations may include removal of woody debris or cobbles from a stream.
Exotic species are introduced plants and animals (e.g., Eurasian milfoil, zebra mussels, grass carp) that interfere with natural fisheries, endangered species, or other components of the ecosystem.
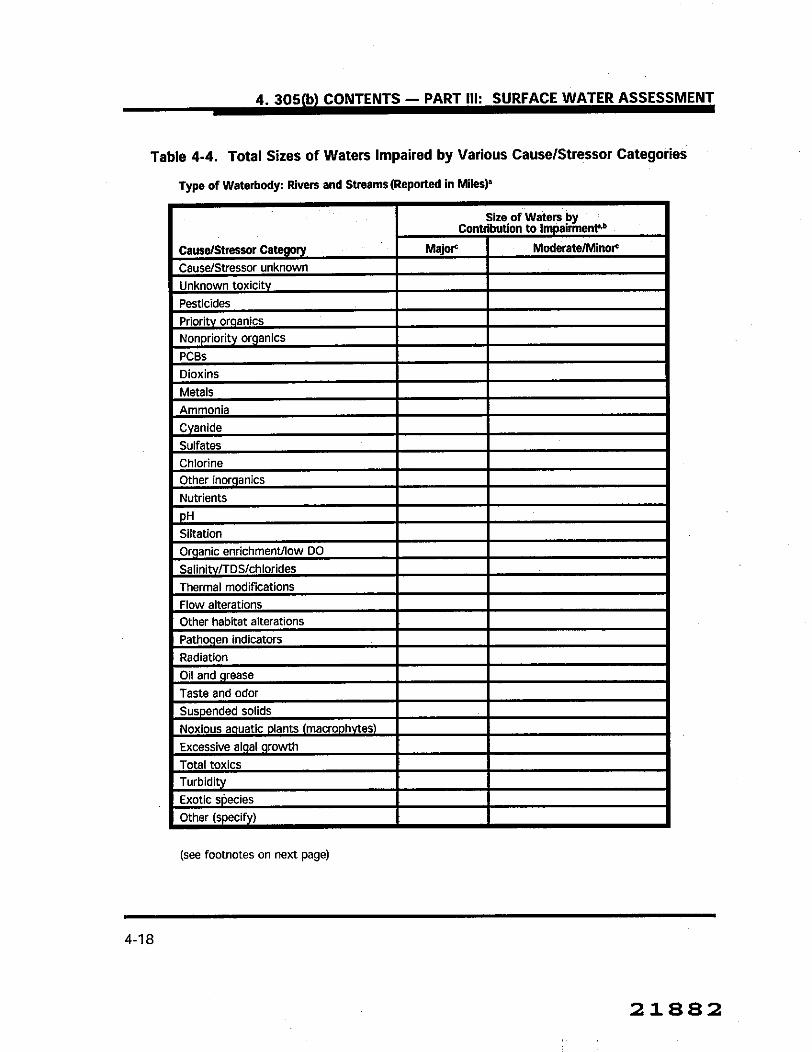
Table 4-4. Total Sizes of Waters Impaired by Various CauselStressor Categories
Type of Waterbody: Riversand Streams(Reportedin Miles)'
(see footnotes on next page)

a Reported in total size (rivers and streams re orted in miles When preparing this table for other waterbody types, use the fofowing unts: kkes, acres; estuarles, square miles; coastal waters and Great Lakes, shore miles; wetlands, acres.
b In order for €PA to summarize data from over 56 305(b) reports, please leave no blanks.in this table. Instead use the following conventions:
aster~sk(*) = category not a plicable Pdash (-) = category applicab e no data available zero (0)= category applicable, but size of waters in the category is zero.
Note that multiple moderatelminor causeslstressors can additively result in nonsupport. See discussion in Section 1.9 of the Guidelines Supplement.

4. 305(b) CONTENTS -PART Ill: SURFACE WATER ASSESSMENT
How to Avoid Double-counting CauseslStressors
Assessment Database Managers-WBS and other State assessment databases can generate Table 4-4 from waterbody-specific information. To do so, users must complete Cause Size and Cause Magnitude fields for each waterbody. Table 1-2 of the Guidelines Supplement lists the national causelstressor codes.
WBS UsersStates can also add their own codes to WBS to track additional causeslstressors. For 1997, EPA has added codes under Code 500--Metals, to track specific metals such as mercury and copper. If a State chooses to add causelstressor codes to WBS, or to use the new subcategory codes, the data system can still be used to generate Table 4-5. To generate this table, enter a total size for each major category of causes/stressors (the categories in Table 1-2of the Guidelines Supplement such as 0500--Metals or 0200-Pesticides) for each waterbody. This is necessary because there may be overlap among the subcategories of causes. For example, 5 miles of a waterbody may be impacted by zinc and 7 miles by copper, but the total size impacted by "metals" may be only 10 miles due to partial overlap of the specific causes. Simple addition of the sizes impacted by the specific causes (i.e.. 12 miles) would not be accurate in this case.
Non-WBS users-your customized database may also require a total size for each major causelstressor in order to avoid double counting. See diagram below. For more information, contact WBS User Support at the numberon page ii.
[diagram not available in electronic form]

Relative Assessment of Sources -
Sources are the facilities or activities that contribute pollutants or stressors, resulting in impairment of designated uses in a waterbody. Data on sources are tracked for each impaired waterbody in the State (e.g., using WBS). Appendix L of the Guidelines Supplement lists types of information useful in determining sources of water quality impairment.
States should provide the total size (in miles) of rivers and streams affected by each category of source, including the size with overall point and nonpoint source impacts (Table 4-5). A waterbody may be affected by several sources of pollution and the appropriate size should be counted in each relevant source category.
Table 4-5 shows the minimum level of detail regarding source categories. States are urged to include the more detailed list of subcategories, since this will increase the overall usefulness o f the report and of the State's 305(b) assessment database. However, States must always provide aggregate source category totals for the source categories shown in Table 4-5. The cell entitled "Other" in Table 4-5 should actually be a State's list of specific additional sources not included in the preceding categories.
The Natural Sources category should be reserved for waterbodies impaired due to naturally occurring (nonanthropogenic) conditions. See Section 1.7 of the Guidelines Supplement for a discussion of appropriate uses of this source category.
For technical or economic reasons, impairment by a natural source may be beyond a State's capability to correct. A use attainability analysis may demonstrate that a use is not attainable or that another use is appropriate for a waterbody.
Cause/Source Linkage -
States are asked to link causes/stressors with sources for a waterbody in their assessment databases whenever possible (see Section 1.8 of the Guidelines Supplement). A special causelsource link field is provided in WBS for this purpose. Linked causelsource data are very important for answering State resource management questions. For example, the question "Which waterbodies are impaired due to nutrients from agricultural runoff?" cannot be answered if the cause/source link is not used.

Table 4-5. Total Sizes of Waters Impaired by Various Source Categories
Type of Waterbody: Riven and Streams (reported in miles)a

a Reported in total size (rivers and streams reported in miles). In order for EPA to summarize data from over 56 305(b) reports, please leave no blanks in this table. Instead use the following conventions:
asterisk (*) = category not applicable dash (-) = category applicable no data available zero (0)= category applicable, but size of waters in the category is zero
Note that multiple moderatelminor sources can additively result in nonsupport. See Section 1.9 of the Guidelines Supplement.
Bottom sediments contaminated with toxic or nontoxic pollutants: includes historical contamination from sources that are no longer actively discharging. Examples of contaminants are PCBs, metals, nutrients (common in lakes with phosphorus recycling problems), and sludge deposits. Please indicate the screening levels or criteria used (e.g.. EPA sediment quality criteria; NOAA effects range- medium [ER-MI values).
List additional sources known to affect waters of the State.

4. 305(b) CONTENTS -PART Ill: SURFACE WATER ASSESSMENT
How to Avoid Double-counting Sources
Assessment Database Managers-Many State assessment databases track and report on a detailed list of source subcategories under some of the general categories such as Agriculture. The full list of source categories is given in Section 1.7 of the Guidelines Supplement.
To use these databases, including the WBS, to generate Table 4-5 from waterbody-specific information, users must complete Source Size and Source Magnitude fields for each waterbody. If source subcategories are used, users must always enter a size for each appropriate general source category (such as 1000-Agriculture). WBS and customized State databases may not accurately calculate the size of waters affected by Agriculture from the agriculture subcategories (Table 1-3 of the Guidelines Supplement) because the sizes of waters affected by each subcategory may overlap and not be additive. For example, consider a waterbody with 5 miles affected by croplands, 7 miles affected by pastureland, but a total of 10 miles affected by the Agriculture general category because the two subcategories of sources overlap. The following sizes should be stored in the State's assessment database.
Code 1000 Agriculture (general category) 10 miles Code 1050 Crop related sources 5 miles Code 1350 Grazing-related sources 7 miles
To be able to generate Table 4-5 using the WBS and most customized State databases, total mileage must be entered for each general source category affecting a waterbody &e., for the categories in Table 4-5) whether or not source subcategories are also entered.
diagram not available in electronic form

Chapter Five: Lakes Water Quality Assessment
States should report summary statistics for use support and for causes and sources of impairment in lakes. The format should be similar to that used for rivers and streams. That is, Tables 4-2 through 4-5 should be developed for dl a s s e m in the State, including significant publicly owned lakes under Section 314 as well as any other lakes assessed by the State. The reporting unit for lakes in these tables is acres.
The remainder of this chapter deals with reporting requirements under Section 314. The focus is on significant publicly owned lakes. EPA asks States to report on a lakes using Tables 4-2 through 4-5 but only significant publicly-owned lakes in Tables 4-6 through 4-11. Under the abbreviated hard-copy reporting option, a State need not repeat Tables 4- 6 through 4-1 1 biennially unless it has information indicating that conditions have changed. If the State has information that the conditions in its 314 lakes are changing more frequently, than these summary tables should be reported biennially or all required 314 lake- specific data reported in electronic updates. Such electronic updates would satisfy the Section 314 biennial reporting requirement.
m a n Lakes Proaram
Section 314(a)(2) of the CWA, as amended by the Although all lakes should be included in the Water Quality Act of 1987, summary tables described in the "Summary
Statistics" section above (i.e.. Tables 4-2requires the States to through 4-5), the reporting requirements submit an assessment of described below are specific to the Clean Lakes their lake water quality as Program. Data in Tables 4-6 through 4-11 part of their 305(b) report. should be for significant publicly owned lakes The specific elements of only. If States wish to report such information the assessment, as outlined for private lakes, they may do so using similar in Section 31 4(a)(l)(A-F), tables. However, totals for Section 314
constitute the minimal significant publicly owned lakes must always be
requirements for approval. distinguished from private lakes.
For purposes of Clean Lakes Program reporting, this section of the Lake Water Quality Assessment chapter should focus on publicly owned public access lakes that the State considers significant (as defined by the State). Therefore, the term "lake" in this section will refer to "significant publicly owned lakeslreservoirslponds."

Table 4-6. Trophic Status of Significant Publicly Owned Lakes
WBS Users-WBS can generate lakes summary Tables 4-6 through 4-11 if you enter the required data for individual lake waterbodies. One key data element is the "significant publicly owned lake" field on WBS Screen 1. For further information, see the WBS Users Guide or contact WBS User Support at the telephone number on page ii.
,
States should include the specific assessment elements as outlined in Section 314(a)(l)(A-F) as part of their 305(b) reports (see Appendix A of the Guidelines Supplement).
(NOTE: I f a State chooses to submit a "lake water quality" report in addition to a 305(b) report, the State should ensure that the information required specifically by Section 31 4(a) is included in the 305(b) report as well.)
The Clean Lakes section of the report should reflect the status of lake water quality in the State, restorationlprotection efforts, and trends in lake water quality. The text of this chapter should include narrative discussions and summary information that should be supported by

specific information on each lake. Lake-specific information may be submitted by computer disk or a hard-copy appendix to the State report.
Each State should report the following information:
Backaround --
The State's definition of "significant" as it relates to the purposes of this assessment. The definition must consider public interest and use.
Total number of significant publicly owned lakes and number ofacres of significant publicly owned lakes in the State.
Any other background information the State considers relevant to this discussion.
s 1314fa)fl)fAll -- Table 4-6
The total number of lakes and lake acres in each trophic class (dystrophic, oligotrophic, mesotrophic, eutrophic, hypertrophic). (Note: Table 4-6 is a summary, not a list of all lakes.)
A discussion of the approach used to determine trophic status and why it was selected.
A description of procedures, processes, and methods to control sources of pollution to lakes including
- point and nonpoint source controls
- land use ordinances and regulations designed to protect lake water quality.
A general description of the State pollution control programs as they relate to the protection of lake water quality. In particular, discuss the State lake management program, including related activities under the nonpoint source, point source, wetlands, and emissions control programs, and any other relevant program activities. Also, describe the State's water quality standards that are applicable to lakes.
Protection Efforts 1314(a)fllfC)1 -- Tables 4-7 and 4-8

A general description of the State's plans to restore and/or protect the quality of its lakes. This is the State's management plan for its lakes program and should focus on the cooperative working relationships

Table 4-7. Lake Rehabilitation Techniques
Acres of Lakes

4. 1998 305(b) CONTENTS -PART Ill: SURFACE WATER ASSESSMENT
Table 4-7. Lake Rehabilitation Techniques (continued)
'Rehabilitation Technique
Table 4-8. List of Clean Lakes Program Projects Active During 1996 - 1998 Reporting Period
Management Federal Measures
Name of Proiect Type of Proiect'
Funding ($1
Problems Addressed
Proposed or Undertakenb
Completed? (YesINo)
. " Lake Water Quality Assessment (LWQA), Phase I. Phase II, or Phase Ill.
Refer to Table 4-7 for a partial list of managementlrehabilitation measures.

among Federal, State. Tribal, and local agencies concerned with lake protection, restoration, and management.
A description and tabulation of techniques to restore lake water quality. Table 4-7 provides a list of lake rehabilitation techniques as well as a format for reporting the number of lakes and the acreage of lakes where each technique has been applied. The WBS can be used to generate Table 4-7 if users enter data in the following WBS data fields for each individual lake waterbody: the Control Measure field, the Restoration Measure field, and the Significant Publicly Owned Lake field. Note that the WBS allows users to create additional control and restoration codes as needed.
A description and tabulation of Lake Water Quality Assessment grants and Phase I, Phase II, and Phase Ill Clean Lakes projects funded under Section 314 or Section 319 that have been undertaken and/or completed. Table 4-8 shows one way to present this information. State Clean Lakes records. EPA's Clean Lakes Program Management System (CLPMS), or the 319 Grants Reporting and Tracking System (GRTS) can provide the information needed for Table 4-8. For more information, contact the EPA Watershed Branch staff at (202) 260-7107.
Note that in recent years EPA has not requested funding for Section 314 but rather has encouraged States to use Section 319 to support lakes work that was previously supported under Section 314. Thus, Phase I, II, and Ill projects, and lake water quality assessments which were previously done under the Section 314 Clean Lakes Program are eligible for funding under Section 319, with some caveats. In November 1996 EPA issued "Questions and Answers on the Relationship Between the Section 319 Nonpoint Source Program and the Section 314 Clean Lakes Program" to clarify questions regarding funding of lake activities under Section 319 (see Appendix M of the Guidelines Supplement).
and Threatened Lakes 1314fa)fl IfEU--
a Provide summary tables on designated use support and causes and sources of nonsupport in lakes similar to Tables 4-3 through 4-5. Include information on threatened lakes, i f available.
A discussion of State water quality standards as they apply to lakes. If water quality standards have not been established for lakes, the measure used to determine impairment or threatened status should be identified.

Fffects on Iakes 1314fa)ll)lD): 3141a)fl)(F11 -- Tables 4-9 and 4-14
. The number of lakes and lake acres that have been assessed for high acidity. If information is available, discuss the nature and extent of toxic substances mobilization (release from sediment to water) as a result of high acidity. Table 4-9 shows one way to present this information.
The number of lakes and lake acres affected by high acidity, Indicate the measure (pH, acid-neutralizing capacity ) used to determine acidic
, condition and the level at which the State defines "affected."
A discussion of the specific sources of acidity, with estimates of the number of affected lake acres attributed to each source of acidity. Table 4-10 shows one way to present the information. WBS will generate Tables 4-9 and 4-10 if the required data are entered (see WBS User's Guide).
A description of the methods and procedures used to mitigate the harmful effects of high acidity, including innovative methods of neutralizing and restoring the buffering capacity of lakes and methods of removing from lakes toxic metals and other toxic substances mobilized by high acidity.
Table 4-9. Acid Effects on Lakes
Table 4-10. Sources of High Acidity in Lakes
Acreage of Lakes Impacted
Source
Acid Deposition
Acid Mine Drainage
Natural Sources
Number of Lakes Impacted

I Other (list) I I NOTE: See Section 1.7 of the GuidelinesSupplement for description of natural sources.
IpXic Fffects on I&s 1314(a)(l)fFI 314fa)(l)fF)l--
If not provided in Public HealthIAquatic Life Concerns chapter (Chapter 7), the number of lakes and number of lake acres monitored for toxicants and those with elevated levels of toxic pollutants.
A discussion of the sources of toxic pollutants in lakes, with estimates of the number of affected lake acres attributed to each source of toxic pollutants.
Trends in Iake Water Oualitv 1314(a)fINF)1 -- Table 4-11
A general discussion of apparent lake water quality trends. Include the total number of lakes and lake acres in each trend category (improved. degraded, stable or unknown). Table 4-11 shows EPA's preferred way to present this information.
A discussion of how apparent trends were determined (e.g., changes in use support status, statistical trend analysis of water quality parameters). Indicate the time frame of analysis. If sufficient data are available, States should report on trends in trophic status, trends in toxic pollutants or their effects, and trends in acidity or its effects. For a lake, t h e w in trophic status may be more important than the trophic status itself.
Note: Technical guidance for analyzing trends is available-Statistical Methods for the Analysis o f Lake Water Quality Trends, EPA 841-R-93-003 (U.S. EPA 1993). Contact the Watershed Branch at (202) 260-7107 for a copy.
Table 4-11. Trends in Significant Public Lakes
Acreage of Lakes
Assessed for Trends
lmprovinq
Stable
Dearadinq
Number of Lakes

Chapter Six: Estuary and Coastal Assessment
Summa? Statfstlcs I. . includina Great Lakes shoreline)
States should report summary statistics for use support and causes and sources of impairment in estuaries. coastal waters, and the Great Lakes. The format should be similar to Tables 4-2 through 4-5 for all estuaries in the State. The reporting unit for estuaries in these tables is square miles. Similarly, separate tables should be prepared for coastal waters and the Great Lakes using shoreline miles as the size unit. WBS includes a Great Lakes waterbody category with size units of (shoreline) miles. For Great Lakes embayments, States may use the "estuary" waterbody category if they wish to report impacts in areal units (square miles).
As part of the national initiative to increase understanding of estuarine and near-coastal waters and the Great Lakes and to better direct pollution control efforts in these waters. EPA asks the States to provide information on five overall topics: eutrophication, habitat modification including riparian and shoreline conditions such as erosion, changes in living resources, toxic contamination, and pathogen contamination.
All States are asked to collect and provide coastal, estuary, and Great Lakes information as appropriate. Although EPA understands that these data may not be readily available in every coastal State, efforts to produce this information will result in a broader understanding of our coastal and estuarine resources. Those areas for which no data are currently available should be clearly identified by the States. Also, States are encouraged to discuss their methods for collecting the information and how these methods may limit use of the data.
In this chapter (Chapter 6).States should report further information on estuaries, coastal waters, and Great Lakes including:
A case study from at least one estuarylcoastal/Great Lakes area. States are encouraged to describe problems and challenges, notjust "success stories."
Information on eutrophication including:
- occurrence, extent, and severity of hypoxia and anoxia (low or complete absence of dissolved oxygen);

- occurrence, extent, and severity of algal blooms possibly related to pollution; and
- estimated nutrient loadings broken out by point sources, combined sewer overflows, and nonpoint sources.
lnformation on projected land use changes and their potential impact on water quality, habitat, and living resources.
lnformation on habitat modification including the status and trends in acreage of submerged aquatic vegetation; acreage of tidal wetlands: miles of diked, bulkheaded, or stabilized shoreline: extent of riparian and shoreline conditions (e.g., erosion); and dredging operations.
lnformation on changes in living resources including discussion of any increases or decreases in the abundance or distribution of species dependent on estuarine, near coastal, or Great Lakes waters; changes in species diversity over time; presence and extent of exotic or nuisance species; and changes in the amount of catch. Wherever possible, these changes should be discussed in terms of their causes (water quality versus changes in fishing regulations, overuse of resources, etc.).
€PA encourages States to include GIs and other maps illustrating the above information.
EPA and NOAA are paying special attention to coastal issues. Any data acquired through these agencies' coastal initiatives should be included in the assessment. Data of particular interest include data collected under the National Coastal Monitoring Act of 1992, which establishes the basis for a comprehensive national monitoring program for coastal ecosystems. In addition, the State should discuss its activities, if any, under EPA's Great Lakes Program, the National Estuary Program, the Near Coastal Water Pilot Projects, the Chesapeake Bay Program, the Gulf of Mexico Program, the Mid-Atlantic Bight and New York Bight programs and the CZARA Section 6217 nonpoint source control program. Any additional State programs, research activities, or new initiatives in estuarine or coastal waters or the Great Lakes should be discussed in this chapter. lnformation on coastal (tidal, estuarine) or Great Lakes wetlands should be reported in Chapter 7: Wetlands Assessment.
Chapter Seven: Wetlands Assessment
Protecting the quantity and quality of the Nation's wetland resources is a high priority at EPA, other Federal agencies, and many State and local

governments. The Administration Wetlands Plan calls for a no overall net loss in the short term and a net increase in the quantity and quality of our Nation's wetlands in the lona term. Achievina this reauires regulatory and nonregulatory and a par&ership df Federal, State, and local governments and private citizens.
Wetlands, as waters of the United States, receive full protection under the Clean Water Act including water quality standards under Section 303 and monitoring under Section 305(b). At present, wetland monitoring programs are in their infancy (see 1994 National Water Quality Inventory Report to Congress) and no State is operating a statewide wetland monitoring program. For this reason, it is important that States in their 305(b) reports describe their efforts to wetland monitoring programs or to iotearatewetlands into existing surface water monitoring programs.
In addition, States should report on their efforts to achieve the no overall net loss goal for wetland function and acreage. Ideally, this report should serve as a planninglmanagement tool to prioritize program work and areas needing information and technical assistance. States are encouraged to make recommendations to EPA on tools that are needed to make the Administration goals a reality. EPA requests that Tribes report on wetlands to the extent practicable.
Previously reported information should be updated where applicable. States should report on coastal (i.e., tidal, estuarine, or Great Lakes) wetlands in this section of their report rather than in Chapter 6 (Estuary and Coastal Assessment).
States that wish to do so may report separately on riparian areas that are notjurisdictional wetlands. Riparian areas are essential components of riverine ecosystems. In the western United States, wetlands are sparse and riparian habitat is often the only suitable habitat for many animals and plant species. Riparian areas are also important for their ability to remove pollutants.
Section 305(b) staff are encouraged to coordinate closely with other relevant State agencies such as fish and wildlife departments to respond to the reporting guidelines below. To the extent possible, States are encouraged to geographically or spatially represent the information (e.g., report information by watershed unit and include maps).
Develo~mentof Wetland Water Quality S t a n d m
In July 1990, EPA published guidance on the level of achievement expected of States by the end of FYI993 in the development of wetland

4. 1998 305(b) CONTENTS -PART Ill: SURFACE WATER ASSESSMENT
water quality standards. Although most States have incorporated wetlands into their definition of State waters, currently only a few States have developed comprehensive wetland-specific standards. Water quality standards for wetlands are necessary to ensure that, under the provisions of the Clean Water Act, wetlands are afforded the same level of protection as other waters. Development of wetlands water quality standards provides a regulatory basis for a variety of water quality management activities including, but not limited to, monitoring and assessment under Section 305(b), permitting under Sections 402 and 404, water quality certification under Section 401, and control of nonpoint source pollution under Section 319. In the 1994 305(b) reports, almost all States reported on their efforts to develop wetlands water quality standards. To date, over 27 States have received wetland protection grants to develop wetland-specific water quality standards. By the end of FY99, EPA expects all States to designate specific beneficial uses and adopt narrative criteria for their wetlands.
Table 4-12 is a guide for presenting tabular information on development of State wetland water quality standards.
To supplement the information in Table 4-12, States should list designated uses for wetlands. In addition States should
Briefly describe State efforts to develop narrative and numeric biological criteria. Provide examples where appropriate.
Briefly describe classification of wetlands in your State antidegradation policy. Provide an example of how State antidegradation policies are used to protect critical wetlands.
Table 4-12. Development of State Wetland Water Quality Standards

NOTE: This table merely clarifies reporting requirements contained in earlier versions of this guidance. This table is not a new reporting requirement.
. Briefly describe efforts to integrate wetland protection through 401 certification and wetlands water quality standards with the NPDES stormwater program. Specifically, relate any criteria used in evaluating stormwater impacts to wetlands.
m a r i t v of Wetland Resources
The development of wetland biological assessment methods is a growing area of emphasis for EPA, States, and Tribes. Development of monitoring methods and initiation of pilot monitoring programs are among the priorities for the Wetlands Protection Grants Program.
States should discuss their efforts (including current research) to develop programs to monitor the biological, physical, and chemical integrity of wetlands and to integrate wetlands into existing surface water monitoring programs. States should include information on the scope and comprehensiveness of the program (e.g., geographic coverage), types of monitoring (e.g., biological, chemical, physical), and how use support decisions are made. States should also discuss efforts to conduct wetland functional assessments (e.g., Hydrogeomorphic Approach IHGMI).
EPA has recently established a workgroup of States, Federal agencies, and academics to improve wetland biological assessment methods and programs. Because of these EPA has set a 1999 performance measure for the Government Performance and Results Act ~GPRA)o f 15 StatesITribes developing tools and programs to assess and monitor overall wetland improvementldeterioration. EPA encourages States to report on specific monitoring methods and criteria either already in effect or under development. Biological monitoring is critical for States to continue to refine their designated uses to more adequately reflect and protect existing wetland conditions.
EPA encourages States to report on the attainment of designated uses in their wetlands. To the extent possible, complete Tables 4-3, 4-4. and 4-5 (designated use support, causeslstressors and sources of impairment. including nonpoint sources) for wetlands and present in this chapter. Please note your State's methodology for evaluation (as they currently vary by State) including source of data (e.g., Section 404 permit information, onsite monitoring, or satellite or aerial photography interpretation). In their 1994 305(b) reports, 13 States reported on sources of wetland loss, 12 reported on causes and sources degrading wetlands, and 8 States reported on designated use support in some portion of their wetlands.

States should also report on wetland monitoring programs by volunteers and whether they are working to be able to use this information in the 305(b) report. Rhode Island Sea Grant and EPAjointly issued in January 1994 a national directory of volunteer monitoring programs, many of which have wetland components (Rhode Island Sea Grant. 1994). States can obtain a copy from the EPA Assessment and Watershed Protection Division. Monitorina Branch. (202) 260-701 8. EPA is com~ilina an annotated bibliography of voiuntier monitoring manuals whicK is available through our Web site at http://www.epa.gov/owow/wetlands.
Fxtent of Wetland Resources
States should describe any assessments of wetland acreage changes over time (by wetland type if that information is available). This description should include efforts to attain no overall net loss or target priority restoration sites (e.g., through tracking Section 401 certification of Section 404 permits; current or planned inventory programs such as U.S. Fish and Wildlife Service National Wetlands Inventory or State inventory programs; use of geographic information systems (GISs); or comparison of predevelopment inventories with more current wetland information). States are encouraged to provide information on wetland types and their historical, most recent, and second most recent acreages (specify when available). Table 4-1 3 is provided as a guide for formatting information; see also the example tables from Wisconsin's 1994 305(b) report in Appendix N of the Guidelines Supplement. Define wetland types using the Cowardin classification system currently the Federal standard for wetland classification (Cowardin et al., 1979; FWSIOBS- 79/31). If another classification system is used, please identify the system. Also, list sources of information and discuss reasons for acreage change, where known. EPA encourages States to include maps of significant wetlands i f this information is available and to describe current or planned inventory programs for their wetland resources.
Potential sources of information include the U.S. Fish and Wildlife Service National Wetlands Inventory, the State fish and game department, and the State parks and recreation agency (wetlands are to be included in State Outdoor Recreation Plans).
Additional Wetland Protection Act iv i t ie~
This section is designed to update readers on State wetland protection activities and provide States with an opportunity to exchange information on achievements and obstacles in protecting their wetland resources. Discussions need not be extensive or detailed but should:

Table 4-13.' Extent of Wetlands, by Type
Sources of l~forrnation:
1 (include date of inventory) 2 3 (include date of inventory)
a Use Cowardin et al. (1979)--Classification o f Wetlands and DeepwaterHabitats of the United States, Fish and Wildlife Report FWSIOBS-79131--or report classification system used.
Describe efforts to integrate wetlands into the watershed protection or basinwide approach. Describe county-level programs to integrate wetlands into local planning.
Briefly describe particularly noteworthy State activities, past and present, funded through the Section 104(b)(3) Wetland Grant Program.
Briefly describe the most effective mechanism or innovative approach used in protecting wetlands (such as Outstanding Resource Waters, State Wetland Conservation Plan, watershed or local planning, State Program General Permits under Section 404. Section 401 certification and wetland water quality standards). Note if these are being partially supported by the 104(b)(3) State Wetland Grant Program.
Briefly describe agency responsibilities for wetland protection and coordination between the water quality agency and other natural resource agencies.

Please discuss any challenges your State is facing in developing wetland monitoring programs and any recommendations you have for EPA.
Appendix N of the Guidelines Supplement includes wetland information from previous 305(b) reporting as an example for States to generate ideas for reporting on and developing wetland monitoring programs.
Chapter Eight: Public HealthlAquatic Life Concerns
In this chapter, States report on selected public healthlaquatic life concerns. The 305(b) Consistency Workgroup recommended that Tables 4-1 4 through 4-1 8 in this chapter be optional for 1996 and beyond. Tables 4-1 4 and 4-1 6 are not useful for national compilations because this could lead to erroneous conclusions. For example, some States only store data for the last column of Table 4-1 4, which can lead to the appearance that a high percentage of monitored waters show elevated toxics. Fish kills (Table 4-16) are difficult for some State 305(b) programs to track, causes and sources of fishkills are often unknown, and summary statistics are not useful above the State level. Both of these tables may contain useful information for an individual State, however. For these reasons, these tables are optional for State 305(b) reporting. EPA will not use fishkill data in the Report to Congress.
Table 4-15 contains information that is available through other EPA national listings and therefore is optional for 305(b) reporting. EPA will use the national listings in preparing the 305(b) Reports to Congress. Nonetheless, a State may choose to include its own information for the public's benefit and to supplement national data.
EPA will provide its national listings to States to support the preparation of Table 4-1 7; however, this table is optional for 305(b). Table 4-18 is optional because EPA will obtain summary data for the Report to Congress from NOAA. States are asked to provide Table 4-19 because it contains important information not available elsewhere.
Size of Waters Affected bv Toxicant5
Using the format in Table 4-1 4, States may take the option to report on the extent of toxicant-caused problems in each waterbody type. However, EPA will not use this data in the Report to Congress. WBS can generate the totals needed for this table from waterbody-specific information. Each State defines "elevated levels of toxicants." which can include exceedances of numeric State water quality standards, 304(a) criteria, and/or Food and Drug Administration (FDA) action levels or levels

of concern (where numeric criteria do not exist). Elevated levels of toxicants may occur in the water

Table 4-14. Total Size Affected by Toxicants (optional)
Note: Optional-States may choose to present this table for use at the State level, but EPA will not aggregate this information to the national level in the Report to Congress.
WBS Users-To generate the totals needed for Table 4-1 4 from the WBS, the Monitored for Toxics field in WBS must be entered as "yes" for each appropriate waterbody.
Totals for the last column in Table 4-1 4 can be generated from waterbody- specific information in the WBS if total size affected by toxicants is stored for each waterbody using Cause Code 2400 ("Total Toxicants"). For example, assume a waterbody is 10 miles in size, with 4 miles impacted by metals and 3 miles impacted by pesticides. However, the total portion of the waterbody that is impacted by toxicants may be only 5 miles (because some miles have metals and pesticides). In WBS, 5 miles must be entered under Code 2400: Total Toxicants for WBS to accurately calculate Statewide Summaries for Table 4-14:
Code 2400: Total Toxicants 5 miles (must enter in WBS even if 0200, 0500 entered also) Code 0200: Pesticides 3 miles Code 0500: Metals 4 miles
Refer also to the WBS Users Guide.
Any of the following codes can be considered toxicants: 0200 (pesticides). 0300 (priority organics), 0500 (metals). 0600 (ammonia, un-ionized), and 0700 (chlorine).
-


4. 1998 305(b) CONTENTS -PART Ill: SURFACE WATER ASSESSMENT
column, in fish tissue, or in sediments. As a means of providing perspective, States should discuss which toxic pollutants have been monitored for and include a list of those toxic pollutants for which the State has adopted numeric criteria.
EPA has developed a Listing of Fish and Wildlife Consumption Advisories to encourage information exchange among (and within) States. For 1997, EPA and the States are updating the Listing to include all known advisories as of December 1996. EPA will provide the Listing to State 305'(b) Coordinators in 1997. The Listing program includes electronic mapping capabilities. Annual updates are planned. Contact the EPA Office of Science and Technology (OST) at (202) 260-1305 for more information.
EPA has also developed a national database o f sediment contamination by toxics, the National Sediment Inventory. EPA will also provide this listing to 305(b) Coordinators for use in preparing Table 4-17. A summary report is currently under review (EPA-823-D-96-003). Contact EPAIOST at (202) 260-5388 for more information.
EPA will obtain information on fish consumption advisories and sediment contamination from EPA's national databases. EPA will then provide the results to the States approximately six months prior to the due date for the State 305(b) reports. States may choose to provide their own listings of fish consumption advisories and sediment-contaminated waters i f they are concerned that the national-level data may not be sufficiently current or accurate.
If the State 305(b) agency collects the following types of information for management purposes, reporting it in the 305(b) report will enhance the value of the report to the public and EPA. Note that several of the following types of information are optional for State 305(b) reports because EPA will obtain data from other sources (see Tables 4-15 through 4-19)
Fishing or shellfishing advisories currently in effect
Pollution-caused fish killslabnormalities; States may choose to distinguish recurring fish kills from other pollution-caused fish kills occurring during the reporting period (clearly identify approach used)
Sites of known sediment contamination

Shellfish restrictionslclosurescurrently in effect
Restrictions on surface drinking water supplies (see next section)
Restrictions on bathing areas during this reporting cycle
Incidents of waterborne disease during this reporting cycle
Other aquatic life impacts of pollutants and stressors (e.g., reproductive interference, threatened or endangered species impacts).
WBS Users-WBS offers two options for preparingTables 4-15 through 4-19. First. WBS contains a stand-alone module that exists mainly to preparethese particular tables. Second, WBS also contains Aquatic Contamination Codes in the main WBS assessment screens that users may assign to a waterbody. By entering these codes, WBS users can perform a wide'variety of queries and generate lists of waterbodies that can be used to prepare Tables 4-15 through 4-19. The WBS Aquatic ContaminationCodes are: m,1 = Fish/shellfish tissue contaminationabove FDAlNASllevels of concern 2 = Fishlshellfish advisory in effect
2a = Restricted consumption advisory for subpopulation 2b = Restricted consumptionadvisory, general population 2c = "No consumption" advisory for a subpopulation 2d = "No consumption" advisory or ban, general population 2e = Commercial fishing ban
3 = Bathing area closure, occurred during reporting period 4 = Pollution-relatedfish abnormality observed during reporting period 5 = Shellfish advisory due to pathogens, currently in effect 6 = Pollution-causedfish kill, occurred during reporting period 7 = Sediment contamination 8 = Surface drinking water supply closure, occurred during reporting period 9 = Surface drinking water supply advisory, occurred during reporting period 10 = Waterborne disease incident, occurred Uuring reporting period.
See the WBS User's Guide or contact WBS User Support (page ii) for more information.

Table 4-15. Waterbodies Affected by Fish and Shellfisha Consumption Restrictions Due To Toxicants (optionag
Does not include shellfish harvesting restrictions due to pathogens. See Table 4-18,
Optlonal because much of this information is available in EPA's Listing of Fish and Wildlife Consumption Advisorles, which is available to 305(b) Coordinators; contact EPAlOST at (202) 260-1305. Optlonal because EPA will use the Listing in the Report to Congress, not this table.
Table 4-16. Waterbodies Affected by Fish Kills and Fish Abnormalities (optional?
a Optional because some States do not compile this information and summary statistics are not useful above the State level. States may choose to present this table for use at the State level, but EPA will not aggregate this information to the national level in the Report to Congress.

Table 4-17. Waterbodies Affected by Sediment Contaminationa (optional)
Name o f Waterhody and ldentlflcation Waterbod size Causes(s) (Poliutant[sl) of No. or Reach y T y p Affected Concern Source(s) of Pollutant(s)
NO.
-
Note: EPA's National Sediment lnventory contains supporting information for this table, inventory results are available to 305(b) Coordinators; contact EPAIOST at (202) 260-5388. Optional because EVA will use the National Sediment Inventory in the Report t o Congress, not this table.
Table 4-18. Waterbodies Affected by Shellfish Advisories due to Pathogens (optional)
Name of Waterbody and Identification Waterbod Size No. or Reach y ~ y p Affected Sources of Pathogens andlar Indicators'
NO.
-
-
Indicators include, but are not limited to. fecal coliforms and E. coli Optional because €PA will use data from NOAA's National Shellfish Sanitation Program in the Report to Congress.
Table 4-19. Waterbodies Affected by Bathing Area Closures
4. 1998 305(b) CONTENTS -PART Ill: SURFACE WATER ASSESSMENT
Pollutants include, but are not limited to, medical waste, fecal coliforms. E. coli, enterococcl, and other indicators of pathogenic contamination.
Public Water SupplyIDrinking Water Use Reporting
One of the findings of the last two 305(b) reporting cycles is the relatively low percentage o f waters that have been assessed for drinking water designated use nationwide. €PA strongly encourages States to focus resources on increasing the percentage of waters assessed for this use and at the same time enhancing the accuracy and usefulness of these assessments. This goal is consistent with EPA's source water protection initiative under the 1996 Amendments to the Safe Drinking Water Act. States are encouraged to use source water assessments to delineate watershed areas (source water protection areas) for all public water systems and thereby increase the assessment of source waters for drinking water use. The States also are encouraged to use this information from the source water assessments in their 305(b) reports.
€PA and the 305(b) Drinking Water Focus Group (DWFG) developed Tables 4-20 through 4-22 for reporting information related to drinking water use support. States are requested to complete these tables to provide statewide estimates of the total waterbody areas that support drinking water use, are fully supporting but threatened for drinking water use, partially support drinking water use, do not support drinking water use, and are unassessed.
EPA asks that States be aware of the potential to overstate the degree to which source waters support drinking water use. Caution should be taken in assuming that a waterbody is fully supporting drinking water use due to the absence of an MCL violation. Furthermore, a source water should not be characterized as meeting drinking water use i f that water has never been assessed. Both of these circumstances are misleading and overstate the degree to which source waters support drinking water use.
For source waters that are characterized as "fully supporting," €PA and the DWFG encourage States to specify the contaminants or groups of contaminants evaluated during the assessment. A list of the contaminants used in the assessment should be included in the 305(b) report.
For source waters that are characterized as "threatened," "partially supporting," or "nonsupporting," States are encouraged to specify the contaminants or groups of contaminants causing the impairment (e.g.,

4. 1998 305(b) CONTENTS -PART Ill: SURFACE WATER ASSESSMENT
source water quality is characterized as "partially supporting" drinking water use due to the detection of agricultural chemicals). EPA acknowledges that specifying the specific contaminants causing an impairment may be burdensome to many States; however, States are still encouraged to provide this information as it will enable EPA to more accurately assess national water quality and potential threats. EPA and the DWFG developed Table 7-20 to assist States in reporting this information.
States are asked to use Table 4-20 to list the waterbodies assessed for drinking water designated use support. For each of the assessed waterbodies. States are asked to specifv the contaminants included in the assessment. A brief discussion of <he rationale used to finalize the list of contaminants along with some qualification as to why certain other contaminants werenot used in the assessment should also be included in the 305(b) report.
the methodology used to perform the assessment(s),
the level of detail incorporated into each assessment, and
the rationale used to select and finalize the list of contaminants used in the assessment(s).
States are asked to use Tables 4-21 and 4-22 to indicate the total miles of rivers and streams and acres of lakes and reservoirs designated for drinking water use. For the miles andlor acres of water designated for drinking water use, States are asked to indicate the total areas that have been assessed. For these assessed areas, States are requested to use Tables 4-21 and 4-22 to report the miles andlor acres categorized according to each of the use support classifications and to calculate the percentage of waters in each category. Most of this information can be derived from Table 4-3 (Individual Use Support Summary). The primary difference between Tables 4-21 and 4-22 and Table 4-3 is that States are asked to list the major contaminants contributing to impairment in Tables 4-21 and 4-22. For waterbodies that are categorized as "fully supporting," States should list all the contaminants considered in the assessment.

4. 1998 305(b) CONTENTS -PART Ill: SURFACE WATER ASSESSMENT
I f States choose to use public water supply compliance monitoring data in these assessments, it is important to recognize that these data are collected and managed by State agencies having authority under the Safe Drinking Water Act. The use of these data in assessing source waters for drinking water use support within the 305(b) program necessitates communication and cooperation across State agency boundaries. EPA and the DWFG recognize and acknowledge the difficulties inherent in obtaining and using these data without the benefit of the drinking water staff's experience and expertise. €PA and the DWFG recommend that State 305(b) Coordinators facilitate a working relationship between the State drinking water and Clean Water Act program staff to provide the most accurate and representative assessment of source waters based on finished water quality data.
Table 4-20. Summary of Contaminants Used in the Assessment
BContaminants may be either listed individually, or reported as contaminant groups (e.g., pesticides, metals, semivolatile organic compounds, etc.)

Table 4-21. Summary of Drinking Water Use Assessments for Rivers and Streams
Total Miles Designated for Drinking Water Use
Total M i i s Assessed for Drinking Water Use
Miles Fully Supporting % Fully Supporting Contaminants Drinking Water Use Drinking Water Use
Miles Fully Supporting O/. Fully Supporting but but Threatened For Threatened for Drinking Drinking Water Use Water Use
Miles Partially Supporting % Partially Supporting Drinking Water Use Drinking Water Use
Miles Not Supporting % Not Supporting Drinking Water Use Drinking Water Use
Table 4-22. Summary of Drinking Water Use Assessments for Lakes and Reservoirs
Total Waterbody Area Designated for Drinking Water Use

Type of Waterbody:
Table 4-3. Individual Use Support Summary
Rivers and Streams
Protect &
Enhame
Enhance
Public Health
Economic
tJ I-' U) I-' U)
a These goals are part of the national water quality goals adopted by the EPA Oftice of Water and the ITFM in their Environmental Goals and Indicators effort.
b Drinking water use support is also summarized in greater detail in Tables 4-20 and 4-22.
In order for EPA to summarize data from over 56 305(b) reports, please leave no blanks in this table. Instead use the following conventions:
asterisk (*) = category not applicable dash (-) = category applicable no data available zero (0) = category applicable. but size of waters in the category is zero.


SECTION 5
305(b) CONTENTS -PART IV: GROUND WATER ASSESSMENT
Section 106(e) of the Clean Water Act requests that each State monitor the quality of its ground water resources and report the status to Congress every two years in its State 305(b) report. To provide guidance in preparing the 305(b) reports, EPA worked with States to develop a comprehensive approach to assess ground water quality that takes into account the complex spatial variations in aquifer systems, the differing levels of sophistication among State programs, and the expense of collecting ambient ground water data. This approach incorporates all of the components requested during previous 305(b) reporting periods.
Using guidelines established by EPA, early State 305(b) reports presented an overview of the State resource manager's perspective on ground-water quality based on monitoring of known or suspected contamination sites and on finished-water quality data from public water supply systems (PWS). These data did not always provide a complete and accurate representation of ambient ground water quality (i.e., background or baseline water quality conditions of an aquifer or hydrogeologic setting). Neither did these data provide an indication of the extent and severity of ground water contaminant problems. Finally, the broad-brushed approach used in past 305(b) reports to define ground water quality for the entire State did not allow States to develop and report more detailed results for locations of greatest ground water use and vulnerability.
In the 1996 Guidelines. EPA encouraged States to assess ground water quality for selected aquifers or hydrogeologic settings within the State or portions of aquifers or hydrogeologic settings that reflect State ground water management priorities. The assessment of ground water quality within specific aquifers or hydrogeologic units provided for a more meaningful interpretation of ground water quality within the State. I t also enabled States to report results for locations of special interest.
Using the 1996 Guidelines, States achieved improved reporting on ground water quality within the 305(b) program. Several States noted that the 1996 Guidelines provided incentive to modify their ground water programs to enhance their ability to provide more accurate and
5-1

5. 305(b) CONTENTS -PART IV: GROUND WATER ASSESSMENT
representative information. Recognizing this progress, EPA is working with States to maintain the established continuity and momentum in assessing the quality of our Nation's ground water. As part of this effort, EPA is continuing to request that States assess ground water quality for selected aquifers or hydrogeologic settings.
EPA recognizes that assessment of the entire State's ground water resources on an aquifer-specific basis is a monumental task. To ease the burden, EPA suggested in the 1996 Guidelines that ground water quality be assessed within selected aquifers andlor hydrogeologic settings incrementally over a period of ten years. For 1998, States are encouraged to set a priority for reporting results for areas of greatest ground water demand and vulnerability. If States so choose, they may focus their beginning assessments to well-defined areas such as wellhead protection areas. States are encouraged to provide short narratives describing how aquifers or hydrogeologic settings were selected for assessment. States will be encouraged to expand their ground water assessment efforts to include additional aquifers andlor hydrogeologic settings each subsequent reporting period. In this way, an increasingly greater area of the State will be assessed. EPA encourages States to set a goal of fully assessing ground water quality within most of the State (approximately 75 percent of the State) by the year 2006.
EPA recognizes that data collection and organization varies among the States, and that a single data source for assessing ground water quality does not exist for purposes of the 1998 305(b) reports. EPA encourages States to use available data that they believe best reflect the quality of the resource. However, for most States to obtain the data generally required to provide an accurate and representative assessment of ground water quality cooperation between multiple State agencies may be necessary. Although EPA recognizes and acknowledges the difficulty in obtaining data across agency boundaries, coordination in data collection and management efforts between State agencies is in most cases highly important. EPA encourages State water protection programs to begin coordination of data collection and management efforts for ease of reporting, to provide an opportunity for greater quality control, and to reduce inconsistencies in reported data.
States may choose to use one or multiple sources of data in the assessment of ground water quality. Several potential data sources have been identified, including:
Ambient water quality data from dedicated monitoring well networks

Untreated or finished water quality data from ground-water-based public water supply wells,
Untreated or finished water quality data from private or unregulated wells.
In the absence of a dedicated ground water monitoring network, States may choose to use data collected from Public Water Supply Systems (PWSs) in the assessment of ground water quality. These data are routinely collected by the States under the Safe Drinking Water Act and would not necessitate a separate and unique monitoring effort for purposes of the 1998 305(b) reporting process. Furthermore, drinking water criteria have been applied to the characterization of ground water in other areas of study, and national drinking water standards have been established and can be readily incorporated into the 305(b) framework providing a basis for national comparison. States that have access to other data sources that can be used to assess ground water quality are encouraged to use them if, in thejudgment of the ground water professionals, the data have undergone sufficient quality assurance/quality control checks.
In addition to introducing the assessment of ground water quality within selected aquifers or hydrogeologic settings in the 1996 Guidelines, EPA encouraged States to provide information on ground water-surface water interactions, thus reflecting the growing awareness of water resource managers on the importance of ground water-surface water interactions and their contribution to water quality problems. Recognizing that many of the problems related to ground water-surface water interactions are difficult to study and that limited data exist, EPA made reporting information on this subject optional for 1996. EPA will continue to request this information, but it will remain optional.
EPA and States represented on the 305(b) Ground Water Focus Group, which consists of interested State and EPA personnel, discussed the issues involved in revision of these Guidelines. In general, these guidelines present four Tables designed to direct States in reporting on the quality of their ground water resources. An overview of the most important sources of ground water contamination and the associated contaminants impacting ground water quality is requested along with a summary of the State's ground water protection efforts (Tables 5-1 and 5-2, respectively). Ground water quality of specific aquifers or hydrogeologic units as i t relates to contaminant sources and the occurrence of particular groups of contaminants is also requested (Tables 5-3 and 5-4, respectively).

5. 305(b) CONTENTS -PART IV: GROUND WATER ASSESSMENT -
All four of the Tables presented herein were requested in the 1996 Guidelines. The most significant change to these current guidelines is the re-ordering of the Tables into general and aquifer-specific categories and the deletion of a table that focused on ground water-surface water interactions with a request for a narrative rather than tabulated analytical data. As previously stated, reporting information on ground water-surface water interactions will remain optional for 1998. For Tables 5-1 through 5-4, States are encouraged to provide a short narrative explaining the methodology used to complete the tables as well as the data type and reporting interval used in the assessment.
EPA and the 305(b) Ground Water Focus Group recognize and fully accept that there will be significant variability in the information that States will be able to provide in the 1998 305(b) reporting cycle. However, EPA expects that the direction of future reporting cycles will be evident, and that States will begin to develop plans and mechanisms to compile, organize, and evaluate the requested information for future reporting cycles.
Overview of Ground Water Contamination Sources
In previous 305(b) reports, States were asked to identify the contaminant sources and contaminants impacting their ground water resources. EPA will continue to ask for this information in Table 5-1.
Table 5-1 requests information for contaminant sources within the State that are the greatest threat to ground water quality. EPA developed Table 5-1 as a guide to States in reporting the major sources of contamination that threaten their ground water resources. The contaminant sources presented in Table 5-1 are based on information provided by States during previous 305(b) reporting periods. Using this list, States are encouraged to check the ten highest-priority sources of ground water contamination. It is not necessary to individually rank the contaminant sources; however, the factors considered in selection should be included in the column provided. In addition, the major contaminants originating from each of the sources should be specified in the column provided. The list is not meant to be comprehensive and States are encouraged to identify additional sources that are unique to them or distinct from EPA's conventional use of terminology. States are encouraged to use the most detailed and reliable information available to them.
Table 5-1 should be included in State 305(b) reports. Instructions for completion of this table follow the table.

5. 305(t)) CONTENTS -PART IV: GROUND WATER ASSESSMENT

5. 305(b) CONTENTS -PART IV: GROUND WATER ASSESSMENT
Table 5-1. Major Sources of Ground Water Contamination
Contaminant Source Contaminants 13)

I 5. 305(b)CONTENTS -PART IV: GROUND WATER ASSESSMENT
Other sources (please specify) I I I /Notes for Table 5-1
1. Indicate by a check (a ) up to ten contaminant sources identified as highest priority in your state. Ranking is not necessary. Provide a narrative describing the methodoloqv used to complete this table and the justification for prioritization of the sources-indicated (e.g., professional judgement or actual data evaluation, etc.). If actual data are used, please describe the type of data used and the reporting interval.
2. Specify the factor(s) used to select each of the contaminant sources. Denote the following factors by their corresponding letter (A through I) and list in order o f importance. Describe any additional or special factors that are important within your State in the accompanying narrative.
A. Human health andlor environmental risk (toxicity) B. Size of the population at risk C. Location of the sources relative to drinking water sources D. Number andlor size of contaminant sources E. Hydrogeologic sensitivity F. State findinqs, other findings G. ~ocumentedfrom mandatory reporting H. Geographic distribution/occurrence I. other kiteria (please add or describe in the narrative)
3. List the contaminants/classes of contaminants considered to be associated with each of the sources that was checked. Contaminantslcontaminant classes should be selected based on data indicating that certain chemicals or classes of chemicals may be originating from an identified source. Denote contaminantslclasses of contaminants by their corresponding letter (A through M).
A. Inorganic pesticides B. Organic pesticides C. Halogenated solvents D. Petroleum compounds E. Nitrate F. Fluoride G. Salinitylbrine H. Metals I. Radionuclides J. Bacteria K. Protozoa L. Viruses M. Other (please add or describe in the narrative)
5. 305Ib) CONTENTS -PART IV: GROUND WATER ASSESSMENT

Overview of State Ground Water Protection Programs
In previous 305(b) reports, States were asked to provide a narrative description of ground water protection programs. This information provided an overview of the legislation. statutes, rules, andlor regulations that were in place. It also provided an indication of how comprehensive ground water protection activities were in the State. EPA requested this same information in a table format in 1996 to more uniformly summarize and characterize the information provided. EPA is continuing to request each State to complete and submit this information in tabular form. Table 5-2 was developed to assist States. Instructions for completing Table 5-2 follow the table.
States are also encouraged to provide a narrative describing significant new developments in State ground water protection efforts and the implementation status of their ground water protection programs and activities. The narrative may include changes that have occurred since the last 305(b) reporting cycle that States wish to highlight, such as development of an aquifer classification system, development of ground water standards to protect against land use practices, or improved coordination between State agencies. The narrative may also include a discussion of programs that warrant further development and implementation. Specifically, what are the problems associated with a given program, what solutions have been identified, and what, if any, impediments exist to implementing the solutions.
If desired, States may also consider using non-direct indicators to illustrate new developments in ground water protection programs. For example, States may detail changes in pesticide usage, landfill design and remediation, or underground storage tank practices that led to the elimination of potential ground water pollution threats, or improvement o f site conditions, or decreases in potential contaminant migration.
Each State is encouraged to provide examples of the successful application of the State's programs, regulations, or requirements; a description of a specific survey or major study; or some other activity that demonstrates the State's progress toward protecting the ground-water resources.

5. 305(b) CONTENTS -PART IV: GROUND WATER ASSESSMENT
Table 5-2. Summary of State Ground Water Protection Programs

Notes for Table 5-7
1. Place a check (a ) in the appropriate column of Table 5-2 for all applicable State programs and activities.
2. Briefly indicate the implementation status for each of the programs. Terms that may be used to describe implementation status are "not applicable," "under development," "under revision," "fully established." "pending," or "continuing efforts." States may wish to describe and further explain the implementation status of special programs or activities and the terms used in completing Table 5-2 in the accompanying narrative.
3. Indicate the State agency, bureau, or department responsible for. implementation and enforcement o f the program or activity. If multiple agencies are involved in the implementation and enforcement of a program or activity, provide the lead agency followed by an asterisk (*) to indicate involvement of multiple agencies.
4. In the accompanying narrative, include the number (andlor percentage) of community public water supply systems with source water protection programs in place, Include the population served by these systems, if the information is available. Also, identify the agency responsible for making assessment information available to the pubic.

Summary of Ground Water Contamination Sources
For the first time in 1996, EPA began requesting that States assess ground water quality for selected aquifers or hydrogeologic settings. EPA developed two tables (herein referred to as Tables 5-3 and 5-4) that provide States with a format for reporting this information. EPA is continuing to request that States complete these two tables to the degree that their resources permit.
EPA worked with States to develop Table 5-3 (Summary of Ground Water Contaminant Sources) as a means of assessing the stress on individual aquifers or hydrogeologic settings within the State. Specifically, States are encouraged to use Table 5-3 to report information on the type and number o f potential contaminant sources within the reporting area. If desired, Table 5-3 may also be used to indicate the status of actions being taken to address ground water contaminant problems. This latter information is optional and it is left up to the discretion of the State as to whether they want to report it.
Table 5-3 should be included in State 305(b) reports. Instructions follow the table. A short narrative describing the methodology used to complete this table should also be included.

See end of this file for Table 5-3
onslNotes for Table .5-3
1. Identify the aquifer and hydrogeologic setting by describing the unit in as much detail as necessary to distinguish it from other aquifers in the State. The description needs to be sufficient to enable tracking from one reporting period to another. Some potential descriptors to consider may be the name, location, lithology, and depth to the top and bottom of the aquifer. If desired, States may append a map illustrating the general location of the selected aquifer or hydrogeologic setting.
2. Indicate, i f desired, a spatial description of the aquifer or hydrogeologic setting that can be used to fix the general location of the aquifer or hydrogeologic setting on a map. States may opt to supply this information using whatever method is most appropriate. For example, States may choose to supply a rough map or longitudellatitude information. If States supply longitudellatitude information, they may present this information for the approximate middle of the aquifer or for four points around the aquifer such that the general two-dimensional location of the aquifer could be determined. They should use a good quality base map (such as a U.S. Geological Survey Quad Sheet) to obtain the longitudes and latitudes.
3. Indicate, i f desired, if the spatial information exists in a digital format and can be provided in map form. States are encouraged to provide maps, i f possible.
4. Record the reporting period. For purposes of this table, it is assumed that the data were collected over a single time frame. If this is not the case, please indicate in a note a t the bottom of the table the appropriate time frames for each data source.
5. Note that potential source types may include point sources as well as non-point sources. Potential non-point source types that States may consider include agricultural sites, septic systems, industrial contamination of unknown origin. andlor wastewater treatment plant discharges.
6. Indicate the total number of sites in each of the categories listed in Table 5-3. If the exact number of sites is not known, States are encouraged to estimate the numbers of sites. Note that in some cases, the information requested is optional and need not be entered.
7. Indicate the contaminants of concern that have impacted ground water quality. I t is not necessary to list every contaminant that has been detected. Instead, States are encouraged to list the contaminants of primary concern.

Summary of Ground Water Quality
EPA encouraqed States to provide a description of overall qround water quality in 305(b) reports. Due to the expense involved in collecting ambient ground water monitoring data, a comprehensive evaluation of the resource was not possible and States generally described ground water quality as ranging from "poor" to "excellent." Although these descriptors were based on best available information, they did not provide an accurate representation of ground water quality and it became evident that a series of indicator parameters were necessary to characterize spatial and temporal trends in ground water quality.
Ground water indicators have been under development for some time, with each succeeding 305(b) reporting period advancing development one step further. The 1994 305(b) reporting period focused on the use of maximum contaminant level (MCL) exceedances in ground-water-based or partial-ground-water supplied PWSs. The 1996 305(b) reporting period continued to use MCL exceedances in ground-water-based PWS, but also allowed the option to use other data that may be available to States. The data used in the assessment was combined with a spatial component (i.e., aquifer or hydrogeologic setting) to allow States to report information for locations of special interest (e.g., critical ground water usage, high vulnerability, or special case studies).
Beginning in 1996, States were encouraged to select specific aquifers or hydrogeologic settings for ground water assessment based on data availability and State-specific priorities. States were encouraged to review the types of monitoring data that were available (e.g., PWS, ambient and/or compliance monitoring data), how much data was available, the quality of the data (e.g., confirmed MCL exceedances), and whether the data could be correlated to a specific aquifer or hydrogeologic setting. If data could be correlated to specific aquifers or hydrogeologic settings, States were asked to consider giving priority to aquifers or hydrogeologic settings that support significant drinking water supplies and/or were sensitive to land use practices. If data could not be correlated to specific aquifers or hydrogeologic settings. States were asked to consider developing plans and mechanisms to report the information in future 305(b) reporting cycles. EPA recognized that reporting data for specific aquifers or hydrogeologic settings within States was new and that there would be significant variability in the information that States were able to provide in 1996. To ease the burden, EPA suggested that States assess ground water quality within specific aquifers or hydrogeologic settings with a goal of assessing

approximately 75 percent of the State during a ten-year period. For purposes of the 1998 305(b) report, EPA is encouraging States to continue to assess ground water quality for specific aquifers or hydrogeologic settings such that the goal is achieved by the year 2006.
As noted earlier, EPA recognizes that a single data source for assessing ground water quality does not exist and States are encouraged to use available data that they believe best reflects the quality of the resource. States may choose to use one or multiple sources of data in the assessment of ground water quality. Several potential data sources have been identified, including:
. Ambient water quality data from dedicated monitoring wells or networks (optional),
Untreated or finished water quality data from ground-water-based public water supply wells,
Untreated or finished water quality data from private or unregulated wells (optional).
The source water assessments required under the 1996 Amendments to the Safe Drinking Water Act should be a very important data source for assessing ground water quality. These assessments, as outlined in EPA's August 1997 guidance, require that States complete source water delineations and source inventorylsusceptibility analyses for the public water supplies in the State within two years after EPA approval of the program. These source water protection areas for ground-water based systems are synonymous with "Wellhead Protection Areas" as defined in Section 1428(3).
The exact source($ of data used by the States to assess ground water quality will depend upon data availability and the judgment of ground water professionals. In the absence of dedicated ground water monitoring wells or networks, States may consider using data collected from PWS as these data are routinely collected under SDWA and would not necessitate a separate and unique monitoring effort. If States have access to other data sources, they are encouraged to use whatever is appropriate. For example, monitoring data from ambient wells at regulated sites may also be used. States are encouraged to report any occurrences, including MCL exceedances, of the parameters in the classes or categories to obtain a more comprehensive understanding of groundwater quality and contamination.

Table 5-4 was developed as a guide to States to report ground water quality based on data collected from well networks. The primary basis for assessing ground water quality is the comparison of chemical concentrations in water collected from these wells to water quality standards. For purposes o f this comparison, EPA encourages States to use the maximum contaminant levels defined under SDWA. However, if State-specific water quality standards exist, and constituent concentrations are at least as stringent as the maximum contaminant levels defined under SDWA, State-specific water quality criteria may be used for assessment purposes. States are encouraged to append the State ambient water quality criteria used to assess ground water quality in their 305(b) reports.
Depending upon the results of the comparison, the data are summarized into four parameter groups and entered in one of the columns on Table 5-4 (more explicit instructions follow the table). These groups include volatile organic compounds (VOCs), semi-volatile organic compounds (SOCs), nitrates (NO,), and other constituents. Nitrate is emphasized because of its widespread use, persistence, and relatively high mobility in the environment. Pesticides may also be emphasized under SOCs i f a State so desires. Other constituents that States may wish to consider are the indicator parameters developed by the Intergovernmental Task Force for Monitoring Water Quality (ITFM) for monitoring in areas with different types of land uses and sources of contaminants (An Approach for a National Ground-Water Quality Monitoring Strategy, U.S.G.S., Open File Report, 1996).
The secondary basis for assessment is natural sensitivity of the aquifer and/or vulnerability to land-use practices.' This information may be reported when monitoring data are scarce or nitrate analyses are the only data available. Information that may be considered by ground water professionals may include known or suspected land-use practices that threaten ground water quality (e.g.. landfills, industrial facilities, pesticide applications), documented cases of ground water contamination, trends in the number of each cases, and actions being taken to address contamination. The exact information used and its interpretation is left to the judgment of the State ground water professionals.
The third basis for assessment is the additional information States may have available that relates to ground water quality. For example, the number of wells abandoned or deepened in response to ground water
'State definitions of vulnerability and sensitivity should be consistent with State Management Plans 1U.S. EPA. Assessment Prevention. Monitorino. and Resoonse Comoonents of State Manaaement Plans. ~ppendix5,Office of Prevention, Pesticides, ind Toxic 'Substance;. EPA 735 -~ -93 -005c , -~ebruar~ 1994)

contamination is an indication of the degradation of the resource. In addition, although wells with elevated concentrations of naturally- occurring constituents are not necessarily a reflection of the degradation of the resource, they are included in Table 5-4 because they are important to recognize and address as part of water quality planning.
It is important to note that Table 5-4 was developed by EPA and States to (1) provide guidance to States in assessing ground water quality, (2) promote consistency among States in reporting information on ground water quality, and (3) provide a means to compare results reported by States on a National basis. EPA recognizes ground water management priorities and practices vary among the States and that there will be significant variation in the information that States are able to provide in Table 5-4.
Review of the information provided using Table 5-4 for the 1996 reporting cycle indicated that this was indeed the case. Although the majority of States completed Table 5-4, a variety of styles were used to present the data. The variety of styles was attributed more to the deficiency of some types o f information rather than a States unwillingness to provide the information. Most frequently, information related to natural sensitivity or vulnerability to land-use practices and well closures/wells requiring special treatment were not provided. Most States provided information comparing analyte concentrations to water quality standards (MCLs). Depending upon State data availability, comparisons were made for individual samples, individual wells, or well networks. States reported information for counties, established ground water basins, hydrogeologic subareas, hydrogeologic regions, and Statewide areas. Another variation was reporting information for specific analytes or for groups of analytes.
EPA expected the variability seen in Table 5-4 and was encouraged at the progress made in 1996 in assessing ground water. EPA is continuing to use Table 5-4 to request information from States on an aquifer-specific basis. With time, i t is hoped that more and more States will be able to provide increasingly more accurate and representative assessments.
The columns in Table 5-4 were not assigned any type of use-support designation for purposes of the 1996 305(b) reporting cycle. Furthermore, the information supplied by States in 1996 were not used to assess the quality of the aquifer or hydrogeologic setting as a whole, but were used to assess the quality of ground water collected from a monitoring point within the designated aquifer or hydrogeologic setting. These same ideas will be followed in the 1998 305(b) reporting cycle.


See end of this file for Table 5-4

TABLE 5-4 (continued)

tionslNotes for Table 5-4
1, Identify the aquifer and hydrogeologic setting by describing the unit in as much detail as necessary to distinguish it from other aquifers in the State. The description needs to be sufficient to enable tracking from one reporting period to another. Some potential descriptors to consider may be the name, location, lithology, and depth to the top and bottom of the aquifer. If desired, States may append a map illustrating the general location of the aquifer or hydrogeologic setting selected for this assessment.
2. Indicate, i f desired, a spatial description of the aquifer or hydrogeologic setting that can be used to fix the general location of the aquifer or hydrogeologic setting on a map. States may opt to supply this information using whatever method is most appropriate. For example, States may choose to supply a rough map or longitudellatitude information. I f States supply longitudellatitude information, they may present this information for the approximate middle of the aquifer or for four points around the aquifer such that the general two- dimensional location of the aquifer could be determined. They should use a good quality base map (such as a U.S. Geological Survey Quad Sheet) to obtain the longitudes and latitudes.
3. Indicate, i f desired, i f the spatial information exists in a digital format and can be provided in map form. States are encouraged to provide maps, i f possible.
4. Record the reporting period. For purposes of this table, i t is assumed that the data was collected over a single timeframe. If this is not the case, please indicate in a note at the bottom of the table, the appropriate timeframe for each data source.
5. For the type of monitoring data being used (e.g., untreated or finished water quality data from public water supply wells), indicate the total number of wells considered in this assessment. If PWS data are used in the assessment, i t is important to note that constituents related to the operation and maintenance of PWS should not be considered in these assessments. Constituents should only be considered in Table 5-4 i f they are known to be representative of the source water.
6. Report the total number of wells for which anthropogenic constituents are not detected at concentrations above the method detection limits (MDLs) for which naturally-occurring constituents are consistent with background levels.
7. For wells that are located in either sensitive or vulnerable areas, report the total number for which anthropogenic constituents are not detected at concentrations above the method detection limits and for which naturally-occurring constituents are consistent with background levels.


Notes for Table 5-4 (continued)
8. Report the total number of wells for which nitrate concentrations range from background levels to less than or equal to 5 mglL, Indicate the total number of wells for which other anthropogenic constituents are not detected at concentrations above the method detection limits for which naturally-occurring constituents are consistent with background levels.
9, lndicate the number of wells that are located in either sensitive or vulnerable areas that have nitrate concentrations that typically range from background levels to less than or equal to 5 mgll. Also for wells that are located in either sensitive or vulnerable areas, indicate the number of wells, report the total number for which anthropogenic constituents are not detected at concentrations above the method detection limits a for which naturally-occurring constituents are consistent with background levels.
10. Report the total number of wells for which nitrate is detected at concentrations that range from greater than 5 to less than or equal to 10 mgll or for which anthropogenic constituents are detected at concentrations that exceed the method detection limits but are less than or equal to the MCLs.
1 1 . Report the total number of wells for which concentrations of anthropogenic constituents are confirmed one or more times at levels exceeding the MCL.
12. Report the total number of wells that have been either temporarily or permanently abandoned or removed from service or deepened due to ground water contamination.
13. Report the total number of wells requiring additional or special treatment (e.g.. Best Available Technologies, blending). Special treatments would include chlorination, fluoridation, aeration, iron removal, ion exchange and lime softening if these are necessary to remove contamination from the source water and IlQt caused by the treatment or distribution system itself.
14. Report the total number of wells that have concentrations of naturally-occurring constituents that exceed MCLs.
15. Pesticide compounds should be included under the category of SOCs.
16. Other parameters that States may consider include metals, total dissolved solids, odor, turbidity, or indicators as developed by the ITFM.
17. Check the major use(s) of water from the aquifer or hydrogeologic unit and the use(s) that have been affected by water quality problems.

Summary of Ground Water-Surface Water Interactions
Nationwide, many water quality problems may be caused by ground water-surface water interactions. Substantial evidence shows it is not uncommon for contaminated ground water to discharge to and contaminate surface water. In other cases, contaminated surface water is seeping into and contaminating ground water.
Reflecting the growing awareness of ground water-surface water interactions and their contribution to water quality problems, EPA is asking States to provide information that may be used to assess impacts to water quality. Of course, EPA recognizes that many of the problems related to ground water-surface water interactions are difficult to study, and as a result, limited information is available. As a consequence, reporting information on this subject is optional for 1998.
However, i f information is available. EPA asks States to report information on significant water quality problems resulting from ground water-surface water interactions.
States are encouraged to provide a narrative that describes the type and source of the contamination (e.g., land application of fertilizers, septic systems, salt-water intrusion, or animal waste-holding ponds); the primary land use in the vicinity of the source (e.g., agricultural, residential, industrial, undeveloped, etc); the aquifer(s) and surface water bodies impacted; the relative magnitude of the contamination (surface water versus ground water); a description of how the ground water-surface water interaction was determined; whether the contamination threatens drinking water availability or public health or is otherwise a source of concern; whether contamination is transitory or long-term; and any actions being taken to address the problem.
Conclusion
These Guidelines will assist States to fulfill the requirements of Section 106(e) of the Clean Water Act that requests that each State monitor the quality of its ground water resources and report the status to Congress in their State 305(b) reports. EPA worked with States represented on the 305(b) Ground Water Focus Group to develop this comprehensive approach to assessing ground water quality as applied on a national scale. The approach presented in these Guidelines is consistent with the approach taken in the previous 1996 reporting cycle.

Ground water quality will continue to be assessed in specific aquifers or hydrogeologic settings selected by States. The assessment will be based on a series of indicator parameters, including the type and number of contamination sites within the reporting area, concentrations of anthropogenic and naturally-occurring constituents in the ground water as compared to National or State water quality standards, and information on natural sensitivity and/or aquifer vulnerability to land-use practices. EPA will continue to request States to consider groundwater-surface water interactions and their effects on water management practices.
EPA recognizes that there will be significant variability in the degree to which States are able to respond to the data requests in these guidelines; however, it is hoped that as States develop plans and mechanisms to meet these data requests, reporting will become more uniform. In 2006 , it is hoped that ground water quality will be characterized in the majority of each State. As databases develop over time, trends in ground water quality in States, Regions, and in the Nation will be evaluated as part of the 305(b) process.